Results and forecasts on cosmic inflation from weak lensing
Abstract
We highlight the role of weak lensing measurements from current and upcoming stage-IV imaging surveys in the search for cosmic inflation, specifically in measuring the scalar spectral index . To do so, we combine the Dark Energy Survey 3 years of observation weak lensing and clustering data with Bicep/Keck, Planck and Sloan Digital Sky Survey data in CDM where is the tensor-to-scalar ratio. While there is no significant improvement in constraining power, we obtain a 1 shift on . Additionally, we forecast a weak lensing and clustering data vector from the 10-year Legacy Survey of Space and Time by the Vera C. Rubin Observatory and show its combination with current data would improve their constraints by 25 in CDM.
I Introduction
In the CDM model, scalar perturbations of the metric have been evolving since cosmic inflation, sourcing the large-scale structures in the recent Universe. Their primordial power spectrum follows:
| (1) |
with the amplitude of scalar pertubation, the wavenumber, the wavenumber at a pivot scale, set to 0.05 in this analysis, and the scalar spectral index.
The implications of Cosmic Microwave Background (CMB) measurements for inflationary search were introduced in knox1 ; knox2 ; cmb_inflation . And indeed, since then, one of the successes of the last generation of CMB experiments was measuring different from unity at high significance (8 in planck18_main ) thus excluding a scale-invariant primordial power spectrum, a key step towards establishing inflation. Now and over the coming decade, CMB polarization experiments aim at detecting large scale -modes to constrain the tensor-to-scalar ratio , the energy scale of inflation. Today, the Bicek/Keck experiment in combination with CMB Planck and baryonic acoustic oscillations (BAO) measurements from 6dFGS, MGS and BOSS DR12 data constrain to be below 0.036 at 95% confidence bk_18 . In the future, the Litebird satellite litebird , the Simons Observatory simonsobservatory and CMB-S4 cmbs4 ground-based experiments will aim at attaining .
In parallel, a new generation of photometric galaxy surveys will soon start mapping galaxies to further test the CDM model with the goal of understanding the origin of the current cosmic acceleration. On the ground, the Vera C. Rubin Observatory will produce the Legacy Survey of Space and Time (LSST) lsst_whitepaper ; lsst_srd , a 10-year imaging survey of half the celestial sphere, while the Euclid euclid_whitepaper and Roman roman_whitepaper satellites will image galaxies from space. One of their main objectives is to probe dark energy and modified gravity, through the evolution of the background and structures in the recent Universe through various observables desc_srd ; lsst_mg ; euclid_forecast ; roman_forecast . Weak gravitational lensing is especially promising as being one of the few unbiased probes of dark matter distribution and having been successfully used for precision cosmology with stage-III experiments desy3 ; hsc32pt ; kids1000 . Weak lensing is mostly sensitive to the energy density of matter and the variance of matter fluctuations , however with improved measurements from stage-IV surveys (as defined in stage4 ), weak lensing will become more sensitive to other properties of the matter power spectrum: in this paper, we investigate the role of weak lensing in inflationary search, especially through its sensitivity to the scalar spectral index . Weak lensing indeed brings complementary information from CMB, by accessing different modes, in the range /Mpc, compared to the range accessed by the CMB /Mpc. We note that in parallel, galaxy surveys will also aim at detecting primordial non-Gaussianities, through galaxy clustering as forecasted in fnl_forecast ; fnl_forecast_euclidska ; spherex , as well as through weak lensing fnl_shear and alignment of galaxies fnl_ia .
There are now a few indications that weak lensing could bring promising improvements on constraints. In Gatti_2020 , the second moment of the mass map from the Dark Energy Survey shows sensitivity to . Additionally, Prat_2023 ; Tan_2023 indicate significant constraints on with stage-IV surveys, although they are probably partly informed by prior choices. Weak lensing was also used in Chandra_2022 to determine the sensitivity of Euclid-like surveys in detecting specific features arising from inflation. Furthermore, Huang_2012 shows that future spectroscopic surveys such as Euclid will increase the constraints in the direction by close to a factor of 2 in CDM. However, this analysis did not consider weak lensing, so we complete the picture in the present paper by considering information from photometric surveys, specifically the Dark Energy Survey (DES) and the future LSST. To do so, we first infer cosmology in CDM and CDM using data from the DES 3 years of observation (DES Y3) and second, from our predicted 10-year LSST data vector. We describe both datasets in Sec. II.1 and detail the other likelihoods used as well as our parameter estimation approach in Sec. II.2. We show our results in CDM and CDM models in Sec. III. We finally conclude in Sec. IV with outlooks on weak lensing’s role in inflation search.
II Analysis
II.1 DES Y3 and predicted LSST Y10 weak lensing and clustering
To quantify weak lensing contributions to constraints on inflation, we choose to combine information from weak lensing and clustering in order to pin down systematics such as intrinsic alignment and galaxy bias as done in desy3 ; kids1000 ; hsc32pt . Their statistics are summarized in the form of three correlation functions in tomographic bins (referred to as 3x2pt): cosmic shear corresponding to the correlations of galaxy shapes, galaxy-galaxy lensing , the tangential shear of background galaxies around lens galaxies, and finally clustering corresponding to the correlation of lens galaxy positions. We use DES Y3 3x2pt along with the modeling choices and angular scale cuts used in DES Y3 cosmological analysis in desy3 . We tested that adding the DES Y3 shear ratio likelihood from desy3_sr did not change the results.
To forecast weak lensing from stage-IV surveys, we simulate a data vector from the 10 years of LSST (hereafter LSST Y10). For simplicity, in this case, we choose to use angular power spectra in harmonic space (with and either the convergence field or the density ) as our summary statistics. We closely follow the choices made in desc_srd which we will refer to as the SRD (the LSST-Dark Energy Survey Science Collaboration Science Requirement Document) with small changes for more realistic forecasts which we describe below.
Regarding LSST Y10 observations, we set the observed sky fraction used to create the source and lens samples to be 35 of the celestial sphere. The redshift distribution of both samples is described by a Smail distribution i.e.:
| (2) |
Parameters , and of this distribution along with the number of redshift bins, effective number density and shape noise are summarized in Table 1, following the SRD.
| Parameters | Source sample | Lens sample |
|---|---|---|
| 2 | 2 | |
| 0.11 | 0.28 | |
| 0.68 | 0.9 | |
| Number of redshift bins | 5 | 10 |
| (in ) | 27 | 48 |
| 0.26 | – |
We list below the choices made to model the LSST Y10 data vector:
-
•
The matter power spectrum is computed using camb Lewis:2002ah ; Lewis:1999bs ; Howlett:2012mh ; camb_notes . As the SRD uses scales down to , we decided to add a non-linear prescription with baryonic feedback from HMCode-2020 Mead_2020 , to model the small angular scales more realistically. We set inside the range recommended in Mead_2020 , with corresponding to the strength of Active Galactic Nuclei feedback in simulations.
-
•
The intrinsic alignment (IA) of galaxies is modeled using the non-linear alignment model Bridle_2007 such that the IA contributions to cosmic shear are linearly related to the non-linear matter power spectrum, where the amplitude of IA has (1+) redshift dependence as used in DES Year 1 desy1_methods .
-
•
Similarly to the SRD, we adopt a linear galaxy bias model parametrized by a bias parameter per redshift bin.
| Lens Bin | 1 | 2 | 3 | 4 | 5 | 6 | 7 | 8 | 9 | 10 |
|---|---|---|---|---|---|---|---|---|---|---|
| 0.27 | 0.46 | 0.61 | 0.74 | 0.88 | 1.03 | 1.20 | 1.42 | 1.73 | 2.45 | |
| 227 | 370 | 466 | 550 | 629 | 708 | 791 | 884 | 1000 | 1210 |
We use CosmoSIS Zuntz_2015 to model and analyze DES Y3 and our LSST Y10-like data vector. We thus theoretically predict the expected , with a Gaussian covariance matrix computed within CosmoSIS. Weak lensing analyses such as desy3 remove measurements, typically at small angular scales, where the modeling is uncertain. We do similarly and follow the guidelines from the SRD, thus using for weak lensing, and for the clustering part of the data vector. We translate this value into corresponding for each lens redshift bins as shown in Table 2.
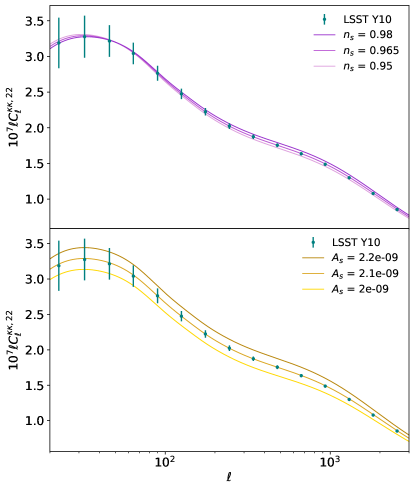
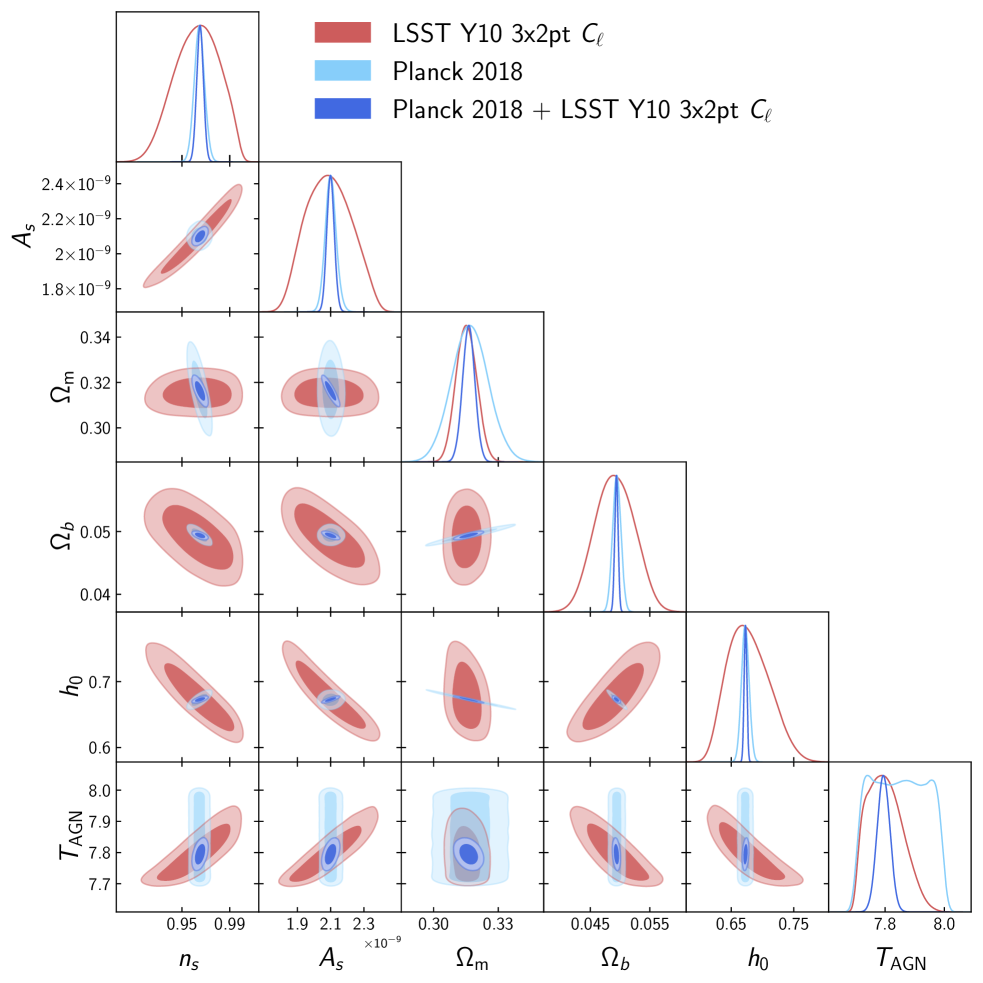
The effect of the scalar spectral index on shear power spectrum in redsfhit bin 2 is shown on the top panel of Fig. 1 along with the predicted data points and error bars from LSST Y10. The tilt of the primordial power spectrum translates into a dampening at low- (of at most 3 for = 0.98) and a boost at higher . Given the shown error bars, we thus expect LSST Y10 weak lensing to have sensitivity to this parameter. We however also show the effect of the amplitude of scalar perturbations on the lower panel of Fig. 1, which behaves similarly to on small angular scales, where the sensitivity is best. This translates into a degeneracy between the two parameters which is shown in the contours from analyzing our LSST Y10 3x2pt data dector in CDM in Fig. 4. For similar reasons, the baryonic feedback parameter is degenerate with while the energy density of baryons and the Hubble parameter are anti-correlated with . We therefore need to combine LSST Y10 with other data such as Planck temperature and polarization power spectra to break such degeneracy, which we do in the following section.
II.2 Other datasets and likelihood analysis
We adopt a Bayesian approach, where we sample the posterior using the nautilus importance nested sampler lange2023nautilus within CosmoSIS. The parameter estimation is made in CDM to forecast the sensitivity of LSST Y10 on and in CDM to forecast implications of DES Y3 and LSST Y10 for cosmic inflation.
Although our LSST Y10 data vector is a theoretical prediction, we combine it with current real CMB and BAO data while of course measurements of such observables will also become more precise in the coming decade. We indeed want to show results in the current experimental landscape first, using weak lensing data from DES Y3 in CDM and then show how solely improving DES Y3 to LSST Y10 would translate into inflation constraints. We thus use Planck 2018 temperature, polarization -modes and lensing potential power spectra in the form of the , , lite high-, and low- as well as lensing likelihoods, to add information on the cosmological parameters planck18_main . We refer to this combination as TTTEEE+low-+lensing. Additionally, to inform the geometry of the Universe and break the degeneracy between , and the Hubble parameter , we add Baryonic Acoustic Oscillations measurements from Sloan Digital Sky Survey. They specifically include likelihoods on distance measurements from the Main Galaxy Sample (MGS) mgs_bao , the Baryon Oscillation Spectroscopic Survey (BOSS) DR12 boss_dr12 re-analyzed in sdss and extended Baryon Oscillation Spectroscopic Survey (eBOSS) DR16 measurements from luminous red galaxies eboss_lrg1 ; eboss_lrg2 , emission line galaxies elg , quasars qso1 ; qso2 and Ly- forest lyalpha .
| Parameters | Priors |
|---|---|
| Cosmology | |
| [0.5,5] | |
| [0.88,1] | |
| [0.1,0.7] | |
| [0.03,0.07] | |
| [0.55,0.9] | |
| (in CDM) | [0,0.2] |
| DES Y3 | |
| See Table 1 in desy3 | |
| Forecast LSST Y10 | |
| [7.7,8.0] | |
| [-5,5] | |
| [-5,5] | |
| [-0.005,0.005] | |
| [-0.01,0.01] | |
| [-0.01,0.01] | |
| [1.9,2.1] | |
| Planck | |
| [0.01,0.8] | |
| (1,0.0025) | |
In CDM, we additionally include the likelihood on the tensor-to-scalar ratio from Bicep/Keck -modes power spectrum measurements from bk_18 (hereafter BK18). We note that Fig. 3 shows in coral the combination of BK18, Planck TTTEEE+low-+lensing and SDSS including eBOSS DR16, while BK18 analysis in bk_18 uses 6dFGS, MGS and BOSS DR12. The shift in caused by this update in the BAO measurement is not significant (0.07).
Table 3 summarizes the parameters varied and their corresponding priors, including both cosmological and nuisance parameters. We use GetDist getdist to quote constraints on parameters as the mean and 68 credible intervals in one dimension, and to show the 68 and 95 credible regions in two dimensions.
III Results, Forecasts and Implications for inflation
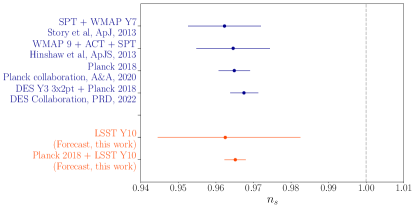
In Fig. 2, we summarize the present status of measurements in CDM, quoting results from WMAP data, the first rejection of at high significance in story_measurement_2013 ; Hinshaw_2013 , and the tightest current measurements from the Planck satellite planck18_main as well as the results from DES Y3 combined with Planck (which does not include CMB lensing) as published in desy3 . We then report the mean and 68 credible interval on we obtain from our analysis of LSST Y10 3x2pt alone and LSST Y10 3x2pt combined with Planck TTTEEE+low-+lensing in orange. While LSST Y10 by itself does not result in competitive results on the spectral index, the forecast shows a 30 improvement on from adding LSST Y10 to Planck compared to Planck alone. Although the gain in constraining power on expected from spectroscopic surveys is greater Huang_2012 , weak lensing and clustering prove to be useful additions as probes of the matter power spectrum. In Fig. 4 in the appendix, we show the predicted constraints on cosmology from LSST Y10 3x2pt in red as well as the combination with Planck in dark blue.
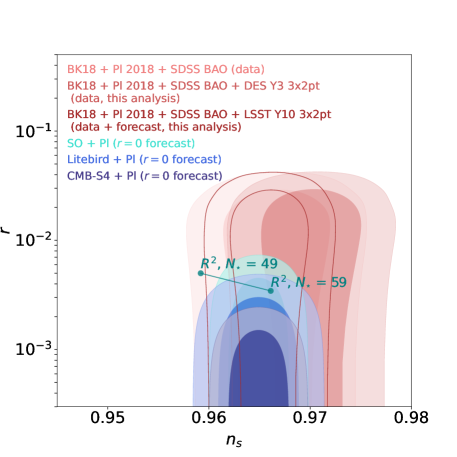
We now turn to the implications of such improvements on inflationary models, in CDM. The results from our parameter inference are summarized in Fig. 3 where we show constraints in the (,) plane, using the BK18 likelihood on the tensor-to-scalar ratio in addition to Planck TTTEEE+low-+lensing and SDSS BAO measurements in salmon. As a reference, we also show predictions from the Starobinsky model r2model1 ; r2model2 for e-folds between 49 and 59 in teal. As nicely summarized in Hinshaw_2013 , and are indeed simply related to the number of e-fold in the super-horizon limit, following r2model3 . In particular: .
First, adding DES Y3 3x2pt results in the red contour on (,). There is virtually no improvement on but strikingly, the contours are shifted by 1 to higher values of , indicating that any e-folds below 55 are rejected at more than 2. We believe this shift to be caused by the slight tension between Planck and DES Y3 3x2pt, where DES Y3 pulls the results towards lower values of which in turn translates into higher values of (given the slight anti-correlation in Planck’s (,) plane).
We then switch DES Y3 to our predicted LSST Y10 3x2pt data vector and report the result in brown, indicating that the 68 credible interval on would in this case be improved by 25. We note that our predicted LSST Y10 3x2pt data vector was computed for a value of equal to its mean measured by Planck 2018. The addition of LSST Y10 3x2pt will thus help test the model more strongly.
In the future, stage-IV CMB experiments dedicated to inflation search will aim at . The combination of their polarization power spectra with Planck will also tighten the constrains on . As a reference we show forecasts for Simons Observatory (SO) in cyan, Litebird in light blue and CMB-S4 in blue, taken from their forecast papers simonsobservatory ; litebird ; cmbs4 . In future work, we will assess the expected improvements on , and therefore on model constraints, from combining these experiments with future weak lensing (as shown here) and spectroscopic clustering (as shown in Huang_2012 ) measurements.
| CDM | |
|---|---|
| Fiducial | |
| Fiducial + DES Y3 3x2pt | |
| Fiducial + forecast LSST Y10 3x2pt |
IV Conclusion
The detection of Cosmic Microwave Background -modes on large scales is a great goal of modern cosmology as an awaited signal from cosmic inflation. Experiments such as BICEP/Keck have therefore been developed to enable the current tightest constraints on the tensor-to-scalar ratio , with implications for inflation shown as constraints on and the scalar spectral index of scalar perturbations as shown in Fig. 3. In the coming decade, a new generation of CMB polarization experiments including Simons Observatory, Litebird, CMB-S4 will aim at improving constraints in the direction, by attaining . However, we also need improvements in the direction to help further test inflationary models (such as model), in particular Huang_2012 already showed the power of spectroscopic measurements for surveys like Euclid in improving constraints by a factor of 2. In the present analysis, we complete the picture by showing the expected improvements from current and stage-IV weak lensing surveys in inflationary search and summarize our results in Table 4.
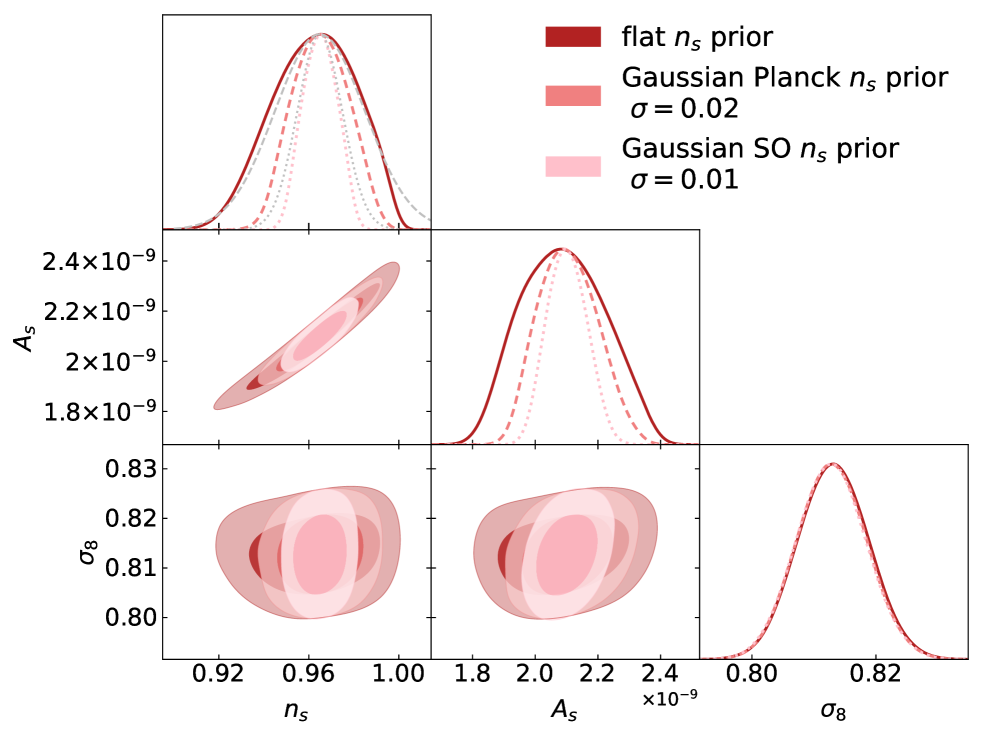
The next steps in this direction include assessing weak lensing and clustering sensitivity to the running of the scalar index, , the derivative of to the wavenumber as well as including information from the mass and galaxy maps beyond two-point statistics. Additionally, we show results with primordial and lensing CMB information from Planck but further work will be needed to understand how future galaxy surveys will help stage-IV CMB experiments in improving constraints. On a similar note, we show in Fig. 5 how priors informed by the CMB will impact cosmology from LSST Y10, the parameter appearing unchanged. To conclude, given the experimental landscape of the coming decade, we will want to combine results from both spectroscopic and weak lensing surveys with CMB polarization data to perform more complete inflation searches.
Acknowledgements.
AF would like to thank Daniel Green for inputs on CMB-S4 forecasts and Judit Prat for discussions about LSST Y1 forecasts. This work was supported in part by the U.S. Department of Energy, Office of Science, Office of Workforce Development for Teachers and Scientists (WDTS) under the Science Undergraduate Laboratory Internships Program (SULI). Some of the computing for this project was performed on the Sherlock cluster. We would like to thank Stanford University and the Stanford Research Computing Center for providing computational resources and support that contributed to these research results. We thank the developers of CosmoSIS and modules therein, the parameter inference tool used in this analysis, available at this link. *Appendix A LSST Y10 weak lensing and clustering forecast
We show in Fig. 4 the credible regions of cosmological parameters obtained by analyzing our predicted LSST Y10 3x2pt data vector in CDM in red, from Planck 2018 TTTEEE+low-+lensing likelihoods in light blue and their combination with LSST Y10 in dark blue. We thus show how LSST and Planck combined together will improve cosmological constraints by breaking several degeneracies.
In Fig. 5, we show forecasts on , and obtained analyzing LSST Y10 3x2pt using a flat wide prior on (shown in red), a Gaussian prior informed by Planck 2018 (in coral) and SO (in pink). In both cases, the standard deviation of the Gaussian prior is 5 times the 68 credible interval from Planck, and 5 times the expected uncertainty from SO (expected to be twice as small as Planck).
References
- (1) L. Knox and M. S. Turner, “Detectability of tensor perturbations through anisotropy of the cosmic background radiation,” Phys. Rev. Lett., vol. 73, pp. 3347–3350, Dec 1994.
- (2) L. Knox, “Determination of inflationary observables by cosmic microwave background anisotropy experiments,” Phys. Rev. D, vol. 52, pp. 4307–4318, Oct 1995.
- (3) S. Dodelson, W. H. Kinney, and E. W. Kolb, “Cosmic microwave background measurements can discriminate among inflation models,” Phys. Rev. D, vol. 56, pp. 3207–3215, Sep 1997.
- (4) Planck Collaboration, Aghanim, N., Akrami, Y., Ashdown, M., Aumont, J., Baccigalupi, C., Ballardini, M., Banday, A. J., Barreiro, R. B., Bartolo, N., Basak, S., et al., “Planck 2018 results - vi. cosmological parameters,” A&A, vol. 641, p. A6, 2020.
- (5) P. A. R. Ade, Z. Ahmed, M. Amiri, D. Barkats, R. B. Thakur, C. A. Bischoff, D. Beck, J. J. Bock, H. Boenish, E. Bullock, et al., “Improved constraints on primordial gravitational waves using planck, wmap, and bicep/keck observations through the 2018 observing season,” Phys. Rev. Lett., vol. 127, p. 151301, Oct 2021.
- (6) LiteBIRD Collaboration, E. Allys, K. Arnold, J. Aumont, R. Aurlien, S. Azzoni, C. Baccigalupi, A. J. Banday, R. Banerji, R. B. Barreiro, N. Bartolo, et al., “Probing cosmic inflation with the LiteBIRD cosmic microwave background polarization survey,” Progress of Theoretical and Experimental Physics, vol. 2023, p. 042F01, 11 2022.
- (7) P. Ade, J. Aguirre, Z. Ahmed, S. Aiola, A. Ali, D. Alonso, M. A. Alvarez, K. Arnold, P. Ashton, J. Austermann, et al., “The simons observatory: science goals and forecasts,” Journal of Cosmology and Astroparticle Physics, vol. 2019, pp. 056–056, feb 2019.
- (8) K. Abazajian, G. E. Addison, P. Adshead, Z. Ahmed, D. Akerib, A. Ali, S. W. Allen, D. Alonso, M. Alvarez, M. A. Amin, et al., “CMB-s4: Forecasting constraints on primordial gravitational waves,” The Astrophysical Journal, vol. 926, p. 54, feb 2022.
- (9) J. A. Tyson, “Large Synoptic Survey Telescope: overview,” in Survey and Other Telescope Technologies and Discoveries (J. A. Tyson and S. Wolff, eds.), vol. 4836, pp. 10 – 20, International Society for Optics and Photonics, SPIE, 2002.
- (10) Z. Ivezić and the LSST Science Collaboration, “Large synoptic survey telescope science requirements document,” 2011.
- (11) R. Laureijs, J. Amiaux, S. Arduini, J. L. Auguères, J. Brinchmann, R. Cole, M. Cropper, C. Dabin, L. Duvet, A. Ealet, et al., “Euclid definition study report,” 2011.
- (12) R. Akeson, L. Armus, E. Bachelet, V. Bailey, L. Bartusek, A. Bellini, D. Benford, D. Bennett, A. Bhattacharya, and R. B. andothers, “The wide field infrared survey telescope: 100 hubbles for the 2020s,” 2019.
- (13) The LSST Dark Energy Science Collaboration, R. Mandelbaum, T. Eifler, R. Hložek, T. Collett, E. Gawiser, D. Scolnic, D. Alonso, H. Awan, R. Biswas, et al., “The lsst dark energy science collaboration (desc) science requirements document,” 2021.
- (14) A. Ferté, D. Kirk, A. R. Liddle, and J. Zuntz, “Testing gravity on cosmological scales with cosmic shear, cosmic microwave background anisotropies, and redshift-space distortions,” Physical Review D, vol. 99, apr 2019.
- (15) Euclid Collaboration, A. Blanchard, S. Camera, C. Carbone, V. F. Cardone, S. Casas, S. Clesse, S. Ilić, M. Kilbinger, T. Kitching, M. Kunz, et al., “Euclid preparation. VII. Forecast validation for Euclid cosmological probes,” A&A, vol. 642, p. A191, Oct. 2020.
- (16) T. Eifler, H. Miyatake, E. Krause, C. Heinrich, V. Miranda, C. Hirata, J. Xu, S. Hemmati, M. Simet, P. Capak, et al., “Cosmology with the Roman Space Telescope – multiprobe strategies,” Monthly Notices of the Royal Astronomical Society, vol. 507, pp. 1746–1761, 07 2021.
- (17) T. Abbott, M. Aguena, A. Alarcon, S. Allam, O. Alves, A. Amon, F. Andrade-Oliveira, J. Annis, S. Avila, D. Bacon, et al., “Dark energy survey year 3 results: Cosmological constraints from galaxy clustering and weak lensing,” Physical Review D, vol. 105, jan 2022.
- (18) S. More, S. Sugiyama, H. Miyatake, M. M. Rau, M. Shirasaki, X. Li, A. J. Nishizawa, K. Osato, T. Zhang, M. Takada, et al., “Hyper suprime-cam year 3 results: Measurements of clustering of sdss-boss galaxies, galaxy-galaxy lensing and cosmic shear,” 2023.
- (19) C. Heymans, T. Tröster, M. Asgari, C. Blake, H. Hildebrandt, B. Joachimi, K. Kuijken, C.-A. Lin, A. G. Sá nchez, J. L. van den Busch, et al., “KiDS-1000 cosmology: Multi-probe weak gravitational lensing and spectroscopic galaxy clustering constraints,” Astronomy & Astrophysics, vol. 646, p. A140, feb 2021.
- (20) A. Albrecht, G. Bernstein, R. Cahn, W. L. Freedman, J. Hewitt, W. Hu, J. Huth, M. Kamionkowski, E. W. Kolb, L. Knox, J. C. Mather, S. Staggs, and N. B. Suntzeff, “Report of the dark energy task force,” 2006.
- (21) T. Giannantonio, C. Porciani, J. Carron, A. Amara, and A. Pillepich, “Constraining primordial non-gaussianity with future galaxy surveys,” Monthly Notices of the Royal Astronomical Society, vol. 422, pp. 2854–2877, apr 2012.
- (22) D. Yamauchi, K. Takahashi, and M. Oguri, “Constraining primordial non-gaussianity via a multitracer technique with surveys by euclid and the square kilometre array,” Phys. Rev. D, vol. 90, p. 083520, Oct 2014.
- (23) O. Doré, M. W. Werner, M. L. N. Ashby, L. E. Bleem, J. Bock, J. Burt, P. Capak, T.-C. Chang, J. Chaves-Montero, C. H. Chen, et al., “Science impacts of the spherex all-sky optical to near-infrared spectral survey ii: Report of a community workshop on the scientific synergies between the spherex survey and other astronomy observatories,” 2018.
- (24) S. Hilbert, L. Marian, R. E. Smith, and V. Desjacques, “Measuring primordial non-Gaussianity with weak lensing surveys,” MNRAS, vol. 426, pp. 2870–2888, Nov. 2012.
- (25) F. Schmidt, N. E. Chisari, and C. Dvorkin, “Imprint of inflation on galaxy shape correlations,” Journal of Cosmology and Astroparticle Physics, vol. 2015, p. 032, oct 2015.
- (26) M. Gatti, C. Chang, O. Friedrich, B. Jain, D. Bacon, M. Crocce, J. DeRose, I. Ferrero, P. Fosalba, and E. G. andothers, “Dark energy survey year 3 results: cosmology with moments of weak lensing mass maps – validation on simulations,” Monthly Notices of the Royal Astronomical Society, vol. 498, pp. 4060–4087, aug 2020.
- (27) J. Prat, J. Zuntz, C. Chang, T. Tröster, E. Pedersen, C. Garcí a-García, E. Phillips-Longley, J. Sanchez, D. Alonso, X. Fang, et al., “The catalog-to-cosmology framework for weak lensing and galaxy clustering for LSST,” The Open Journal of Astrophysics, vol. 6, apr 2023.
- (28) T. Tan, D. Zürcher, J. Fluri, A. Refregier, F. Tarsitano, and T. Kacprzak, “Assessing theoretical uncertainties for cosmological constraints from weak lensing surveys,” Monthly Notices of the Royal Astronomical Society, vol. 522, pp. 3766–3783, apr 2023.
- (29) D. Chandra and S. Pal, “Investigating the constraints on primordial features with future cosmic microwave background and galaxy surveys,” Journal of Cosmology and Astroparticle Physics, vol. 2022, p. 024, sep 2022.
- (30) Z. Huang, L. Verde, and F. Vernizzi, “Constraining inflation with future galaxy redshift surveys,” Journal of Cosmology and Astroparticle Physics, vol. 2012, pp. 005–005, apr 2012.
- (31) C. Sá nchez, J. Prat, G. Zacharegkas, S. Pandey, E. Baxter, G. Bernstein, J. Blazek, R. Cawthon, C. Chang, E. Krause, et al., “Dark energy survey year 3 results: Exploiting small-scale information with lensing shear ratios,” Physical Review D, vol. 105, apr 2022.
- (32) A. Lewis and S. Bridle, “Cosmological parameters from CMB and other data: A Monte Carlo approach,” Phys. Rev. D, vol. 66, p. 103511, 2002.
- (33) A. Lewis, A. Challinor, and A. Lasenby, “Efficient computation of CMB anisotropies in closed FRW models,” ApJ, vol. 538, pp. 473–476, 2000.
- (34) C. Howlett, A. Lewis, A. Hall, and A. Challinor, “CMB power spectrum parameter degeneracies in the era of precision cosmology,” J. Cosmology Astropart. Phys, vol. 1204, p. 027, 2012.
- (35) A. Lewis, “CAMB Notes.” https://cosmologist.info/notes/CAMB.pdf.
- (36) A. J. Mead, S. Brieden, T. Tröster, and C. Heymans, “Hmcode-2020: improved modelling of non-linear cosmological power spectra with baryonic feedback,” Monthly Notices of the Royal Astronomical Society, vol. 502, pp. 1401–1422, jan 2021.
- (37) S. Bridle and L. King, “Dark energy constraints from cosmic shear power spectra: impact of intrinsic alignments on photometric redshift requirements,” New Journal of Physics, vol. 9, pp. 444–444, dec 2007.
- (38) E. Krause, T. F. Eifler, J. Zuntz, O. Friedrich, M. A. Troxel, S. Dodelson, J. Blazek, L. F. Secco, N. MacCrann, E. Baxter, et al., “Dark energy survey year 1 results: Multi-probe methodology and simulated likelihood analyses,” 2017.
- (39) J. Zuntz, M. Paterno, E. Jennings, D. Rudd, A. Manzotti, S. Dodelson, S. Bridle, S. Sehrish, and J. Kowalkowski, “CosmoSIS: Modular cosmological parameter estimation,” Astronomy and Computing, vol. 12, pp. 45–59, sep 2015.
- (40) J. U. Lange, “Nautilus: boosting bayesian importance nested sampling with deep learning,” 2023.
- (41) A. J. Ross, L. Samushia, C. Howlett, W. J. Percival, A. Burden, and M. Manera, “The clustering of the SDSS DR7 main galaxy sample – i. a 4 per cent distance measure at z = 0.15,” Monthly Notices of the Royal Astronomical Society, vol. 449, pp. 835–847, mar 2015.
- (42) S. Alam, M. Ata, S. Bailey, F. Beutler, D. Bizyaev, J. A. Blazek, A. S. Bolton, J. R. Brownstein, A. Burden, C.-H. Chuang, et al., “The clustering of galaxies in the completed SDSS-III baryon oscillation spectroscopic survey: cosmological analysis of the DR12 galaxy sample,” Monthly Notices of the Royal Astronomical Society, vol. 470, pp. 2617–2652, mar 2017.
- (43) S. Alam, M. Aubert, S. Avila, C. Balland, J. E. Bautista, M. A. Bershady, D. Bizyaev, M. R. Blanton, A. S. Bolton, J. Bovy, et al., “Completed SDSS-IV extended baryon oscillation spectroscopic survey: Cosmological implications from two decades of spectroscopic surveys at the apache point observatory,” Physical Review D, vol. 103, apr 2021.
- (44) J. E. Bautista, R. Paviot, M. Vargas Magaña, S. de la Torre, S. Fromenteau, H. Gil-Marín, A. J. Ross, E. Burtin, K. S. Dawson, J. Hou, et al., “The completed SDSS-IV extended Baryon Oscillation Spectroscopic Survey: measurement of the BAO and growth rate of structure of the luminous red galaxy sample from the anisotropic correlation function between redshifts 0.6 and 1,” MNRAS, vol. 500, pp. 736–762, Jan. 2021.
- (45) H. Gil-Marín, J. E. Bautista, R. Paviot, M. Vargas-Magaña, S. de la Torre, S. Fromenteau, S. Alam, S. Ávila, E. Burtin, C.-H. Chuang, et al., “The Completed SDSS-IV extended Baryon Oscillation Spectroscopic Survey: measurement of the BAO and growth rate of structure of the luminous red galaxy sample from the anisotropic power spectrum between redshifts 0.6 and 1.0,” Monthly Notices of the Royal Astronomical Society, vol. 498, pp. 2492–2531, 08 2020.
- (46) A. de Mattia, V. Ruhlmann-Kleider, A. Raichoor, A. J. Ross, A. Tamone, C. Zhao, S. Alam, S. Avila, E. Burtin, J. Bautista, et al., “The completed SDSS-IV extended baryon oscillation spectroscopic survey: measurement of the BAO and growth rate of structure of the emission line galaxy sample from the anisotropic power spectrum between redshift 0.6 and 1.1,” Monthly Notices of the Royal Astronomical Society, dec 2020.
- (47) R. Neveux, E. Burtin, A. de Mattia, A. Smith, A. J. Ross, J. Hou, J. Bautista, J. Brinkmann, C.-H. Chuang, K. S. Dawson, et al., “The completed SDSS-IV extended Baryon Oscillation Spectroscopic Survey: BAO and RSD measurements from the anisotropic power spectrum of the quasar sample between redshift 0.8 and 2.2,” Monthly Notices of the Royal Astronomical Society, vol. 499, pp. 210–229, 09 2020.
- (48) J. Hou, A. G. Sá nchez, A. J. Ross, A. Smith, R. Neveux, J. Bautista, E. Burtin, C. Zhao, R. Scoccimarro, K. S. Dawson, et al., “The completed SDSS-IV extended baryon oscillation spectroscopic survey: BAO and RSD measurements from anisotropic clustering analysis of the quasar sample in configuration space between redshift 0.8 and 2.2,” Monthly Notices of the Royal Astronomical Society, vol. 500, pp. 1201–1221, oct 2020.
- (49) H. du Mas des Bourboux, J. Rich, A. Font-Ribera, V. de Sainte Agathe, J. Farr, T. Etourneau, J.-M. Le Goff, A. Cuceu, C. Balland, J. E. Bautista, et al., “The Completed SDSS-IV Extended Baryon Oscillation Spectroscopic Survey: Baryon Acoustic Oscillations with Ly Forests,” ApJ, vol. 901, p. 153, Oct. 2020.
- (50) A. Lewis, “GetDist: a Python package for analysing Monte Carlo samples,” 2019.
- (51) K. T. Story, C. L. Reichardt, Z. Hou, R. Keisler, K. A. Aird, B. A. Benson, L. E. Bleem, J. E. Carlstrom, C. L. Chang, H.-M. Cho, et al., “A Measurement of the Cosmic Microwave Background Damping Tail from the 2500-square-degree SPT-SZ survey,” The Astrophysical Journal, vol. 779, p. 86, Dec. 2013. arXiv:1210.7231 [astro-ph].
- (52) G. Hinshaw, D. Larson, E. Komatsu, D. N. Spergel, C. L. Bennett, J. Dunkley, M. R. Nolta, M. Halpern, R. S. Hill, N. Odegard, et al., “Nine-Year Wilkinson Microwave Anisotropy Probe (WMAP) Observations: Cosmological Parameter Results,” The Astrophysical Journal Supplement Series, vol. 208, p. 19, Sept. 2013.
- (53) A. A. Starobinskij, “Spectrum of adiabatic perturbations in the universe when there are singularities in the inflationary potential.,” Soviet Journal of Experimental and Theoretical Physics Letters, vol. 55, pp. 489–494, May 1992.
- (54) A. A. Starobinsky, “A new type of isotropic cosmological models without singularity,” Physics Letters B, vol. 91, pp. 99–102, Mar. 1980.
- (55) V. F. Mukhanov and G. V. Chibisov, “Quantum fluctuations and a nonsingular universe,” Soviet Journal of Experimental and Theoretical Physics Letters, vol. 33, p. 532, May 1981.