Observation of GRB 221009A early afterglow in X/-ray energy band
Abstract
The early afterglow of a Gamma-ray burst (GRB) can provide critical information on the jet and progenitor of the GRB. The extreme brightness of GRB 221009A allows us to probe its early afterglow in unprecedented detail. In this letter, we report comprehensive observation results of the early afterglow of GRB 221009A (from +660 s to +1860 s, where is the Insight-HXMT/HE trigger time) in X/-ray energy band (from 20 keV to 20 MeV) by Insight-HXMT/HE, GECAM-C and Fermi/GBM. We find that the spectrum of the early afterglow in 20 keV-20 MeV could be well described by a cutoff power-law with an extra power-law which dominate the low and high energy bands respectively. The cutoff power-law is 30 keV and the power-law photon index is 1.8 throughout the early afterglow phase. By fitting the light curves in different energy bands, we find that a significant achromatic break (from 10s keV to TeV) is required at + 1246 s (i.e. 1021 s since the afterglow starting time =+225 s), providing compelling evidence of a jet break. Interestingly, both the pre-break and post-break decay slopes vary with energy, and these two slopes become closer in the lower energy band, making the break less identifiable. Intriguingly, the spectrum of the early afterglow experienced a slight hardening before the break and a softening after the break. These results provide new insights into the physics of this remarkable GRB.
1.5in
1 Introduction
Gamma-ray bursts (GRBs), as the cosmological electromagnetic events produced by stellar deaths, are the most violent explosions in the universe (e.g. Zhang, 2018). They can be simply divided into short GRBs (SGRBs) and long GRBs (LGRBs) by their duration of prompt emission, which is generally produced by ultra-relativistic and collimated outflow (jet) launched from binary neutron star mergers or massive star core collapses, respectively (Eichler et al., 1989; Narayan et al., 1992; Woosley, 1993; Woosley & Bloom, 2006; Abbott et al., 2017). While the jet propagates away from the central engine, the prompt emission is produced within the jet by internal shock or magnetic dissipation (Rees & Meszaros, 1994; Zhang & Yan, 2011) and multi-wavelength afterglow is radiated when the jet sweeps the external medium, producing reverse shock and forward shock (Gao et al., 2013, for a review).
In contrast to the irregular behavior in the prompt emission, the afterglow emission usually can be well described with several power-law decays. Sometimes the break between power-law decays is achromatic (i.e. showing up in different energy bands at the same time), called a jet break, which is directly related to the jet geometry and observer’s viewing angle (Panaitescu & Kumar, 2003; Liang et al., 2008; Wang et al., 2018). Generally, when the jet opening angle is small, the jet break occurs earlier in the light curve, making the multi-wavelength observation of the break very challenging.
As the brightest GRB event since the discovery of GRBs in the 1960s, GRB 221009A was first reported by Fermi/GBM while many other gamma-ray telescopes detected it simultaneously but without real-time alert. With the early accurate location provided by /BAT (Dichiara et al., 2022), follow-up observations have been made by numerous multi-wavelength and multi-messenger telescopes (e.g. An et al., 2023; Malesani et al., 2023; Williams et al., 2023; Burns et al., 2023; LHAASO-Collaboration et al., 2023; Kann et al., 2023; Levan et al., 2023; Negro et al., 2023; Laskar et al., 2023). The redshift of this burst is found to be =0.151 (de Ugarte Postigo et al., 2022; Malesani et al., 2023).
The Insight-Hard X-ray Modulation Telescope (Insight-HXMT) was triggered by GRB 221009A at 13:17:00.050 UT on October 9th, 2022 (denoted as 111Note that the Insight-HXMT trigger is 60 ms after the Fermi/GBM trigger time for GRB 221009A.) during a routine ground search of bursts. With the novel design dedicated to extremely bright bursts, GECAM-C made a uniquely accurate measurement of GRB 221009A prompt emission with its unsaturated data and found that this GRB has the highest total isotropic-equivalent energy (=1.5 × 1055 erg) (An et al., 2023), which is confirmed by other observations (e.g. Burns et al. (2023); Lesage et al. (2023); Frederiks et al. (2023); Rodi & Ubertini (2023)). Interestingly, a jet break at + 670 s is reported in TeV range (LHAASO-Collaboration et al., 2023), where is the afterglow starting time222The accurate afterglow starting time = + 225.7 s was reported by LHAASO (LHAASO-Collaboration et al., 2023). We use = + 225 s in this work. The slightly different choice of has negligible impact on our results.. Joint observations of early afterglow by Insight-HXMT and GECAM-C also show there is a jet break around + 950 s in the keV-MeV range, however, a detailed analysis of the jet break is difficult due to observation gaps of these two instruments (An et al., 2023).
In this paper, we performed a comprehensive analysis of the GRB 221009A early afterglow (from +660 s to +1860 s ) in X-ray and gamma-ray energy band (20 keV to 20 MeV) with joint observations of the Insight-HXMT High Energy X-ray Telescope, GECAM-C Telescope, and the Gamma-ray Burst Monitor of Fermi Gamma-ray Space Telescope. We present the detailed observations of the three instruments and the data analysis in section 2. Then temporal and spectral analysis results are reported in section 3. Discussion and conclusions are given in section 4.
Please note that all parameter errors in this work are for 68% confidence level if not otherwise stated.
2 Observations and data reduction
2.1 Insight-HXMT/HE observation
As China’s first X-ray astronomy satellite, Insight-Hard X-ray Modulation Telescope (Insight-HXMT) has made many discoveries on high energy objects since it was launched to the orbit of an altitude of 550 km and an inclination of 43 degrees on June 15th, 2017 (Zhang et al., 2018, 2020; Li et al., 2020, 2023). The main detector of the High Energy X-ray telescope (HE), consisting of 18 NaI(Tl)/CsI(Na) phoswich scintillation detectors, has played an important role in the observation of GRB 221009A in the MeV range (An et al., 2023).
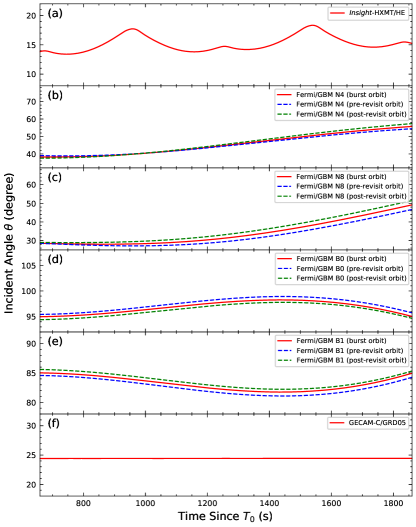
GRB 221009A was visible to HE before the satellite entered the Earth’s shadow. However, the effective observation of GRB 221009A afterglow is up to about +900 s, when Insight-HXMT began to enter the high-latitude region where the HE detectors suffer high background. The high fluence of charged particles in the high-latitude orbit region had a significant impact on observation data (An et al., 2023). The incident angle of GRB 221009A to HE detector is shown in Fig. 1 panel during the early afterglow phase, when Insight-HXMT was executing a galactic plane scan observation.
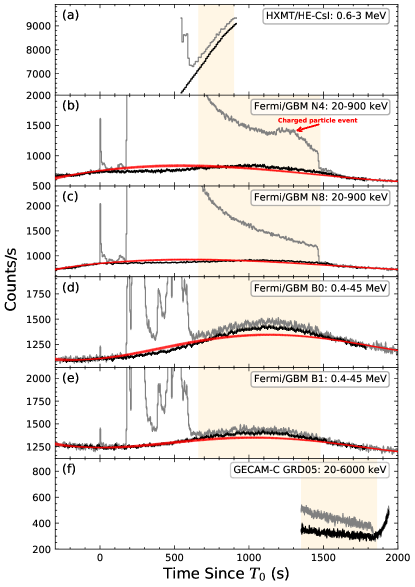
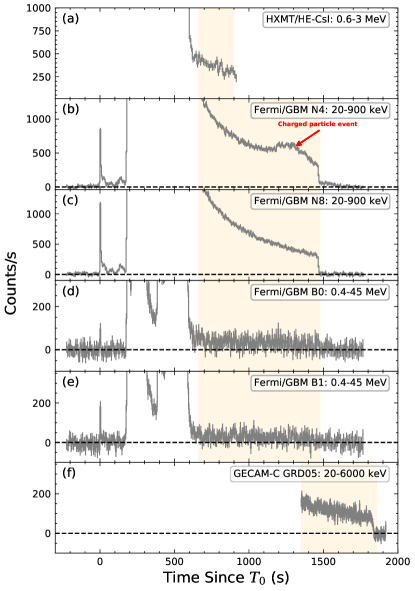
Excluding the time region of background contamination, HE data from +660 s to +900 s are selected for this analysis, as shown in Fig. 2 panel . The blue solid lines represent the afterglow light curves in the 600-3000 keV energy band, and the corresponding background (black lines) is estimated by a parametric model, which makes use of some measured parameters to reconstruct the background (You et al., 2021; Liao et al., 2023). For the spectral analysis, the HE data in the good time interval (GTI) is split into two time-resolved spectra as shown in Table 1, which are used for joint analysis with Fermi/GBM data.
2.2 Fermi/GBM observation
As one of the two instruments onboard the Fermi Gamma-ray Space Telescope, the Gamma-ray Burst Monitor (Fermi/GBM) is composed of 14 detectors with different orientations: 12 Sodium Iodide (NaI) detectors (labeled from N0 to N11) covering the energy range of about 8-1000 keV, and 2 Bismuth Germanate (BGO) detectors (labeled as B0 and B1) covering energies about 0.2-40 MeV (Meegan et al., 2009; Bissaldi et al., 2009). Fermi/GBM was also triggered by GRB 221009A, with the observation results initially reported on the GCN (Veres et al., 2022) and detailed analysis presented in Lesage et al. (2023).
Since GRB 221009A is extremely bright, GBM suffered pulse pile-up and data saturation during the prompt emission and flare emission phase (Lesage et al., 2023). Fortunately, the GBM observation of the early afterglow was unaffected by these effects and thus could provide valuable data until it entered the Earth’s shadow at about +1467 s.
The GBM Time-Tagged Events (TTE) data are performed for temporal and spectral analysis, with two NaI detectors (NaI 4, NaI 8) and two BGO detectors (BGO 0, BGO 1). The incident angles of these four detectors are shown with the red solid lines in Fig. 1 panel to respectively. The green and blue dotted lines indicate the nearest revisit orbit geographically (with a time shift of 85610 s w.r.t the current orbit of the detection of GRB 221009A), showing that the detector pointing directions were nearly identical. Since the environmental irradiation background was also stable, the count rate in the revisit orbit can be used to estimate the background of the observation of GRB 221009A. This method of background estimation has been proven to be successful for GECAM-C (An et al., 2023). Indeed it is also validated by the GBM light curve itself before and after the Earth occultation (see Fig. 2 panel to ).
The light curves from -300 s to +2000 s for N4, N8, B0, and B1 are plotted in Fig. 2 on panel to panel . The gray solid lines represent the total light curve and the black solid lines represent the background light curve averaged from the revisit orbits. As shown in red lines, we also tried a background fit with the same 4th-order polynomial with the same background time intervals as Figure 3 of Lesage et al. (2023). Because the 4th-order polynomial function is unable to accurately describe the background after the flare, our averaged revisit orbit background seems to be more appropriate to describe the afterglow background. Considering the influence of the Sco X-1 and charged particle events, we omit data below 200 keV for NaI 4. The NaI 8 data below 20 keV is also omitted Lesage et al. (2023). BGO data below 400 keV are also ignored since the detector response at low energies is affected by the photomultiplier tubes and their housings at such viewing angle Lesage et al. (2023). For the spectral analysis, three time-resolved spectra, as shown in Table 1, are extracted from +660 s to +1400 s with 333 https://fermi.gsfc.nasa.gov/ssc/data/analysis/gbm/ (Goldstein et al., 2022). Additionally, finer time-resolved spectra with a time interval of 40 s are achieved with from +660 s to +1420 s, which are used to characterize the spectra evolution in 20-300 keV energy band.
2.3 GECAM-C observation
As the third member of the GECAM constellation, GECAM-C444GECAM-C is also named as HEBS (Liu et al., 2022). onboard the SATech-01 satellite was launched on July 27th, 2022. GECAM-C is equipped with 12 Gamma-Ray detectors (GRDs, labeled from GRD01 to GRD12, including 6 LaBr3-based detectors and 6 NaI-based detectors) and 2 Charged Particle Detectors (CPDs) (Zhang et al., 2023; Zheng et al., 2023; Zhang et al., 2023).
Thanks to the dedicated design in instrument and working mode for extremely bright burst observation, the GECAM-C made an accurate measurement of GRB 221009A and provided unique data in the main burst, flare, and early afterglow until it entered the Earth’s shadow at about +1860 s (Liu et al., 2022). From +640 s to +1350 s, the GECAM-C was over the high latitude region (An et al., 2023), where the flux of charged particle events was extremely high and contaminated some of the observation data (An et al., 2023). Consequently, we select clean data of GRD05 from +1350 s to +1860 s for temporal and spectral analysis. The incident angle of GRD05 was stable during this time range as shown in Fig. 1 on panel . The light curves of GRD05 are displayed in Fig. 2 on panel , which gray lines are the total light curves and black solid lines are the background light curves using revisit orbit data (Wang & Xiong, 2023; An et al., 2023). The total light curves agree well with the background light curves after GECAM-C entered the Earth’s shadow, supporting that the revisit orbit background is appropriate.
3 Results
3.1 Spectral analysis
The observation data are divided into four parts, and the time-resolved spectra are obtained (see Table.1). For the spectral analysis, the single power-law (Eq.1) model (PL hereafter) and the cutoff power-law (Eq.2) model (CPL hereafter), and Band model (Eq.3) is performed to describe the spectral features:
| (1) |
where is the normalization amplitude constant () at 1 keV, is the dimensionless photon index of powerlaw.
| (2) |
where is the normalization amplitude constant () at 1 keV, is the power law photon index, and is the e-folding energy of exponential roll-off in keV.
| (3) |
where is the normalization amplitude constant (), is the first power law photon index, is the second power law photon index, and is characteristic energy in keV.
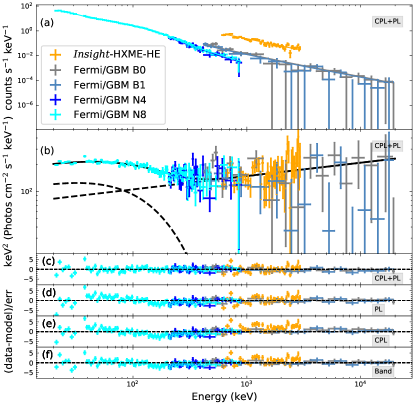
The package of Xspec (V12.12.1) (Arnaud, 1996) is utilized to perform the analysis of those spectra. The X/ spectra in 20-20000 keV energy band are fitted with the PL, CPL, and Band models respectively. As can be seen from Fig. 3, from +700 s to +900 s, the spectra fitting results show a significant structure in residual distribution and excess in the low energy band (see Fig. 3 panel d, e, and f). Consequently, we adopt a combined model (CPL+PL) to fit spectra. The combined model fitting results show much better results without significant residual structure and the lowest stat/d.o.f value. Furthermore, the Bayesian information criterion (BIC hereafter), defined as BIC=-2lnL+klnN, is employed to compare and select models 555As mentioned by de la Cruz-Dombriz et al. (2016), the strength of the evidence supporting the model with the lower BIC value can be summarized as follows: (1) if -2 <BIC, no evidence supports the model with a lower BIC value; (2) if -6 <BIC <-2, positive evidence supports the model with a lower BIC; (3) if -10 <BIC <-6, strong evidence supports the model with a lower BIC value; (4) if BIC <-10, very strong evidence supports the model with a lower BIC value., where L is the likelihood function, k is the number of free parameters of the model, and N is the number of data points Neath & Cavanaugh (2012). From +660 s to +1800 s, the spectra fitting results are summarized in Table 1. The cutoff power-law ( 30 keV) seems to be relatively stable during this time range. The power-law model photon indices are also consistent with Insight-HXMT/HE results ( 1.7 from +660 s to +900 s) within error (An et al., 2023).
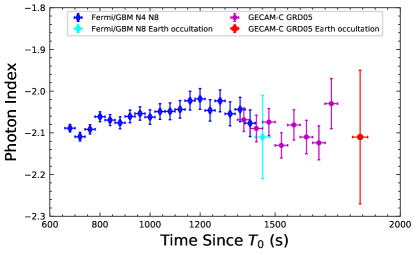
Since the source intensity decays with time and the effective area of the detector is minor, in order to guarantee sufficient statistics to obtain meaningful spectra, the detailed analysis of time-resolved spectra is only carried out in the energy range from 20 keV to 300 keV. We generate 19 time-resolved spectra using Fermi/GBM N4, and N8 detector data from +660 s to +1420 s with the same time bin-width of 40 s, and 8 time-resolved spectra using GECAM-C GRD05 detector data from +1350 s to +1750 s with the same time bin-width of 50 s. The spectra data from 20 keV to 300 keV could be described well with a single power-law model. The photon indices are shown in Fig. 4. The blue diamonds and magenta points represent the Fermi/GBM (N4 and N8) spectra results and GECAM-C (GRD05) spectra results, respectively.
Besides, the source spectrum can also be measured by Earth occultation analysis (Xue et al., 2023). For Fermi/GBM, the Earth occultation started at +1430 s and ended at +1467 s, while it started at +1810 s and ended at +1860 s for GECAM-C. According to Earth occultation analysis, the photon index of power-law from Fermi/GBM is plot with a cyan diamond in Fig. 4, and that of GECAM-C with a red dot. We note that the photon index measured by these two methods and two instruments is well consistent with each other, demonstrating that the background model used in this work is reasonably reliable.
From the evolution of the photon index in the energy range of 20 keV to 300 keV in Fig. 4, it seems that the early afterglow first experienced a hardening and then a softening in the spectrum.
| Timea (s) | Telescopes | CPL | CPL (keV) | PL | stat/d.o.f | BICb |
| 660-700 | Fermi/GBM, HXMT/HE | 1.85 | 191 | 1.71 | 375.88/398 | -58.78 |
| 700-900 | Fermi/GBM, HXMT/HE | 1.69 | 104 | 1.85 | 495.51/398 | -174.85 |
| 900-1400 | Fermi/GBM | 1.52 | 87 | 1.90 | 351.81/351 | -80.63 |
| 1350-1800 | GECAM-C | 1.30 | 43 | 1.76 | 143.11/144 | -9.01 |
a The Time is relative to .
b BIC = BICCPL+PL - BICPL
3.2 Flux light curves analysis
According to the results of the spectral analysis conducted with time resolution, the flux light curves (in units of erg/cm2/s) are calculated in five energy bands: 20-50 keV, 50-100 keV, 100-150 keV, 150-200 keV, 200-300 keV, respectively. With the starting time of the afterglow at = + 225 s, as shown in Fig. 5, the blue points represent Fermi/GBM flux and the green points represent GECAM-C flux in each panel. It is worth noting that the measured flux from both instruments is highly consistent with each other during the overlapping time period, demonstrating that the calibration and background model used in this work are reasonably reliable for Fermi/GBM and GECAM-C.
The flux light curves from +525 to +1635 s are fitted by the single power-law model (Equ.4) and broken power-law model (Equ.5) Zhang et al. (2006) with the software package Foreman-Mackey et al. (2013), respectively. The free parameters of the broken power-law model include amplitude , break time , and two slope indices and . The posterior distributions of the broken power-law model and break time are plotted in different energy bands, respectively (see Fig.5). Detailed fitting results for each energy band are listed in Table.2.
| (4) |
| (5) |
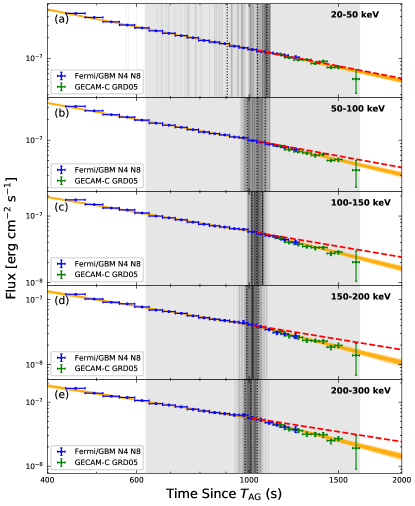
The significance of the break was estimated by the likelihood ratio (LR) test method (e.g. LHAASO-Collaboration et al., 2023). All LR significances for 50 keV energy bands are higher than 3 (50-100 keV: 3.8, 100-150 keV: 6.4, 150-200 keV: 4.4, and 200-300 keV: 4.5), demonstrating that a break is required significantly. Although the LR significance in 20-50 keV energy band is only 1.9 , the /d.o.f value of the BPL model (1.15) is clearly preferred over the PL model (1.37). We note that this lower significance in low energy bands than higher energy bands seems to be understandable and expected from the trend of the energy dependence of the pre-break and post-break slopes (Fig.7). Therefore, we conclude that the BPL model is statistically more suitable to describe the flux decay. We also plot the summed flux light curves in the 50-300 keV and fit with the BPL model from +525 to +1635 s. The MCMC fit results are shown in Fig.6.
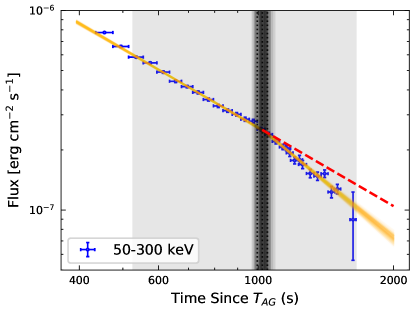
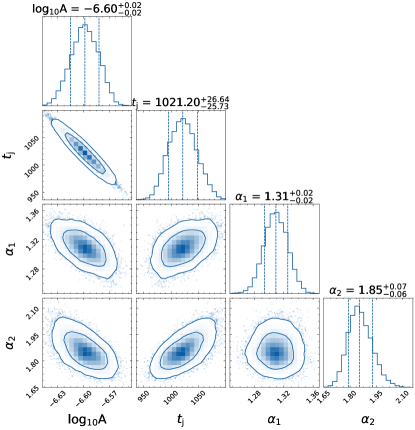
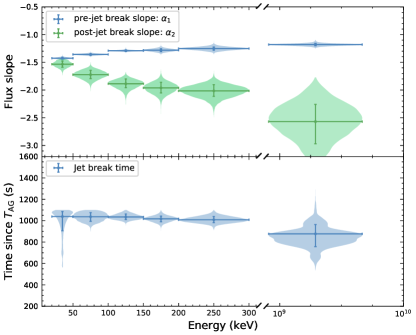
The pre-break, post-break, and break time parameters in the keV-MeV and TeV energy band are shown in Fig.7 with error bars of 1 uncertainty. Interestingly, the break time is well-consistent among all energy bands. Fitting the light curve in 50-300 keV yields the break time = + 1021 s. We note that this break time derived in the present work is consistent with the results given by the joint analysis of Insight-HXMT/HE and GECAM-C ( s in 20-200 keV) (An et al., 2023). Our result is also supported by a recent independent study with Fermi/GBM data only (Zhang et al., 2023). Furthermore, we also fit the flux light curve in TeV energy band from + 100 s to + 3000 s (ignored time range of s to avoid potential contamination from the flare) using BPL model. The flux decay slopes and break time are consistent with LHAASO-Collaboration et al. (2023) within 3 uncertainty, as shown in Fig.7.
We note that the break time seems to have a marginal dependence on the energy band. We testify this possible dependence by fitting the break time as a function of energy with the PL model and constant model respectively. The (-) of these two models is only -1.1, meaning that there is no statistical evidence for the energy dependence of the break time. Consequently, we conclude that the break time remains constant in the very wide energy band from keV to TeV, provides compelling evidence for the origin of jet break. Interestingly, we find that the light curve decay slope varies with energy from keV to TeV in an opposite way: the pre-jet break slope increases with energy, while the post-jet break slope decreases with energy, as shown in Fig.7.
| Energy band (keV) | BPL | PL | BIC | ||||||
| slope () | break time () ∗ (s) | slope () | /d.o.f | BICBPL | slope() | /d.o.f | BICPL | ||
| 20-50 | 1.43 | 1047 | 1.54 | 26.47/23 | 39.65 | 1.45 | 34.29/25 | 40.88 | -1.23 |
| 50-100 | 1.36 | 1036 | 1.72 | 23.84/23 | 37.02 | 1.41 | 76.99/25 | 83.58 | -46.56 |
| 100-150 | 1.29 | 1035 | 1.89 | 28.48/23 | 41.66 | 1.32 | 190.81/25 | 197.40 | -155.74 |
| 150-200 | 1.28 | 1018 | 1.96 | 23.24/23 | 36.42 | 1.41 | 76.75/25 | 83.34 | -46.92 |
| 200-300 | 1.25 | 1008 | 2.02 | 16.63/23 | 29.81 | 1.40 | 71.22/25 | 77.81 | -48.00 |
| 50-300 | 1.31 | 1021 | 1.85 | 19.79/23 | 32.97 | 1.40 | 66.03/25 | 72.62 | -39.65 |
∗ The break time () is relative to afterglow starting time = +225 s.
BIC= BICBPL - BICPL.
Following the calculation in An et al. (2023), the jet opening angle can be inferred with (Zhang, 2018):
| (6) | ||||
Considering the measured jet break time , and redshift , we derive a jet opening angle of , where is the ratio between isotropic -ray and isotropic kinetic energies, and is the ambient number density in units of , which are left as free parameters.
4 Discussion and Conclusion
GRB 221009A is the Brightest Of All Time (BOAT) gamma-ray burst ever detected. In this letter, we report a comprehensive temporal and spectral analysis on its early afterglow in the keV-MeV energy band (20 keV - 20 MeV) from +660 s to +1860 s with combined observation data from Insight-HXMT, GECAM-C and Fermi/GBM.
We find that the spectrum of early afterglow in 20 keV - 20 MeV can be well described with the CPL+PL model, where the CPL and PL dominate the low-energy and high-energy bands respectively. Both the CPL (30 keV) and the PL photon index (1.8) seem generally stable from +660 s to +1860 s. We also note that the CPL and low energy photon indices are broadly consistent with the later afterglow results (=33.6 keV, =1.7 @ +4.2 ks) within the error (Williams et al., 2023, Table.1 & Table.2). Due to the relatively large error on , it is unclear whether and how the evolves with time. Furthermore, the high energy PL component may also be detected by Swift/BAT in later afterglow, because the spectrum residual ratio shows clear evidence for the existence of an excess in Swift/BAT energy band (Williams et al., 2023, the right panel of Fig.5).
This CPL+PL spectrum shape is very unusual in GRB afterglow since the synchrotron radiation mechanism usually gives rise to a Band shape or power-law shape spectrum. But the GRB 221009A early afterglow shows a ”V” shape spectrum above 20 keV. Indeed, this kind of spectrum shape was also reported in GRB 990123 afterglow (Corsi et al., 2005; Maiorano et al., 2005). However, the high-energy spectrum from GRB 990123 afterglow was only detected up to 60 keV and at a relatively later time (from 20 min to 60 min after the GRB trigger), while the early afterglow of GRB 221009A was measured in an extremely wide band (including keV, MeV, GeV, and TeV energy band) and at a very early stage (immediately after the prompt emission and flare episode) (e.g. An et al., 2023; Lesage et al., 2023; LHAASO-Collaboration et al., 2023; Zhang et al., 2023). Further promoted by the exceptional brightness of this GRB, the detailed and accurate measurement of the early afterglow spectrum of GRB 221009A is truly unprecedented in GRB observation history. The origin of this early afterglow spectrum is intriguing and subject to further studies.
For the refined spectral analysis with a shorter time bin, a single PL model can describe well in 20-300 keV energy band, based on which we estimate the flux light curves in five energy bands. The PL photon index ( -2.1) is in good agreement with Swift/BAT results (=-2.08 @ +3302 +4538 s)(Williams et al., 2023).
Although the wide band (from 20 keV to 20 MeV) spectral shape (CPL+PL) of the early afterglow did not change significantly, the spectral hardness experienced a pre-break hardening and post-break softening (Fig. 4), which is somewhat consistent with the spectral evolution in the TeV energy band (LHAASO-Collaboration et al., 2023, Fig. 3).
A significant and achromatic break is found at = + 1021 s in the 50-300 keV light curve of early afterglow, supporting that this is a jet break. Remarkably, this jet break time in 50-300 keV is well consistent with that in TeV energy band (LHAASO-Collaboration et al., 2023). More interestingly, we find that the pre-break and post-break slopes of the flux light curve vary with energy (from keV to TeV) clearly. These two slopes become closer as energy decreases, making the break less identifiable in the low energy band. Remarkably, our results show that the pre-break and post-break slopes tend to converge to a value of about -1.5 in the low energy band (20-50 keV), which is well consistent with the pre-break slope of -1.498 reported in the soft X-ray energy band (0.3-10 keV) (Williams et al., 2023). We therefore suggest that this jet break feature may disappear in the lower energy band (i.e. soft X-ray and even lower energy band), thus forming an apparent peculiar break feature. Although the observations of a break in the X-ray but not in the optical energy band have been reported (Panaitescu et al., 2006; Racusin et al., 2008), here for the first time, we reveal the detailed transition from the break feature in higher energy to the non-break in lower energy. On the other hand, the energy-dependent slopes before and after the jet break are not expected from the ideal top-hat jet model (Zhang, 2018), thus this observation strongly disfavors the simple top-hat jet model and calls for a more sophisticated jet structure and new physics involved.
We note that, compared to our finding of the jet break at an early time ( + 1021 s), there are several breaks in later time reported in the multi-wavelength observation of GRB 221009A afterglow. For example, a break at 7.9 s is reported in the soft X-ray light curve(Williams et al., 2023), while an achromatic break at 0.6 day is claimed in the optical bands (Shrestha et al., 2023). While these breaks are measured in a relatively limited energy band, our jet break reported here is seen in a very wide energy band from keV to TeV band. We also note that, for our jet break, the post-break slope in high energy band (200-300 keV) is close to -2, which is expected by the afterglow theory (Zhang et al., 2006), while the post-break slope in soft X-ray and optical is much shallower than theory expectation (Williams et al., 2023; Shrestha et al., 2023). Moreover, the jet break at a much earlier time indicates a very narrow jet core which is well concordant with the extremely luminous of the GRB.
5 Summary
In this work, we have performed an unprecedented and detailed temporal and spectral analysis of the early afterglow (from +660 s to +1860 s) of the Brightest Of All Time (BOAT) GRB 221009A in X/-ray energy band with joint observation of GECAM-C, Fermi/GBM and Insight-HXMT. We discovered many features in the early afterglow of this exceptional burst, including unusual spectrum (CPL+PL, basically a V-shape from 20 keV to 20 MeV), achromatic jet break time (from keV to TeV) and energy-dependent flux decay slopes before and after the jet break, etc. We point out that these observational features and properties may set a new benchmark for GRBs, thanks to the exceptional brightness and observation coverage of this GRB 221009A. We argue that these results strongly disfavor the simple top-hat jet model but provide support to the structured jet scenario with a bright narrow core. This is also consistent with the statistical analysis results by comparing GRB 221009A with the entire GRB sample (Lan et al., 2023). In this structured jet model, the narrow jet core with ultra-relativistic Lorentz factor should be surrounded by a wider jet with a lower Lorentz factor, leading to complicated temporal and spectral features (e.g. Panaitescu et al., 2006; Racusin et al., 2008). A joint analysis of the early and late afterglow of GRB 221009A could further deepen our understanding of GRB and jet physics. (e.g. Ren et al., 2023; Sato et al., 2023; O’Connor et al., 2023; Gill & Granot, 2023; Zhang et al., 2023).
Acknowledgments
The authors thank the support from the National Key R&D Program of China (Grant No. 2021YFA0718500), the Strategic Priority Research Program of Chinese Academy of Sciences (Grant No. XDA15360102, XDA15360300, XDA15052700), the National Natural Science Foundation of China (Grant No. 12273042, 12273043, U2038106 12173038, ), the Science Foundation of Hebei Normal University (No. L2023B11).
The GECAM (Huairou-1) mission is supported by the Strategic Priority Research Program on Space Science of the Chinese Academy of Sciences. This work made use of the data from the Insight-HXMT mission, a project funded by the China National Space Administration (CNSA) and the Chinese Academy of Sciences (CAS). We appreciate the GECAM and Insight-HXMT teams. We acknowledge the public data and software from Fermi/GBM. We appreciate helpful discussions with Zhen Cao, Min Zha, Bing Zhang, Xiangyu Wang, Zigao Dai, Binbin Zhang, Yongfeng Huang, Yunwei Yu, Sarah Antier and Eric Burns. We appreciate the valuable comments and suggestions from anonymous referee.
References
- Abbott et al. (2017) Abbott, B. P., Abbott, R., Abbott, T. D., et al. 2017, ApJ, 848, L13, doi: 10.3847/2041-8213/aa920c
- An et al. (2023) An, Z.-H., et al. 2023. https://arxiv.org/abs/2303.01203
- Arnaud (1996) Arnaud, K. 1996, in Astronomical Data Analysis Software and Systems V, ASP Conference Series, Vol. 101, 1996, George H. Jacoby and Jeannette Barnes, eds., p. 17., Vol. 101, 17
- Bissaldi et al. (2009) Bissaldi, E., Kienlin, A. V., Lichti, G., et al. 2009, Experimental Astronomy, 24, 47
- Burns et al. (2023) Burns, E., et al. 2023, Astrophys. J. Lett., 946, L31, doi: 10.3847/2041-8213/acc39c
- Corsi et al. (2005) Corsi, A., Piro, L., Kuulkers, E., et al. 2005, Astronomy & Astrophysics, 438, págs. 829
- de la Cruz-Dombriz et al. (2016) de la Cruz-Dombriz, A., Dunsby, P. K. S., Luongo, O., & Reverberi, L. 2016, JCAP, 12, 042, doi: 10.1088/1475-7516/2016/12/042
- de Ugarte Postigo et al. (2022) de Ugarte Postigo, A., Izzo, L., Pugliese, G., et al. 2022, GRB Coordinates Network, 32648, 1
- Dichiara et al. (2022) Dichiara, S., Gropp, J. D., Kennea, J. A., et al. 2022, GRB Coordinates Network, 32632, 1
- Eichler et al. (1989) Eichler, D., Livio, M., Piran, T., & Schramm, D. N. 1989, Nature, 340, 126
- Foreman-Mackey et al. (2013) Foreman-Mackey, D., Hogg, D. W., Lang, D., & Goodman, J. 2013, Publications of the Astronomical Society of the Pacific, 125, 306
- Frederiks et al. (2023) Frederiks, D., et al. 2023, Astrophys. J. Lett., 949, L7, doi: 10.3847/2041-8213/acd1eb
- Gao et al. (2013) Gao, H., Lei, W.-H., Zou, Y.-C., Wu, X.-F., & Zhang, B. 2013, New A Rev., 57, 141, doi: 10.1016/j.newar.2013.10.001
- Gill & Granot (2023) Gill, R., & Granot, J. 2023. https://arxiv.org/abs/2304.14331
- Goldstein et al. (2022) Goldstein, A., Cleveland, W. H., & Kocevski, D. 2022, Fermi GBM Data Tools: v1.1.1. https://fermi.gsfc.nasa.gov/ssc/data/analysis/gbm
- Kann et al. (2023) Kann, D. A., et al. 2023, Astrophys. J. Lett., 948, L12, doi: 10.3847/2041-8213/acc8d0
- Lan et al. (2023) Lan, L., et al. 2023, Astrophys. J. Lett., 949, L4, doi: 10.3847/2041-8213/accf93
- Laskar et al. (2023) Laskar, T., et al. 2023, Astrophys. J. Lett., 946, L23, doi: 10.3847/2041-8213/acbfad
- Lesage et al. (2023) Lesage, S., et al. 2023. https://arxiv.org/abs/2303.14172
- Levan et al. (2023) Levan, A. J., et al. 2023, Astrophys. J. Lett., 946, L28, doi: 10.3847/2041-8213/acc2c1
- LHAASO-Collaboration et al. (2023) LHAASO-Collaboration, Cao, Z., Aharonian, F., et al. 2023, Science, 0, eadg9328, doi: 10.1126/science.adg9328
- Li et al. (2020) Li, X., Li, X., Tan, Y., et al. 2020, Journal of High Energy Astrophysics, 27, 64, doi: 10.1016/j.jheap.2020.02.009
- Li et al. (2023) Li, X. F., Liu, C. Z., Zhang, Y. F., et al. 2023, Radiation Detection Technology and Methods, 7, 3
- Liang et al. (2008) Liang, E.-W., Racusin, J. L., Zhang, B., Zhang, B.-B., & Burrows, D. N. 2008, Astrophys. J., 675, 528, doi: 10.1086/524701
- Liao et al. (2023) Liao, J.-Y., Zhang, S., Zhang, J., et al. 2023, arXiv e-prints, arXiv:2302.14459, doi: 10.48550/arXiv.2302.14459
- Liu et al. (2022) Liu, J.-C., Zhang, Y.-Q., Xiong, S.-L., et al. 2022, GRB Coordinates Network, 32751, 1
- Maiorano et al. (2005) Maiorano, E., Masetti, N., Palazzi, E., Frontera, F., & Zand, J. J. M. I. T. 2005, Astronomy and Astrophysics, 438
- Malesani et al. (2023) Malesani, D., Levan, A., Izzo, L., et al. 2023, arXiv preprint arXiv:2302.07891
- Malesani et al. (2023) Malesani, D. B., Levan, A. J., Izzo, L., et al. 2023, arXiv e-prints, arXiv:2302.07891, doi: 10.48550/arXiv.2302.07891
- Meegan et al. (2009) Meegan, C., Lichti, G., Bhat, P. N., et al. 2009, The Astrophysical Journal, 702, 791
- Narayan et al. (1992) Narayan, R., Paczyński, B., & Piran, T. 1992, Gamma-ray bursts as the death throes of massive binary stars, arXiv
- Neath & Cavanaugh (2012) Neath, A. A., & Cavanaugh, J. E. 2012, Wiley Interdisciplinary Reviews: Computational Statistics
- Negro et al. (2023) Negro, M., et al. 2023, Astrophys. J. Lett., 946, L21, doi: 10.3847/2041-8213/acba17
- O’Connor et al. (2023) O’Connor, B., et al. 2023. https://arxiv.org/abs/2302.07906
- Panaitescu & Kumar (2003) Panaitescu, A., & Kumar, P. 2003, AIP Conf. Proc., 662, 305, doi: 10.1063/1.1579365
- Panaitescu et al. (2006) Panaitescu, A., Meszaros, P., Burrows, D. N., et al. 2006, Mon. Not. Roy. Astron. Soc., 369, 2059, doi: 10.1111/j.1365-2966.2006.10453.x
- Racusin et al. (2008) Racusin, J. L., Karpov, S. V., Sokolowski, M., & Granot, J. 2008, Nature, 455, 183
- Rees & Meszaros (1994) Rees, M. J., & Meszaros, P. 1994, Astrophys. J. Lett., 430, L93, doi: 10.1086/187446
- Ren et al. (2023) Ren, J., Wang, Y., Zhang, L.-L., & Dai, Z.-G. 2023, Astrophys. J., 947, 53, doi: 10.3847/1538-4357/acc57d
- Rodi & Ubertini (2023) Rodi, J., & Ubertini, P. 2023. https://arxiv.org/abs/2303.16943
- Sato et al. (2023) Sato, Y., Murase, K., Ohira, Y., & Yamazaki, R. 2023, Mon. Not. Roy. Astron. Soc., 522, L56, doi: 10.1093/mnrasl/slad038
- Shrestha et al. (2023) Shrestha, M., et al. 2023, Astrophys. J. Lett., 946, L25, doi: 10.3847/2041-8213/acbd50
- Veres et al. (2022) Veres, P., Burns, E., Bissaldi, E., et al. 2022, GRB Coordinates Network, 32636, 1
- Wang & Xiong (2023) Wang, C.-W., & Xiong, S.-L. 2023, In Preparation
- Wang et al. (2018) Wang, X.-G., Zhang, B., Liang, E.-W., et al. 2018, Astrophysical Journal, 859, 160
- Williams et al. (2023) Williams, M. A., Kennea, J. A., Dichiara, S., et al. 2023, The Astrophysical Journal Letters, 946, L24
- Woosley (1993) Woosley, S. E. 1993, The Astrophysical Journal, 405, 273
- Woosley & Bloom (2006) Woosley, S. E., & Bloom, J. S. 2006, ARA&A, 44, 507, doi: 10.1146/annurev.astro.43.072103.150558
- Xue et al. (2023) Xue, W.-C., et al. 2023, Astrophys. J. Suppl., 264, 5, doi: 10.3847/1538-4365/ac9f16
- You et al. (2021) You, Y., Liao, J.-Y., Zhang, S.-N., et al. 2021, ApJS, 256, 47, doi: 10.3847/1538-4365/ac16db
- Zhang (2018) Zhang, B. 2018, The Physics of Gamma-Ray Bursts, doi: 10.1017/9781139226530
- Zhang et al. (2006) Zhang, B., Fan, Y., Dyks, J., et al. 2006, The Astrophysical Journal, 642, 354
- Zhang et al. (2023) Zhang, B., Wang, X.-Y., & Zheng, J.-H. 2023. https://arxiv.org/abs/2311.14180
- Zhang & Yan (2011) Zhang, B., & Yan, H. 2011, ApJ, 726, 90, doi: 10.1088/0004-637X/726/2/90
- Zhang et al. (2023) Zhang, D.-L., Zheng, C., Liu, J.-C., et al. 2023, arXiv e-prints, arXiv:2303.00537, doi: 10.48550/arXiv:2303.00537
- Zhang et al. (2023) Zhang, H.-M., Huang, Y.-Y., Liu, R.-Y., & Wang, X.-Y. 2023. https://arxiv.org/abs/2307.12623
- Zhang et al. (2018) Zhang, S., Zhang, S. N., Lu, F. J., et al. 2018, in Society of Photo-Optical Instrumentation Engineers (SPIE) Conference Series, Vol. 10699, Space Telescopes and Instrumentation 2018: Ultraviolet to Gamma Ray, ed. J.-W. A. den Herder, S. Nikzad, & K. Nakazawa, 106991U, doi: 10.1117/12.2311835
- Zhang et al. (2020) Zhang, S.-N., Li, T., Lu, F., et al. 2020, Science China Physics, Mechanics, and Astronomy, 63, 249502, doi: 10.1007/s11433-019-1432-6
- Zhang et al. (2023) Zhang, Y.-Q., Xiong, S.-L., Qiao, R., et al. 2023, arXiv e-prints, arXiv:2303.00698, doi: 10.48550/arXiv:2303.00698
- Zheng et al. (2023) Zheng, C., An, Z.-H., Peng, W.-X., et al. 2023, arXiv e-prints, arXiv:2303.00687, doi: 10.48550/arXiv:2303.00687