An Interpretable Deep-Learning Framework for Predicting Hospital Readmissions From Electronic Health Records
Abstract
With the increasing availability of patients’ data, modern medicine is shifting towards prospective healthcare. Electronic health records contain a variety of information useful for clinical patient description and can be exploited for the construction of predictive models, given that similar medical histories will likely lead to similar progressions. One example is unplanned hospital readmission prediction, an essential task for reducing hospital costs and improving patient health. Despite predictive models showing very good performances especially with deep-learning models, they are often criticized for the poor interpretability of their results, a fundamental characteristic in the medical field, where incorrect predictions might have serious consequences for the patient health. In this paper we propose a novel, interpretable deep-learning framework for predicting unplanned hospital readmissions, supported by NLP findings on word embeddings and by neural-network models (ConvLSTM) for better handling temporal data. We validate our system on the two predictive tasks of hospital readmission within 30 and 180 days, using real-world data. In addition, we introduce and test a model-dependent technique to make the representation of results easily interpretable by the medical staff. Our solution achieves better performances compared to traditional models based on machine learning, while providing at the same time more interpretable results.
Keywords Prospective Healthcare Readmission Prediction Electronic Health Records Deep Learning Word Embeddings
1 Introduction
Thanks to the availability of a huge amount of data regarding already treated individuals, modern medicine is recently moving towards prospective healthcare, whose goal is to determine the risk for individuals to develop specific diseases, detect and prevent them as soon as possible, and thus provide maximum benefit [1]. Indeed, healthcare data allow to predict health risks for patients with higher accuracy, thus lowering hospitalization costs and improving the effectiveness of medical treatments. Electronic Health Records (EHRs) are among the richest sources of health information. Their usage is steadily growing, with the adoption of EHRs by office-based physicians in the U.S. reaching 88% in 2021 [2]. EHRs are composed of medical episodes, each containing various data of a patient, such as demographic information, diagnoses, clinical notes and more; each episode is associated with a timestamp, thus making it time-dependent. Since diseases tend to form clusters—determined by comorbidity [3]—EHRs can be used for different tasks related to prospective healthcare, such as heart failure prediction [4], suicide risk stratification [5] or general disease prediction of the next diagnoses [6]. However, the information contained in EHRs is also very heterogeneous in nature: the presence of clinical codes (e.g., ICD-9 codes) and datetime objects (e.g., time of discharge) makes EHRs rather challenging [7].
One of the many applications of prospective healthcare is predicting unplanned hospital readmissions; unplanned readmissions consume lots of resources for the hospital, at the same time putting the patient at risk. For example, the U.S. Congress created the Hospital Readmissions Reduction Program [8] to reduce funding for hospitals with excessive readmissions, which is often regarded as a symptom of incorrect treatment or premature discharge [9]. Thanks to the ever-growing amount of clinical data and the constant improvements in the predictive capabilities of deep-learning algorithms, nowadays it is possible to create better decision support systems for predicting hospital readmissions and further reduce patients’ risks. Deep-learning models for healthcare are becoming more and more popular, but at the same time their results are frequently criticized for their lack of interpretability [7]; in the medical field, where incorrect predictions can negatively influence the patients’ health, it is fundamental for predictive models to be sufficiently interpretable for users to understand the rationale behind a decision. Recently, solutions based on Convolutional Neural Networks (CNN) with few layers proved to be accurate in readmission prediction tasks, while at the same time their simple structure leaves room for interpretability analyses [10]. However, CNN are not able to properly assess long-term dependencies, which are particularly important in patients with a long clinical history.
In this paper, we introduce a novel framework for readmission prediction, named ConvLSTM1d, that maintains all the advantages of CNNs while also introducing a memory dimension, thanks to its ConvLSTM architecture based on Long Short-Term Memory (LSTM) to manage long-term dependencies. ConvLSTM1d improves predictions of unplanned hospital readmissions compared to both state-of-the-art methods and traditional models based on machine learning, while providing at the same time interpretable results. Until now, ConvLSTM models have mostly been used in the healthcare field for image segmentation tasks [11, 12], thus making our work the first attempt at leveraging them for tasks of medical prediction. Moreover, we introduce an ad-hoc model-dependent interpretability technique to visualize the prediction results and make them more understandable and easier to read for the medical staff.
This paper is organized as follows: in Section 2 we present works related to our solutions, regarding readmission prediction and interpretability in deep-learning models; in Section 3 we illustrate the architecture of ConvLSTM1d; Section 4 presents experimental and performance results of our model; Section 5 describes the model-dependent technique to make ConvLSTM1d more interpretable; finally, in Section 6 we sum up this work and our contributions.
2 Related Work
Traditional machine learning techniques to analyze data contained in EHRs (e.g., random forest [13] and logistic regression [14]) often require heavy pre-processing and feature engineering. These steps are time-consuming and require extensive user domain knowledge. In recent years, deep-learning techniques have been increasingly adopted for the analysis of EHRs, thanks to the reduced human contribution required [15]. As pointed out in [6], research in disease predictions can be divided into two areas: specific-purpose progress modeling relates to a specific type of disease, requiring heavy use of domain-specific knowledge; general-purpose progress modeling is instead adaptable for a wide range of diseases. We focus on research works from the second category, since our contribution is also general-purpose.
DeepCare [16] is an LSTM-based framework for outcome prediction from EHRs, used to model long-term dependencies in a variety of healthcare tasks. Outcome prediction is a more general task compared to readmission prediction, but very similar in nature. The authors evaluate DeepCare on three tasks: disease progression, intervention recommendation and readmission prediction (within 3 and 12 months).
Doctor AI [6] is another framework for outcome prediction, based instead on a Recurrent Neural Network (RNN). Predictions of future diagnoses and medications are made by first taking, from the EHR, temporally-ordered codes for past diagnoses and medications, and then converting them into word embeddings to add a semantic dimension. Doctor AI introduces a Top-K recall to mimic the behavior of doctors who would make a list of the K most likely future diagnoses and medications.
The authors of [9] present a framework specifically designed to predict unplanned readmissions within 30 days from ICU discharge. This system uses a large amount of patient data extracted from the MIMIC III database [17]. The proposed model is based on LSTMs, to better handle time series data. In particular, the authors present a preliminary study to analyze and compare a bidirectional LSTM, a LSTM+CNN, and combinations of various features such as word embedding layers. The best performances are obtained by an LSTM+CNN architecture using all the available data. At the time the paper was published, this type of architecture was very new, thus their results do not deviate much from a simple logistic regression, leaving room for improvement.
Finally, Deepr is yet another framework to solve outcome prediction tasks with EHRs [10]. Not only it obtains accurate results, but it also represents a first attempt at creating an interpretable model that detects hidden relationships within the data, showing that interpretable deep learning has great potential in medical informatics. Deepr is based solely on a CNN, unlike other frameworks which use RNNs and LSTMs. Despite a simple architecture, they find space for an embedding layer based on word2vec. Moreover, the authors suggests that a convolutional layer is fundamental to determine the co-occurrence of diagnosis and procedures.
In the works previously presented, pre-trained embeddings are included to provide an additional layer for powerful semantic representations of medical concepts. Models such as word2vec [18, 19] can be trained on specific domains such as healthcare to increase the accuracy of the word embeddings they produce. In this context, the choice of the training data is crucial for obtaining good performance [20]. For instance, [21] introduces a pre-trained embedding model for representing medical concepts, based on word2vec and trained on a dataset containing information of over 4 million patients. The generated vector space includes ICD-9-CM diagnoses and procedures codes, as well laboratory and drug codes from other medical dictionaries.
Finally, the concept of interpretability is widely debated within the scientific community, and it largely depends on the task and context considered [22]. In this paper, we consider as “interpretable” a model for which the reasons that led to a certain decision are made clear and accessible. LIME (Local Interpretable Model-agnostic Explanations) [23] is an example of a framework to make classifiers and regressors more interpretable and reliable. LIME is very flexible and can be used for different types of input, such as images or text. Recent works from the literature, such as [24], studied the interpretability of CNNs applied to text, showing the limits of the traditional approaches that use convolutional filters as n-gram detectors, and a subsequent max-pooling layer to select the most relevant n-grams. As for outcome prediction for EHRs with neural networks, [25] implements an easily interpretable model for predicting unplanned readmissions. Similar to the Deepr framework, this classifier is based on a simple CNN network, which offers relatively average performance but, on the other hand, can be easily interpreted.
3 ConvLSTM1d
The structural choices that motivated our research, called ConvLSTM1d, are partly ascribable to the limitations highlighted by the authors of the system presented in [10], i.e., the best-performing readmission prediction framework present in literature when we started working on this task: “There are rooms for future work. First, long-term dependencies are simply captured through a max-pooling operation. This is rather simplistic due to a complex dynamic between care processes and disease processes. A better model should pool information that is time-sensitive (e.g., recent events are more important to distant ones).”
Based on these statements, we came up with the following two solutions:
-
•
Structure medical records in a new way, in order to take care of event timing.
-
•
Use a new model based on an LSTM architecture that is able to exploit this new structure to “understand" long-term dependencies.
Our framework is composed of two main steps: EHR representation and readmission prediction.
3.1 EHR Representation
The EHR representation is a crucial part of our methodology. The input of this phase is a data source in which each line uniquely corresponds to a hospital admission, and at the end of this phase the system returns a structured representation of the medical information to be used by the predictive algorithm. To predict a future readmission, the whole patient history plays an important role. To this scope, if an individual has multiple hospital admissions, to construct a useful training set, the patient’s hospitalization at time must consider all the information about previous timestamps. To include information on time intervals, the system computes the time gap between two consecutive admissions. We define five possible intervals: 0-1 month, 1-3 months, 3-6 months, 6-12 months, more than 12 months.
Each hospitalization is described by a series of diagnoses and procedures, encoded inside the dataset using ICD-9-CM codes, an international classification system for diseases, injuries, surgeries, and diagnostic and therapeutic procedures.111https://www.cdc.gov/nchs/icd/icd9cm.htm The following sequence of codes shows the example of a new admission of a patient with three prior admissions in her/his medical history; please note in italic the codes representing the time gaps between one admission and the next one.
1910 Z83 911 1008 D12 K31 1-3m R94 H53 Y83 M62 Y92 E87 T81 1893 D12 S14 738 1910 Z83 0-1m T91 Y83 Y92 K91 M10 E86 6-12m K31 1008 1910 Z13 Z83
The ICD-9-CM codes of each patient record are randomly shuffled within each admission. The reasons are two: (i) given a single admission, there is no temporal order of the codes within the dataset; (ii) as introduced in [10], shuffling allows to capture many more potential clinical motifs and learn more combinations of codes.
Differently from the readmission prediction frameworks available in the literature, a crucial property of our system is the capability of understanding long-term dependencies, which are of paramount importance to identify patterns in subsequent hospital admissions. To achieve this goal, we now present a novel representation of EHRs. In our framework, data are organized in the following way: each patient hospital admission takes into account, in a cumulative way, also the previous admissions. The latter, however, are divided according to the time order in which they happened. Not only we consider the time gaps between two consecutive admissions, but, contrary to other methods, we also include this piece of information in a separate vector.
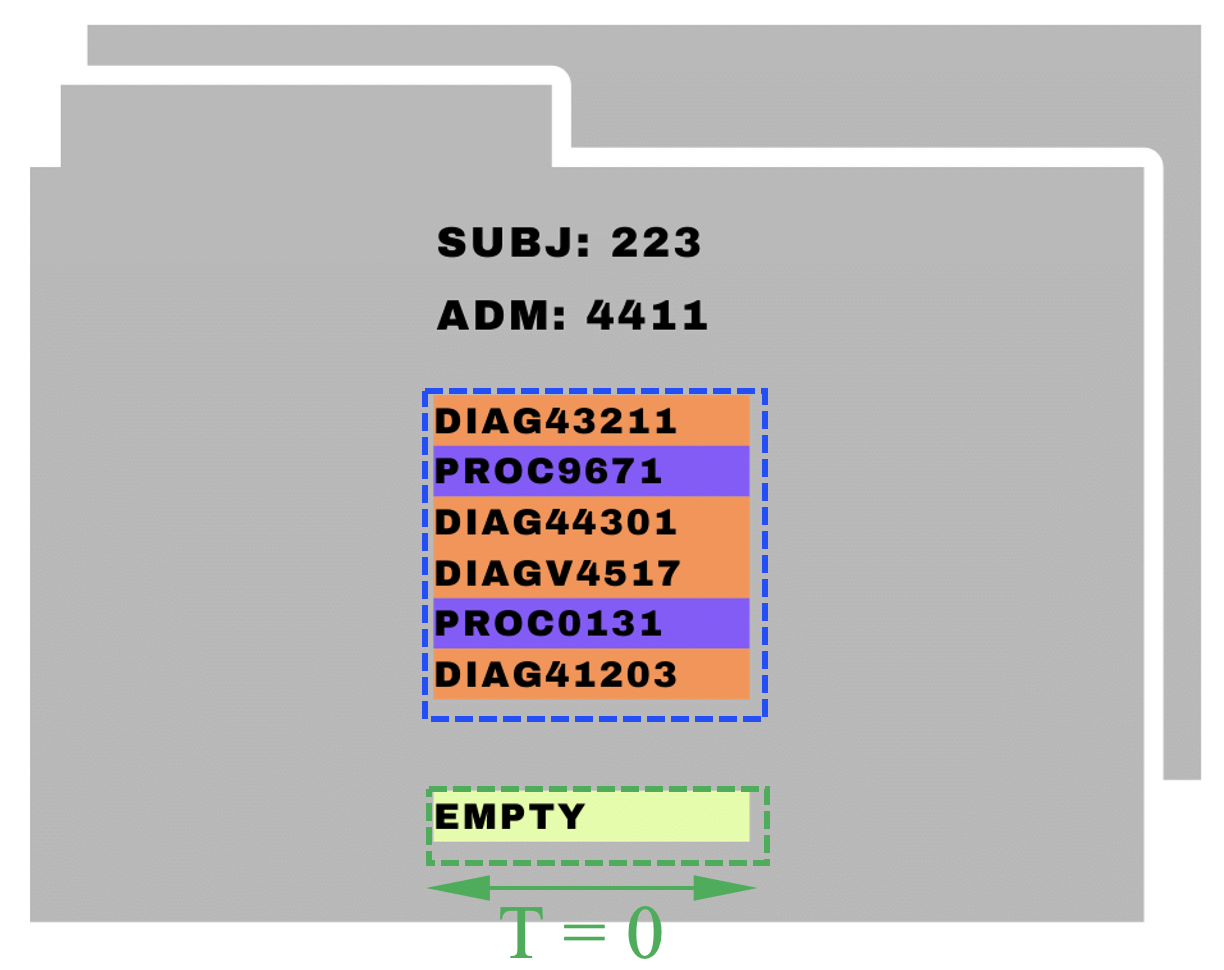
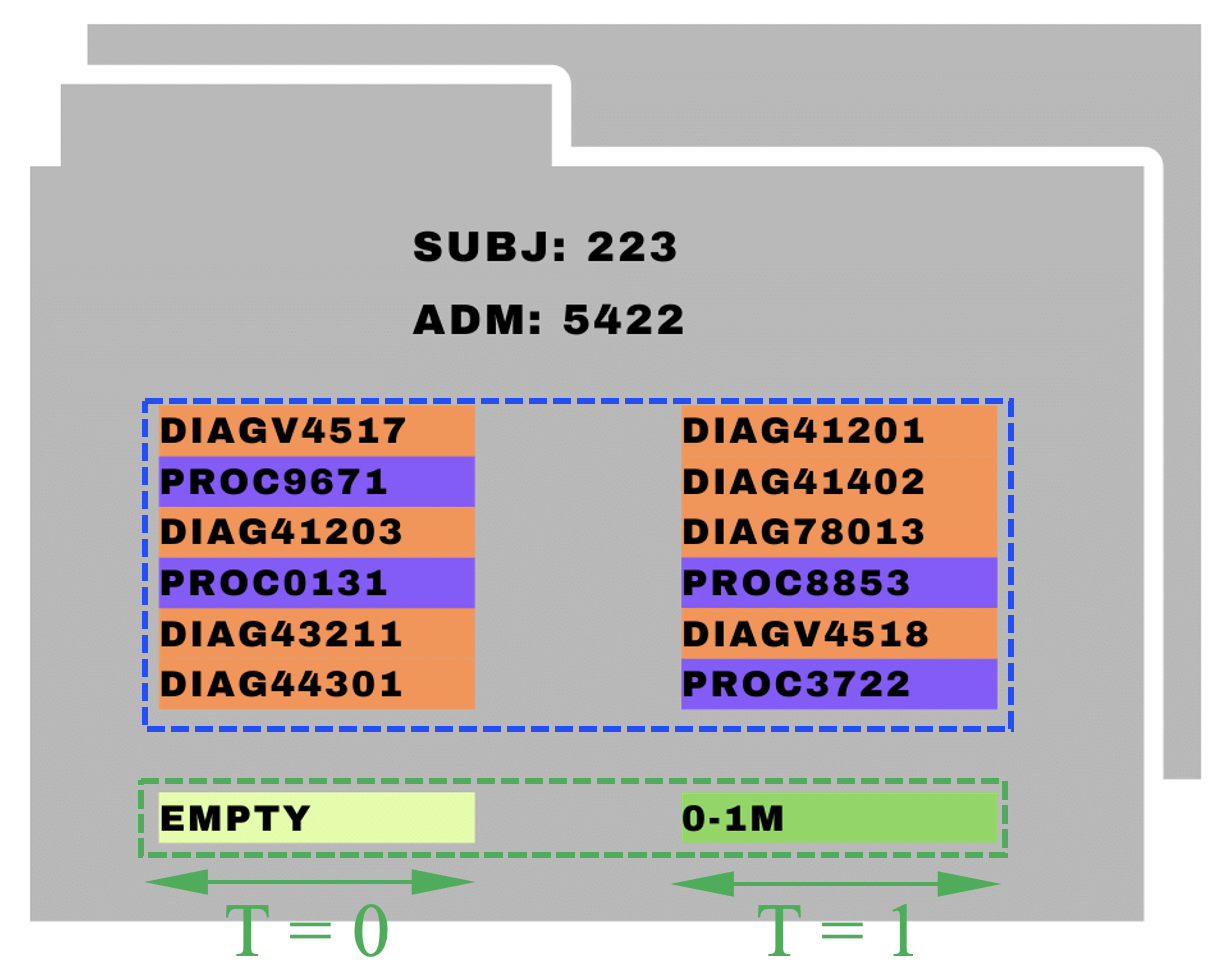
For greater clarity, in Fig. 1 we display an example of how we represent admissions extracted from EHRs. Surrounded by a blue dashed line, the vector relative to the codes contained in all the admissions undergone by the patient up to that point in time. The green dashed lines surround the vectors related to the time gaps between two admissions. The first value is always “empty” as it is relative to the patient’s first admission.
Structuring the medical records in this way allows to take into account all the admissions related to the patient with the corresponding codes, without the necessity to make any split of the past data typically using a sliding window. This, along with the deep-learning architecture we use, allows us to correctly assess the contribution of past events on future hospital readmissions.
Last but not least, the adopted EHR representation is flexible and allows to exploit also further medical information in the prediction process: for each new set of data that we want to use, it would be enough to encode them in another vector, taking into account the time order. An example could be the addition of drugs administered in each admission, or data regarding the age or weight of the patient for each past admission. Currently, since the other state-of-the-art methods do not offer this feature, we limit ourselves to using only procedural and diagnostic data with time gaps.
3.2 Readmission Prediction Model
Our model is based on a neural network that receives as input two distinct vectors, the first containing the temporal succession of hospital admissions (blue dashed box in Fig. 2), the other containing the corresponding time gaps at each admission (red dashed box in Fig. 2). The core of our solution is represented by the Embedding layer and the ConvLSTM architecture.

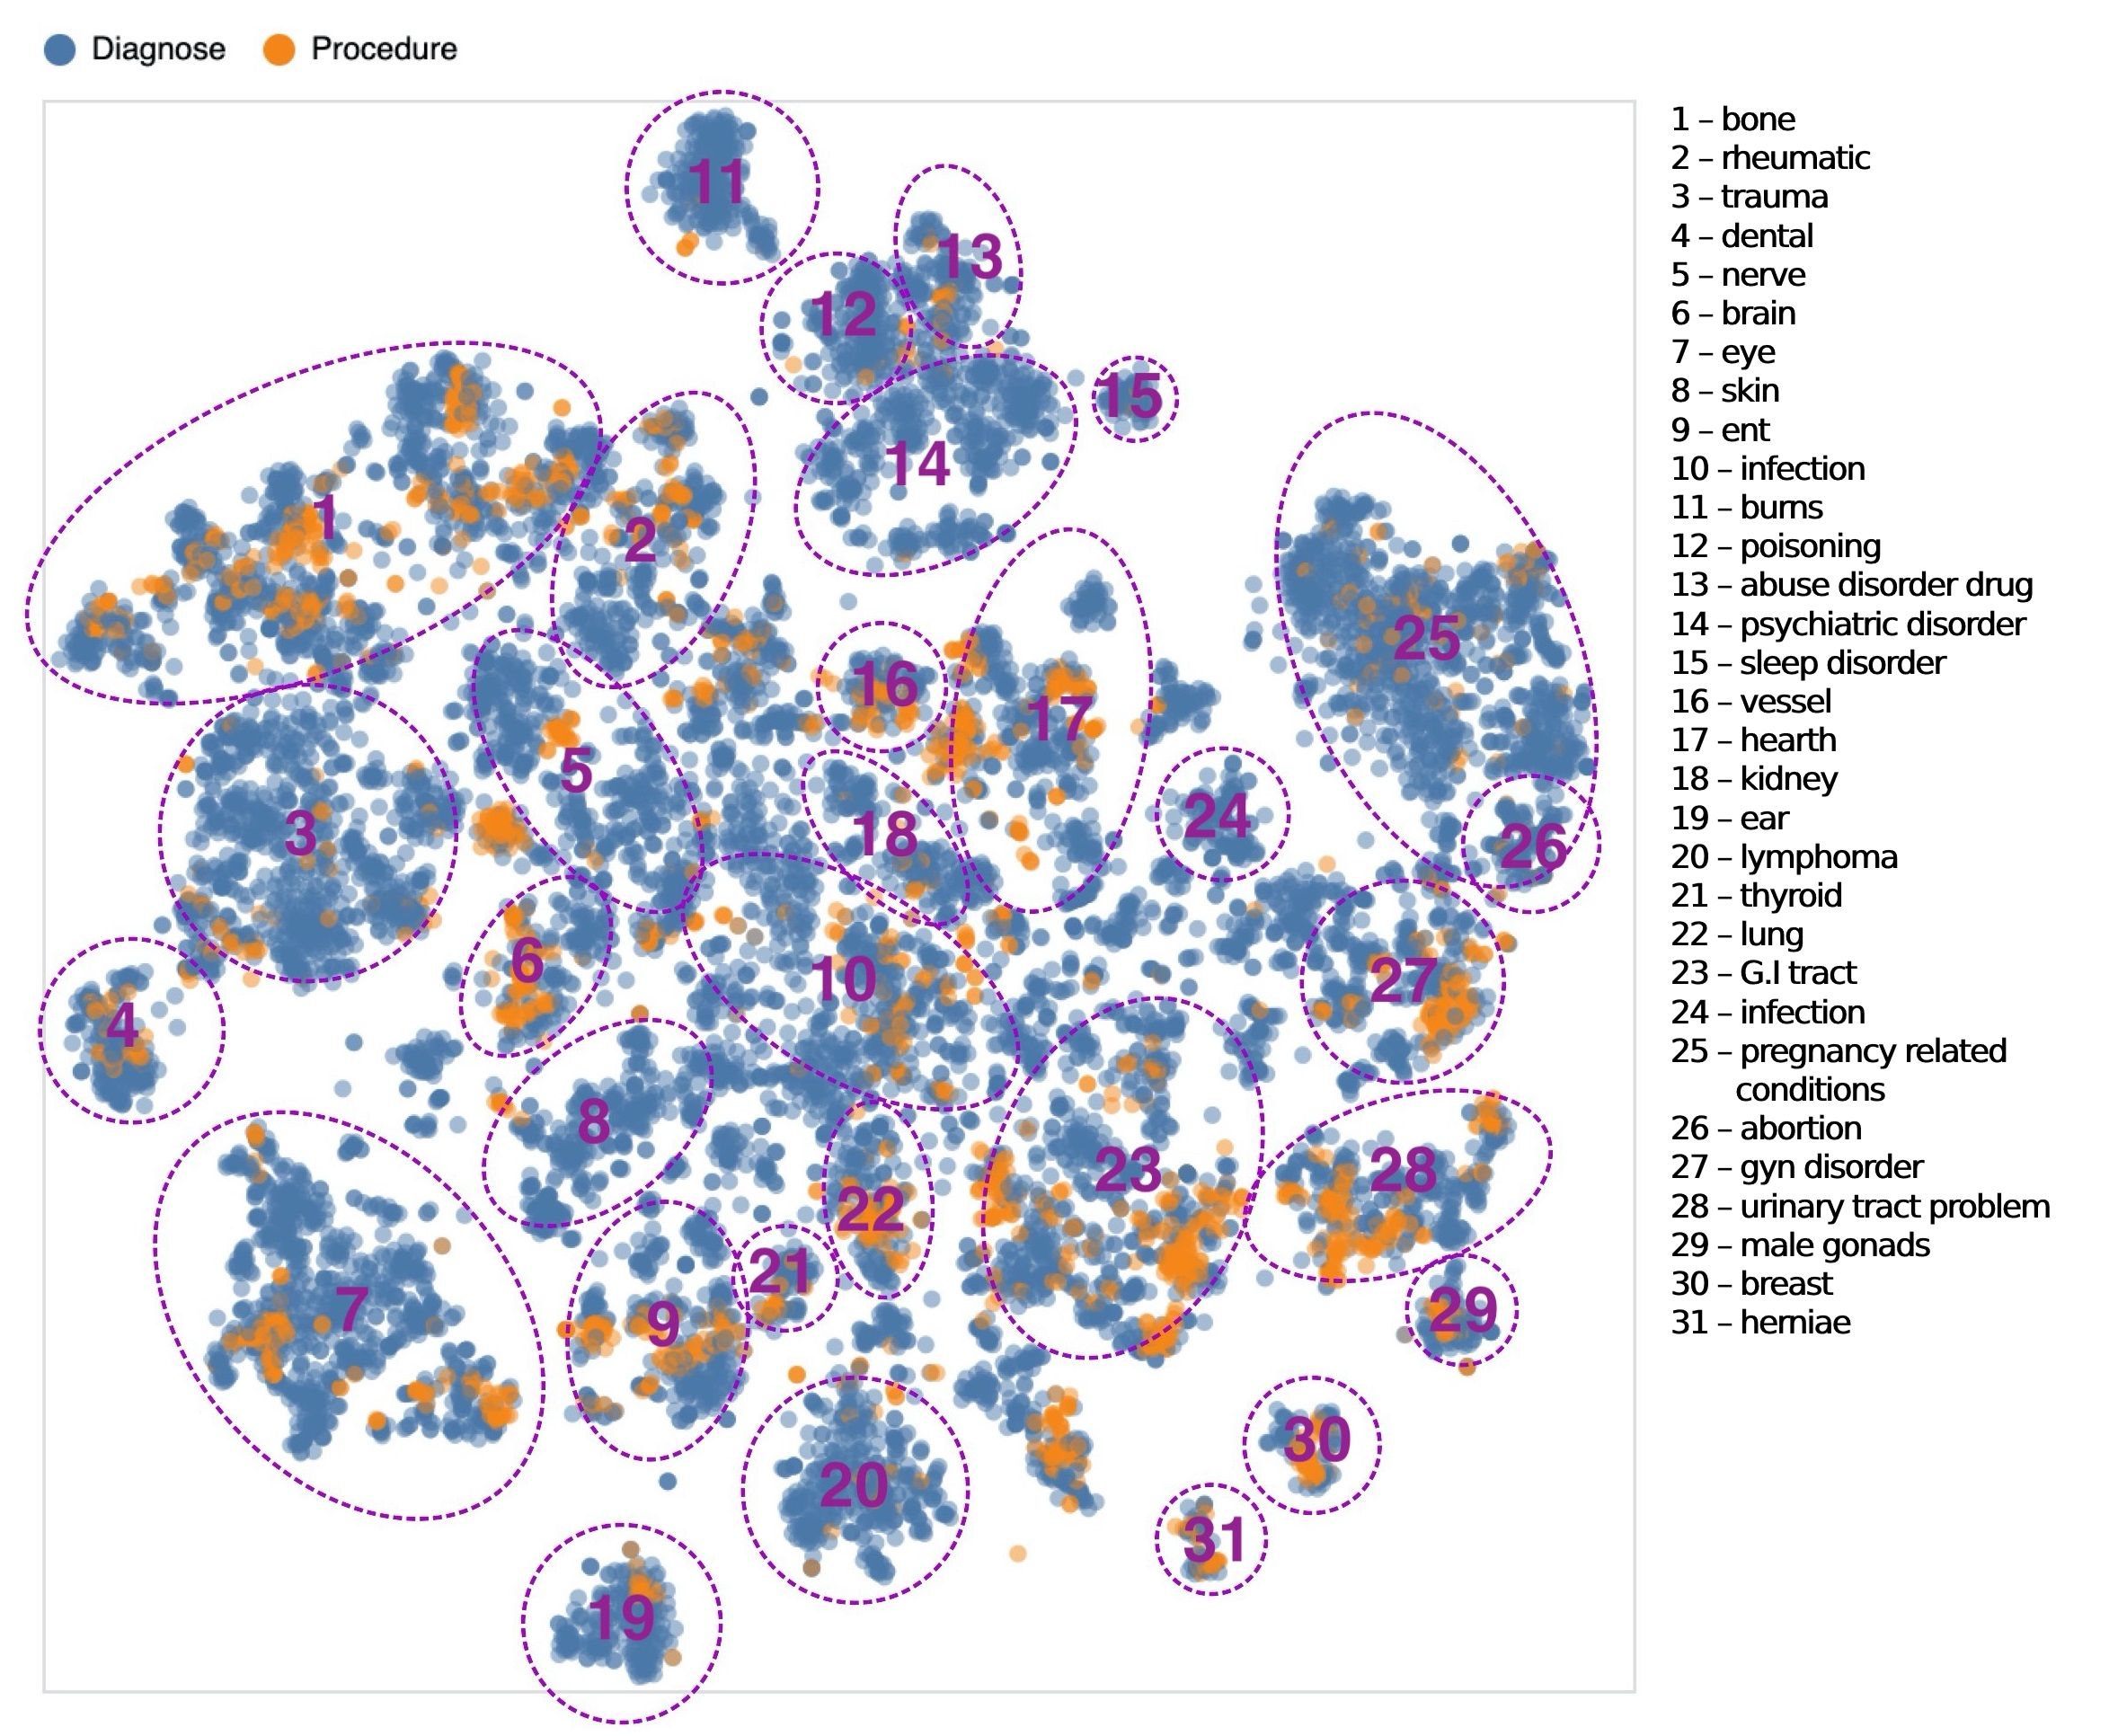
The Embedding layer receives as input a patient’s medical record for a specific admission in the form of temporally divided ICD-9-CM codes, as represented in Fig. 1. At this point, each code is converted into the corresponding unique word embedding vector, allowing us to better represent their semantics. This layer is necessary since computers work with numbers and cannot process strings in their native format. To improve the performance of the system, we opted for a transfer learning approach. Specifically, the pre-trained word embedding was obtained by [21], who used the word2vec model with SkipGram implementation [19] to train on healthcare records of 4 million patients over a time span of 2-4 year. The embedding vectors are 300-dimensional and contain many medical code standards, in our case we use only ICD-9-CM related to diagnoses and procedures. Using dimensionality reduction techniques such as t-SNE [26], it is possible to represent the vectors generated by word embedding in 2 dimensions. This procedure allows to graphically represent the semantically similar vectors as two neighboring points. Fig. 3 shows the result produced, obtained using t-SNE with “cosine similarity” as evaluation metric to estimate the semantic relatedness. In Fig. 3 we show ICD-9-CM codes of both diagnoses and procedures, colored in blue and orange respectively. As we can see from the graph, the interaction space of diagnoses and procedures is very complex, but it is possible to identify clusters defined by a specific medical domain.
After each code has been converted into the corresponding embedding vectors, the ConvLSTM architecture implements the forecasting algorithm. This deep learning framework, introduced in [27], is an extension of LSTM, in which the matrix multiplication is replaced with the convolution operation. Thanks to its structure, this innovative architecture allows to exploit both the spatial and temporal information of the input, characteristics necessary for our system to consider both long-term dependencies between the admissions and abstract general health information (e.g., comorbidity) from sequences of specific procedures and diagnosis. Following the ConvLSTM layer, max-pooling is performed, with the goal of making data depend only on the number of filters applied in the convolution and not on the initial input size. The second input contains a vector of categorical data (red dashed box in Fig. 2), equal in size to the time frames considered. The categories are those related to the various time gaps. Such data, being a simple sequence of mono-dimensional vectors, are processed by an LSTM layer, which permits to give the right weight to each event passed in the sequence. Subsequently, the outputs coming from the two branches of the network are concatenated (green dashed box in Fig. 2) and then a classifier with two Dense layers is used to predict whether a readmission will take place or not.
4 Experiments and Results
In this section, we first describe the training data used for ConvLSTM1d, then we report and discuss the performances on two prediction tasks: readmission within 30 and 180 days. The main objective is to verify that our model improves performances in predicting unplanned hospital readmissions compared to state-of-the-art models, while at the same time allowing the interpretability of the results. Moreover, we compare ConvLSTMd1 with Deepr [10] (a CNN-based model for readmission prediction) and with two traditional machine-learning models, namely logistic regression and random forest. The latter models are reported since they are widely used in hospital readmission prediction [28]. For logistic regression and random forest, we use a bag-of-words model instead of word embeddings. Bag of words is a simple yet popular approach in NLP problems, where text is represented as a set of words, without considering semantics or word order [29].
4.1 Training Dataset
The EHRs used to train ConvLSTM1d are taken from the MIMIC III Database, or simply MIMIC (Medical Information Mart for Intensive Care) [17]. MIMIC is a large, freely-available database comprising anonymized healthcare data associated with over 40,000 patients who stayed in intensive care units. The initial pre-processing of the dataset is fundamental to avoid errors in the data that may propagate to the subsequent steps. During pre-processing, we take inspiration from the procedure described in [9], where the authors also use MIMIC III data for a task of readmission prediction.
First, we perform a data screening of MIMIC, removing all patients under the age of 18 and those who died in ICU, and correcting all inconsistencies. We can see a patient’s medical record made up of different hospital admissions (primary key: HADM_ID), for each of which there may be different ICU admissions (primary key: ICUSTAY_ID). The tuples of the PROCEDURES and DIAGNOSES tables of the MIMIC III database are linked only to the single hospital admission, so we cannot know in which specific ICU a certain procedure has been performed. Therefore, we only need the patients’ procedures and diagnoses associated to a given hospital admission. At this point, we have 35339 patients, with a total of 45357 hospital admissions. Each tuple of the dataset corresponds to the hospital admission of one patient. For the attribution of the label, we need to consider readmissions within 30 and 180 days. The cases of positive labels are the following:
-
1.
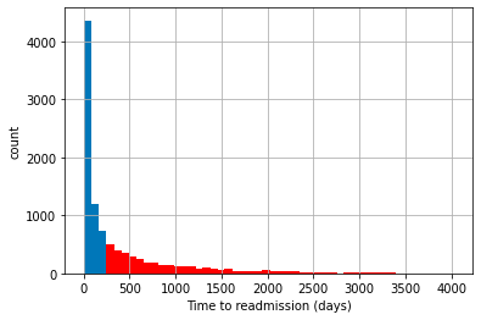
The patient was discharged but returned to the hospital within 1 month (2689 admissions). This label is used for readmission prediction task within 30 days.
-
2.
The patient was discharged but returned to hospital within 6 months (5764 admissions). This label is used for readmission prediction task within 180 days.
Fig. 4a and 4b report the data distributions from which we gathered this information. As a result, the two datasets we are going to use have the following characteristics:
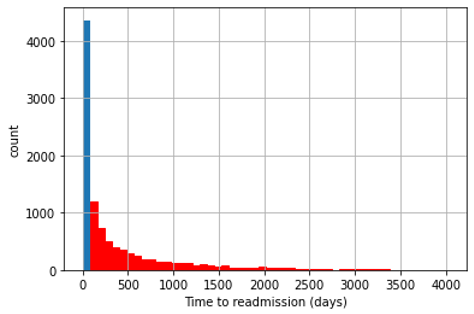
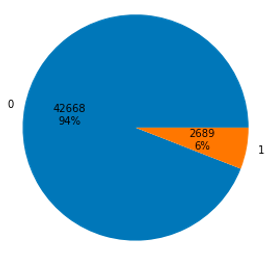
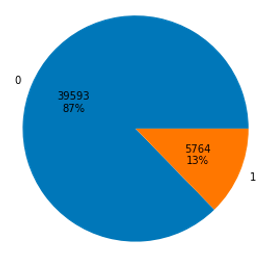
Additionally, the two generated datasets are balanced. Otherwise, as evidenced by Fig. 4c and 4d, the negative label would be predominant in both tasks (with a prevalence of 94% and 87% respectively), and accuracy could not be used as a metric. In both datasets, there may be multiple admissions for a single person. The presence of multiple admissions is important to extrapolate as much information as possible from the rows of the datasets with a positive label (minority label).
4.2 Training Parameters
After splitting the datasets into training, validation and test sets, we train our model using Adam optimizer and binary cross-entropy loss function. Table 1 reports the hyperparameters used for the two tasks of 30-days and 180-days admission. Fig. 5 represents the learning curves for both loss and accuracy on the 30-day unplanned readmission task.
| Parameter | 30 days | 180 days |
| Number of filters | 22 | 23 |
| Filter length | 3 | 3 |
| Dropout rate | 0.3 | 0.1 |
| Dense units | 1000 | 700 |
| L2 convex regularization | 0.001 | 0.01 |
| L2 recurrent regularizer | 0.1 | 0.001 |
| Recurrent dropout rate | 0.2 | 0.2 |
| LSTM units | 20 | 30 |
| Recurrent dropout rate LSTM | 0.1 | 0.1 |
| epochs | 19 | 30 |


4.3 Metrics
Before presenting the performance obtained by ConvLSTMd1, we carry out a brief summary of the main metrics adopted. In the following description, TP stands for True Positive, TN for True Negative, FP for False Positive, FN for False Negative.
Accuracy is an intuitive metric that consists in the ratio between the correctly predicted observations and the total number of observations. To obtain a good validity, the dataset must be balanced. .
Precision is defined as the ratio of correctly predicted positive observations over total predicted positive observations. It is a good metric when the cost of False Positives is high. .
Recall is the ratio of observations correctly classified as positive over the total number of observations that are actually positive. It is a good metric when the cost of False Negatives is high. .
F1 Score is the harmonic mean between precision and recall, allowing to take into account both False Positives and False Negatives. , where stands for Precision and for Recall.
4.4 Results and Discussion
Table 2 illustrates the performance results of ConvLSTMd1 for both 30-days and 180-days unplanned readmission prediction. Our model is trained to achieve the highest accuracy, which is used as the main evaluation metric. To give a better overview, we compare the results of ConvLSTMd1 with two traditional machine-learning approaches for data prediction (logistic regression and random forest) and with Deepr [10], the most similar and advanced solution in literature for predicting hospital readmissions from EHRs. All results are obtained from carrying out 10 separate training sessions for each task and considering the average score between sessions. This expedient is necessary since deep-learning models tend to obtain slightly different performance scores even for the same task.
| Model | Readmission 30 days | Readmission 180 days | ||||||||||||||||||||||||||||||||
|---|---|---|---|---|---|---|---|---|---|---|---|---|---|---|---|---|---|---|---|---|---|---|---|---|---|---|---|---|---|---|---|---|---|---|
| Logistic Regression |
|
|
||||||||||||||||||||||||||||||||
| Random Forest |
|
|
||||||||||||||||||||||||||||||||
| Deepr |
|
|
||||||||||||||||||||||||||||||||
| ConvLSTM1d |
|
|
||||||||||||||||||||||||||||||||
Considering the theory of classifiers performance, we are presented with two types of readmission errors:
-
1.
The first case is when the patient is predicted to be “not readmitted” (label 0), but then it is readmitted, leading to a False Negative.
-
2.
The second case is when the patient is predicted as “readmitted” (label 1), but later we discover that it is not readmitted, thus leading to a False Positive.
From the patient’s health point of view, one should certainly try to minimize False Negatives, trying to get a recall as high as possible. From the perspective of hospital costs in terms of both economics and available beds, we must consider that a False Positive is using resources that could be better spent. Moreover, we need to consider that recall and precision represent a trade-off. In our case, since we are both interested in protecting the patient health, at the same time without wasting too many hospital resources that might be needed by other patients, the F1 score is the best metric to summarize the performance of our model.
From Table 2 it is evident that ConvLSTM1d is the best model in terms of accuracy, substantially outperforming all the other models. In particular, logistic regression and random forest obtain good results in either precision or recall for certain specific cases, but with overall accuracy and F1 scores significantly lower compared to our model. Deepr considerably improves on both accuracy and F1 scores with respect to traditional machine-learning methods, but it prevails over ConvLSTM1d only in recall for unplanned readmission within 30 days. However, it should be noted that precision is much lower. Consequently, this is reflected in the F1 score, which favors ConvLSTM1d in both tasks. On the other hand, ConvLSTM1d obtains higher results in both accuracy and F1 scores for both labels and both tasks.
5 Interpretability
Deep learning techniques have succeeded, in recent years, to produce state-of-art results in many areas. One of the most critical aspects of these techniques is, however, in the interpretability of the results. Such models are often seen as “black boxes” for which there is no internal transparency. The reason lies in the structure of the networks, which are composed of various layers that apply non-linear transformations.
The interpretability of the results of predictive tasks is of paramount importance in critical domains such as medicine, where a single choice can compromise a person’s life. For this reason, we carried out an analysis of currently available interpretability frameworks. A first attempt at making deep learning models for readmission prediction more interpretable was introduced by the author of [10], where a method based on convolution filters inspection is presented. Convolution filters act as n-grams detectors, which in the case of our model can be seen as “clinical motifs”. As we presented in the introductory part of the paper, detecting clinical motifs is crucial for accurately predicting unplanned readmission. Unfortunately, as subsequently demonstrated by [24], such filters are often difficult to interpret, because a single filter may not only be able to identify multiple n-grams, but it may also cancel the contribution of other n-grams.
In this context, a popular framework is LIME, a technique frequently used to make machine-learning and deep-learning models interpretable. Specifically, we tested LIME to obtain the contribution that each code contained in the EHR has on the overall prediction. The results are obtained by performing a perturbation of the initial input, based on the concept of “local fidelity” [23]. This provides a straightforward solution to understand the determinants of a certain prediction. Unfortunately, this second method also do not yield satisfactory interpretability results. In fact, the input of ConvLSTM1d model has a specific structure—two vectors, one for the ICD-9-CM codes and the other for the time gaps, both structured temporally—that does not allow for easy perturbation.
For these reasons, we decided to develop an ad-hoc model-dependent interpretability procedure capable of delivering satisfactory results when EHRs comprise also temporal information in their structure. The aim of this method is to represent the importance that each code has on the overall results, thus helping the medical professional understand which are the factors that influence the final prediction the most. As presented in [25], such an approach is possible since the architecture of our prediction model is rather simple (composed of just few layers), thus greatly improving its interpretability. The goal is to have an easy-to-understand output structured in the following way:
-
•
Patient’s EHR, consisting of the various ICD-9-CM codes.
-
•
The prediction results, with probability of each label.
-
•
For each code in the medical record, the contribution of that code to the prediction.


We now present the procedure step by step. First, if we consider the output of a generic layer of our neural network, the correspondence with the code that originated this output is lost due to the max-pooling layer. In fact, this layer selects the largest response for each filter. To obtain an interpretable result, the first step to perform is to keep track, for each filter, of the input code that originates the largest response. In doing so, at the end of this step, we obtain a structure that contains, for each input code, the correspondence between a filter and an ICD-9-CM code, here named FILTER-CODE. It may happen that a code is not the maximum response of any filter, therefore not all the codes will be present in the FILTER-CODE structure. At this point, we have the correspondence between the output of the max-pooling layer and the input codes.
The second step is to modify the intermediate results coming out of the max-pooling layer. The results of the max-pooling layer are necessarily , since this layer is preceded by a ReLu activation function. Consequently, if we reset the value of an intermediate output following the max-pooling layer, it is as if we deactivated the contribution of that specific filter in the final result. This property is particularly important because it allows to evaluate the importance of each filter on the final prediction. Suppose we want to determine the contribution of code A123. First, we need to search the structure containing FILTER-CODE matches and see if the code A123 is present for one or more filters. Suppose that the chosen code has the following matches: A123-F1, A123-F2, A123-F3. At this point, the intermediate results (those after the max-pooling layer) corresponding to these three filters are set to zero. By performing the prediction without these events in the EHR, it is possible to determine how much the predicted values change, determining the contribution of code A123. Repeating this procedure for each code, we obtain the interpretability of the whole EHR.
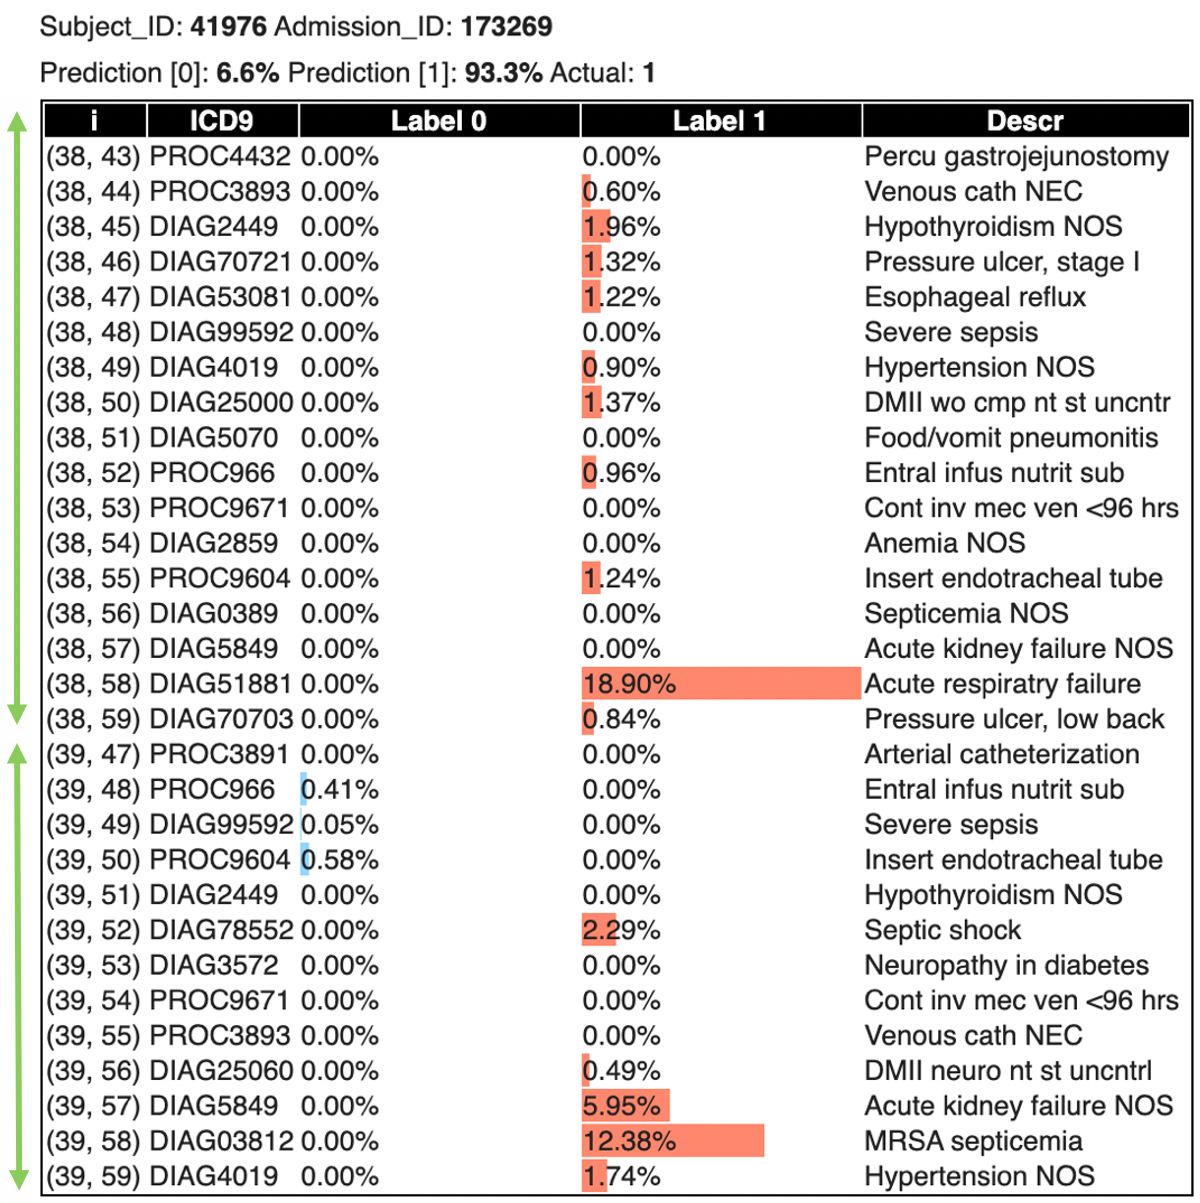
The contribution of a single code is evaluated based on the following strategy: how much does the prediction result change by zeroing out the internal activations related to the considered code? Suppose that the EHR we choose has a prediction with Label 1 = 90%. If, to evaluate the contribution of the code A123, the prediction with Label 1 drops to 60%, it means that this code has a high contribution on this Label. To quantify the contribution of a code we can compute the difference of these two probabilities, in this case 30%. This does not mean in any way that such code has a contribution on the entirety of the prediction equal to 30%, but only that removing the contribution of the code internally to the model, the prediction of Label 1 diminishes by 30%. The reported values must be considered as an indicative value that allows us to understand the reasons of such prediction, preventing to use the model as a black box. Fig. 6, 7 and 8 visually describe the aforementioned concepts.
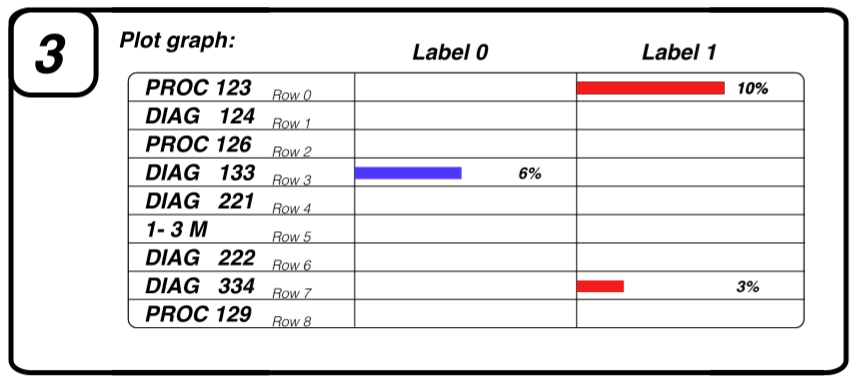
In Fig. 9, we report the result of our interpretability procedure applied to a real-world example. The two arrows in the image represent two groups of temporally distinct codes (i.e., two consecutive admissions), thus allowing the model to use the previous information and “weighing them temporally” thanks to the memory of the ConvLSTM layer. For each procedure and diagnosis, we report their importance on both the prediction of readmission (Label 1) and the prediction of not readmission (Label 0) within 30 days. Clearly, the results of our interpretability procedure provide hints regarding which codes most influence the prediction relative to a single admission.
5.1 Model Validation
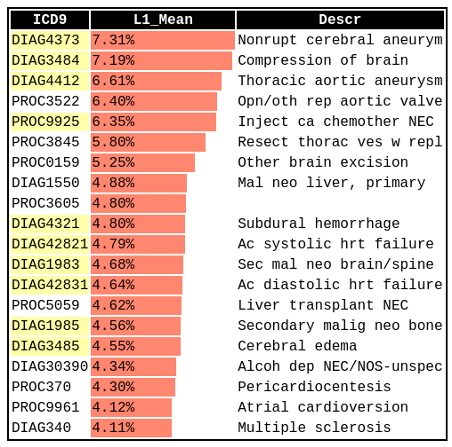
So far we focused on just one admission; however, to confirm the validity of the predictions of our models, it is necessary to obtain the average results over many admissions so that we can understand which procedures and diagnoses have a greater contribution on average. The same interpretability framework can be used to validate the overall quality of the model considering all admissions. In this section, we present the interpretability results for both tasks of readmission, within 30 and 180 days. In Fig. 10 we show the results obtained. Average results are reported for Label 1 (readmission) for both tasks. For brevity, we report the 20 most common codes for each category.
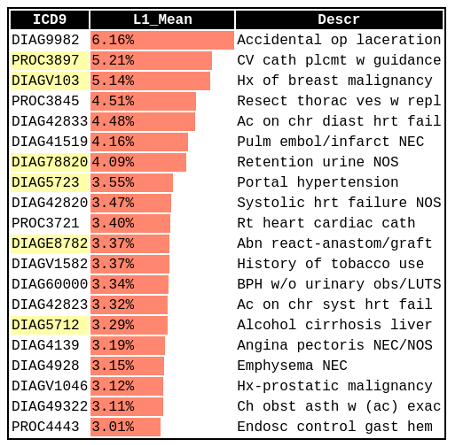
Analyzing the results of the 30-days readmission task, we see in first position the ICD-9-CM code related to the insertion of a central venous catheter related to several procedures in interventional and diagnostic/therapeutic settings (PROC 3897). Liver disease, including portal hypertension (DIAG 5723) and alcoholic cirrhosis (DIAG 5712), also appears to have an important weight in short-term readmission. Overall, the model has a high propensity for cardiovascular and respiratory diseases. We can see that the most represented cancers are breast cancer (DIAG V103)—first cancer in terms of prevalence in women—and malignant prostate cancer (DIAG V1046)—first in terms of prevalence in men.
Analyzing the results of the 180-days readmission task, we see among the most common manifestations cardiac (DIAG 42831, DIAG 42821), cerebral (DIAG 3484, DIAG 4321), hepatic (DIAG 5723, DIAG 5712), but also the injection of chemotherapeutic drugs for the treatment of neoplasms (PROC 9925). Overall, codes related to the cardiac/neurological domain are frequently present, and we can also note the importance attributed to multiple sclerosis (DIAG 340), which has a known fluctuating course with exacerbations.
In summary, comparing the 30 and 180 days readmission tasks for both models, we can see that the cardiological field is important both in the short and long term, as well as the hepatic field. Invasive diagnostic/interventional procedures, as well as pulmonary problems are present in 30-day readmission, while neurology is relevant only in 180-day readmission.
6 Conclusions
In this work we addressed the problem of predicting unplanned hospital readmission from patients’ EHRs. We defined a novel framework, named ConvLSTM1d, that outperforms existing systems while providing at the same time more interpretable results. Our model is based on a ConvLSTM architecture to implement a temporal dimension that allows to consider past events and the disease history of patients. We validated ConvLSTM1d on two predictive tasks, namely unplanned hospital readmission within 30 and 180 days, using data extracted from the medical database MIMIC. Our solution achieves better performance than both traditional machine-learning models (based on logistic regression and random forest) and Deepr, currently the best deep-learning model for readmission prediction. Additionally, our results represents, as far as we know, the first use of a ConvLSTM network with word embeddings in the context of healthcare, not considering segmentation tasks on medical images. Moreover, we presented and validated a visual method to improve the interpretability of our predictions, based on an ad-hoc model-dependent procedure.
In the future, we will consider the application of this study to a bigger dataset, because at the moment MIMIC III is the only large public database available containing detailed information on patients’ EHRs. Moreover, time intervals and ICD-9-CM codes related to diagnoses and procedures represent a small portion of the information contained in EHRs. More information may be used to improve the predictive performance: for instance, for patients in intensive care unit, we may consider the history of prescribed medications and laboratory tests. Currently, our solution is based on few layers; a more elaborate and deeper network may also improve performance, but at the cost of reducing the interpretability of the model. Experiments with more complex architectures can also be included in future work.
Acknowledgments
We are grateful to Letizia Tanca for her help in the definition and revision of this paper. This work was supported, in part, by Science Foundation Ireland grant 13/RC/2094_P2 and co-funded under the European Regional Development Fund through the Southern & Eastern Regional Operational Programme to Lero – the Science Foundation Ireland Research Centre for Software.
References
- [1] Ralph Snyderman and R Sanders Williams. Prospective medicine: the next health care transformation. Academic Medicine, 78(11):1079–1084, 2003.
- [2] Office of the National Coordinator for Health Information Technology. Office-based physician electronic health record adoption. https://www.healthit.gov/data/quickstats/office-based-physician-electronic-health-record-adoption, 2021.
- [3] Mansour TA Sharabiani, Paul Aylin, and Alex Bottle. Systematic review of comorbidity indices for administrative data. Medical care, pages 1109–1118, 2012.
- [4] Edward Choi, Andy Schuetz, Walter F Stewart, and Jimeng Sun. Medical concept representation learning from electronic health records and its application on heart failure prediction. arXiv preprint arXiv:1602.03686, 2016.
- [5] Truyen Tran, Tu Dinh Nguyen, Dinh Phung, and Svetha Venkatesh. Learning vector representation of medical objects via emr-driven nonnegative restricted boltzmann machines (enrbm). Journal of biomedical informatics, 54:96–105, 2015.
- [6] Edward Choi, Mohammad Taha Bahadori, Andy Schuetz, Walter F Stewart, and Jimeng Sun. Doctor ai: Predicting clinical events via recurrent neural networks. In Machine learning for healthcare conference, pages 301–318. PMLR, 2016.
- [7] Benjamin Shickel, Patrick James Tighe, Azra Bihorac, and Parisa Rashidi. Deep ehr: a survey of recent advances in deep learning techniques for electronic health record (ehr) analysis. IEEE journal of biomedical and health informatics, 22(5):1589–1604, 2017.
- [8] C. K. McIlvennan, Z. J. Eapen, and L. A. Allen. Hospital readmissions reduction program. Circulation, 131(20):1796–1803, May 2015.
- [9] Yu-Wei Lin, Yuqian Zhou, Faraz Faghri, Michael J Shaw, and Roy H Campbell. Analysis and prediction of unplanned intensive care unit readmission using recurrent neural networks with long short-term memory. PloS one, 14(7):e0218942, 2019.
- [10] Phuoc Nguyen, Truyen Tran, Nilmini Wickramasinghe, and Svetha Venkatesh. Deepr: A convolutional net for medical records. IEEE journal of biomedical and health informatics, 21(1):22–30, 2016.
- [11] Reza Azad, Maryam Asadi-Aghbolaghi, Mahmood Fathy, and Sergio Escalera. Bi-directional convlstm u-net with densley connected convolutions. In Proceedings of the IEEE/CVF international conference on computer vision workshops, pages 0–0, 2019.
- [12] Li Kang, Ziqi Zhou, Jianjun Huang, Wenzhong Han, and IEEE Member. Renal tumors segmentation in abdomen ct images using 3d-cnn and convlstm. Biomedical Signal Processing and Control, 72:103334, 2022.
- [13] Liping Tong, Cole Erdmann, Marina Daldalian, Jing Li, and Tina Esposito. Comparison of predictive modeling approaches for 30-day all-cause non-elective readmission risk. BMC medical research methodology, 16(1):1–8, 2016.
- [14] Bobak J Mortazavi, Nicholas S Downing, Emily M Bucholz, Kumar Dharmarajan, Ajay Manhapra, Shu-Xia Li, Sahand N Negahban, and Harlan M Krumholz. Analysis of machine learning techniques for heart failure readmissions. Circulation: Cardiovascular Quality and Outcomes, 9(6):629–640, 2016.
- [15] Benjamin Shickel, Patrick James Tighe, Azra Bihorac, and Parisa Rashidi. Deep ehr: a survey of recent advances in deep learning techniques for electronic health record (ehr) analysis. IEEE journal of biomedical and health informatics, 22(5):1589–1604, 2017.
- [16] Trang Pham, Truyen Tran, Dinh Phung, and Svetha Venkatesh. Deepcare: A deep dynamic memory model for predictive medicine. In Pacific-Asia conference on knowledge discovery and data mining, pages 30–41. Springer, 2016.
- [17] Alistair EW Johnson, Tom J Pollard, Lu Shen, H Lehman Li-Wei, Mengling Feng, Mohammad Ghassemi, Benjamin Moody, Peter Szolovits, Leo Anthony Celi, and Roger G Mark. Mimic-iii, a freely accessible critical care database. Scientific data, 3(1):1–9, 2016.
- [18] Tomas Mikolov, Ilya Sutskever, Kai Chen, Greg S Corrado, and Jeff Dean. Distributed representations of words and phrases and their compositionality. Advances in neural information processing systems, 26, 2013.
- [19] Tomas Mikolov, Kai Chen, Greg Corrado, and Jeffrey Dean. Efficient estimation of word representations in vector space. arXiv preprint arXiv:1301.3781, 2013.
- [20] Yanshan Wang, Sijia Liu, Naveed Afzal, Majid Rastegar-Mojarad, Liwei Wang, Feichen Shen, Paul Kingsbury, and Hongfang Liu. A comparison of word embeddings for the biomedical natural language processing. Journal of biomedical informatics, 87:12–20, 2018.
- [21] Youngduck Choi, Chill Yi-I Chiu, and David Sontag. Learning low-dimensional representations of medical concepts. AMIA Summits on Translational Science Proceedings, 2016:41, 2016.
- [22] Zachary C Lipton. The mythos of model interpretability: In machine learning, the concept of interpretability is both important and slippery. Queue, 16(3):31–57, 2018.
- [23] Marco Tulio Ribeiro, Sameer Singh, and Carlos Guestrin. " why should i trust you?" explaining the predictions of any classifier. In Proceedings of the 22nd ACM SIGKDD international conference on knowledge discovery and data mining, pages 1135–1144, 2016.
- [24] Alon Jacovi, Oren Sar Shalom, and Yoav Goldberg. Understanding convolutional neural networks for text classification. In Proceedings of the 2018 EMNLP Workshop BlackboxNLP: Analyzing and Interpreting Neural Networks for NLP, pages 56–65, 2018.
- [25] Erin Craig, Carlos Arias, and David Gillman. Predicting readmission risk from doctors’ notes. arXiv preprint arXiv:1711.10663, 2017.
- [26] Laurens Van der Maaten and Geoffrey Hinton. Visualizing data using t-sne. Journal of machine learning research, 9(11), 2008.
- [27] Xingjian Shi, Zhourong Chen, Hao Wang, Dit-Yan Yeung, Wai-Kin Wong, and Wang-chun Woo. Convolutional lstm network: A machine learning approach for precipitation nowcasting. arXiv preprint arXiv:1506.04214, 2015.
- [28] Yinan Huang, Ashna Talwar, Satabdi Chatterjee, and Rajender R Aparasu. Application of machine learning in predicting hospital readmissions: a scoping review of the literature. BMC medical research methodology, 21(1):1–14, 2021.
- [29] Dan Jurafsky. Speech & language processing. Pearson Education India, 2000.