How Good is ChatGPT in Giving Advice on Your Visualization Design?
Abstract
Data visualization practitioners often lack formal training, resulting in a knowledge gap in visualization design best practices. Large-language models like ChatGPT, with their vast internet-scale training data, offer transformative potential in addressing this gap. To explore this potential, we adopted a mixed-method approach. Initially, we analyzed the VisGuide forum, a repository of data visualization questions, by comparing ChatGPT-generated responses to Human replies. Subsequently, our user study delved into practitioners’ reactions and attitudes toward ChatGPT as a visualization assistant. Participants, who brought their visualizations and questions, received feedback from both Human experts and ChatGPT in a randomized order. They filled out experience surveys and shared deeper insights through post-interviews. The results highlight the unique advantages and disadvantages of ChatGPT, such as its ability to quickly provide a wide range of design options based on a broad knowledge base, while also revealing its limitations in terms of depth and critical thinking capabilities.
Index Terms:
Data visualization, design feedback, ChatGPT, LLM, AII Introduction
Visualizations are ubiquitous and widely employed by practitioners across various disciplines. However, many of those creating visualizations on a casual basis commonly lack formal training in visualization design and instead acquire the necessary skills on the go, leaning from examples from the internet, online blogs, and other publicly available resources [1, 2]. These people may find themselves in situations where they must navigate intricate and occasionally contradictory choices [3] and consequently revert to their instincts, drawing from the experiences and observations they have accumulated along the way [3, 4]. Alternatively, they seek feedback from colleagues who can help provide novel perspectives, validate design choices, and challenge assumptions [3, 5]. Nevertheless, not all practitioners have the privilege of accessing such feedback from experienced colleagues.
This paper delves into ways to address this knowledge gap in practical settings. We examine the emergence of large language models (LLMs) equipped with extensive internet-scale training data, which holds transformative potential [6]. LLM-based chatbots, exemplified by ChatGPT [7], can offer tailored suggestions by analyzing a practitioner’s design choices and considering established best practices. This emerging advancement can assist casual and novice practitioners, who may have limited knowledge and resources in data visualization, by providing human-like guidance throughout their design journey.
However, open questions remain regarding the extent of LLMs’ current knowledge of visualization best practices, the quality and practical applicability of their suggestions, and how these suggestions differ from those provided by human expert visualization designers. Addressing these open questions, we have formulated two specific research questions to guide our investigation:
-
•
RQ1. Can ChatGPT rival Human expertise in data visualization knowledge?
-
•
RQ2. How would visualization practitioners perceive ChatGPT’s design feedback?
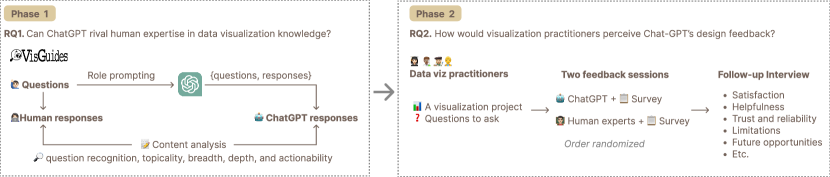
We employ a mixed-method approach (Fig. 1) to explore the potential of ChatGPT in offering data visualization design knowledge. First, we investigated posts and discussions at the VisGuides forum [8], which captures public questions and responses about visualization design. We asked the questions to ChatGPT and compared its responses to the Human responses on VisGuides across six key metrics: coverage, topicality, breadth, clarity, depth, and actionability. We found that ChatGPT’s performance is comparable to, and often better than, Human responses, especially in providing clear and comprehensive answers that cover all questions asked. In contrast, human responses typically offered specific suggestions, like citing references beyond basic improvements, but showed greater variability due to multiple respondents involved.
While the VisGuide analysis provided insight into ChatGPT’s response quality (RQ1), it fell short of capturing practitioners’ reactions, attitudes, and overall experiences (RQ2). Thus, we conducted a qualitative user study wherein we invited practitioners to partake in a comparative assessment of Human expert feedback and ChatGPT-generated feedback. For this study, participants were invited to bring their own visualization designs and projects to our sessions for questions and feedback. Interestingly, all participants preferred discussing with Human experts, valuing their ability to engage in fluid conversations and provide tailored recommendations. However, participants appreciated the broad knowledge of ChatGPT, particularly its ability for quick brainstorming and ideation from a neutral standpoint, while acknowledging its limitations in text-based communication.
Both studies consistently shed light on the strengths and weaknesses of ChatGPT and Humans. ChatGPT excelled at providing broad suggestions, whereas Humans demonstrated a better grasp of nuanced details for more in-depth ideas. A stronger preference for Humans in the feedback study was linked to the more consistent opinions and natural conversational dynamics of Human experts. These findings also point to areas for future enhancement of LLMs, including enhancing visual perception and proactive discussion capabilities to better tackle the nuanced contexts of design problems. Additionally, we discuss the role of an LLM-based knowledge companion in visualization practice and education. Our work establishes a foundation for assessing LLMs’ knowledge in data visualization, a crucial step for the field’s progression amidst the rise of LLM-driven visualization innovations.
II Related Work
II-A Data Visualization Design Practice
Data visualization has gone mainstream, frequently used to explore and communicate data in a wide variety of industry sectors. As a result, data visualization practitioners have diverse professions, such as managers, scientists, journalists, and analysts, not necessarily having a specific job title as “visualization designer” or “visualization developer.” [1] These professionals do not typically have formal training or education in data visualization, while mostly learning necessary visualization skills on the go [1, 2]. While decades of empirical research in data visualization have produced fruitful knowledge in effective visualization design, it is unclear how well it is accessible to practice [9, 8]. In fact, it has been reported that many practitioners are not aware of theories and principles from research [10].
As with any creative design profession, visualization practitioners run into challenging situations where they must make decisions among conflicting design alternatives [3]. Such decisions might include selecting chart types, making competing decisions between aesthetics and functions, picking appropriate color scales, and addressing conflicts with user and business stakeholder needs [3]. Processes by practitioners to address such design issues are more nuanced and multi-faceted than theoretical process models proposed in the research field [10]. They depend on a kind of situated planning that often relies on forms of experimentation and responding to what is happening in the moment [10, 11]. They balance readability and engagement and also consider contextual factors such as whether their visualizations are business-oriented dashboards or public-facing graphics [12].
Practitioners frequently resort to their intuition or gut instinct while also looking for examples for inspiration [3, 10]. Moreover, they also seek feedback from their colleagues to improve their data visualizations [3, 1]. Such feedback is essential to assess a design and generate revision ideas in the design process, although the fear of criticism and non-anonymity can make people uncomfortable receiving feedback from colleagues. Moreover, self-employed people might struggle to find such colleagues who can provide valuable feedback [13]
In this work, we examine how an LLM-based chatbot, trained with extensive knowledge in the wild, can serve as a design companion to provide knowledge and feedback to varying backgrounds of practitioners. We aim to bridge the gap between LLMs’ theoretical potential and their practical application in data visualization, a critical endeavor in the evolving landscape of artificial intelligence within the field.
II-B Evaluating LLMs’ Knowledge Capacity
LLMs, such as BERT [14], GPT [15, 16], and Llama [17], have rapidly gained popularity and adoption across both industry and academia [18, 19]. Leveraging massive amounts of text data and computational power, these foundation models have achieved impressive performance on a wide variety of tasks, from generating human-like text to high-quality images [20, 21, 22]. However, the scale and complexity of these models make it difficult to fully understand the scope and limitations of their language capabilities [23].
A number of benchmark tasks have been proposed to assess the general knowledge and reasoning capabilities of language models in a more holistic manner [24, 25]. These include tasks that require models to answer broad-coverage factoid questions based on pre-existing knowledge [24]. Other benchmarks evaluate numeric, analogical, and logical reasoning skills across different modalities [26, 27], while some others examine the ability of LLMs to generalize knowledge to new concepts [22]. Assessing models on such diverse reasoning skills can provide deeper insight into their adaptability, knowledge gaps, and limitations. In addition to assessing such capabilities, an important area of research has focused on evaluating potential harms and biases in large language models. Some studies have performed targeted adversarial evaluations to expose problematic biases encoded in the models’ training data [28, 29, 30].
In addition to generic capabilities, research has been carried out to investigate LLMs’ discipline-specific knowledge and skills. The inherent intricacies and nuances of specific domains necessitate tailored evaluation methods. For instance, researchers explored students’ and teachers’ usage of and perceptions toward LLMs, investigating opportunities and potential benefits for education [31, 32, 33]. Researchers also tested LLMs’ ability to pass exams in specific domains like medicine [34], law [35, 36], and business [37]. Others have evaluated LLMs’ ability to carry out real-world tasks. Examples include analyzing diagnostic abilities by answering questions about medications, symptoms and treatments [38]; producing research hypotheses [39]; predicting legal judgment and recommending case citations [13]; and predicting chemical properties [40].
Recent studies have initiated the exploration of Large Language Models’ (LLMs) applicability in the realm of data visualization. Some investigations have examined their capacity to generate data visualizations [41, 42], facilitate exploratory data analysis [43], and create stylistic data graphics [43], in addition to generating graph drawings [44]. Furthermore, studies have delved into the usability of LLM-based code generation in coding data visualizations [45], as well as understanding visualization practitioners’ perceptions regarding generative text-to-image models [46].
Unlike the previous work, we focus on evaluating the design knowledge capacity of LLMs. This facet is one of the primary pillars of data visualization skills, extending beyond the mere creation of data visualizations. In other words, this work delves into the cognitive aspects of LLMs, assessing not just their visualization code output but the reasoning and principles underlying their suggestions.
III Assessing ChatGPT’s Competence in Data Visualization Knowledge
As a step toward assessing ChatGPT’s data visualization knowledge, we were interested in its ability to respond to real-world data visualization questions in comparison to Humans.
III-A Data Collection
We relied on VisGuides [8] as our main source for visualization questions. VisGuides is a discussion forum focused on visualization guidelines, where practitioners from various backgrounds, such as scientists, designers, engineers, and students, ask and respond to questions regarding their visualizations and fundamental visualization principles.
We identified a total of 226 questions within the VisGuides repository. Among these, we selected 119 questions for the study based on specific inclusion criteria. These criteria included the presence of a question in the post, the requirement for a visualization description to possess sufficient visual encoding (due to ChatGPT’s inability to process images), the need for questions to be comprehensible and well-structured (excluding overly generic inquiries like ’What do you think?’ or ’Is this good enough?’), and the necessity of having at least one Human response. Two of the authors jointly reviewed and unanimously approved the inclusion of these 119 questions.
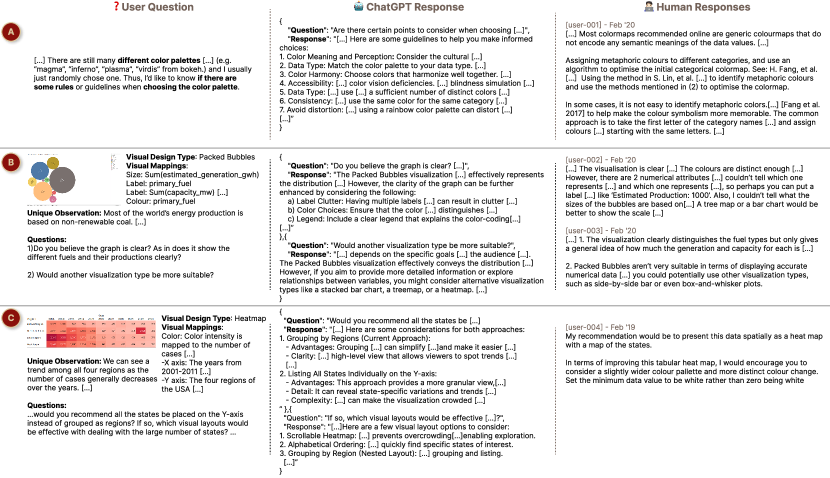
Visguides primarily featured two types of questions, broadly divided into two categories: design feedback questions (87) and visualization guideline questions (32). The former aimed to enhance users’ personal visualizations (see Figure 3 B & C), while the latter sought to comprehend visualization guidelines or principles (see Figure 3 A). For a more comprehensive taxonomy of questions on the platform, Diehl et al. provide detailed insights [47].
After compiling the list of qualifying questions, we presented each query to ChatGPT in May 2023, accompanied by a role-playing prompt designed as follows:
Please act as if you are a visualization expert.
Can you respond to this question delimited by ///.
 ///
 {Question}
 ///
Please format your reply as JSON objects with
keys: Question and Response.
 {
    Question: xxx
    Response: xxx
 }
There may be more than one question,
format each as a new object.
To streamline our analysis, we created a spreadsheet where each row included a question, the corresponding ChatGPT response, and a compilation of Human responses. Each question had 1.54 Human responses on average ( = 1.03). The average approximate word count of the Human responses was 235.35 ( = 289.62) with a maximum of 1721 words and minimum of 13 words. The average approximate word count of the ChatGPT responses was 463.42 ( = 189.34) with a maximum of 1192 words and minimum of 115 words.
III-B Analysis Method
Two researchers performed an open coding process on a randomly selected 10% sample of the questions and the corresponding ChatGPT and Human responses. This process resulted in the development of six evaluation metrics: breadth, clarity, depth, actionability, coverage, and topicality. These metrics were assessed using a Likert scale that ranged from 1 to 5. For instance, a rating of 1 indicated narrow responses, while a rating of 5 denoted very broad responses in the context of the breadth metric. The researchers initially assigned scores to the 10% sample, engaging in discussions to resolve any discrepancies and establish consensus definitions and criteria for each score within every metric to ensure consistency. Following this, one of the researchers proceeded to score the remaining question responses.
Given that some questions elicited multiple Human responses while others received only one, We created a composite score to evaluate the collective quality of the Human responses. Furthermore, any elements of the Human responses that extended beyond the capabilities of ChatGPT, such as providing citations to related literature, links to external resources, visual examples, or posing follow-up questions, were duly noted. We also categorized whether each question sought feedback on the questioner’s visualizations or inquired about general visualization design knowledge.
III-C Results
III-C1 Ratings on Quality Metrics
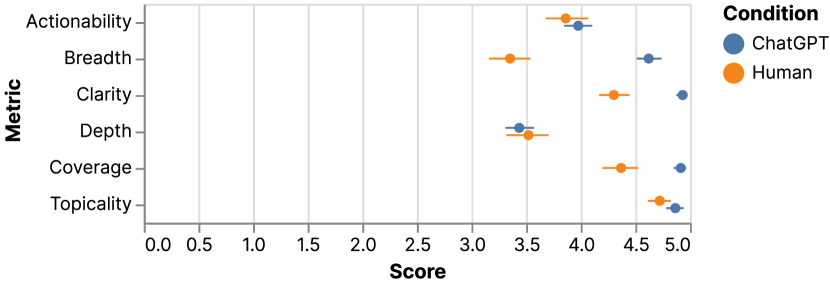
Figure 2 shows the scores of response quality metrics for both ChatGPT and Human responses. We describe the findings for each quality metric as below.
Coverage
Both ChatGPT and Humans excelled in covering the entirety of the question, with ChatGPT slightly outperforming Humans. ChatGPT scored 4.92 ( = 0.33), while Humans scored 4.37 ( = 0.95). The lower score often stemmed from the Human respondent’s failure to address all facets of the question. For instance, in Figure 3C, the user raised a two-part question, “…would you recommend all the states be placed on the Y-axis instead of grouped as regions? If so, which visual layouts would be effective with dealing with the large number of states?…”. However, the Human response only addressed the second part of the question, suggesting a heat map as a useful visual layout.
Topicality
This score indicates the degree to which the response stays on topic. ChatGPT averaged 4.87 ( = 0.45), while Humans averaged 4.72 ( = 0.59). There were moments when both ChatGPT and Humans strayed from the main topic. For instance, when a user inquired about the application of visual variables in VR visualizations,111visguides:visual-variables-in-vr ChatGPT not only addressed this question but also came up with a hypothetical question asking what factors to consider when choosing such visual variables. Human respondents also occasionally veered off-topic by offering unsolicited advice and extending their responses beyond the original question’s scope.
Breadth
Breadth measures how widely a response explores various ideas, concepts, options, or perspectives. In this category, ChatGPT outperformed Human responses by a significant margin. ChatGPT achieved an average score of 4.62 ( = 0.61), while Human responses averaged only 3.35 ( = 1.13). For example, in Figure 3A, when the user inquired about color palette guidelines, ChatGPT provided an extensive list of potential approaches, encompassing data type, color harmony, accessibility, etc. In contrast, the Human respondent to this question concentrated primarily on the creation of domain-specific color maps, offering in-depth insights into the process.
Clarity
The clarity score assesses how easily a reader can comprehend a response, taking into account conciseness, lack of verbosity, and the organization of the response structure. Notably, ChatGPT consistently presented its responses in a well-structured JSON array due to the specific prompt format we employed. This contributed to ChatGPT receiving a high clarity score, averaging 4.93 ( = 0.28). Human responses also demonstrated good clarity with an average score of 4.30 ( = 0.79). They received lower ratings when the responses were overly brief, making it difficult to discern the specific reference points.
Depth
The depth score evaluates the extent of explanations, expertise, and valuable insights in a response. Human responses averaged a score of 3.52 ( = 1.07), while ChatGPT’s average was 3.44 ( = 0.71). Although the scores are comparable to each other, a distinct difference in depth between a ChatGPT response and a Human response is evident in Figure 3B. The ChatGPT response primarily focuses on general, surface-level improvements applicable to any visualization, such as adding labels and legends. In contrast, the Human response often provides more tailored and specific suggestions for enhancing the visualization, as demonstrated by the recommendation to “put a label before the numerical attribute like ’Estimated Production: 1000’.” This detailed guidance directly pertains to the unique aspects of the visualization in question. However, Human responses also displayed greater variability. For instance, when asked about color clarity and alternative data representation to reduce clutter, a Human response simply confirmed the current design choices are fine222visguides:latitude-distribution-of-solar-and-wind-farms-uk.
Actionability
The actionability score assesses whether the response offers guidance that can be readily implemented in the visualization. This metric is not applicable to visualization guideline questions. The actionability scores were quite similar: Human responses had an average score of 3.86 ( = 0.94), while ChatGPT achieved an average of 3.99 ( = 0.61). Overall, ChatGPT received a high score for actionability, as it consistently provided a list of recommendations. However, the score was occasionally reduced due to the generic or vague nature of these suggestions. For instance, in Figure 3B, ChatGPT offered advice for addressing label clutter, selecting colors, and refining the legend. Nevertheless, these recommendations were explained in a manner that made them applicable to most visualizations. The actionability scores for Human responses tend to be low when the Human refrains from offering recommendations and instead validates all of the user’s choices333visguides:comparison-of-acute-hepatitis-from-tycho-dataset.
III-C2 Further Observations in Human and ChatGPT Responses
Humans tend to provide external resources—43 out of 119 (36.13%) Human responses included elements that ChatGPT would not provide unless explicitly instructed. This additional content encompassed references to academic research, links to related articles and websites, citations of studies, and the inclusion of informative video links. For instance, in Figure 3A, asking for guidelines on choosing color palette, the responses include references to three different academic research papers including “H. Fang, et al.”. In another case, when the question was about using blow-apart effects, the Human respondent embedded an educational video related to the subject444visguides:the-blow-apart-effect.
Multiple Human responses tend to complement each other—Most questions had a single response (84), while 35 questions had multiple responses. Average ratings generally favored responses with multiple contributors across all categories, except for topicality. Significant rating differences were observed in breadth, depth, and actionability. Single-respondent questions averaged 3.06 ( = 1.05) in breadth, 3.35 ( = 1.05) in depth, and 3.72 ( = 0.96) in actionability. Conversely, multi-respondent questions scored higher, averaging 4.06 ( = 0.98) in breadth, 3.94 ( = 0.98) in depth, and 4.26 ( = 0.74) in actionability. When there’s only one response to a question, the quality of that response becomes heavily reliant on the individual respondent, leading to significant variability in quality, as seen in Figure 3A (high quality) versus Figure 3C (low quality). However, when multiple respondents contribute, they complement each other and compensate for areas in which one respondent might fall short (Figure 3B).
Human response rating improves for visualization guideline questions—For ChatGPT responses, the differences in ratings between feedback and visualization guideline questions consistently remained small (less than 0.2 rating points). However, Human responses received higher scores for addressing guideline questions and lower scores for addressing design feedback questions across all metrics. For instance, Human responses excelled in breadth and depth for visualization guideline questions, with average ratings of 4.09 ( = 0.95) for breadth and 4.25 ( = 0.97) for depth. In contrast, design feedback questions received lower average ratings, with 3.08 ( = 1.06) for breadth and 3.25 ( = 0.97) for depth.
Guideline questions frequently require broader perspectives and readily accessible design knowledge, with 84.4% (27/32) of their responses citing external references, in contrast to design feedback questions, where only 18.39% (16/87) of Human responses did so. Conversely, feedback questions entail an understanding of domain-specific data and tasks, potentially making it challenging to offer comprehensive insights. For instance, a question like “Is this color scheme suitable?” requires a deep understanding of the domain. Conversely, questions such as the one about gendered colors in visualizations555visguides:use-of-gendered-colours-in-visualization can easily elicit a variety of various viewpoints and existing resources.
Question specificity corresponds with response quality—ChatGPT’s response was susceptible to how specific and clear the question was. Figure 3B shows such an example when the user query was “do you believe the graph is clear?” Other examples of less specific user questions include: “is my color map optimal?” and “how can my visual design be improved?”666visguides:map-and-bar-visualization. On the other hand, in Figure 3C, the question is more specific, resulting in more meaningful options and insights offered by ChatGPT.
ChatGPT’s color vision deficiency is usually not problematic—Color-related questions were prominent. Out of the 119 questions, 32 were centered on color-based design feedback (e.g., “Is the choice of the colour scheme appropriate?” 777visguides:area-chart-generation-capacity-over-the-years). Users rarely mentioned the specific colors used in their visualizations, often providing only visual encoding information. As a result, ChatGPT’s responses were typically based on general color principles. Despite this limitation, ChatGPT surpassed its overall average in most categories, except for depth and actionability.
III-D Takeaways
Our analysis reveals ChatGPT’s ability to respond to data visualization queries compared to Human counterparts. ChatGPT excelled in breadth, exploring a wide range of ideas and concepts, surpassing Human responses. Clarity was another area where ChatGPT scored highly, benefiting from its structured response format. However, ChatGPT’s suggestions often leaned towards being more generic. In contrast, Human experts often offered more tailored and specific advice; they enhanced their responses by providing external resources and complementing each other in multi-respondent scenarios. While these findings are promising, they do not provide insights into how practitioners perceive the value of Human’s responses, prompting the need for further research.
| Participant ID | Role | Years in Data Vis | Gender | Age range | Racial background | Frequency of ChatGPT usage |
|---|---|---|---|---|---|---|
| P10 | Developer | 3-5 years | Male | 25-34 years old | Asian | Daily |
| P11 | Manager | 1-3 years | Male | 25-34 years old | Caucasian | Occasionally |
| P12 | Freelancer | 3-5 years | Male | 35-44 years old | Asian | Daily |
| P13 | Journalist | 1-3 years | Female | 18-24 years old | Hispanic | Weekly |
| P14 | Consultant | 3-5 years | Male | 25-34 years old | Caucasian | Daily |
| P15 | Product Designer | 3-5 years | Female | 25-34 years old | Caucasian | Weekly |
| P16 | Analyst | 5-10 years | Male | 35-44 years old | Caucasian, African American | Weekly |
| P17 | Scientist | 3-5 years | Female | 25-34 years old | Asian | Weekly |
| P18 | Scientist | 1-3 years | Female | 25-34 years old | African American | Weekly |
| P19 | Student | 5-10 years | Male | 25-34 years old | Caucasian | Only once or twice |
| P20 | Freelancer | ¿ 10 years | Male | 45-54 years old | Caucasian | Occasionally |
| P21 | Student | 3-5 years | Male | 25-34 years old | Asian | Daily |
IV Perception of practitioners toward ChatGPT’s utility
Building upon our previous research, we conducted a comparative interview study involving feedback sessions with ChatGPT and Human experts. We aimed to gain a deeper understanding of how data visualization practitioners perceive ChatGPT’s role as a design companion, uncovering their attitudes and perceptions regarding ChatGPT’s design feedback.
IV-A Recruitment
We aimed to engage a diverse group of data visualization practitioners in our study. We recruited participants through academic mailing lists targeting students and scientists, as well as the Data Visualization Society’s Slack channel [48]. Inclusion criteria required proficiency in English, experience in data visualization creation, and a willingness to share at least one of their data visualizations. Initially, 41 individuals responded to the recruitment survey, from which we selected 12 participants to take part in the study.
IV-B Participants
The study involved 12 participants (P10 to P21), creating a diverse group with varying professional backgrounds, experience levels, and familiarity with ChatGPT (see Table I). Their roles encompassed a broad spectrum, including developers, managers, journalists, consultants, product designers, analysts, scientists, and students. Professional experience ranged from less than one year to over ten years in their respective fields. Furthermore, participants’ engagement with ChatGPT varied, with some being daily users while others interacted with it only occasionally or as the need arose.
IV-C Tasks & Procedures
Before each study session, participants were asked to prepare a visualization they were comfortable sharing, along with a list of relevant questions. These sessions were conducted using Zoom between the end of July and early August 2023. The entire study session took about 60 minutes. Participants were compensated with a $50 Amazon gift card.
Each interview began with a brief introduction by the moderator and was divided into three segments: a visualization feedback session with ChatGPT, a similar session with Human expert(s), and an open-ended interview. Six participants initiated the process with the ChatGPT session, while the other six commenced with the Human expert session. After each feedback session, we administered a survey. In five sessions, two visualization experts provided feedback, while in the remaining seven sessions, we had one expert present. Both experts are current professors in the field of visualization.
During the ChatGPT feedback session, participants shared their screens with the moderator and presented their visualizations, accompanied by a brief explanation. The moderator introduced a predefined input format for ChatGPT, employing a role-playing structure [49]. Participants were guided to furnish details about the visualization’s chart type, textual description, visual encodings, and any related questions. They input this information into ChatGPT while screen-sharing. Following ChatGPT’s response, participants could pose follow-up questions or request clarifications. Afterward, participants received a survey via the Zoom chat to gather feedback on their ChatGPT experience.
During the Human expert session, one or two visualization experts joined the Zoom meeting. Participants shared their screens and presented their visualization-related questions to these experts. The experts answered queries and provided additional feedback or further insights. Subsequently, following this session, the visualization experts left the meeting, and participants were presented with a Zoom survey to gather feedback about their experience.
In the final segment of the study, open-ended interviews were conducted. In these interviews, the moderator inquired about participants’ experiences in both ChatGPT and Human feedback sessions, delving deeper into the rationale behind their survey responses. Furthermore, participants were prompted to share their perspectives on the possible integration of ChatGPT into their data visualization workflow, its constraints, and the future possibilities it might offer.
IV-D Data & Analysis Methods
The final dataset from our user studies comprises participant questions (see Table II) and responses, survey data, and transcripts from post interviews. Our primary focus for analysis was on the interview transcripts. Initially, two researchers independently examined three interview transcripts, identifying interesting quotes and assigning meaningful themes. Once we established a high degree of consistency between the researchers’ findings, one of them proceeded to review the remaining transcripts. Ultimately, we compiled a categorized list of quotes based on initial higher-level themes (e.g., Where Human experts excel). To further refine our analysis, we revisited these quotes and divided the themes into sub-level categories (e.g., Collaborative and natural conversations).
IV-E Post-Session Interview Analysis Results
| P ID | Chart Type | Initial Questions |
|---|---|---|
| P10 | parallel coordinate map | Could you suggest an alternative way to visualize this? How can I make this visualization more engaging? |
| P11 | scatterplot | Does it make more sense to compare X or to compare Y? Would there be a better visualization type to show ___? |
| P12 | scatterplot | How can I improve this visualization in order to satisfy the customer? |
| P13 | scatterplot | What is the best way to show ___? what do you think about the current color scheme? |
| P14 | diverging stacked bar chart | How can we ensure the user looks at ___? How can I put these four bars next to each other in one visualization? |
| P15 | bubble cluster | How would I enable more properties to be seen? How would I let the user encode the strength of their preference? |
| P16 | interactive map | Which parts of the data visualization do you think are successful? Are there any areas you believe could be improved for better clarity and impact? |
| P17 | sankey chart | Is there a way to ascertain what visualization is most effective for communicating the data? How could ___ be more clearly displayed? |
| P18 | wav file visualization | Would it be visually overwhelming to use ___? Is this an appropriate visualization for demonstrating ___? |
| P19 | color heatmaps | Would another color map be more suitable? Would you have any suggestions as to how to indicate ___? |
| P20 | beeswarm, line chart | Does the special encoding for ___ make intuitive sense? Is it clear that ___ represents ___? |
| P21 | comparative line graph | How can I decrease the number of colors used in this visualization? Would this data be better represented if I ___? |
IV-E1 Participant Questions and Interaction Dynamics
Four of the participants (P10, P15, P16, and P18) shared interactive visualizations. The other eight participants shared static visualizations. The type of visualization, as well as the questions they initially brought, can be seen in Table II. To safeguard participant privacy, we refrain from disclosing their visualizations or any elements of their questions that could potentially reveal information about participants.
In the ChatGPT section of the interview, the majority of the participants asked ChatGPT at least one follow-up question. The follow-up questions to ChatGPT tended to be more specific and technical than the follow-up questions asked to the Human experts. For example, P11 asked ChatGPT “What are the pros and cons of having too many bubbles on the scatterplot from having a clear comparison?”
On the other hand, the follow up questions to the Human experts tended to be less structured and more conversational. The participant and expert had a conversation and pulled out different aspects of the question along the way. There was a lot of stopping to clarify what different elements of the visualization meant and how they played into the visualization. As a result, other factors not explicitly mentioned in the question often ended up getting brought up in these sessions with the Human experts.
IV-E2 Post Survey Results
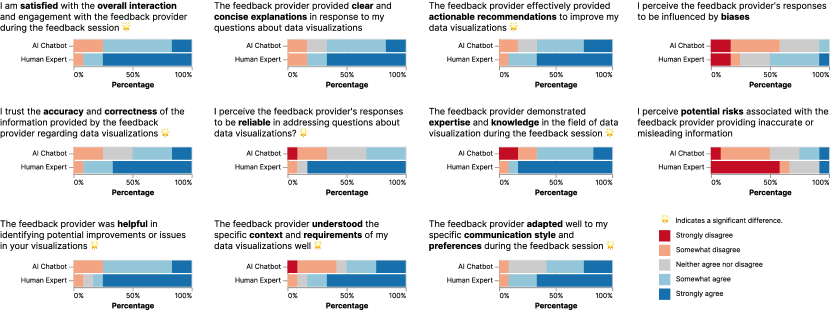
In Figure 4, we present the outcomes of the experience surveys conducted following each feedback session. The overarching consensus among participants was a strong preference for Human experts. This preference was underscored by statistically significant distinctions, as determined through two-tailed Mann-Whitney U tests (1: strongly disagree to 5: strongly agree). Specifically, participants expressed significantly higher levels of satisfaction in interacting with Human experts (, ), perceiving their responses as notably more accurate (, ), helpful (, ), reliable (, ), and adaptable (, ) to their preferences.
Furthermore, respondents indicated that Human experts exhibited a significantly deeper understanding of the context and requirements of their queries. Human experts were also acknowledged for their expertise in data visualization, along with their ability to offer actionable recommendations. It is worth noting that no significant differences were observed in responses to questions related to the clarity and conciseness of explanations, concerns about potential biases, or perceived risks of receiving misleading information.
IV-E3 Where Human Experts Excel
All participants were generally more satisfied with Human experts. They mentioned a variety of reasons for such opinions. The participants highlighted several key themes in their responses, shedding light on the strengths of Human experts in the context of data visualization guidance.
Bespoke and focused feedback of Human experts
First of all, they liked Human experts’ ability to offer tailored recommendations that were closely aligned with the specific visuals in question (P10, P11, P15, P17 - P21). P17 exemplified this sentiment by stating, “[…] recommendations are a lot more tailored and specific in that way, versus just like being tossed a list of potential tools we can look.”. P11 further elaborated on this point by highlighting that Human experts can envision various options and present the ones they deem most valuable. They also noted that Human experts could effectively understand the context of visuals by directly observing them (P11, P17 - P19). P19 expressed this sentiment by stating, “I felt the feedback was obviously more grounded to the visualization at hand. Because again, they could see it.” Similarly, P18 commented, “As he’s looking at the pictures, he knows the information I had access to and how that translates.” Furthermore, participants acknowledged that Human experts excelled in staying focused on the specific problem at hand. For instance, P15 articulated, “[the expert] was able to talk about improvements within scope […] without redesigning it entirely.” Similarly, P10 commented, “The ones that [the expert] gave were within the scope of refining existing visualizations.”
Collaborative and natural conversations
Participants consistently expressed the value of more fluid conversations when interacting with Human experts (P10, P11, P15, P17, P19, P20). They highlighted that Human responses felt more free-flowing, contributing to a sense of genuine interaction (P10, P17). Participants also noted that Human-expert interactions provided a collaborative and interactive experience (P11, P15, P19, P20). For instance, P11 highlighted an efficient turn-taking dynamic by saying, “the ability to ask follow-up questions and clarify I think was easier to do within the Human interaction context.” Others similarly emphasized the convenience of seeking clarifications without the need for precise phrasing or additional context adjustments (P11, P15).
Enriched insights through lived experience
Participants felt that Human experts’ responses were often rooted in their experience and education (P16). They valued the ability of Human experts to explain the underlying rationale, promoting a more actionable approach to implementing the suggestions (P10). Furthermore, participants appreciated the Human experts’ ability to think beyond the obvious; as P13 noted, “I feel like I was definitely more satisfied with the Human experts, […] they just started thinking so many things beyond anything I could have think of.” Moreover, participants conveyed that interactions with Human experts felt personal and supportive. One participant reflected, “they were really walking me through the different things […] help you grow as a professional […] really pushing me.”, while another participant recognized the proactiveness of Human experts by saying “even if I didn’t ask question, they kind of brought it up.”
IV-E4 Where ChatGPT excels
Participants identified the strengths of ChatGPT in contrast to Human experts.
Brainstorming and ideation
ChatGPT’s role as a creative catalyst emerged prominently during participant discussions, underlining its capacity to spark innovative ideas (P11, P15, P18). Participants like P18 found unexpected and impressive suggestions, stating, “It did have some cool ideas, I didn’t expect this from ChatGPT. So pretty. Pretty good.”, while P11 commented, “I think it’s really interesting to try and kind of break outside the box and get more creative… GPT has the potential to disrupt that workflow in a positive way.” Likewise, P15 also acknowledged that the tool may not always provide precise solutions but rather serve as a springboard for creative exploration. P15 contrasts this to Human experts by saying, “[expert] feedback was less brainstorming and more actual critique.”
Broad knowledge base
In a similar vein to its brainstorming capability, participants also highlighted ChatGPT’s capacity to serve as a vast repository of knowledge, offering a wide array of ideas (P10, P11, P15). P10 stated, “it really does kind of feel like a really fancy kind of search engine, where it is kinda, I give it a problem. And it’s like, oh, like, this might be a solution.”, while P15 said, “great place to go to start […] researching or come up with ideas you hadn’t thought of.” P11 similarly emphasized that ChatGPT excels at showcasing a range of data visualization options, making it a valuable resource during the initial stages of projects. P11 elaborated on the tool’s potential, envisioning a scenario where metadata about a dataset could be fed to ChatGPT to receive chart-type recommendations. However, P10 emphasized that a critical eye is needed to discern the relevant and valuable insights from its outputs; “I asked to give 20 ideas and I’m […] experienced enough […] to […] know that, like, 16 of them are just nonsense. The other four things I might not have thought of.”
Time saved via rapid understanding and response
Participants appreciated ChatGPT’s ability to quickly grasp and provide information (P10, P11, P13). P10 said ChatGPT was able to quickly grasp unfamiliar concepts auxiliary to visualization (e.g., explaining Wordle to ChatGPT), while P11 and P13 felt ChatGPT provided faster and more comprehensive lists of options, especially for alternative chart types, when compared to the responses from Human experts. On a related note, P11 said that Human interactions can sometimes involve a lengthier back-and-forth process to arrive at the right question.
Soft attitude and neutral perspective
Other participants noted ChatGPT’s behavioral traits. For example, P19 pointed out that ChatGPT often assumed a gentle and agreeable attitude by acknowledging concerns without offering specific directions, which led to a perception of excessive alignment. P19 also noted that ChatGPT demonstrated a neutral stance, presenting a variety of viewpoints without favoring any particular side. This contrasted with Human experts who might convey their own biases, thereby making ChatGPT’s approach seem more balanced.
IV-E5 Where ChatGPT falls short
Participants also discussed ChatGPT’s several shortcomings in comparison to Human experts.
Lack of depth in responses
Participant feedback indicated a notable lack of depth in ChatGPT’s responses (P13, P15, P19). For instance, P19 expressed that ChatGPT’s advice seemed to lack actionable insights and depth that Human experts possess. This sentiment was echoed by P15, who noted that while ChatGPT’s answers were broad in knowledge, they lacked depth. P15 further elaborated that ChatGPT often suggested radical changes (i.e., diverse ideas), while Human experts provided improvements that were more aligned with refining existing visualizations. P19 similarly commented that ChatGPT’s ideas were not considering the specific visualization. Participants acknowledged this contrast as a trade-off (P15, P17), emphasizing that the desired level of response detail and granularity from either ChatGPT or Human experts depends on user needs.
Generic advice, misalignment, and lack of critical thinking
Participants expressed that ChatGPT’s feedback often felt generic and lacked contextual depth (P12, P16, P20). P20 expressed that ChatGPT’s “knowledge felt […] not necessarily backed up by experience.” P16 and P12 similarly noted that ChatGPT’s responses were not necessarily wrong but were overly generic, failing to consider the actual outcomes of the provided recommendations. P16 further commented that they “felt the areas of improvement were good suggestions. But it didn’t feel like you have to do this.”
Several participants highlighted instances of misalignment and a lack of specificity in ChatGPT’s recommendations (P11, P16, P19). P19 pointed out an example where ChatGPT suggested color maps that might create confusion rather than improve visualizations. This lack of alignment was further emphasized by P11, who noted a communication hurdle hindering the establishment of a common understanding and precise feedback.
Participants highlighted concerns related to critical thinking (P13, P16). P16 noted, “whereas the ChatGPT felt more like it was telling me what I wanted to hear if that makes sense.” P16 further elaborated that ChatGPT’s responses sometimes resembled textbook information rather than offering insightful suggestions on visualization. P13 shared a similar sentiment, stating, “And I feel like the issue with ChatGPT typically is that it only responds to your question. So if you cannot think of the question, it will not give you the answer.”
Efforts required for fluid conversation
Participants highlighted the challenges in having a fluid and interactive conversation with ChatGPT (P10, P13, P16, P17, P20). For instance, P10 explained, “… kind of hoping that one of them would be what I wanted.”. P17 expressed a similar sentiment, stating, “even though it’s still conversational, but it still kind of feels a little bit static sometimes where you’re just typing text into a text box.” P16 further emphasized the difference in interaction dynamics, stating, “I really liked listening to the Human experts go back and forth, and talk about different aspects… whereas ChatGPT just fed that to me, and that was it.” P13 noted that ChatGPT’s responses often required iterations and follow-ups, P10 found that ChatGPT’s insights became more specific and interesting when more constraints were provided.
IV-E6 Opinions on Trust Reliability with ChatGPT
Participants had varied opinions on the trustworthiness and reliability of ChatGPT’s responses, with some expressing low trust (P10, 18, P20). P20 mentioned the limitations in ChatGPT’s understanding of visuals, which relied heavily on the accuracy of participants’ descriptions. P18 pointed out the potential for fabricated information due to the algorithmic nature of the responses. P10 echoed this sentiment, indicating that ChatGPT often sounded too confident and authoritative, which could mislead users into placing unwarranted trust. On the other hand, P17 said the two are relatively the same, highlighting that the key distinction lies in how information is delivered.
Several other participants pointed to the need for due diligence in evaluating ChatGPT’s suggestions, especially when the user lacks domain expertise (P10, P15). For instance, P10 commented: “If I was in a field that I wasn’t familiar with, I think it’d be really easy to get fooled by it.” P15 drew a parallel with the early inception of Wikipedia, stating, “ it was like early days of Wikipedia, I was taught like, never cite Wikipedia, it could be wrong. And I think the same thing is true of something like a large language model.”
They also made comparisons to Human experts in terms of trust and authority (P13, P16, P18, P21). They explained how the credentials of Human respondents influenced their perception (P18, P21), e.g., “Well, the Human respondent is a professor in visualization.”—P18. Others perceived Human experts as sounding knowledgeable and educational (P13, P16). In contrast to these, participants also shared their perceptions of expertise and self-awareness in AI. P16 said, “Didn’t feel like that the ChatGPT response was incorrect … trusted it, but not nearly as much as the Humans.”, while P20 expressed, “ChatGPT doesn’t know when it’s wrong.”
IV-E7 Limitations and Opportunities with ChatGPT
Participants expressed an optimistic outlook regarding the future potential of ChatGPT, despite acknowledging its current challenges (P10, P12, P15, P16). They discussed aspects they would like to see improved in ChatGPT in the future.
Ability to convey complex visualizations
Participants emphasized the significance of enabling ChatGPT to comprehend and interpret complex visualizations, highlighting the limitations of text-based communication when dealing with intricate design problems (P10, P11, P13, P15 - 21). P15 acknowledged the inherent loss of information when translating between visual and written mediums, while P10 and P11 conveyed the complexity of describing interactive dashboards and multimedia visualizations via text. P10 also mentioned video recordings that could convey the interactivity of designs.
Ability to generate visualizations based on feedback
Several participants pondered the prospect of ChatGPT being able to not only analyze input information but also generate relevant visualizations (P18, P19, P21). For example, P18 proposed the generation or modification of images based on textual descriptions. P19 noted the convenience of sharing underlying code to accompany visual content, emphasizing its value in effectively communicating complex ideas instead of relying solely on text descriptions. Similarly, P21 discussed the concept of inputting data and posing questions to explore the space of chart design. P13 envisioned the integration of ChatGPT within existing tools, enhancing workflow efficiency and facilitating a more cohesive user experience.
Facilitating Fluid and Truthful Conversations
Participants expressed the need for ChatGPT to initiate and support more fluid conversations to enhance its usability and value (P11, P16, P21). P16 highlighted the need for AI to prompt users for further details about the visualization; “I would really like it if it were to ask me questions to kind of gauge my thought process.” Similarly, P11 noted the value of follow-up questions in driving valuable insights, while “it was harder to envision what a follow-up question to that system would be.” On the other hand, P21 raised concerns about the possibility of ChatGPT providing false or hallucinated information.
The indispensable role of Human feedback
The consensus among participants highlighted the enduring value of Human feedback in evaluating and improving visualizations (P11, P16, P21). P16 commented, “I think there’s always, at least in my lifetime, going to be a need for Human interpretation. And the Human experts’ sessions, for me, reinforce that they offer a lot of really good insight.” P11 further expressed that despite ChatGPT’s capabilities, the feedback from actual users remains incomparable, as it encompasses a deeper level of insight into user experience. Additionally, P11 discussed ideas of experimenting with different personas for hypothetical user interactions.
Issues with privacy and sensitive data
Participants in the interviews expressed significant concerns regarding the privacy and handling of sensitive data by ChatGPT (P15, P16, P20, P21). They emphasized that sharing visuals containing private or sensitive information would be uncomfortable and unlikely unless the data was from a public source or there was a guarantee that it would not be shared publicly. P15 shared an illustrative example, stating, “I met a company that I had to sign an NDA with, and we are not allowed to use ChatGPT with anything that might be considered confidential information because that information goes onto OpenAI servers and will live there for eternity.”
V Discussions
V-A Lessons learned from the Interview Study
The findings from our study underscore the distinct strengths and limitations of ChatGPT in comparison to Human experts. The clear preference for Human experts among participants highlights their superior ability to provide tailored, context-specific advice and engage in more interactive and collaborative conversations. This preference is rooted in the Human experts’ deep understanding of visualization context and their capacity for nuanced, bespoke feedback.
On the other hand, ChatGPT shows promise as a creative catalyst and a broad knowledge base, offering rapid responses and a diverse array of ideas. However, its limitations are evident in the lack of depth and specificity in responses, challenges in fluid conversation, and concerns about trustworthiness [50, 51, 52, 53, 54] and handling sensitive data [55]. Several participants expressed concerns about needing expertise to assess the validity and relevance of potentially inaccurate suggestions from ChatGPT. Nonetheless, they remained optimistic about its future potential, anticipating continued improvements and increasing value.
V-B Comparisons to Human responses from VisGuides
Both studies highlighted ChatGPT’s ability to offer a list of broad ideas. However, a notable difference was participants’ strong preference for Human experts. This disparity might be attributed to several factors. A primary reason is that while any member of the VisGuides community can respond to questions on the forum, the feedback sessions were consistently answered by experienced visualization experts. Additionally, these sessions occurred in real-time, ensuring that Human experts did not overlook any aspects of participant questions and maintained heightened attention and thoroughness. Conversely, there were notable similarities too. For instance, Human experts in the feedback sessions often enhanced their verbal responses by sharing supporting links and related articles through Zoom chat. Overall, the responses from Human experts in these sessions closely paralleled the high-scoring Human responses observed in the Visguides analysis that also offered in-depth and specific ideas.
V-C Limitations of our study & future opportunities
While our experiment was designed and conducted with considerable care, it is important to acknowledge certain constraints. One notable restriction is the lack of demographic and expertise data for the Human respondents in the VisGuides forum, which poses a challenge in making direct comparisons with the Human experts. Moreover, we relied on the subjective opinions of participants to assess the feedback sessions, which provided more direct and accurate evaluations instead of the static evaluation metrics used in the VisGuides analysis. Future studies might control these factors to enable consistent comparisons between forum respondents and Human experts, as well as to develop more robust evaluation metrics for dynamic, real-time feedback sessions (e.g., LLM-as-a-judge [56]). Despite these methodological differences across the studies, however, it is worth noting that both approaches highlighted valuable and consistent insights into the capabilities and limitations of ChatGPT.
V-D Improving perceptual and cognitive abilities
One significant challenge encountered while interacting with ChatGPT was its lack of nuanced image understanding. Consequently, despite the effectiveness of our template for describing chart types and visual encodings (P10), ChatGPT struggled to comprehend the intricate visual patterns depicted in the charts. We noticed that providing additional descriptions of these perceptual patterns improved ChatGPT’s performance in the VisGuides analysis, although some participants expressed concerns about the need to manually input such descriptions. A few months following our studies, platforms such as ChatGPT Plus, Bard, and Bing began supporting image input. However, existing vision systems are primarily trained on natural images and are knowned to be ill-equipped to handle synthetic images such as graphic designs and data visualizations [57, 58].
In a brief test conducted in September 2023, where we posed ten questions from VisGuides to Bard, their responses did not seem to surpass ChatGPT’s performance. For instance, Bard consistently recommended adding elements that were already present in the visualization, such as legends, color encodings, and titles. Furthermore, Bard’s recommendations were narrower in scope and often not applicable, like suggesting the addition of a trend line to a Gantt Chart. In December 2023, we began analyzing the differences in responses between ChatGPT and ChatGPT Plus. Testing 10% of the Visguide questions with ChatGPT Plus, we noted that it generally provides responses that are more succinct and focused, often addressing specific elements of the visualizations. We plan to investigate this comparison more systematically (see Section V-H for our future direction).
V-E Ability to proactively engage in discussions
Another major challenge reported by participants was the absence of fluid conversation and turn-tracking. ChatGPT functions as a chatbot that responds solely to user instructions, and it is also trained to align with users’ intentions [59]. This design makes ChatGPT more passive and affirmative in comparison to Human experts, who frequently pose clarifying questions and may even offer unsolicited advice. There exists a potential trade-off between these two communication styles. On the one hand, there’s a concern about unsafe or misalignment scenarios where AI chatbots might have the ability to intervene and provide malicious or irrelevant feedback. On the other hand, there are situations where practitioners struggle to formulate questions because they may not yet discern what’s wrong with their visualizations. Our participants often found themselves in this latter scenario, where they did not know what kind of follow-up questions to ask. It would be valuable to conduct further investigations into passive and active Human-AI alignments within this problem context. For instance, a middle-ground approach could involve ChatGPT suggesting potential follow-up questions similar to the current capabilities of Bing.
V-F Integrating into a practitioner’s workflow
Several participants mentioned that they primarily use ChatGPT for tasks related to writing or debugging code in order to generate visualizations (P10, P12, P13, P16, P18). The robust code generation and comprehension capabilities of large language models (LLMs), such as Github Copilot [60], are relatively well-known. On the other hand, data visualization practice rests on two pillars: design and implementation. Our study sheds light on ChatGPT’s current state in terms of design knowledge beyond implementation knowledge. However, existing data visualization tools often fall short of conveying effective data visualization knowledge to designers. As P13 suggests, the integration of a ChatGPT-like assistant within current tools would be highly beneficial. Such a design assistant could assist in suggesting appropriate chart types (P11, P21) or providing rationales or critiques for generated visualizations.
V-G ChatGPT for design knowledge education
Some participants noted ChatGPT’s potential for education (P20, P21), such as assisting with understanding unfamiliar charts or aiding in writing educational blogs on data visualization. A recent paper identifies challenges in visualization education [61], highlighting AI as a valuable tool for formal and informal learning contexts. However, concerns include the consistency and quality of AI-generated content, as differing responses to students could be problematic. There’s also the risk of students over-relying on AI instead of engaging critically with visualizations, e.g., through peer feedback. Future AI systems in education may act as personalized tutors, tracking progress, guiding learning goals, and fostering both comprehension and generation of visualizations.
V-H Benchmarking ChatGPT in Data Visualization
Our study lays the groundwork for comprehensive benchmarking of LLMs in data visualization. Akin to other domain-specific benchmarks [35, 62, 63], understanding LLMs’ grasp of data visualization nuances bears considerable implications for the field, as we anticipate a surge in LLM-driven visualization advancements. Ensuring these advancements are grounded in a profound understanding of LLM knowledge capacities in data visualization is paramount. Our collection of questions and evaluation metrics can initiate a scalable benchmark system for a wider range of models beyond ChatGPT. LLM-based evaluation can further address tedious human evaluation issues [64, 65, 66, 67], while new task metrics and diverse real-world datasets are crucial to capture LLMs’ full potential across various problem domains. This new direction in assessing LLM capabilities in data visualization parallels the evaluation of human abilities in visual perception and cognition.
VI Conclusion
In this study, we explored the potential of ChatGPT as a design companion, focusing on its capacity to provide valuable visualization insights to practitioners. Our findings reveal that ChatGPT, despite its absence of visual perception at the time of evaluation, capitalizes on a vast knowledge repository to generate diverse and imaginative suggestions. While limitations like the depth of its responses and interaction dynamics exist, participants expressed optimism about its future utility. Looking ahead, our future research endeavors will involve investigating state-of-the-art chart understanding vision models to develop a multimodal visualization feedbaack agent. Additionally, we plan to delve into the design space of integrating such a knowledge companion into existing data visualization tools, further enhancing its practical applicability.
Acknowledgments
We would like to acknowledge the support of the National Science Foundation (#2146868).
References
- [1] S. Esteves and M. Neves, ““i learned it on the job” becoming a data visualization professional in news media,” Information Design Journal, vol. 27, no. 3, pp. 309–319, 2022. [Online]. Available: https://www.jbe-platform.com/content/journals/10.1075/idj.22004.est
- [2] Data visualization society surveys. Accessed on Sep 9, 2023. [Online]. Available: https://www.datavisualizationsociety.org/survey-history
- [3] J. Choi, C. Oh, Y.-S. Kim, and N. W. Kim, “Vislab: Enabling visualization designers to gather empirically informed design feedback,” in Proceedings of the 2023 CHI Conference on Human Factors in Computing Systems, ser. CHI ’23. New York, NY, USA: Association for Computing Machinery, 2023. [Online]. Available: https://doi.org/10.1145/3544548.3581132
- [4] H. K. Bako, X. Liu, L. Battle, and Z. Liu, “Understanding how designers find and use data visualization examples,” IEEE Transactions on Visualization and Computer Graphics, vol. 29, no. 1, pp. 1048–1058, 2023.
- [5] K. Luther, J.-L. Tolentino, W. Wu, A. Pavel, B. P. Bailey, M. Agrawala, B. Hartmann, and S. P. Dow, “Structuring, aggregating, and evaluating crowdsourced design critique,” in Proceedings of the 18th ACM Conference on Computer Supported Cooperative Work & Social Computing, ser. CSCW ’15. New York, NY, USA: Association for Computing Machinery, 2015, p. 473–485. [Online]. Available: https://doi.org/10.1145/2675133.2675283
- [6] J. Okerlund, E. Klasky, A. Middha, S. Kim, H. Rosenfeld, M. Kleinman, and S. Parthasarathy, “What’s in the chatterbox? large language models, why they matter, and what we should do about them,” 2022.
- [7] OpenAI, “ChatGPT,” https://openai.com/chatgpt, accessed on Sep 7, 2023.
- [8] A. Diehl, A. Abdul-Rahman, M. El-Assady, B. Bach, D. Keim, and M. Chen, “VisGuides: A Forum for Discussing Visualization Guidelines,” in EuroVis 2018 - Short Papers, J. Johansson, F. Sadlo, and T. Schreck, Eds. The Eurographics Association, 2018.
- [9] J. Choi, C. Oh, B. Suh, and N. W. Kim, “Toward a unified framework for visualization design guidelines,” in Extended Abstracts of the 2021 CHI Conference on Human Factors in Computing Systems, ser. CHI EA ’21. New York, NY, USA: Association for Computing Machinery, 2021. [Online]. Available: https://doi.org/10.1145/3411763.3451702
- [10] P. Parsons, “Understanding data visualization design practice,” IEEE Transactions on Visualization; Computer Graphics, vol. 28, no. 01, pp. 665–675, jan 2022.
- [11] P. Parsons, C. M. Gray, A. Baigelenov, and I. Carr, “Design judgment in data visualization practice,” in 2020 IEEE Visualization Conference (VIS), Oct 2020, pp. 176–180.
- [12] P. Parsons and P. Shukla, “Data visualization practitioners’ perspectives on chartjunk,” in 2020 IEEE Visualization Conference (VIS), Oct 2020, pp. 211–215.
- [13] I. Chalkidis, I. Androutsopoulos, and N. Aletras, “Neural legal judgment prediction in English,” in Proceedings of the 57th Annual Meeting of the Association for Computational Linguistics. Florence, Italy: Association for Computational Linguistics, 2019, pp. 4317–4323. [Online]. Available: https://aclanthology.org/P19-1424
- [14] J. Devlin, M.-W. Chang, K. Lee, and K. Toutanova, “Bert: Pre-training of deep bidirectional transformers for language understanding,” arXiv preprint arXiv:1810.04805, 2018.
- [15] T. Brown, B. Mann, N. Ryder, M. Subbiah, J. D. Kaplan, P. Dhariwal, A. Neelakantan, P. Shyam, G. Sastry, A. Askell, S. Agarwal, A. Herbert-Voss, G. Krueger, T. Henighan, R. Child, A. Ramesh, D. Ziegler, J. Wu, C. Winter, C. Hesse, M. Chen, E. Sigler, M. Litwin, S. Gray, B. Chess, J. Clark, C. Berner, S. McCandlish, A. Radford, I. Sutskever, and D. Amodei, “Language models are few-shot learners,” in Advances in Neural Information Processing Systems, H. Larochelle, M. Ranzato, R. Hadsell, M. Balcan, and H. Lin, Eds., vol. 33. Curran Associates, Inc., 2020, pp. 1877–1901. [Online]. Available: https://proceedings.neurips.cc/paper_files/paper/2020/file/1457c0d6bfcb4967418bfb8ac142f64a-Paper.pdf
- [16] R. OpenAI, “Gpt-4 technical report,” arXiv, pp. 2303–08 774, 2023.
- [17] H. Touvron, T. Lavril, G. Izacard, X. Martinet, M.-A. Lachaux, T. Lacroix, B. Rozière, N. Goyal, E. Hambro, F. Azhar et al., “Llama: Open and efficient foundation language models,” arXiv preprint arXiv:2302.13971, 2023.
- [18] R. Bommasani, D. A. Hudson, E. Adeli, R. Altman, S. Arora, S. von Arx, M. S. Bernstein, J. Bohg, A. Bosselut, E. Brunskill, E. Brynjolfsson, S. Buch, D. Card, R. Castellon, N. S. Chatterji, A. S. Chen, K. A. Creel, J. Davis, D. Demszky, C. Donahue, M. Doumbouya, E. Durmus, S. Ermon, J. Etchemendy, K. Ethayarajh, L. Fei-Fei, C. Finn, T. Gale, L. E. Gillespie, K. Goel, N. D. Goodman, S. Grossman, N. Guha, T. Hashimoto, P. Henderson, J. Hewitt, D. E. Ho, J. Hong, K. Hsu, J. Huang, T. F. Icard, S. Jain, D. Jurafsky, P. Kalluri, S. Karamcheti, G. Keeling, F. Khani, O. Khattab, P. W. Koh, M. S. Krass, R. Krishna, R. Kuditipudi, A. Kumar, F. Ladhak, M. Lee, T. Lee, J. Leskovec, I. Levent, X. L. Li, X. Li, T. Ma, A. Malik, C. D. Manning, S. P. Mirchandani, E. Mitchell, Z. Munyikwa, S. Nair, A. Narayan, D. Narayanan, B. Newman, A. Nie, J. C. Niebles, H. Nilforoshan, J. F. Nyarko, G. Ogut, L. Orr, I. Papadimitriou, J. S. Park, C. Piech, E. Portelance, C. Potts, A. Raghunathan, R. Reich, H. Ren, F. Rong, Y. H. Roohani, C. Ruiz, J. Ryan, C. R’e, D. Sadigh, S. Sagawa, K. Santhanam, A. Shih, K. P. Srinivasan, A. Tamkin, R. Taori, A. W. Thomas, F. Tramèr, R. E. Wang, W. Wang, B. Wu, J. Wu, Y. Wu, S. M. Xie, M. Yasunaga, J. You, M. A. Zaharia, M. Zhang, T. Zhang, X. Zhang, Y. Zhang, L. Zheng, K. Zhou, and P. Liang, “On the opportunities and risks of foundation models,” arXiv preprint arXiv:2108.07258, 2021. [Online]. Available: https://crfm.stanford.edu/assets/report.pdf
- [19] W. X. Zhao, K. Zhou, J. Li, T. Tang, X. Wang, Y. Hou, Y. Min, B. Zhang, J. Zhang, Z. Dong, Y. Du, C. Yang, Y. Chen, Z. Chen, J. Jiang, R. Ren, Y. Li, X. Tang, Z. Liu, P. Liu, J.-Y. Nie, and J.-R. Wen, “A survey of large language models,” arXiv preprint arXiv:2303.18223, 2023.
- [20] A. Radford, J. Wu, R. Child, D. Luan, D. Amodei, I. Sutskever et al., “Language models are unsupervised multitask learners,” OpenAI blog, vol. 1, no. 8, p. 9, 2019.
- [21] A. Radford, K. Narasimhan, T. Salimans, I. Sutskever et al., “Improving language understanding by generative pre-training,” 2018.
- [22] J. Wei, Y. Tay, R. Bommasani, C. Raffel, B. Zoph, S. Borgeaud, D. Yogatama, M. Bosma, D. Zhou, D. Metzler, E. H. Chi, T. Hashimoto, O. Vinyals, P. Liang, J. Dean, and W. Fedus, “Emergent abilities of large language models,” Transactions on Machine Learning Research, 2022.
- [23] E. M. Bender, T. Gebru, A. McMillan-Major, and S. Shmitchell, “On the dangers of stochastic parrots: Can language models be too big?” in Proceedings of the 2021 ACM Conference on Fairness, Accountability, and Transparency, ser. FAccT ’21. New York, NY, USA: Association for Computing Machinery, 2021, p. 610–623. [Online]. Available: https://doi.org/10.1145/3442188.3445922
- [24] P. Liang, R. Bommasani, T. Lee, D. Tsipras, D. Soylu, M. Yasunaga, Y. Zhang, D. Narayanan, Y. Wu, A. Kumar et al., “Holistic evaluation of language models,” arXiv preprint arXiv:2211.09110, 2022.
- [25] Y. Chang, X. Wang, J. Wang, Y. Wu, K. Zhu, H. Chen, L. Yang, X. Yi, C. Wang, Y. Wang et al., “A survey on evaluation of large language models,” arXiv preprint arXiv:2307.03109, 2023.
- [26] C. Qin, A. Zhang, Z. Zhang, J. Chen, M. Yasunaga, and D. Yang, “Is chatgpt a general-purpose natural language processing task solver?” arXiv preprint arXiv:2302.06476, vol. abs/2302.06476, 2023.
- [27] Z. Zhang, A. Zhang, M. Li, H. Zhao, G. Karypis, and A. Smola, “Multimodal chain-of-thought reasoning in language models,” arXiv preprint arXiv:2302.00923, 2023.
- [28] M. Nadeem, A. Bethke, and S. Reddy, “Stereoset: Measuring stereotypical bias in pretrained language models,” in Proceedings of the 59th Annual Meeting of the Association for Computational Linguistics and the 11th International Joint Conference on Natural Language Processing (Volume 1: Long Papers). Association for Computational Linguistics, 2021, pp. 5356–5371.
- [29] Y. C. Tan and L. E. Celis, Assessing Social and Intersectional Biases in Contextualized Word Representations. Red Hook, NY, USA: Curran Associates Inc., 2019.
- [30] S. Gehman, S. Gururangan, M. Sap, Y. Choi, and N. A. Smith, “RealToxicityPrompts: Evaluating neural toxic degeneration in language models,” in Findings of the Association for Computational Linguistics: EMNLP 2020. Association for Computational Linguistics, 2020, pp. 3356–3369.
- [31] E. Kasneci, K. Sessler, S. Küchemann, M. Bannert, D. Dementieva, F. Fischer, U. Gasser, G. Groh, S. Günnemann, E. Hüllermeier, S. Krusche, G. Kutyniok, T. Michaeli, C. Nerdel, J. Pfeffer, O. Poquet, M. Sailer, A. Schmidt, T. Seidel, M. Stadler, J. Weller, J. Kuhn, and G. Kasneci, “Chatgpt for good? on opportunities and challenges of large language models for education,” Learning and Individual Differences, vol. 103, p. 102274, 2023. [Online]. Available: https://www.sciencedirect.com/science/article/pii/S1041608023000195
- [32] D. Baidoo-Anu and L. Owusu Ansah, “Education in the era of generative artificial intelligence (ai): Understanding the potential benefits of chatgpt in promoting teaching and learning,” Available at SSRN 4337484, 2023.
- [33] A. Tlili, B. Shehata, M. A. Adarkwah, A. Bozkurt, D. T. Hickey, R. Huang, and B. Agyemang, “What if the devil is my guardian angel: ChatGPT as a case study of using chatbots in education,” Smart Learning Environments, vol. 10, no. 1, p. 15, 2023. [Online]. Available: https://doi.org/10.1186/s40561-023-00237-x
- [34] A. Gilson, C. W. Safranek, T. Huang, V. Socrates, L. Chi, R. A. Taylor, D. Chartash et al., “How does chatgpt perform on the united states medical licensing examination? the implications of large language models for medical education and knowledge assessment,” JMIR Medical Education, vol. 9, no. 1, p. e45312, 2023.
- [35] Z. Fei, X. Shen, D. Zhu, F. Zhou, Z. Han, S. Zhang, K. Chen, Z. Shen, and J. Ge, “Lawbench: Benchmarking legal knowledge of large language models,” arXiv preprint arXiv:2309.16289, 2023.
- [36] J. H. Choi, K. E. Hickman, A. Monahan, and D. Schwarcz, “Chatgpt goes to law school,” Available at SSRN, 2023.
- [37] S. Mollman, “Chatgpt passed a wharton mba exam and it’s still in its infancy. one professor is sounding the alarm,” https://fortune.com/2023/01/21/chatgpt-passed-wharton-mba-exam-one-professor-is-sounding-alarm-artificial-intelligence/, 2023, accessed on Sep 7, 2023.
- [38] P. Lee, S. Bubeck, and J. Petro, “Benefits, limits, and risks of gpt-4 as an ai chatbot for medicine,” New England Journal of Medicine, vol. 388, no. 13, pp. 1233–1239, 2023.
- [39] A. Lahat, E. Shachar, B. Avidan, Z. Shatz, B. S. Glicksberg, and E. Klang, “Evaluating the use of large language model in identifying top research questions in gastroenterology,” Scientific Reports, vol. 13, no. 1, p. 4164, Mar. 2023. [Online]. Available: https://doi.org/10.1038/s41598-023-31412-2
- [40] J. Pan, “Large language model for molecular chemistry,” Nature Computational Science, vol. 3, no. 1, pp. 5–5, 2023. [Online]. Available: https://doi.org/10.1038/s43588-023-00399-1
- [41] S. Paik, “How i created a data visualization with zero coding skills, thanks to chatgpt,” Nightingale magazine by the Data Visualization Society, April 2023. [Online]. Available: https://nightingaledvs.com/data-visualization-using-chatgpt-to-code/
- [42] M. Hutchinson, A. Slingsby, R. Jianu, and P. Madhyastha, “Towards Visualisation Specifications from Multilingual Natural Language Queries using Large Language Models,” 2023.
- [43] V. Dibia, “Lida: A tool for automatic generation of grammar-agnostic visualizations and infographics using large language models,” in Proceedings of the 61st Annual Meeting of the Association for Computational Linguistics (Volume 3: System Demonstrations). Toronto, Canada: Association for Computational Linguistics, 2023, pp. 113–126. [Online]. Available: https://aclanthology.org/2023.acl-demo.11
- [44] S. D. Bartolomeo, G. Severi, V. Schetinger, and C. Dunne, “Ask and You Shall Receive (a Graph Drawing): Testing ChatGPT’s Potential to Apply Graph Layout Algorithms,” in EuroVis 2023 - Short Papers, T. Hoellt, W. Aigner, and B. Wang, Eds. The Eurographics Association, 2023.
- [45] P. Vaithilingam, T. Zhang, and E. L. Glassman, “Expectation vs. experience: Evaluating the usability of code generation tools powered by large language models,” in Extended Abstracts of the 2022 CHI Conference on Human Factors in Computing Systems, ser. CHI EA ’22. New York, NY, USA: Association for Computing Machinery, 2022. [Online]. Available: https://doi.org/10.1145/3491101.3519665
- [46] V. Schetinger, S. Di Bartolomeo, M. El-Assady, A. McNutt, M. Miller, J. P. A. Passos, and J. L. Adams, “Doom or deliciousness: Challenges and opportunities for visualization in the age of generative models,” Computer Graphics Forum, vol. 42, no. 3, pp. 423–435, 2023. [Online]. Available: https://onlinelibrary.wiley.com/doi/abs/10.1111/cgf.14841
- [47] A. Diehl, E. E. Firat, T. Torsney-Weir, A. Abdul-Rahman, B. Bach, R. Laramee, R. Pajarola, and M. Chen, “VisGuided: A Community-driven Approach for Education in Visualization,” in Eurographics 2021 - Education Papers, B. Sousa Santos and G. Domik, Eds. The Eurographics Association, 2021.
- [48] Data visualization society. https://www.datavisualizationsociety.com. Accessed: March 28, 2023.
- [49] A. Ihwan, “Role prompting,” https://www.linkedin.com/pulse/role-prompting-aris-ihwan/, accessed on Sep 8, 2023.
- [50] M. Yin, J. Wortman Vaughan, and H. Wallach, “Understanding the effect of accuracy on trust in machine learning models,” in Proceedings of the 2019 chi conference on human factors in computing systems, 2019, pp. 1–12.
- [51] E. Toreini, M. Aitken, K. Coopamootoo, K. Elliott, C. G. Zelaya, and A. Van Moorsel, “The relationship between trust in ai and trustworthy machine learning technologies,” in Proceedings of the 2020 conference on fairness, accountability, and transparency, 2020, pp. 272–283.
- [52] J. Drozdal, J. Weisz, D. Wang, G. Dass, B. Yao, C. Zhao, M. Muller, L. Ju, and H. Su, “Trust in automl: exploring information needs for establishing trust in automated machine learning systems,” in Proceedings of the 25th international conference on intelligent user interfaces, 2020, pp. 297–307.
- [53] F. Yang, Z. Huang, J. Scholtz, and D. L. Arendt, “How do visual explanations foster end users’ appropriate trust in machine learning?” in Proceedings of the 25th international conference on intelligent user interfaces, 2020, pp. 189–201.
- [54] A. Chatzimparmpas, R. M. Martins, I. Jusufi, K. Kucher, F. Rossi, and A. Kerren, “The state of the art in enhancing trust in machine learning models with the use of visualizations,” in Computer Graphics Forum, vol. 39, no. 3. Wiley Online Library, 2020, pp. 713–756.
- [55] B. Liu, M. Ding, S. Shaham, W. Rahayu, F. Farokhi, and Z. Lin, “When machine learning meets privacy: A survey and outlook,” ACM Computing Surveys (CSUR), vol. 54, no. 2, pp. 1–36, 2021.
- [56] L. Zheng, W.-L. Chiang, Y. Sheng, S. Zhuang, Z. Wu, Y. Zhuang, Z. Lin, Z. Li, D. Li, E. Xing et al., “Judging llm-as-a-judge with mt-bench and chatbot arena,” arXiv preprint arXiv:2306.05685, 2023.
- [57] Z. Bylinskii, N. W. Kim, P. O’Donovan, S. Alsheikh, S. Madan, H. Pfister, F. Durand, B. Russell, and A. Hertzmann, “Learning visual importance for graphic designs and data visualizations,” in Proceedings of the 30th Annual ACM Symposium on User Interface Software and Technology, ser. UIST ’17. New York, NY, USA: Association for Computing Machinery, 2017, p. 57–69. [Online]. Available: https://doi.org/10.1145/3126594.3126653
- [58] E. Hoque, P. Kavehzadeh, and A. Masry, “Chart question answering: State of the art and future directions,” Computer Graphics Forum, vol. 41, no. 3, pp. 555–572, 2022. [Online]. Available: https://onlinelibrary.wiley.com/doi/abs/10.1111/cgf.14573
- [59] L. Ouyang, J. Wu, X. Jiang, D. Almeida, C. Wainwright, P. Mishkin, C. Zhang, S. Agarwal, K. Slama, A. Ray et al., “Training language models to follow instructions with human feedback,” Advances in Neural Information Processing Systems, vol. 35, pp. 27 730–27 744, 2022.
- [60] “Github copilot,” https://github.com/features/copilot, accessed on Sep 9, 2023.
- [61] B. Bach, M. Keck, F. Rajabiyazdi, T. Losev, I. Meirelles, J. Dykes, R. S. Laramee, M. AlKadi, C. Stoiber, S. Huron et al., “Challenges and opportunities in data visualization education: A call to action,” arXiv preprint arXiv:2308.07703, 2023.
- [62] D. Jin, E. Pan, N. Oufattole, W.-H. Weng, H. Fang, and P. Szolovits, “What disease does this patient have? a large-scale open domain question answering dataset from medical exams,” Applied Sciences, vol. 11, no. 14, p. 6421, 2021.
- [63] T. Zhang, F. Ladhak, E. Durmus, P. Liang, K. McKeown, and T. B. Hashimoto, “Benchmarking large language models for news summarization,” arXiv preprint arXiv:2301.13848, 2023.
- [64] Y. Liu, D. Iter, Y. Xu, S. Wang, R. Xu, and C. Zhu, “Gpteval: Nlg evaluation using gpt-4 with better human alignment,” arXiv preprint arXiv:2303.16634, 2023.
- [65] J. Wang, Y. Liang, F. Meng, H. Shi, Z. Li, J. Xu, J. Qu, and J. Zhou, “Is chatgpt a good nlg evaluator? a preliminary study,” arXiv preprint arXiv:2303.04048, 2023.
- [66] J. Fu, S.-K. Ng, Z. Jiang, and P. Liu, “Gptscore: Evaluate as you desire,” arXiv preprint arXiv:2302.04166, 2023.
- [67] S. Kim, J. Shin, Y. Cho, J. Jang, S. Longpre, H. Lee, S. Yun, S. Shin, S. Kim, J. Thorne et al., “Prometheus: Inducing fine-grained evaluation capability in language models,” arXiv preprint arXiv:2310.08491, 2023.