Quantitative predictions of the thermal conductivity in transition metal dichalcogenides: The impact of point defects in \ceMoS2 and \ceWS2 monolayers
Abstract
Transition metal dichalcogenides are investigated for various applications at the nanoscale thanks to their unique combination of properties and dimensionality. For many of the anticipated applications, heat conduction plays an important role. At the same time, these materials often contain relatively large amounts of point defects. Here, we provide a systematic analysis of the impact of intrinsic and selected extrinsic defects on the lattice thermal conductivity of \ceMoS2 and \ceWS2 monolayers. We combine Boltzmann transport theory and the Green’s function-based -matrix approach for the calculation of scattering rates. The force constants for the defect configurations are obtained from density functional theory calculations via a regression approach, which allows us to sample a rather large number of defects at a moderate computational cost and to systematically enforce both the translational and rotational acoustic sum rules. The calculated lattice thermal conductivity is in quantitative agreement with experimental data for heat transport and defect concentrations for both \ceMoS2 and \ceWS2. Crucially, this demonstrates that the strong deviation from a -temperature dependence of the lattice thermal conductivity observed experimentally, can be fully explained by the presence of point defects. We furthermore predict the scattering strengths of the intrinsic defects to decrease in the sequence in both materials, while the scattering rates for the extrinsic (adatom) defects decrease with increasing mass such that . Compared to earlier work, we find that both intrinsic and extrinsic adatoms are relatively weak scatterers. We attribute this difference to the treatment of the translational and rotational acoustic sum rules, which if not enforced can lead to spurious contributions in the zero-frequency limit.
I Introduction
Transition metal dichalcogenides (TMDs) have emerged as fascinating materials in the fields of nanotechnology, electronics, and optoelectronics due to their quasi-two-dimensional (2D) structure and associated properties. Notable examples are molybdenum disulphide (\ceMoS2) and tungsten disulphide (\ceWS2). These 2D semiconducting compounds possess unique electronic, optical, and mechanical characteristics, distinct from those of their bulk counterparts. The distinctive characteristics arise from their ultrathin atomic layers, which makes them promising candidates for the development of next-generation nanodevices, including transistors, sensors, photodetectors, and catalysts [1, 2, 3, 4, 5].
The ability to efficiently conduct heat or, reciprocally, to impede its transport, can greatly impact the reliability, power dissipation, and thermal management of these materials in various applications, ranging from microelectronics to energy conversion systems [6]. It is therefore important to quantify the thermal conductivity and specifically the lattice thermal conductivity (LTC) in these materials [7, 8] and understand the limiting factors. In this context, calculations can be tremendously useful, in particular when rooted in an ab-initio framework. Yet, such calculations based on Boltzmann transport theory or Green-Kubo relations typically overestimate the LTC and yield a stronger temperature dependence than observed experimentally[9, 10]. The deviation can be accounted for by invoking a heuristic, semi-empirical boundary scattering term, which obfuscates the underlying reason for the discrepancy.
For fully periodic, three-dimensional materials such as \ceSiC [11] and \ceGaAs [12], it has been shown that the inclusion of point defect scattering is crucial for obtaining quantitative agreement with experimental measurements of the LTC. Thanks to the two-dimensional nature of TMDs such as \ceMoS2 and \ceWS2, it is possible to image defects directly, e.g., via scanning tunneling microscopy (STM) or scanning transmission electron microscopy (STEM), which points to the S vacancy as the most abundant intrinsic defect [13, 14, 15, 16, 17, 18]. These investigations have also shown the defect population to be sensitive to the synthesis conditions [14] and to exhibit considerable spatial variations [19, 20, 15].
While the majority of LTC research on TMDs so far has focused on phonon-phonon and isotope scattering in computational analyses, a few studies have also considered scattering by point defects and impurities [21, 22, 23, 24]. While these investigations clearly demonstrated the potential impact of defects, they are limited in scope, either because of the reliance on semi-empirical ingredients or because of the limited number of defect types considered (in particular extrinsic defects).
Methods based on the Boltzmann transport formalism afford very detailed insight into phonon scattering, flexibility when it comes to defect concentrations and, when combined with ab-initio theory, proven predictive value. However, in the case of quasi-2D systems very careful attention must be paid to the post-processing of the ab-initio calculations to remove the effects of boundary conditions that violate the symmetries of free space [25]. With that in mind, here we provide a physically founded, systematic analysis of the impact of intrinsic and selected extrinsic defects on the LTC of \ceMoS2 and \ceWS2 monolayers. This allows us to provide a quantitative description of the measured LTC without resorting to semi-empirical models and/or parameters.
II Methodology
II.1 Lattice thermal conductivity
The phononic contribution to the LTC can be calculated by solving the Boltzmann transport equation (BTE). In this work the BTE is solved under the relaxation time approximation (RTA), which yields the following expression for the LTC
| (1) |
Here, is the volume of unit cell while , , and are the phonon mean free path (MFP) (interpreted as a vector), group velocity, and specific heat capacity of mode with momentum vector , respectively. The MFP is proportional to the relaxation time . In this work the inverse of the relaxation time, i.e., the total scattering rate , is calculated using Matthiesen’s rule by adding the contributions from phonon-phonon (ph-ph), isotope (iso), and defect scattering (def):
In this work the phonon-phonon scattering rate , associated with the anharmonicity of the material is evaluated considering three-phonon processes. The term represents isotopic mass disorder and gives rise to a temperature-independent scattering rate. The calculation of the defect scattering rates is described in the next section. For comparison we also consider a model for boundary scattering given by
| (2) |
where is the characteristic length of the structural homogeneity of the material.
II.2 Phonon scattering by defects
The defect scattering rates can be obtained by using the optical theorem,
Here, is the volumetric defect concentration and is the angular phonon frequency. The -matrix links the phonon wave functions of the ideal and defect-laden systems through the relation
where is the retarded Green’s function of the ideal structure while represents the perturbation connecting the ideal and the defect-laden systems, which can be decomposed as
Here, the diagonal matrix describes changes in mass, with elements
while captures changes in the force constants (FCs) and is given by
Here, is the FC matrix where and are atomic indices while and denote Cartesian indices.
In the cases of vacancies and adatoms, the creation of the defect can be conceptualized as the connection or disconnection of a subset of atoms to/from the bulk system. The corresponding FCs are zero in the pristine system for adatoms, and in the defect-laden system for vacancies, but the atoms themselves are not replaced. The value of the mass perturbation becomes irrelevant, and can be taken as zero. To successfully implement this idea for vacancies, the Green’s function computed for the pristine system has to be augmented with a block corresponding to a free atom.
We use this Green’s-function-based -matrix approach as implemented in the almaBTE package [26], where the linear tetrahedron method [27, 28] is used to calculate the Green’s function of the ideal structure for each value of the incident phonon frequency. This software package has previously been successful in computing thermal transport properties of solids in the presence of varying concentrations of defects, achieving good agreement with experiment [11, 12].
II.3 Computational details
All structures and FCs were obtained from density functional theory (DFT) calculations that were carried out using the projector augmented-wave method [29] as implemented in the Vienna Ab-initio Simulation Package (VASP) [30, 31]. The exchange-correlation contribution was represented using the van-der-Waals density functional with consistent exchange (vdW-DF-cx) method [32, 33], which has been previously shown to provide an excellent description for TMDs [34, 9]. All calculations were carried out using a plane-wave energy cutoff of \qty260 and Gaussian smearing with a width of \qty0.1. Projection operators were evaluated in reciprocal space and a finer support grid was employed during the calculation of the forces to improve the numerical accuracy of the latter. For the primitive cells the Brillouin zone was sampled using a -centered \numproduct12x12x1 grid. For the representation of defect structures as well as the calculation of FCs, we used supercells comprising \numproduct8x8x1 primitive cells ( atoms); their Brillouin zone was sampled using a -centered \numproduct2x2x1 grid. A vacuum layer of at least \qty27 was introduced along the axis perpendicular to the monolayer to avoid interactions between periodic images of these quasi-2D systems. However, all values of the thermal conductivities are given for conventional thicknesses of \qty6.15 for \ceMoS2 and \qty6.18 for \ceWS2 [9].
The large defect-laden supercells, combined with their low symmetry, make it computationally expensive to evaluate the FCs through systematic enumeration of the displacements. For example, calculation of the FCs for a sulphur vacancy would require separate DFT calculations using a direct finite-displacement approach. We therefore resort to a regression approach [35, 36] based on recursive feature elimination via scikit-learn [37] and the hiphive package [36]. This approach allows one to reduce the number of DFT calculations by one to two orders of magnitude depending on cell size [38].
To obtain the second-order FCs for the different defect configurations, we generated structures with random displacements sampled from a Gaussian distribution with a standard deviation of \qty0.01. We then computed the forces for these reference structures via DFT (see above) and used them to construct FC models, splitting them into a training set (75% of the available data) and a validation set (25% of the data). To optimize the quality of the FC extraction, we carried out convergence studies with respect to the cutoff imposed on pair interactions (which sets the number of free parameters) and the number of structures included in the training procedure. The FC models also include a small number of third-order terms according to a triplet cutoff of \qty3, as this has been found to improve the quality of the second-order FCs by avoiding the spurious inclusion of small anharmonic contributions [38].
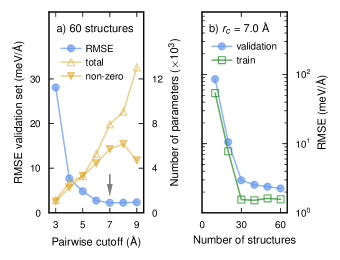
Using the sulphur vacancy (\ceV_S) in \ceMoS2 as an illustrating examples, it can be seen that, with a fixed reference set size comprising structures, the root-mean-square error (RMSE) over the validation set quickly drops with increasing pair cutoff and then levels off at \qty3\milli\per for a cutoff of \qty7 (Fig. 1a). Increasing the cutoff further does not yield a further reduction and the number of non-zero parameters remains approximately at the same level.
Next, we demonstrate the convergence with respect to the number of structures included in the reference set for a fixed pairwise cutoff of \qty7 (Fig. 1b). The RMSE for the validation set is already very low at structures, suggesting that one could reduce the number of configurations for which DFT calculations have to be carried out by a factor of approximately . Here, we used, however, a more conservative number of configurations, which still leads to very substantial savings in computational effort. The convergence analysis for other defects yields practically identical results, so we proceeded with a pairwise cutoff of \qty7 and reference sets of structures for all defects and both materials (LABEL:stab:computational-parameters).
To obtain the second-order FCs \ceMoS2 and \ceWS2, we generated rattled structures for each material based on the primitive 3-atom unit cell with an average displacement amplitude of \qty0.2. The numerical errors associated with DFT calculations often lead to a non-quadratic dispersion of the lowest transverse acoustic mode, which is a hallmark of two-dimensional materials. Such artifacts can have a dramatic effect on the thermal conductivity [25]. It is therefore important to not only impose the translational but also the rotational acoustic sum rules. In the present work, all sum rules are efficiently enforced via regularization using the hiphive package [36], so that even sets of interatomic FCs for the defect-laden structures satisfy the symmetries of free space.
The third-order force constants are only needed for the perfects system and were calculated using a systematic finite-displacement approach as implemented in the thirdorder script included with the ShengBTE package [39]. We included interactions up to the seventh nearest neighbors, which yield cutoffs of \qty7.08 and \qty7.09 for \ceMoS2 and \ceWS2, respectively.
To calculate the thermal conductivity, we integrated over the Brillouin zone employing an \numproduct83x83x1 regular -centered grid. To avoid introducing artifacts in the bands through the use of the linear tetrahedron method, the calculation of the Green’s function is performed on a denser \numproduct103x103x1 grid. Note that and are coprime numbers, so the two grids do not share any points other than .
III Results
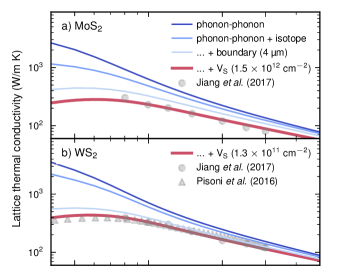
When considering phonon-phonon scattering only, one obtains a LTC that notably overestimates the experimental data [8] (Fig. 2a,b), in particular at lower temperatures; one also observes a more pronounced temperature dependence. While including isotopic mass-variance scattering lowers the LTC somewhat the prediction is still far from the experimentally measured values.
A semi-empirical way to account for the difference is to introduce a boundary scattering term, which introduces an intrinsic length scale that caps the mean free paths of the phonons. This is illustrated here using the length parameter of \qty4\micro used in Ref. 9 (light-blue lines in Fig. 2a,b). This value is considerably smaller than typical grain sizes in the samples used for comparison here, and while it enables a fit to the data it fails to provide deeper physical insight.
It is well established that point-defect concentrations in TMDs tend to be rather high, with densities up to \qtye13\per\centi\squared [40, 13, 19, 14, 20, 16, 15, 41, 5, 18, 17]. This raises the question of whether defects can quantitatively account for the gap between prediction and measurement, and if so how effective different defects with respect to phonon scattering. To answer these questions, we computed the scattering rates for a selection of intrinsic and extrinsic defects that have been frequently observed experimentally [14, 7, 17, 18]. Among the intrinsic defects we included the Mo (\ceV_Mo), W (\ceV_W), and S monovacancies (\ceV_S), the in-plane () and out-of-plane S divacancies () as well as the S adatom (\ceS_ad). According to DFT calculations these defects adopt a neutral charge state for most electron chemical potentials [42, 43]. We therefore restricted ourselves to the neutral charge state.
Among the extrinsic defects we considered adatoms of Li, Na, and K in the case of \ceMoS2 and of Na in \ceWS2 as representatives of impurities introduced during exfoliation but also as prototypes for other impurities and dopants that commonly occupy adatom sites. The three species also span a range of masses, which gives rise to spread in the frequencies of defect related modes. Two different configurations were investigated: In the geometry the atoms reside directly above Mo/W whereas in the configuration the adatom sits above an empty “channel”.
While STM and STEM measurements enable measuring defect concentrations, this is still challenging, both due to the statistics involved and technical complexities such as concurrent beam damage in the case of electron microscopy [49]. For \ceMoS2 defect concentrations between and \qty5e13\per\centi\squared have been measured [13, 19, 14, 50, 20, 17]. The data available for \ceWS2 is sparser. Using STEM a bulk defect concentration of \qty3.3e13\per\centi\squared has been obtained [15], while STM measurements yielded a density of for Mo and \qty4.5e11\per\centi\squared for S vacancies [41]. Given that electron irradiation is known to facilitate defect formation [49], it is plausible that the STEM values could be overestimates. The STM data on the other hand indicate that defect concentrations in \ceWS2 might be lower than in \ceMoS2, a suggestion that is supported by our analysis as will be discussed below.
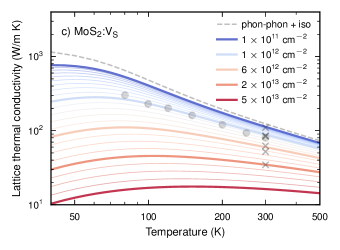
Since S vacancies are the most widely observed defect, we first focus our analysis on them. Increasing the concentration of S vacancies (and point defects generally, see Supplemental Material (SM)) leads to a drop of the LTC and more importantly a less pronounced temperature dependence (see Fig. 2c for \ceMoS2 and LABEL:sfig:thermal-conductivity-WS2-S-vac for \ceWS2). This is expected since the rates of elastic scattering induced by defects are temperature independent, whereas inelastic three-phonon processes become more likely as temperature increases. In \ceMoS2 at room temperature the LTC varies between \qty135\per\per at a vacancy concentration of \qtye10\per\centi\squared to \qty9\per\per at \qtye13\per\centi\squared (Fig. 3a). This range includes experimental measurements of the LTC, which span from (Ref. 45) to \qty35\per\per (Ref. 46), which would be equivalent to defect densities of and \qty2e12\per\centi\squared, respectively.
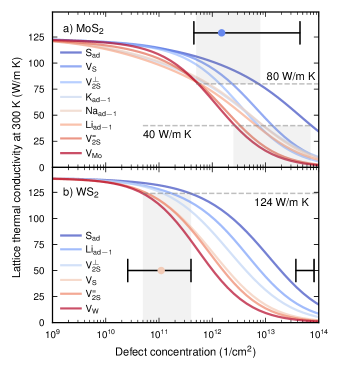
Crucially, using typical defect densities from the middle of the experimentally observed range (see horizontal bars in Fig. 3) yields good agreement with experimental data over the entire temperature range.111 Unfortunately, to the best of our knowledge, there are no studies for which defect concentrations and LTC have been measured for the same sample. For \ceMoS2 and \ceWS2 this suggests defect concentrations of approximately and \qty1.3e11\per\centi\squared, respectively. These concentrations thus differ by one order of magnitude, in line with the differences observed experimentally between these two materials (see above).
Up to now we have considered only one type of defect but obviously defects differ in their scattering efficacy. This can be illustrated by analyzing the variation of the LTC with defect concentration at a fixed temperature (\qty300 in Fig. 3; see LABEL:sfig:thermal-conductivity-vs-defect-concentration-overview for more temperatures). In both \ceMoS2 and \ceWS2, S adatoms are the weakest and metal vacancies (\ceV_Mo, \ceV_W) are the strongest scatterers. However, as the concentrations needed to accomplish a certain LTC reduction only vary by about one order of magnitude (as indicated by the gray rectangles in Fig. 3), the overall scattering efficiency is similar.
So far we have shown that inclusion of defect scattering when predicting the LTC leads to near-quantitative agreement with experimental data without resorting to empirical parameters. It is now instructive to investigate the microscopic mechanism by which defects scatter phonons. Within the framework of Boltzmann transport theory the LTC is predominantly determined by the phonon group velocities and lifetimes.
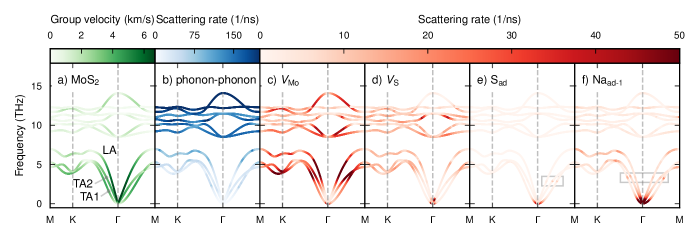
It is apparent from the phonon dispersion (Fig. 4a for \ceMoS2; see also LABEL:sfig:phonon-dispersion-with-scattering-rates-WS2-defects for \ceWS2) that the acoustic branches are the main contributors to the thermal conductivity given their more significant group velocities and lower frequencies. As expected, the largest speed of sound is found in the longitudinal acoustic branch, followed by the transverse acoustic branches (labelled TA1 and TA2 in Fig. 4a). The optical branches are only weakly dispersive; not only does this lead to lower group velocities but also enables more opportunities for the conservation of energy in three-phonon processes, leading to stronger anharmonic scattering as seen in panel Fig. 4b.
The overall magnitude of the phonon-defect rates follows the scattering efficiency observed via the LTC, that is \ceV_Mo scatters more strongly than \ceV_S, which scatters more strongly than \ceS_ad (Fig. 4c–e). All defects lead to scattering across the entire dispersion, but the lowermost acoustic modes close to the center of the Brillouin zone as well as the higher-frequency range of the acoustic branches are the most notably affected. The zero-frequency limit of the scattering rates deserves special mention since it deviates from the familiar Rayleigh power-law found in 3D systems [52]. In fact, the elastic scattering rates do not vanish as in quasi-2D systems due to the nonzero density of states in that limit.
There are signatures of resonant scattering for the S adatom as well as for the extrinsic adatoms (Fig. 4e,f and LABEL:sfig:phonon-dispersion-with-scattering-rates-WS2-defects) in the form of maxima in the scattering rates along the acoustic branches around \qty2.9\tera (\ceS_ad) and \qty3.3\tera (\ceNa_ad-1; marked by rectangles in Fig. 4e,f). This effect is, however, less pronounced than in, e.g., B-doped \ceSiC [11] or for DX-center defects in \ceGaAs [12], and does not reach the level required to create a “superscatterer”.
IV Discussion
It is now instructive to compare our results and analysis with previous investigations.
Ding et al. employed an empirical interatomic potential and nonequilibrium molecular dynamics (MD) simulations with a thermal gradient to study the effect of Mo and S vacancies as well as S adatoms on the LTC in \ceMoS2 [21]. They considered defect densities between \qty1.2e12\per\centi\squared and \qty1.2e13\per\centi\squared, at the upper end of the experimentally observed range (see below), and observed a reduction of the LTC by 35 to 60% at \qty300.
Peng et al., on the other hand, used Boltzmann transport theory with third-order FCs from DFT calculations to assess the impact of S mono and divacancies in \ceMoS2 on the LTC [22]. As a result of their approach, the defect concentration was fixed by the supercell size yielding defect densities of \qty1.2e14\per\centi\squared and above. They obtained a reduction for the in-plane LTC by up to 75% at \qty300. Moreover, this method treats scattering by those vacancies as inelastic, does so perturbatively, and assumes a perfectly periodic arrangement of the defects.
Combining Boltzmann transport theory with the -matrix approach, Polanco and co-authors characterized the dependence of the LTC of \ceMoS2 on both temperature and the concentration of S vacancies and adatoms [23]. They concluded that the spread in the measured LTC is consistent with the experimentally observed variation in defect concentrations. According to their calculations, adatoms are much more effective phonon scatterers than vacancies, owing mainly to the fact that only the phonon-defect scattering rates induced by the latter decay to zero at low frequencies.
Finally, using an empirical potential and equilibrium MD simulations, Gabourie et al. mapped out the dependence of the LTC at \qty300 on the concentration of S vacancies in both suspended and supported \ceMoS2 [24]. The simulation approach enabled them to access more realistic defect densities between and \qty5e13\per\centi\squared, and they found a 19% reduction already at the lower end of the concentration range considered, arriving at a similar conclusion as Ref. 23.
Our results deviate quantitatively and qualitatively from both the MD simulations by Ding et al.[21] and from the BTE-based predictions by Polanco et al. [23] Both of those references suggest that S adatoms are significantly stronger scatterers than the S vacancy, and indeed that the former depresses the thermal conductivity to a much larger degree at a comparable concentration. However, Ref. 21 relies on a semiempirical potential and can be expected to provide limited quantitative insight into configurations where atomic environments are very different from those of the bulk, as is the case of the S adatom. Reference 23, on the other hand, employs a methodology much closer to our work and allows for a more detailed comparison. This reveals that the phonon–S-adatom scattering rates reported by Polanco et al. have a finite zero-frequency limit, but the rates they report for the vacancy vanish as . In the absence of a stated physical argument that could justify this contrasting behavior, the hypothesis of a numerical artifact cannot be ruled out. Specifically, the enforcement of the rotational acoustic sum rules, necessary for both the FCs of the pristine system and those of the defect-laden structures, can be a significant challenge, and as stated above the Green’s function for the pristine system requires an extra postprocessing step to be able to deal with interstitial or adsorbed atoms. Regarding the acoustic sum rules, we are confident in our systematic use of the extensively tested hiphive package [36] for all structures. Additionally, comparison among the results for the sequence of alkaline adatoms , , and in Fig. 3 serves as a qualitative test of our treatment of adatoms: The effect of the structurally and chemically similar \ceLi_ad-1 and \ceNa_ad-1 defects on the thermal conductivity is very much alike, but with the heavier \ceNa_ad-1 acting as a more intense scatterer, as expected. This reasoning also holds for \ceK_ad-1 in the high-concentration regime where elastic scattering dominates. In this context, the effect of the sulphur adatom is perfectly reasonable for an element of its mass.
V Conclusions
In this work we have quantified the impact of point defect scattering on the LTC in \ceMoS2 and \ceWS2. When considering only phonon-phonon and isotope scattering, the computed LTC significantly overestimates the experimental values, especially at low temperatures.
Defects, particularly sulfur vacancies, play a vital role in mediating phonon scattering in these TMDs. Our study suggests that the typically high point-defect concentrations in these materials, which may reach and exceed \qtye13\per\centi\squared, can substantially influence the lattice thermal transport. Calculations on a range of both intrinsic and extrinsic defects prevalent in these materials confirmed the S vacancy as the most dominant scattering center in terms of abundance and strength. Importantly, using defect concentrations consistent with those reported in experimental studies brings our LTC predictions in quantitative alignment with the measured data across the temperature range. This demonstrates not only the importance of point defects for understanding the thermal conduction in these materials but suggests that variations in measured LTC values can be related to differences in the point defect distributions. Compared to earlier work, we find that both intrinsic and extrinsic adatoms are relatively weak scatterers, a difference that we attribute to the treatment of the translational and rotational acoustic sum rules. In the present work, these were enforced, which removes spurious contributions in the zero-frequency limit that can otherwise affect the results.
In summary, our work underscores the importance of defect-mediated phonon scattering in governing the thermal transport properties of \ceMoS2 and \ceWS2, and probably also in other transition metal dichalcogenides. This deeper understanding of the underlying mechanisms provides valuable insights for tailoring the thermal properties of these materials, paving the way for their potential applications in next-generation electronic and thermal management devices.
Acknowledgements
This work was funded by the Knut and Alice Wallenberg Foundation (2014.0226) and the Swedish Research Council (grant numbers 2017-06819, 2018-06482, 2019-03993, 2020-04935, 2021-05072). We also acknowledge support by the Austrian Science Fund (FWF), doctoral college TU-DX (DOC 142-N). The computations were enabled by resources provided by the National Academic Infrastructure for Supercomputing in Sweden (NAISS) and the Swedish National Infrastructure for Computing (SNIC) at C3SE, NSC, and PDC partially funded by the Swedish Research Council through grant agreements no. 2022-06725 and no. 2018-05973. We gratefully acknowledge Daniel Lindroth’s contribution during the early phase of this project.
References
- Lin et al. [2016] Z. Lin, B. R. Carvalho, E. Kahn, R. Lv, R. Rao, H. Terrones, M. A. Pimenta, and M. Terrones, 2D Materials 3, 022002 (2016).
- Hong et al. [2017] J. Hong, C. Jin, J. Yuan, and Z. Zhang, Advanced Materials 29, 1606434 (2017).
- Ding et al. [2019] X. Ding, F. Peng, J. Zhou, W. Gong, G. Slaven, K. P. Loh, C. T. Lim, and D. T. Leong, Nature Communications 10, 41 (2019).
- Zhou et al. [2020] Y. Zhou, J. Zhang, E. Song, J. Lin, J. Zhou, K. Suenaga, W. Zhou, Z. Liu, J. Liu, J. Lou, and H. J. Fan, Nature Communications 11, 2253 (2020).
- Liang et al. [2021] Q. Liang, Q. Zhang, X. Zhao, M. Liu, and A. T. S. Wee, ACS Nano 15, 2165 (2021).
- Zheng et al. [2021] Q. Zheng, M. Hao, R. Miao, J. Schaadt, and C. Dames, Progress in Energy 3, 012002 (2021).
- Pisoni et al. [2016] A. Pisoni, J. Jacimovic, R. Gaál, B. Náfrádi, H. Berger, Z. Révay, and L. Forró, Scripta Materialia 114, 48 (2016).
- Jiang et al. [2017] P. Jiang, X. Qian, X. Gu, and R. Yang, Advanced Materials 29, 1701068 (2017).
- Lindroth and Erhart [2016] D. O. Lindroth and P. Erhart, Physical Review B 94, 115205 (2016).
- Peng et al. [2016a] B. Peng, H. Zhang, H. Shao, Y. Xu, X. Zhang, and H. Zhu, RSC Advances 6, 5767 (2016a).
- Katre et al. [2017] A. Katre, J. Carrete, B. Dongre, G. K. H. Madsen, and N. Mingo, Physical Review Letters 119, 10.1103/physrevlett.119.075902 (2017).
- Kundu et al. [2019] A. Kundu, F. Otte, J. Carrete, P. Erhart, W. Li, N. Mingo, and G. K. H. Madsen, Physical Review Materials 3, 10.1103/physrevmaterials.3.094602 (2019).
- Lu et al. [2014] C.-P. Lu, G. Li, J. Mao, L.-M. Wang, and E. Y. Andrei, Nano Letters 14, 4628 (2014).
- Hong et al. [2015] J. Hong, Z. Hu, M. Probert, K. Li, D. Lv, X. Yang, L. Gu, N. Mao, Q. Feng, L. Xie, J. Zhang, D. Wu, Z. Zhang, C. Jin, W. Ji, X. Zhang, J. Yuan, and Z. Zhang, Nature Communications 6, 10.1038/ncomms7293 (2015).
- Carozo et al. [2017] V. Carozo, Y. Wang, K. Fujisawa, B. R. Carvalho, A. McCreary, S. Feng, Z. Lin, C. Zhou, N. Perea-López, A. L. Elías, B. Kabius, V. H. Crespi, and M. Terrones, Science Advances 3, e1602813 (2017).
- Song et al. [2017] S. H. Song, M.-K. Joo, M. Neumann, H. Kim, and Y. H. Lee, Nature Communications 8, 2121 (2017).
- Trainer et al. [2022] D. J. Trainer, J. Nieminen, F. Bobba, B. Wang, X. Xi, A. Bansil, and M. Iavarone, npj 2D Materials and Applications 6, 1 (2022).
- Lee et al. [2022] C. Lee, B. G. Jeong, S. H. Kim, D. H. Kim, S. J. Yun, W. Choi, S.-J. An, D. Lee, Y.-M. Kim, K. K. Kim, S. M. Lee, and M. S. Jeong, npj 2D Materials and Applications 6, 1 (2022).
- McDonnell et al. [2014] S. McDonnell, R. Addou, C. Buie, R. M. Wallace, and C. L. Hinkle, ACS Nano 8, 2880 (2014).
- Vancsó et al. [2016] P. Vancsó, G. Z. Magda, J. Pető, J.-Y. Noh, Y.-S. Kim, C. Hwang, L. P. Biró, and L. Tapasztó, Scientific Reports 6, 29726 (2016).
- Ding et al. [2015] Z. Ding, Q.-X. Pei, J.-W. Jiang, and Y.-W. Zhang, The Journal of Physical Chemistry C 119, 16358 (2015).
- Peng et al. [2016b] B. Peng, Z. Ning, H. Zhang, H. Shao, Y. Xu, G. Ni, and H. Zhu, The Journal of Physical Chemistry C 120, 29324 (2016b).
- Polanco et al. [2020] C. A. Polanco, T. Pandey, T. Berlijn, and L. Lindsay, Physical Review Materials 4, 014004 (2020).
- Gabourie et al. [2020] A. J. Gabourie, S. V. Suryavanshi, A. B. Farimani, and E. Pop, 2D Materials 8, 011001 (2020).
- Carrete et al. [2016] J. Carrete, W. Li, L. Lindsay, D. A. Broido, L. J. Gallego, and N. Mingo, Materials Research Letters 4, 204 (2016).
- Carrete et al. [2017] J. Carrete, B. Vermeersch, A. Katre, A. van Roekeghem, T. Wang, G. K. Madsen, and N. Mingo, Computer Physics Communications 220, 351 (2017).
- Lambin and Vigneron [1984] P. Lambin and J. P. Vigneron, Physical Review B 29, 3430 (1984).
- Wang et al. [2017] T. Wang, J. Carrete, A. van Roekeghem, N. Mingo, and G. K. H. Madsen, Phys. Rev. B 95, 245304 (2017).
- Blöchl [1994] P. E. Blöchl, Physical Review B 50, 17953 (1994).
- Kresse and Hafner [1993] G. Kresse and J. Hafner, Physical Review B 47, 558 (1993).
- Kresse and Furthmüller [1996] G. Kresse and J. Furthmüller, Computational Materials Science 6, 15 (1996).
- Dion et al. [2004] M. Dion, H. Rydberg, E. Schröder, D. C. Langreth, and B. I. Lundqvist, Phys. Rev. Lett. 92, 246401 (2004).
- Berland and Hyldgaard [2014] K. Berland and P. Hyldgaard, Physical Review B 89, 035412 (2014).
- Erhart et al. [2015] P. Erhart, P. Hyldgaard, and D. O. Lindroth, Chemistry of Materials 27, 5511 (2015).
- Esfarjani and Stokes [2008] K. Esfarjani and H. T. Stokes, Physical Review B 77, 144112 (2008).
- Eriksson et al. [2019] F. Eriksson, E. Fransson, and P. Erhart, Advanced Theory and Simulations 2, 1800184 (2019).
- Pedregosa et al. [2011] F. Pedregosa, G. Varoquaux, A. Gramfort, V. Michel, B. Thirion, O. Grisel, M. Blondel, P. Prettenhofer, R. Weiss, V. Dubourg, J. Vanderplas, A. Passos, D. Cournapeau, M. Brucher, M. Perrot, and E. Duchesnay, Journal of Machine Learning Research 12, 2825 (2011).
- Fransson et al. [2020] E. Fransson, F. Eriksson, and P. Erhart, npj Computational Materials 6, 135 (2020).
- Li et al. [2014] W. Li, J. Carrete, N. A. Katcho, and N. Mingo, Computer Physics Communications 185, 1747 (2014).
- Zhou et al. [2013] W. Zhou, X. Zou, S. Najmaei, Z. Liu, Y. Shi, J. Kong, J. Lou, P. M. Ajayan, B. I. Yakobson, and J.-C. Idrobo, Nano Letters 13, 2615 (2013).
- Rosenberger et al. [2018] M. R. Rosenberger, H.-J. Chuang, K. M. McCreary, C. H. Li, and B. T. Jonker, ACS Nano 12, 1793 (2018).
- Komsa and Krasheninnikov [2015] H.-P. Komsa and A. V. Krasheninnikov, Physical Review B 91, 10.1103/physrevb.91.125304 (2015).
- Kieczka et al. [2023] D. Kieczka, T. Durrant, K. Milton, K. E. J. Goh, M. Bosman, and A. Shluger, Electronic Structure 5, 024001 (2023).
- Sahoo et al. [2013] S. Sahoo, A. P. S. Gaur, M. Ahmadi, M. J.-F. Guinel, and R. S. Katiyar, The Journal of Physical Chemistry C 117, 9042 (2013).
- Liu et al. [2014] J. Liu, G.-M. Choi, and D. G. Cahill, Journal of Applied Physics 116, 233107 (2014).
- Yan et al. [2014] R. Yan, J. R. Simpson, S. Bertolazzi, J. Brivio, M. Watson, X. Wu, A. Kis, T. Luo, A. R. Hight Walker, and H. G. Xing, ACS Nano 8, 986 (2014).
- Taube et al. [2015] A. Taube, J. Judek, A. Łapińska, and M. Zdrojek, ACS Applied Materials & Interfaces 7, 5061 (2015).
- Zhang et al. [2015] X. Zhang, D. Sun, Y. Li, G.-H. Lee, X. Cui, D. Chenet, Y. You, T. F. Heinz, and J. C. Hone, ACS Applied Materials & Interfaces 7, 25923 (2015).
- Komsa et al. [2013] H.-P. Komsa, S. Kurasch, O. Lehtinen, U. Kaiser, and A. V. Krasheninnikov, Physical Review B 88, 10.1103/physrevb.88.035301 (2013).
- Jeong et al. [2016] H. Y. Jeong, S. Y. Lee, T. H. Ly, G. H. Han, H. Kim, H. Nam, Z. Jiong, B. G. Shin, S. J. Yun, J. Kim, U. J. Kim, S. Hwang, and Y. H. Lee, ACS Nano 10, 770 (2016).
- Note [1] Unfortunately, to the best of our knowledge, there are no studies for which defect concentrations and LTC have been measured for the same sample.
- Tamura [1983] S.-i. Tamura, Physical Review B 27, 858 (1983).