2Centro de Astrobiología (CAB), CSIC-INTA, Camino Bajo del Castillo s/n, E-28692, Villanueva de la Cañada, Madrid, Spain
3School of Sciences, European University Cyprus, Diogenes street, Engomi, 1516 Nicosia, Cyprus
4Instituto de Física Fundamental, CSIC, Calle Serrano 123, 28006 Madrid, Spain
5Max-Planck-Institut fur extraterrestrische Physik, Postfach 1312, D-85741 Garching, Germany
6Instituto de Radioastronomía and Astrofísica (IRyA-UNAM), 3-72 (Xangari), 8701, Morelia, Mexico
7Instituto de Astrofísica de Canarias, Calle Vía Láctea, s/n, E-38205 La Laguna, Tenerife, Spain
8Departamento de Astrofísica, Universidad de La Laguna, E-38206 La Laguna, Tenerife, Spain
9Departamento de Física de la Tierra y Astrofísica, Fac. de CC Físicas, Universidad Complutense de Madrid, 28040 Madrid, Spain
10Instituto de Física de Partículas y del Cosmos IPARCOS, Fac. de CC Físicas, Universidad Complutense de Madrid, 28040 Madrid, Spain
11Cahill Center for Astrophysics, California Institute of Technology, 1216 East California Boulevard, Pasadena, CA 91125, USA
12Observatoire de París, PSL Research University, CNRS, Sorbonne Universités, UPMC Univ. Paris 06, 92190 Meudon, France
13Observatorio Astronómico Nacional (OAN-IGN)-Observatorio de Madrid, Alfonso XII, 3, 28014, Madrid, Spain
14Universidad de Alcalá, Departamento de Física y Matemáticas, Campus Universitario, 28871, Alcalá de Henares, Madrid, Spain
15Department of Physics & Astronomy, University of Alaska Anchorage, AK 99508-4664, USA
16Department of Physics & Astronomy, University of Southampton, Hampshire, SO17 1BJ, Southampton, UK
17Telespazio UK for the European Space Agency (ESA), ESAC, Camino Bajo del Castillo s/n, 28692 Villanueva de la Cañada, Spain
18Space Telescope Science Institute, 3700 San Martin Drive, Baltimore, Maryland 21218, USA
19Kavli Institute for Particle Astrophysics and Cosmology (KIPAC), Stanford University, Stanford, CA 94305, USA
20Instituto de Estudios Astrofísicos, Facultad de Ingeniería y Ciencias, Universidad Diego Portales, Avenida Ejercito Libertador 441, Santiago, Chile
21The University of Texas at San Antonio, One UTSA Circle, San Antonio, TX 78249, USA
22Astronomical Observatory, Volgina 7, 11060 Belgrade, Serbia
23Centre for Extragalactic Astronomy, Durham University, South Road, Durham DH1 3LE, UK
The Galaxy Activity, Torus, and Outflow Survey (GATOS). III: Revealing the inner icy structure in local AGN
We use JWST/MIRI MRS spectroscopy of a sample of six local obscured type 1.9/2 active galactic nuclei (AGN) to compare their nuclear mid-IR absorption bands with the level of nuclear obscuration traced by X-rays. This study is the first to use sub-arcsecond angular resolution data of local obscured AGN to investigate the nuclear mid-IR absorption bands with a wide wavelength coverage (4.9-28.1 m). All the nuclei show the 9.7 m silicate band in absorption. We compare the strength of the 9.7 and 18 m silicate features with torus model predictions. The observed silicate features are generally well explained by clumpy and smooth torus models. We report the detection of the 6 m dirty water ice band (i.e., a mix of water and other molecules such as CO and CO2) at sub-arcsecond scales (0.26″at 6 m; inner 50 pc) in a sample of local AGN with different levels of nuclear obscuration in the range log N(cm-2). We find a good correlation between the 6 m water ice optical depths and N. This result indicates that the water ice absorption might be a reliable tracer of the nuclear intrinsic obscuration in AGN. The weak water ice absorption in less obscured AGN (log N (cm-2)23.0 cm-2) might be related to the hotter dust temperature (T110 K) expected to be reached in the outer layers of the torus due to their more inhomogeneous medium. Our results suggest it might be necessary to include the molecular content, such as, H2O, aliphatic hydrocarbons (CH-) and more complex PAH molecules in torus models to better constrain key parameters such as the torus covering factor (i.e. nuclear obscuration).
Key Words.:
galaxies: active - galaxies: nuclei – galaxies: Seyfert – techniques: spectroscopic – techniques: high angular resolution.1 Introduction
Active galactic nuclei (AGN) are considered to be a short-lived (100 Myr; e.g. Hopkins et al. 2005) but recurrent phase that might take place in all relatively massive galaxies (e.g. Hickox et al. 2014). AGN are powered by accretion of material onto supermassive black holes (SMBHs), which releases energy in the form of radiation and/or mechanical outflows to the interstellar medium (ISM) of the host galaxy.
Subarcsecond angular observations (0.5″) of local AGN (tens of Mpc) enable us to probe their nuclear/circumnuclear regions (inner 100 pc scales) where part of the present AGN feedback is taking place. At nuclear scales (tens of pc) the bulk of dust and gas surrounding the AGN was proposed to be distributed in a toroidal structure where the dust obscuration is significant (Antonucci 1993). ALMA observations detected the molecular dusty torus in several nearby AGN and showed that it is part of the galaxy gas flow cycle (e.g. García-Burillo et al. 2016, 2019, 2021; Imanishi et al. 2018, 2020; Alonso-Herrero et al. 2018, 2019; Alonso Herrero et al. 2023; Combes et al. 2019). Depending on its orientation, it obscures the central engines of type 2 AGN, and while providing a direct view of the central engine in the case of type 1 AGN. This nuclear dust absorbs a significant part of the AGN radiation and then reprocesses it to emerge in the infrared (IR; e.g. Pier & Krolik 1992). Typically, due to the small angular size of this dusty structure, it is only resolved with interferometric observations (e.g. García-Burillo et al. 2016, 2021 at submm, GRAVITY Collaboration et al. 2020 at near-IR, and Gámez Rosas et al. 2022 at mid-IR wavelengths) but not with single-dish 10-m class telescopes. Thus, an extensively used technique for constraining the nuclear dusty structure properties is to compare torus models to the observed nuclear IR emission (see Ramos Almeida & Ricci 2017 for a review). In particular, previous studies reported reasonably accurate fits to the nuclear near-IR to mid-IR SED of nearby AGNs using clumpy torus models (e.g., Ramos Almeida et al. 2009, 2011b; Hönig & Kishimoto 2010; Alonso-Herrero et al. 2011; Lira et al. 2013; Ichikawa et al. 2015; García-Bernete et al. 2015, 2019, 2022; Martínez-Paredes et al. 2015, 2020, 2021; Esparza-Arredondo et al. 2019; González-Martín et al. 2019a, b, 2023)
Silicate grains are an important component of the interstellar dust mix (standard values of the Milky way are: silicate 53% and graphite 47%; e.g. Mathis, Rumpl, & Nordsieck 1977). While graphites are features-less in the mid-IR, silicates produce absorption/emission bands at 9.7 and 18 m (e.g. Ossenkopf, Henning & Mathis 1992). The mid-IR spectra of buried sources, like deeply embedded massive proto-stars, show strong absorption features produced by dust and icy material. In particular, H2O ice absorption features are detected in these sources (at 3 and 6 m; see Boogert, Gerakines, & Whittet 2015 for a review). Water is abundant in the interstellar medium and the freezing of water vapour onto dust grain mantles is considered a vital mechanism (catalyst) to form molecules in the Universe (e.g. Cazaux et al. 2016).
H2O features are generally detected toward embedded young stellar objects. The first detection of 6 m water ice in extragalactic sources occurred in NGC 4418 (Spoon et al. 2001). To date, extra-galactic H2O ices were detected in luminous infrared galaxies (log L11 L; e.g. Spoon et al. 2022 and references therein), which are extremely rich in molecular gas and dust. Given that water-ice and aliphatic hydrocarbon (CH-) absorption mainly occurs in sources with signatures of a buried nuclei (Spoon et al., 2022).
However, the unprecedented combination of high angular and spectral resolution (R1500-3500) in the entire mid-IR range (4.9-28.1 m) afforded by the 6.5m James Webb Space Telescope (JWST; Gardner et al. 2023)/Mid-Infrared Instrument (MIRI; Rieke et al. 2015; Wells et al. 2015; Wright et al. 2015, 2023) allows for detailed studies of the central and circumnuclear regions of local galaxies and allows searching for weak and/diluted features. This letter reports the detection of the 6 m water ice feature at sub-arcsecond scales (0.26″at 6 m; in the inner 50 pc) in a sample of local obscured AGN. Using JWST/MRS data, we find that water ices may be a reliable tracer of the nuclear intrinsic obscuration in AGN. The luminosity distance and spatial scale were calculated using a cosmology with H0=70 km s-1 Mpc-1, =0.3, and =0.7.


2 Targets and observations
The galaxies studied here are part of the Galactic Activity, Torus, and Outflow Survey (GATOS García-Burillo et al. 2021; Alonso-Herrero et al. 2021)111https://gatos.myportfolio.com/, which has the main goal of understanding the properties of the dusty molecular torus and its connection to their host galaxies in local AGN. The parent sample is selected from the 70th Month Swift/BAT AGN catalog, which is flux-limited in the ultra-hard 14–195 keV X-rays band (Baumgartner et al. 2013). The present study employs MIRI/MRS observations of a sub-sample of obscured type 1.9/2 AGN from the GATOS sample. These data are part of the JWST cycle 1 GO proposal ID 1670 (PI: T. Shimizu and R. Davies). All the galaxies are classified as obscured AGN (log N (cm-2)22.0), and two of them are also classified as Compton thick (CT) AGN (NGC 5728 and ESO 137–G034; i.e. log N (cm-2)24.0; e.g. Ricci et al. 2017). We also include a slightly more distant galaxy, NGC 7319 (D100 Mpc), as it is an obscured type AGN, which was observed as part of the Early Release Observations (Program ID 2732, PI K. M. Pontoppidan; Pontoppidan et al. 2022), which is publicly available in the JWST archive (these data were already presented in Pereira-Santaella et al. 2022; García-Bernete et al. 2022d). The main properties of the sample are summarized in Table 1.
The sample was observed with MIRI/MRS (integral-field spectroscopy), which comprises four wavelength channels: ch1 (4.9–7.65 m), ch2 (7.51–11.71 m), ch3 (11.55–18.02 m), and ch4 (17.71–28.1 m). We refer the reader to Appendix A for further details on the observations and data reduction. The newly observed JWST/MRS galaxies in Cycle 1 are presented in Fig. 1. For comparison with the absorption bands in our sample, we use the Spitzer/IRS data of the deeply obscured type 2 NGC 4418 (see Appendix B).
To extract the JWST/MRS spectra from the nuclear regions (see Fig. 1), we used a point source extraction. See Appendix A for further details on the spectral extraction. We note that the nuclear spectra of MCG-05-23-016, NGC 5506, NGC 5728, NGC 7172, NGC 7319, and ESO 137-G034 correspond to physical scales of 57, 55, 53, 38, 55, 116 and 52 pc (at 6 m), respectively.
| Name | AGN | DL | log N | |||
|---|---|---|---|---|---|---|
| type | (Mpc) | (cm-2) | ||||
| MCG-05-23-016 | 1.9 | 35 | 0.01 | 0.320.01 | 0.010.01 | 22.2 |
| NGC 5506 | 1.9 | 27 | 0.080.02 | 0.900.04 | 0.100.02 | 22.4 |
| NGC 7172 | 2 | 37 | 0.070.01 | 2.240.03 | 0.540.05 | 22.9 |
| NGC 7319 | 2 | 96 | 0.050.02 | 0.590.02 | 0.010.01 | 23.8 |
| NGC 5728 | 1.9 | 39 | 0.470.02 | 1.910.02 | 0.230.04 | 24.2 |
| ESO 137-G034 | 2 | 35 | 0.210.07 | 0.990.03 | 0.050.04 | 24.3 |
| NGC 4418 | 2 | 37 | 0.930.03 | 4.100.01 | 0.950.01 | 25 |
3 Nuclear absorption features
3.1 Silicate bands
The silicate strength is sensitive to the balance of cold (absorption) and hot (emission) dust from various regions. This is especially relevant in clumpy distributions where the silicate band is filled by the emission from hotter clumps, resulting in weaker silicate absorption in the outer parts of the torus (e.g. Levenson et al. 2007; Nenkova et al. 2008a, b; Nikutta et al. 2021). Furthermore, using subarcsecond resolution data with 8-10 m ground-based telescopes, it has been found that foreground obscuration by the host galaxy might be important at these scales (e.g. Alonso-Herrero et al. 2011; González-Martín et al. 2013; García-Bernete et al. 2019, 2022). At nuclear scales (few tens of pc), silicate emission is not always observed in type 1 AGN which can also show weak absorption and type 2 AGN generally have moderate silicate absorption features (see e.g. Roche et al. 2007; Alonso-Herrero et al. 2011, 2016; Hönig & Kishimoto 2010; González-Martín et al. 2013; García-Bernete et al. 2017, 2019, 2022).
We measure the silicate strengths at 9.7 and 18 m in the nuclear spectra for all the AGN in the sample. We computed the silicate strength (S) following a similar method as done by Kemper, Vriend, & Tielens (2004) and Spoon et al. (2007), we measured the ratio of observed flux (f) to continuum flux (f) at the central wavelength of each silicate feature [Sln(ff)]. For the continuum curve (after removing broad PAH features and narrow emission lines), we assumed a spline (cubic polynomial) with anchor points at 4.8, 5.5, 7.8, 15.0 and 25.0 m see Fig. 8 in of Appendix A). The optical depth curve () shown in Fig. 2 has been estimated using the same approach as for the silicate bands [i.e. =-ln(ff)] but using every monochromatic wavelength (5-30 m). Throughout this work we adopt that S=-.
All the galaxies studied here show the 9.7 m silicate band in absorption (see Fig. 2 and Table 1). However, the 18 m feature is relatively weak for the majority of the targets. The only exceptions are NGC 5728 (S=-0.23) and NGC 7172 (S=-0.54). While the spatial scales are similar at 6 and 9.7 m (0.3″), at 18 m it is 0.7″. This might slightly affect the 18 m silicate features including extra contribution from the host galaxy. We find the deepest 9.7 m silicate absorption in NGC 7172 (see also Roche et al. 2007), NGC 5728, ESO 137G034 and NGC 5506 (S of -2.4, -1.9, -1.0, -0.9, respectively). Two of these galaxies (NGC 5728 and ESO 137–G034) have high hydrogen column densities (CT-like source), as measured from the X-rays. On the other hand, NGC 7172 has a modest value of NH from X-rays (Ricci et al. 2017) and ALMA observations (Alonso Herrero et al. 2023) relative to the deep silicate bands found in its nuclear region. However, this galaxy has a dust lane (Sharples et al. 1984, see also Fig. 1 of Alonso Herrero et al. 2023) and, thus, we expect a significant contribution to the silicate strength from this foreground material. Indeed, the contribution of the foreground extinction can be the dominant one in the measured silicate strength of edge-on galaxies (e.g. Goulding et al. 2012; González-Martín et al. 2013). As shown by high angular resolution ground-based mid-IR spectroscopy of local AGN, the silicate strength alone is not necessarily a good indicator of nuclear obscuration (e.g. Alonso-Herrero et al. 2011; González-Martín et al. 2013; García-Bernete et al. 2019, 2022).


3.2 Water and hydrocarbon ices
The nuclear spectra of the sample show extra absorption bands apart from those of the silicates. These features are identified as water (at 6 m) and aliphatic hydrocarbons ices (at 6.85 and 7.25 m; e.g. Spoon et al. 2022 and references therein).
The 6 m feature, which is associated with dirty water ice (i.e., a mix of water and other molecules such as CO and CO2), is detected in five of the six nuclei (see Fig. 2). This feature is only tentatively detected in the case of MCG-05-23-016, which is the source with the lowest N in the sample and is poor in molecular gas Rosario et al. 2018. This band is prominent in those galaxies with log N (cm-2)24.0. In Table 1 we present the optical depth of the H2O () of the sample. has been estimated using the same approach as for the silicate bands but at 6.0 m.
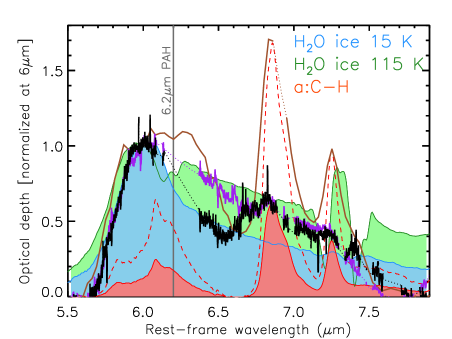
The aliphatic hydrocarbon bands at 6.85 and 7.25 m (Spoon et al. 2022) are likely to be present in our obscured AGN, but these are not as prominent as in NGC 4418 (see Fig. 3). NGC 5728 and ESO 137-G034 also show a shoulder in the 9.7 m silicate absorption band that might be related with the H2O libration band (11-16 m). In Fig. 10 of Appendix C, we show the pure H2O, H2O:CO2 and H2O:CO optical depths measured in laboratory experiments. Given that the sublimation temperature of the CO ices is 20 K (e.g. Ferrero et al. 2020; Perrero et al. 2023). The comparison suggests that water ice composition is complex and probably might include CO at relatively low temperature (20 K; to decrease the H2O libration mode). This is also compatible with large amount of cold molecular gas present in the nuclear region of AGN (e.g. García-Burillo et al. 2016, 2021). However, high angular resolution data at 4-5 m is need to confirm the presence of the frozen CO band (4.67 m).
4 Nuclear obscuration in AGN
Broad-band X-ray derived column densities (N) are considered good tracers of nuclear obscuration, even for highly absorbed sources. Indeed, a major step forward was attained with NuSTAR (3–80 keV) allowing detailed studes of the X-ray emission in CT AGN (e.g. Tanimoto et al. 2022). However, even hard X-rays selections are missing a significant fraction of the intrinsic emission in highly absorbed type 2 sources with very high covering factor tori (e.g. Mateos et al. 2017; García-Bernete et al. 2019; Ricci et al. 2021). Furthermore, hydrogen column densities derived from 0.5-10 keV measurements can be affected by host galaxy contribution in low luminosity AGN (e.g. Guainazzi, Matt, & Perola 2005). High angular resolution ALMA observations also provide a robust estimation of the nuclear molecular gas column densities (e.g. Alonso-Herrero et al. 2018; Alonso Herrero et al. 2023; Combes et al. 2019; García-Burillo et al. 2021), although this might depend on the CO–to–H2 conversion factor used. The combination of high angular resolution, sensitivity and wavelength coverage of JWST provides an alternative route for studying the nuclear obscuration in local AGN by using the mid-IR broad absorption bands (i.e. water ices, aliphatic hydrocarbons and silicate features).
4.1 Water ices as tracers of the innermost obscuration
In this section, we test the reliability of the water ice band as a tracer of the nuclear obscuration. First, in Fig. 3 (left) we compare the 6 m water optical depth of the sources with N (cm-2)¿24 where the water ice absorption is prominent (i.e. NGC 5728, ESO 137-G034) with that of the extremely obscured nucleus of luminous infrared galaxy NGC 4418. We find that the water ice absorption band are similar when normalized to that of the 6 m feature (see right panel of Fig. 3). The very deep silicate absorption band observed in the nuclear region of NGC 4418 implies that there is a low contribution of nuclear warm material (Roche, Alonso-Herrero, & Gonzalez-Martin 2015). This indicates that covering factor due to cold material (with TT) might be high in obscured AGN.
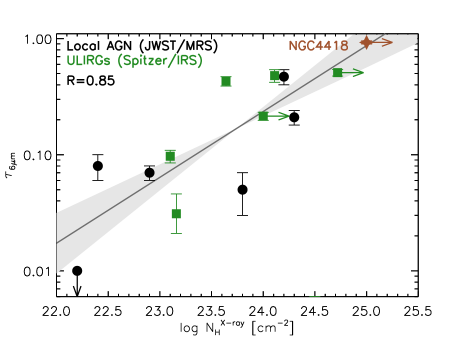
In Fig. 4, we compare the H2O and 9.7 m silicate feature optical depths of the sample with the hydrogen column density derived from the X-rays (see Table 1). To extend the sample, we selected ultraluminous infrared galaxies ( (L⊙) 1012, ULIRGs) from Ricci et al. (2021). We retrieved the 6 m ice and 9.7 m silicate strengths measured in Spitzer IRS data from the IDEOS database (Spoon et al. 2022). ULIRGs have very compact mid-IR continuum (e.g. Díaz-Santos et al. 2010) and, thus, are less affected by contribution from the host galaxy emission to the total mid-IR spectrum as probed by Spitzer. There is a good correlation between and N (R=0.85) even for sources with high hydrogen column densities. The good correlation with N indicates that the water ices are related to the nuclear obscuration, opening an alternative way to measure it in deeply obscured AGN not detected in the X-rays (N (cm-2)25; e.g. Aalto et al. 2015; González-Alfonso & Sakamoto 2019) . In agreement with previous works (Goulding et al. 2012; González-Martín et al. 2013), the relationship between the 9.7 m silicate feature and N shows a larger scatter (R=0.68), indicating that it is not always tracing the nuclear obscuration.
The silicate strength may be sensitive to the various temperatures in different parts of the torus. The ice feature strength might be proportional to the absorption in the colder parts of the clumps (shielding). In the clumpier structure of the torus of less obscured AGN (log N (cm-2)23.0), there is a non-zero probability for an AGN-produced photon to escape through the torus along a viewing angle without being absorbed. This can produce a direct view of the broad-line region, regardless of the torus orientation. In regions heated by high-energy photons, from the central engine, ices are unlikely to survive. Exposing ices to the harsh central mechanism radiation field can result in the sublimation of ice grains (110-120 K; Fraser et al. 2001), but they might survive on the sides of the clumps that are not facing the central source. On the other hand, in high covering factor structures (i.e. almost smooth dust distributions), the ices can be protected by the large amount of dust and gas. Therefore, we suggest that water ice bands might be an alternative and/or complementary tool for tracing the obscuration related to the innermost region of AGN.


4.2 Limitations on the dust composition of current AGN dust models
State-of-the-art torus model have explored different dust distribution (smooth vs. clumpy; Fritz, Franceschini, & Hatziminaoglou 2006; Nenkova et al. 2008a, b; Efstathiou & Rowan-Robinson 1995; Efstathiou et al. 2022), dust geometries (torus vs. polar dust; e.g. Hönig & Kishimoto 2017; Stalevski, Tristram, & Asmus 2019), dust composition (silicates vs. graphites; e.g. Hönig & Kishimoto 2017; González-Martín et al. 2023) and various grain sizes (González-Martín et al. 2023).
The relative strengths of the 9.7 and 18 m silicate bands are sensitive to the dust properties and distribution (Sirocky et al. 2008; Thompson et al. 2009; Tsuchikawa et al. 2021). The relationship between these two silicate features and torus model has been previously studied (e.g. Sirocky et al. 2008; Feltre et al. 2012; Hatziminaoglou et al. 2015; Martínez-Paredes et al. 2020; González-Martín et al. 2023). In Fig. 5, we compare the observed silicate strengths with two of the torus models available in the literature: clumpy torus (Nenkova et al. 2008a, b) and smooth torus models (Efstathiou & Rowan-Robinson 1995; Efstathiou et al. 2022). We find that clumpy and smooth torus models generally explain the observed 9.7 vs. 18 m silicate features. However, the depths of both silicate features for the most obscured AGN in the sample (log N (cm-2)23.0; i.e. half of the sample) appear to be better explained with models using smooth dust distributions (see Fig. 5). However, we cannot rule out that extra contribution from the host galaxy is affecting this tentative result, especially for NGC 7172. We note that fitting the nuclear near and mid-infrared emission with torus models instead of only comparing the silicate feature strengths is necessary to investigate the best suited models representing the nuclear dust emission. This is beyond the scope of this letter, and will be discussed in a forthcoming paper.
In Fig. 6 we show an example of SED fitting for nuclear JWST/MRS spectrum of NGC 5728 (one of the CT AGN in the sample). The smooth torus model by Fritz, Franceschini, & Hatziminaoglou (2006) produces a reasonably good fit to the 9.7 m feature as well as the 5-28 m continuum regions not affected by the absorptions discussed in Section 3.2. However, Fig. 6 also suggests the need for developing torus models which include the expected molecular content of the dust mantles (see Fig. 7 for a simple sketch representing the expected ice-coated grains in the nuclear dusty structure present in Compton thick AGN and dust-embedded ULIRGs).
5 Summary and conclusions
We presented a JWST study of the mid-infrared absorption bands detected in a sample of six obscured type 1.9/2 AGN at distances D30-40 Mpc. The spatial scales probed by the nuclear spectra of JWST/MRS are 50 pc at 6 m. The only exception is NGC 7319, which is part of the Early Release Observations and has a distance of 100 Mpc. Finally, our sample of local AGN has different levels of nuclear obscuration ranging from log N (cm. The main results are as follows.
-
1.
We find that all the galaxies show the 9.7 m silicate band in absorption, which is in agreement with their X-ray classification (obscured AGN; i.e. log N (cm-2)22.0). However, the 18 m feature is relatively shallow for the majority of the targets.
-
2.
We detect the 6 m dirty water ice band (i.e. a mix of water and other molecules such as CO and CO2) in five of the six nuclei. This feature is only tentatively detected in the case of MCG-05-23-016, which is the least obscured AGN in the sample (log N (cm). Non-detection (or dilution) of water ices in less obscured AGN might be expected if their tori have lower covering factors and a clumpier medium. Under these conditions, the dusty grains located in the outer layers of the torus, where ices form, can reach hotter temperatures than that of the sublimation of the water ices (T110 K). While this is well documented for many local luminous and ultraluminous infrared galaxies (U/LIRGs), this is the first time that the 6 m is detected in the nuclear region (0.26″at 6 m; inner 50 pc) of local AGN (sub-LIRGs) with different levels of nuclear obscuration ranging from log N (cm.
-
3.
There is a good correlation between the 6 m water ice optical depths and the hydrogen column densities derived from the X-rays. We include data from ULIRGs with detected water ices to expand the sample. This relationship not only holds for our sample of local AGN but also for higher IR luminosity sources such as ULIRGs ( (L⊙) 1012). In contrast, the relationship between N and 9.7 m silicate band strength shows larger scatter, as shown in previous works.
-
4.
By comparing the observed 9.7 and 18 m silicate strengths with dusty torus model predictions, we find that smooth torus models explain better the observed silicate features in the most obscured AGN in our sample (log N (cm-2)23.0).
Our results indicate that water ice might be a reliable tracer of the nuclear intrinsic obscuration in AGN.
The good correlation between the ice optical depth and the X-ray NH suggests that most of the X-ray absorption occurs in cold and dense clouds. A preliminary comparison with laboratory data suggests that the ice in our local sample of AGN also contains some CO ice at a relatively low temperature (20 K; e.g. Ehrenfreund et al. 1997; Öberg et al. 2007). However, to further investigate the composition of ice present in galaxies the whole 3-15 m range, including the 3 and 6 m H2O ice bands, is needed. We also suggest that it might be necessary to continue exploring the dust composition and grain sizes (e.g. Hönig & Kishimoto 2017; García-González et al. 2017; Martínez-Paredes et al. 2021; García-Bernete et al. 2022; González-Martín et al. 2023; Reyes-Amador et
al. 2023) and include the entire molecular content of ice mantles in torus models to better constrain key parameters such as the torus covering factor (i.e. nuclear obscuration).
Acknowledgements.
The authors thank E. Dartois for useful discussions, and H.W.W. Spoon for providing laboratory spectra. IGB and DR acknowledge support from STFC through grant ST/S000488/1 and ST/W000903/1. AAH acknowledges support from grant PID2021-124665NB-I00 funded by MCIN/AEI/10.13039/501100011033 and by ERDF A way of making Europe. MPS acknowledges funding support from the Ramón y Cajal programme of the Spanish Ministerio de Ciencia e Innovación (RYC2021-033094-I). OGM acknowledges PAPIIT UNAM IN109123 and to the Ciencia de Frontera project CF-2023-G-100 from CONHACYT. CRA acknowledges the projects “Feeding and feedback in active galaxies”, with reference PID2019-106027GB-C42, funded by MICINN-AEI/10.13039/501100011033 and “Quantifying the impact of quasar feedback on galaxy evolution”, with reference EUR2020-112266, funded by MICINN-AEI/10.13039/501100011033 and the European Union NextGenerationEU/PRTR. EB acknowledges the María Zambrano program of the Spanish Ministerio de Universidades funded by the Next Generation European Union and is also partly supported by grant RTI2018-096188-B-I00 funded by the Spanish Ministry of Science and Innovation/State Agency of Research MCIN/AEI/10.13039/501100011033. SGB acknowledges support from the research project PID2019-106027GA-C44 of the Spanish Ministerio de Ciencia e Innovación. EG-A thanks the Spanish MICINN for support under projects PID2019-105552RB-C41 and PID2022-137779OB-C41. CR acknowledges support from Fondecyt Regular grant 1230345 and ANID BASAL project FB210003. MJW acknowledges the award of a Leverhulme Emeritus Fellowship. This work is based on observations made with the JWST. The authors acknowledge the ERO team for developing their observing program with a zero–exclusive–access period. The authors are extremely grateful to the JWST helpdesk for their constant and enthusiastic support. Finally, we thank the anonymous referee for their useful comments.References
- Aalto et al. (2015) Aalto S., Martín S., Costagliola F., González-Alfonso E., Muller S., Sakamoto K., Fuller G. A., et al., 2015, A&A, 584, A42. doi:10.1051/0004-6361/201526410
- Alonso Herrero et al. (2023) Alonso Herrero A., García-Burillo S., Pereira-Santaella M., Shimizu T., Combes F., Hicks E. K. S., Davies R., et al., 2023, A&A, 675, A88. doi:10.1051/0004-6361/202346074
- Alonso-Herrero et al. (2021) Alonso-Herrero A., García-Burillo S., Hönig S. F., García-Bernete I., Ramos Almeida C., González-Martín O., López-Rodríguez E., et al., 2021, A&A, 652, A99. doi:10.1051/0004-6361/202141219
- Alonso-Herrero et al. (2019) Alonso-Herrero A., García-Burillo S., Pereira-Santaella M., Davies R. I., Combes F., Vestergaard M., Raimundo S. I., et al., 2019, A&A, 628, A65. doi:10.1051/0004-6361/201935431
- Alonso-Herrero et al. (2018) Alonso-Herrero A., Pereira-Santaella M., García-Burillo S., Davies R. I., Combes F., Asmus D., Bunker A., et al., 2018, ApJ, 859, 144. doi:10.3847/1538-4357/aabe30
- Alonso-Herrero et al. (2016) Alonso-Herrero A., Esquej P., Roche P. F., Ramos Almeida C., González-Martín O., Packham C., Levenson N. A., et al., 2016, MNRAS, 455, 563. doi:10.1093/mnras/stv2342
- Alonso-Herrero et al. (2011) Alonso-Herrero A., Ramos Almeida C., Mason R., Asensio Ramos A., Roche P. F., Levenson N. A., Elitzur M., et al., 2011, ApJ, 736, 82. doi:10.1088/0004-637X/736/2/82
- Antonucci (1993) Antonucci R., 1993, ARA&A, 31, 473
- Argyriou et al. (2023) Argyriou I., Glasse A., Law D. R., Labiano A., Álvarez-Márquez J., Patapis P., Kavanagh P. J., et al., 2023, A&A, 675, A111. doi:10.1051/0004-6361/202346489
- Baumgartner et al. (2013) Baumgartner W. H., Tueller J., Markwardt C. B., Skinner G. K., Barthelmy S., Mushotzky R. F., Evans P. A., et al., 2013, ApJS, 207, 19. doi:10.1088/0067-0049/207/2/19
- Bohlin, Hubeny, & Rauch (2020) Bohlin R. C., Hubeny I., Rauch T., 2020, AJ, 160, 21. doi:10.3847/1538-3881/ab94b4
- Boogert, Gerakines, & Whittet (2015) Boogert A. C. A., Gerakines P. A., Whittet D. C. B., 2015, ARA&A, 53, 541. doi:10.1146/annurev-astro-082214-122348
- Cazaux et al. (2016) Cazaux S., Minissale M., Dulieu F., Hocuk S., 2016, A&A, 585, A55. doi:10.1051/0004-6361/201527187
- Combes et al. (2019) Combes F., García-Burillo S., Audibert A., Hunt L., Eckart A., Aalto S., Casasola V., et al., 2019, A&A, 623, A79. doi:10.1051/0004-6361/201834560
- Dartois & Muñoz-Caro (2007) Dartois E., Muñoz-Caro G. M., 2007, A&A, 476, 1235. doi:10.1051/0004-6361:20077798
- Díaz-Santos et al. (2010) Díaz-Santos T., Charmandaris V., Armus L., Petric A. O., Howell J. H., Murphy E. J., Mazzarella J. M., et al., 2010, ApJ, 723, 993. doi:10.1088/0004-637X/723/2/993
- Efstathiou et al. (2022) Efstathiou A., Farrah D., Afonso J., Clements D. L., González-Alfonso E., Lacy M., Oliver S., et al., 2022, MNRAS, 512, 5183. doi:10.1093/mnras/stab3642
- Efstathiou & Rowan-Robinson (1995) Efstathiou A., Rowan-Robinson M., 1995, MNRAS, 273, 649
- Ehrenfreund et al. (1997) Ehrenfreund P., Boogert A. C. A., Gerakines P. A., Tielens A. G. G. M., van Dishoeck E. F., 1997, A&A, 328, 649
- Esparza-Arredondo et al. (2019) Esparza-Arredondo D., González-Martín O., Dultzin D., Ramos Almeida C., Fritz J., Masegosa J., Pasetto A., et al., 2019, ApJ, 886, 125. doi:10.3847/1538-4357/ab4ced
- Feltre et al. (2012) Feltre A., Hatziminaoglou E., Fritz J., Franceschini A., 2012, MNRAS, 426, 120. doi:10.1111/j.1365-2966.2012.21695.x
- Ferrero et al. (2020) Ferrero S., Zamirri L., Ceccarelli C., Witzel A., Rimola A., Ugliengo P., 2020, ApJ, 904, 11. doi:10.3847/1538-4357/abb953
- Fraser et al. (2001) Fraser H. J., Collings M. P., McCoustra M. R. S., Williams D. A., 2001, MNRAS, 327, 1165. doi:10.1046/j.1365-8711.2001.04835.x
- Fritz, Franceschini, & Hatziminaoglou (2006) Fritz J., Franceschini A., Hatziminaoglou E., 2006, MNRAS, 366, 767. doi:10.1111/j.1365-2966.2006.09866.x
- Gámez Rosas et al. (2022) Gámez Rosas V., Isbell J. W., Jaffe W., Petrov R. G., Leftley J. H., Hofmann K.-H., Millour F., et al., 2022, Natur, 602, 403. doi:10.1038/s41586-021-04311-7
- Gardner et al. (2023) Gardner J. P., Mather J. C., Abbott R., Abell J. S., Abernathy M., Abney F. E., Abraham J. G., et al., 2023, PASP, 135, 068001. doi:10.1088/1538-3873/acd1b5
- García-Bernete et al. (2022d) García-Bernete I., Rigopoulou D., Alonso-Herrero A., Donnan F. R., Roche P. F., Pereira-Santaella M., Labiano A., et al., 2022d, A&A, 666, L5. doi:10.1051/0004-6361/202244806
- García-Bernete et al. (2022) García-Bernete I., González-Martín O., Ramos Almeida C., Alonso-Herrero A., Martínez-Paredes M., Ward M. J., Roche P. F., et al., 2022, A&A, 667, A140. doi:10.1051/0004-6361/202244230
- García-Bernete et al. (2022b) García-Bernete I., Rigopoulou D., Aalto S., Spoon H. W. W., Hernán-Caballero A., Efstathiou A., Roche P. F., et al., 2022b, A&A, 663, A46. doi:10.1051/0004-6361/202142749
- García-Bernete et al. (2019) García-Bernete I., Ramos Almeida C., Alonso-Herrero A., Ward M. J., Acosta-Pulido J. A., Pereira-Santaella M., Hernán-Caballero A., et al., 2019, MNRAS, 486, 4917. doi:10.1093/mnras/stz1003
- García-Bernete et al. (2017) García-Bernete I., Ramos Almeida C., Landt H., Ward M. J., Baloković M., Acosta-Pulido J. A., 2017, MNRAS, 469, 110. doi:10.1093/mnras/stx795
- García-Bernete et al. (2015) García-Bernete I., Ramos Almeida C., Acosta-Pulido J. A., Alonso-Herrero A., Sánchez-Portal M., Castillo M., Pereira-Santaella M., et al., 2015, MNRAS, 449, 1309. doi:10.1093/mnras/stv338
- García-Burillo et al. (2021) García-Burillo S., Alonso-Herrero A., Ramos Almeida C., González-Martín O., Combes F., Usero A., Hönig S., et al., 2021, A&A, 652, A98. doi:10.1051/0004-6361/202141075
- García-Burillo et al. (2019) García-Burillo S., Combes F., Ramos Almeida C., Usero A., Alonso-Herrero A., Hunt L. K., Rouan D., et al., 2019, A&A, 632, A61. doi:10.1051/0004-6361/201936606
- García-Burillo et al. (2016) García-Burillo S., et al., 2016, ApJ, 823, L12
- García-González et al. (2017) García-González J., Alonso-Herrero A., Hönig S. F., Hernán-Caballero A., Ramos Almeida C., Levenson N. A., Roche P. F., et al., 2017, MNRAS, 470, 2578. doi:10.1093/mnras/stx1361
- González-Alfonso & Sakamoto (2019) González-Alfonso E., Sakamoto K., 2019, ApJ, 882, 153. doi:10.3847/1538-4357/ab3a32
- González-Martín et al. (2023) González-Martín O., Ramos Almeida C., Fritz J., Alonso-Herrero A., Hönig S. F., Roche P. F., Esparza-Arredondo D., et al., 2023, A&A, 676, A73. doi:10.1051/0004-6361/202345858
- González-Martín et al. (2019a) González-Martín, O., Masegosa, J., García-Bernete, I., et al. 2019a, ApJ, 884, 10
- González-Martín et al. (2019b) González-Martín, O., Masegosa, J., García-Bernete, I., et al. 2019b, ApJ, 884, 11
- González-Martín et al. (2013) González-Martín O., Rodríguez-Espinosa J. M., Díaz-Santos T., Packham C., Alonso-Herrero A., Esquej P., Ramos Almeida C., et al., 2013, A&A, 553, A35. doi:10.1051/0004-6361/201220382
- Goulding et al. (2012) Goulding A. D., Alexander D. M., Bauer F. E., Forman W. R., Hickox R. C., Jones C., Mullaney J. R., et al., 2012, ApJ, 755, 5. doi:10.1088/0004-637X/755/1/5
- GRAVITY Collaboration et al. (2020) GRAVITY Collaboration, Pfuhl O., Davies R., Dexter J., Netzer H., Hönig S., Lutz D., et al., 2020, A&A, 634, A1. doi:10.1051/0004-6361/201936255
- Guainazzi, Matt, & Perola (2005) Guainazzi M., Matt G., Perola G. C., 2005, A&A, 444, 119. doi:10.1051/0004-6361:20053643
- Hatziminaoglou et al. (2015) Hatziminaoglou E., Hernán-Caballero A., Feltre A., Piñol Ferrer N., 2015, ApJ, 803, 110. doi:10.1088/0004-637X/803/2/110
- Hickox et al. (2014) Hickox R. C., Mullaney J. R., Alexander D. M., Chen C.-T. J., Civano F. M., Goulding A. D., Hainline K. N., 2014, ApJ, 782, 9. doi:10.1088/0004-637X/782/1/9
- Hönig & Kishimoto (2017) Hönig, S. F., & Kishimoto, M. 2017, ApJ, 838, L20
- Hönig & Kishimoto (2010) Hönig, S. F., & Kishimoto, M. 2010, A&A, 523, A27
- Hopkins et al. (2005) Hopkins P. F., Hernquist L., Cox T. J., Di Matteo T., Martini P., Robertson B., Springel V., 2005, ApJ, 630, 705. doi:10.1086/432438
- Ichikawa et al. (2015) Ichikawa K., et al., 2015, ApJ, 803, 57
- Imanishi et al. (2018) Imanishi M., Nakanishi K., Izumi T., Wada K., 2018, ApJL, 853, L25. doi:10.3847/2041-8213/aaa8df
- Imanishi et al. (2020) Imanishi M., Nguyen D. D., Wada K., Hagiwara Y., Iguchi S., Izumi T., Kawakatu N., et al., 2020, ApJ, 902, 99. doi:10.3847/1538-4357/abaf50
- Kemper, Vriend, & Tielens (2004) Kemper F., Vriend W. J., Tielens A. G. G. M., 2004, ApJ, 609, 826. doi:10.1086/421339
- Kinney et al. (2000) Kinney A. L., Schmitt H. R., Clarke C. J., Pringle J. E., Ulvestad J. S., Antonucci R. R. J., 2000, ApJ, 537, 152. doi:10.1086/309016
- Labiano et al. (2021) Labiano A., Argyriou I., Álvarez-Márquez J., Glasse A., Glauser A., Patapis P., Law D., et al., 2021, A&A, 656, A57. doi:10.1051/0004-6361/202140614
- Labiano et al. (2016) Labiano A., Azzollini R., Bailey J., Beard S., Dicken D., García-Marín M., Geers V., et al., 2016, SPIE, 9910, 99102W. doi:10.1117/12.2232554
- Lebouteiller et al. (2011) Lebouteiller V., Barry D. J., Spoon H. W. W., Bernard-Salas J., Sloan G. C., Houck J. R., Weedman D. W., 2011, ApJS, 196, 8
- Levenson et al. (2007) Levenson N. A., Sirocky M. M., Hao L., Spoon H. W. W., Marshall J. A., Elitzur M., Houck J. R., 2007, ApJL, 654, L45. doi:10.1086/510778
- Lira et al. (2013) Lira P., Videla L., Wu Y., Alonso-Herrero A., Alexander D. M., Ward M., 2013, ApJ, 764, 159
- Maté et al. (2019) Maté B., Jimenez-Redondo M., Peláez R. J., Tanarro I., Herrero V. J., 2019, MNRAS, 490, 2936. doi:10.1093/mnras/stz2603
- Mateos et al. (2017) Mateos S., Carrera F., Barcons X., Alonso-Herrero A., Hernan-Caballero A., Page M., Ramos-Almeida C., et al., 2017, xru..conf, 142
- Mathis, Rumpl, & Nordsieck (1977) Mathis J. S., Rumpl W., Nordsieck K. H., 1977, ApJ, 217, 425. doi:10.1086/155591
- Martínez-Paredes et al. (2020) Martínez-Paredes M., González-Martín O., Esparza-Arredondo D., Kim M., Alonso-Herrero A., Krongold Y., Hoang T., et al., 2020, ApJ, 890, 152. doi:10.3847/1538-4357/ab6732
- Martínez-Paredes et al. (2021) Martínez-Paredes M., González-Martín O., HyeongHan K., Geier S., García-Bernete I., Ramos Almeida C., Alonso-Herrero A., et al., 2021, ApJ, 922, 157. doi:10.3847/1538-4357/ac1d55
- Martínez-Paredes et al. (2015) Martínez-Paredes M., Alonso-Herrero A., Aretxaga I., Ramos Almeida C., Hernán-Caballero A., González-Martín O., Pereira-Santaella M., et al., 2015, MNRAS, 454, 3577. doi:10.1093/mnras/stv2134
- Nenkova et al. (2008a) Nenkova, M., Sirocky, M. M., Ivezić, Ž., & Elitzur, M. 2008, ApJ, 685, 147-159
- Nenkova et al. (2008b) Nenkova, M., Sirocky, M. M., Nikutta, R., Ivezić, Ž., & Elitzur, M. 2008, ApJ, 685, 160-180
- Nikutta et al. (2021) Nikutta R., Lopez-Rodriguez E., Ichikawa K., Levenson N. A., Packham C., Hönig S. F., Alonso-Herrero A., 2021, ApJ, 923, 127. doi:10.3847/1538-4357/ac2949
- Öberg et al. (2007) Öberg K. I., Fraser H. J., Boogert A. C. A., Bisschop S. E., Fuchs G. W., van Dishoeck E. F., Linnartz H., 2007, A&A, 462, 1187. doi:10.1051/0004-6361:20065881
- Ossenkopf, Henning & Mathis (1992) Ossenkopf V., Henning T., Mathis J. S., 1992, A&A, 261, 567
- Pereira-Santaella et al. (2022) Pereira-Santaella M., Álvarez-Márquez J., García-Bernete I., Labiano A., Colina L., Alonso-Herrero A., Bellocchi E., et al., 2022, A&A, 665, L11. doi:10.1051/0004-6361/202244725
- Perrero et al. (2023) Perrero J., Ugliengo P., Ceccarelli C., Rimola A., 2023, MNRAS, 525, 2654. doi:10.1093/mnras/stad2459
- Pier & Krolik (1992) Pier E. A., Krolik J. H., 1992, ApJ, 401, 99
- Pontoppidan et al. (2022) Pontoppidan K. M., Barrientes J., Blome C., Braun H., Brown M., Carruthers M., Coe D., et al., 2022, ApJL, 936, L14. doi:10.3847/2041-8213/ac8a4e
- Ramos Almeida & Ricci (2017) Ramos Almeida C., Ricci C., 2017, NatAs, 1, 679
- Ramos Almeida et al. (2011b) Ramos Almeida C., et al., 2011b, ApJ, 731, 92
- Ramos Almeida et al. (2009) Ramos Almeida C., et al., 2009, ApJ, 702, 1127
- Reyes-Amador et al. (2023) Reyes-Amador U., et al., 2023, submitted
- Ricci et al. (2021) Ricci C., Privon G. C., Pfeifle R. W., Armus L., Iwasawa K., Torres-Albà N., Satyapal S., et al., 2021, MNRAS, 506, 5935. doi:10.1093/mnras/stab2052
- Ricci et al. (2017) Ricci C., Trakhtenbrot B., Koss M. J., Ueda Y., Del Vecchio I., Treister E., Schawinski K., et al., 2017, ApJS, 233, 17. doi:10.3847/1538-4365/aa96ad
- Rieke et al. (2015) Rieke G. H., Wright G. S., Böker T., Bouwman J., Colina L., Glasse A., Gordon K. D., et al., 2015, PASP, 127, 584. doi:10.1086/682252
- Rigby et al. (2023) Rigby J., Perrin M., McElwain M., Kimble R., Friedman S., Lallo M., Doyon R., et al., 2023, PASP, 135, 048001. doi:10.1088/1538-3873/acb293
- Roche et al. (2007) Roche P. F., Packham C., Aitken D. K., Mason R. E., 2007, MNRAS, 375, 99. doi:10.1111/j.1365-2966.2006.11207.x
- Roche, Alonso-Herrero, & Gonzalez-Martin (2015) Roche P. F., Alonso-Herrero A., Gonzalez-Martin O., 2015, MNRAS, 449, 2598. doi:10.1093/mnras/stv495
- Rosario et al. (2018) Rosario D. J., Burtscher L., Davies R. I., Koss M., Ricci C., Lutz D., Riffel R., et al., 2018, MNRAS, 473, 5658. doi:10.1093/mnras/stx2670
- Sakamoto et al. (2013) Sakamoto K., Aalto S., Costagliola F., Martín S., Ohyama Y., Wiedner M. C., Wilner D. J., 2013, ApJ, 764, 42. doi:10.1088/0004-637X/764/1/42
- Sharples et al. (1984) Sharples R. M., Longmore A. J., Hawarden T. G., Carter D., 1984, MNRAS, 208, 15. doi:10.1093/mnras/208.1.15
- Sirocky et al. (2008) Sirocky M. M., Levenson N. A., Elitzur M., Spoon H. W. W., Armus L., 2008, ApJ, 678, 729. doi:10.1086/586727
- Spoon et al. (2022) Spoon H. W. W., Hernán-Caballero A., Rupke D., Waters L. B. F. M., Lebouteiller V., Tielens A. G. G. M., Loredo T., et al., 2022, ApJS, 259, 37. doi:10.3847/1538-4365/ac4989
- Spoon et al. (2007) Spoon H. W. W., Marshall J. A., Houck J. R., Elitzur M., Hao L., Armus L., Brandl B. R., et al., 2007, ApJL, 654, L49. doi:10.1086/511268
- Spoon et al. (2001) Spoon H. W. W., Keane J. V., Tielens A. G. G. M., Lutz D., Moorwood A. F. M., 2001, A&A, 365, L353. doi:10.1051/0004-6361:20000557
- Stalevski, Tristram, & Asmus (2019) Stalevski M., Tristram K. R. W., Asmus D., 2019, MNRAS, 484, 3334. doi:10.1093/mnras/stz220
- Tanimoto et al. (2022) Tanimoto A., Ueda Y., Odaka H., Yamada S., Ricci C., 2022, ApJS, 260, 30. doi:10.3847/1538-4365/ac5f59
- Thompson et al. (2009) Thompson G. D., Levenson N. A., Uddin S. A., Sirocky M. M., 2009, ApJ, 697, 182. doi:10.1088/0004-637X/697/1/182
- Tsuchikawa et al. (2021) Tsuchikawa T., Kaneda H., Oyabu S., Kokusho T., Kobayashi H., Yamagishi M., Toba Y., 2021, A&A, 651, A117. doi:10.1051/0004-6361/202140483
- Véron-Cetty & Véron (2006) Véron-Cetty M.-P., Véron P., 2006, A&A, 455, 773
- Wells et al. (2015) M., Pel, J.-W., Glasse, A., et al. 2015, PASP, 127, 646
- Wright et al. (2015) Wright, G. S., Wright, D., Goodson, G. B., et al. 2015, PASP, 127, 595
- Wright et al. (2023) Wright G. S., Rieke G. H., Glasse A., Ressler M., García Marín M., Aguilar J., Alberts S., et al., 2023, PASP, 135, 048003. doi:10.1088/1538-3873/acbe66
Appendix A JWST data reduction
We used mid-IR (4.9-28.1 m) MIRI MRS integral-field spectroscopy data. The MRS has a spectral resolution of R3700–1300 (Labiano et al. 2021) and comprises four wavelength channels: ch1 (4.9–7.65 m), ch2 (7.51–11.71 m), ch3 (11.55–18.02 m), and ch4 (17.71–28.1 m). These channels are further subdivided into three sub-bands (short, medium, and long). The FoV is larger for longer wavelengths: ch1 (3.2″ 3.7″), ch2 (4.0″ 4.7″), ch3 (5.2″ 6.1″), and ch4 (6.6″ 7.6″). We refer the reader to Argyriou et al. (2023) and Rigby et al. (2023) for further details.
We primarily followed the standard MRS pipeline procedure (e.g. Labiano et al. 2016 and references therein) to reduce the data using the pipeline release 1.11.0 and the calibration context 1095. Some hot/cold pixels are not identified by the current pipeline version, so we added an extra step before creating the data cubes to mask them. We used the background frames to determine the mean flux of the pixels for each channel. Then, we masked those whose flux deviates more than 6. After masking these bad pixels, we tried to recover their true values by linear interpolation of the fluxes of the pixels above and below in the same column (i.e., approximate spectral axis). We limited this interpolation to pixels where the signal-to-noise ratio (SNR) was 30. Based on our tests, this interpolation approach is able to recover the actual flux within 10% for this SNR threshold. To subtract the background, we first created background-only cubes for each sub-band of each channel using the dedicated background observations. Then, we generated the background spectra by averaging these cubes in each spectral channel and these spectra were subtracted from the science cubes.
The nuclear spectra from the different sub-channels were extracted assuming they are point sources. Using the cube oriented in the instrument integral field unit plane, we employed observations of calibration point sources (MRS HD-163466 and IRAS,052487007, Program IDs 1050 and 1049) to measure the width and position angle of a 2D Gaussian for each spectral channel. To obtain the point source flux we used the models of the calibration PSF stars from Bohlin, Hubeny, & Rauch (2020), which is equivalent to applying aperture correction factors. This 2D Gaussian represents the point-spread function of MRS, whose width increases from shorter to longer wavelengths. Subsequently, we fitted the amplitude and position of the 2D Gaussian to the nuclear regions of our AGN sample, while keeping fixed the width and position angle values obtained from the calibration point source. Fig. 8 present the JWST/MRS spectra (PAH features and narrow emission lines masked) and the fitted continuum baseline (see Section 4).

Appendix B Archival Spitzer/IRS data of NGC 4418
We retrieved low-resolution (R60–120) mid-IR staring spectrum of NGC 4418 from the Cornell Atlas of Spitzer/IRS Source (CASSIS, version LR7; Lebouteiller et al. 2011). The spectra were reduced with the CASSIS software, using the optimal extraction to get the best signal-to-noise ratio, which is equivalent to a point source extraction (see Fig. 9). We note that Spoon et al. (2022) measured for this galaxy and of 0.930.02 and 4.120.02, respectively. These are in good agreement, within the errors, with the values reported in Table 1.

Appendix C H2O ice profile
In this Section we present the laboratory spectra of pure water (see Fig. 10 and 11). The data presented in this section was downloaded from the Leiden Ice Database (Rocha et al. in prep). Fig. 12 shows a comparison between the 6 m absorption band of NGC 4418, NGC 5728 and ESO 137-G004 and laboratory data.