[datatype=bibtex] \map \step[fieldset=issn, null] \step[fieldset=arxiv, null]
Laser beam properties and microfluidic confinement control thermocavitation
Abstract
Thermocavitation, the creation of a vapor bubble by heating a liquid with a continuous-wave laser, has been studied for a wide range of applications. Examples include the development of an actuator for needle-free jet injectors, as the pumping mechanism in microfluidic channels and crystallization or nanoparticle synthesis. Optimal use in these applications require control over the dynamics of the laser-generated bubble through the laser power and beam radius. In contrast to pulsed lasers, for continuous-wave lasers the influence of the laser beam radius on the bubble characteristics is not fully understood. Here, we present a novel way to control the size of the beam from an optical fiber by changing the distance from the glass-liquid interface. We show that the increase in beam size results in a longer nucleation time. Numerical simulations of the experiment show that the maximum temperature at the moment of nucleation is 2375°C and independent of laser parameters. Due to delayed nucleation for larger beam sizes, more energy is absorbed by the liquid at the nucleation instant. Consequently, a larger beam size results in a faster growing bubble, producing the same effect as reducing the laser power. We conclude that the total bubble energy only depends on the amount of absorbed optical energy and it is independent of the beam radius and laser power for any amount of absorbed energy. This effect contrasts with pulsed lasers, where an increase in beam radius results in a reduction of bubble energy. Our results are of relevance for the use of continuous-wave laser-actuated cavitation in needle-free jet injectors as well as other applications of thermocavitation in microfluidic confinement.
Keywords: [Thermocavitation, continuous-wave laser, energy transfer, microfluidic confinement, vapor bubble]
1 Introduction
The creation of a vapor bubble by heating the liquid with a continuous-wave (CW) laser was first reported in 1987 by Rastopov and Sukhodol’skii, who called it thermocavitation [1]. Since then, this thermocavitation process has been studied for numerous applications, including removal of pathological tissues [2], nanoparticle synthesis [3], laser-induced crystallization [4], as pumping mechanism in a microchannel [5], creation of short laser pulses [6], generation of ultrasound acoustics [7, 8, 9] and trapping or manipulation of bubbles [10, 11]. Over the last decade, thermocavitation also has been investigated for its potential to create microfluidic jets for (bio-)printing and/or needle-free jet injection [12, 13, 14, 15, 16, 17, 18]. Although laser-actuated jet injection was initially studied using pulsed lasers [19, 20, 21, 22, 23], recently we found that continuous-wave lasers generate similar bubble dynamics [24]. For all of these applications of thermocavitation, understanding and control of the bubble formation is vital.
However, a thorough understanding of the thermocavitation process is still lacking. Due to the low laser power (P 1W) in thermocavitation, the bubble does not form instantaneously upon laser irradiation, but after a short incubation time ( ms). Therefore, the delivered optical energy E is not controlled directly, but depends on the bubble nucleation instant (E = P) [24]. Delaying this nucleation time therefore increases the amount of energy, resulting in a larger bubble [25, 26]. The most reported method for delaying the nucleation is a reduction in laser power [27, 25]. Similarly, a reduction in absorption coefficient also reduces the absorbed energy density, which results in delayed nucleation, a larger superheated volume and consequently a larger bubble [28, 29]. A third method to deliver more energy and create a larger bubble is to increase the beam size. The beam size can be increased by moving the liquid away from the focal point of the focusing lens [30, 25, 28, 18]. However, the exact beam size depends on the optics and positioning accuracy, which are difficult to reproduce. To our knowledge the quantitative influence of the beam size on the thermocavitation process and its energy transfer has not been reported.
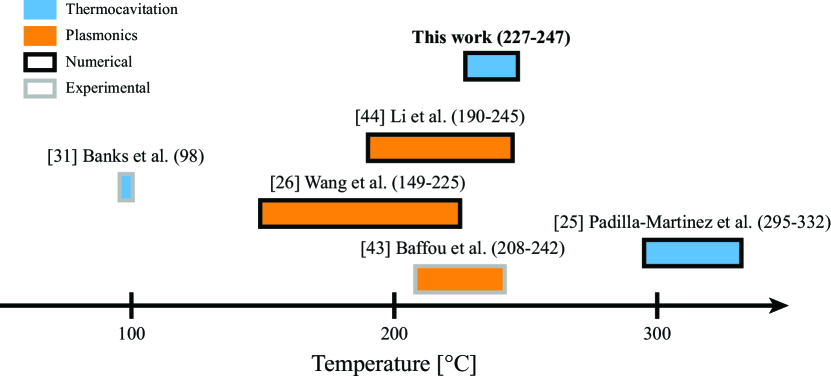
For thermocavitation, the temperature at the moment of nucleation is still debated. Fluorescent measurements using Rhodamine-B resulted in a maximum temperature of 98°C [31]. However, in this study the calibration was only performed until 85°C, and the sensitivity of this dye as temperature sensor goes down rapidly above 80°C [32], for which reason any extrapolation to higher temperatures should be carefully interpreted. Numerical simulations resulted in temperatures of 295-332°C [25], which is around or even above the spinodal temperature of 305°C [33], and therefore unlikely as nucleation at an interface should happen below the spinodal temperature [34].
In this manuscript, we investigate the influence of the beam size on the thermocavitation process in microfluidic confinement, i.e., near a wall boundary from which the laser is focused. We compare our experimental results on the bubble nucleation with a numerical heat transfer simulation in COMSOL. This data provides a better understanding of the moment of nucleation and the energy transfer from the CW laser into the bubble. Our results are of relevance for the use of continuous-wave laser-actuated cavitation in needle-free jet injectors as well as other applications of thermocavitation in microfluidic confinement.
2 Experimental methods
Figure 1 shows the experimental setup, consisting of a microfluidic glass chip with two etched channels along the same axis and separated by 30 µm. The right channel (L*W*H = 2000*100*400 µm3) is partially filled with Milli-Q water until the variable filling level . The left channel is designated for inserting an optical fiber connected to a CW laser. This single-mode optical fiber (Corning SMF-28e) is positioned inside its channel using a motorized 3-axis stage (Thorlabs Rollerblock) with micrometer accuracy. This allows for accurate aligning of the fiber tip with respect to the microfluidic channel. Due to the divergence of the laser beam from the fiber tip, the beam radius at the interface of the microfluidic channel can be controlled by the distance . Seven beam radii B are used in the experiment between 10 to 36 µm.
The fiber laser (BKTel Photonics, HPFL-2-350-FCAPC) has a variable output power between 0.2 and 2 W at a wavelength of 1950 nm, which matches the absorption peak of water ( 12000 m-1 [35]). The laser has a secondary fiber output at 1% of the nominal power, which is connected to a photodetector (Thorlabs DET05D2) to monitor the output power in-situ using an oscilloscope (Tektronix MSO2014B).
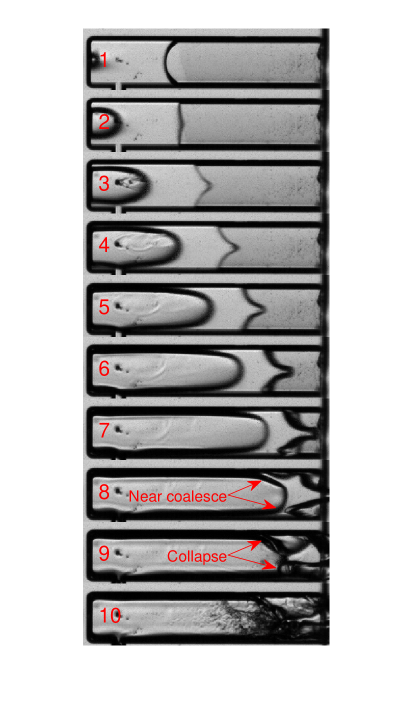
Upon laser irradiation, the water inside the right channel is heated, and after a short period ( ms), nucleation occurs and a fast growing vapor bubble appears. A Photron NOVA SA-X2 high-speed camera was used in combination with a Navitar 12x zoom lens system and a Schott CV-LS light source for visualization of the bubble dynamics. The camera was used at a frame rate of 225k fps, a resolution of 384*96 and a pixel size of 5 µm. Figure 1 (right panel) shows a few typical images during the bubble lifetime. The images were analyzed with a custom-made MATLAB algorithm, which tracks the bubble over time as shown in the red contours. The bubble length is calculated as the area enclosed in the red contour divided by the channel height (400 µm). The growth velocity is taken by fitting the bubble length of the second to the fifth frame.
The heating phase was simulated in COMSOL until bubble formation. First, using the ray optics module, the beam radius in the water channel is obtained for the different fiber positions used in the experiment. These beam radii are then used in the heat transfer module to simulate the heating. The energy absorption is calculated with Lambert-Beer, using the absorption coefficient of water, which reduces with increasing temperature [36, 37]. It also includes the loss of heat due to dissipation into the walls of the glass chip. More details regarding the numerical simulations of the ray tracing and heat transfer can be found in the Supplementary Information Sections SI 1 and SI 2, respectively.
Figures 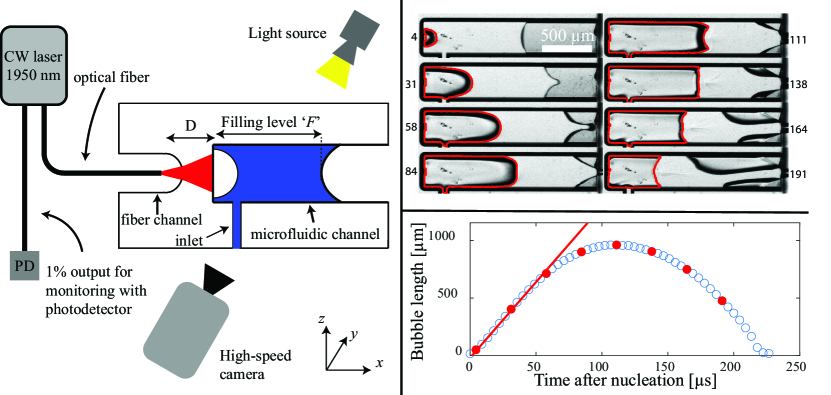
3 Results and discussion
3.1 Nucleation time and temperature
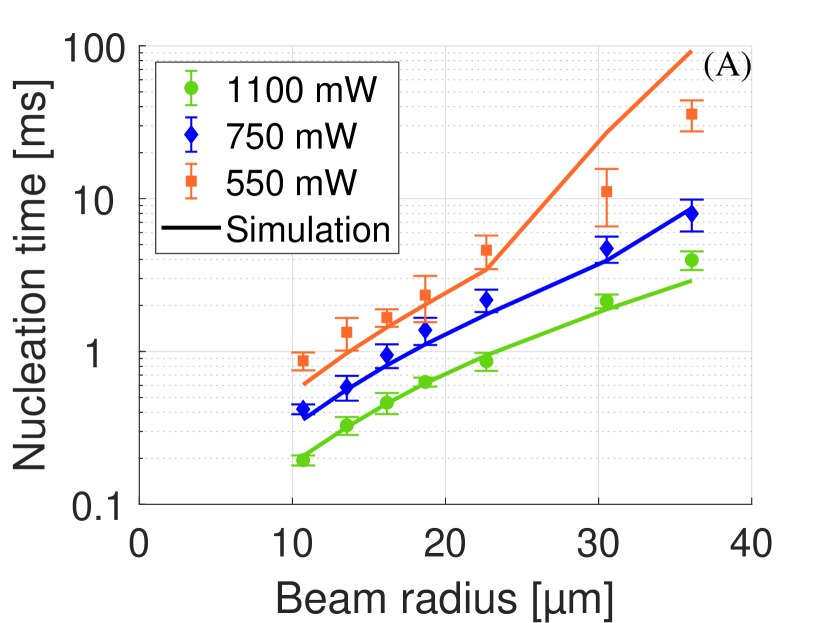
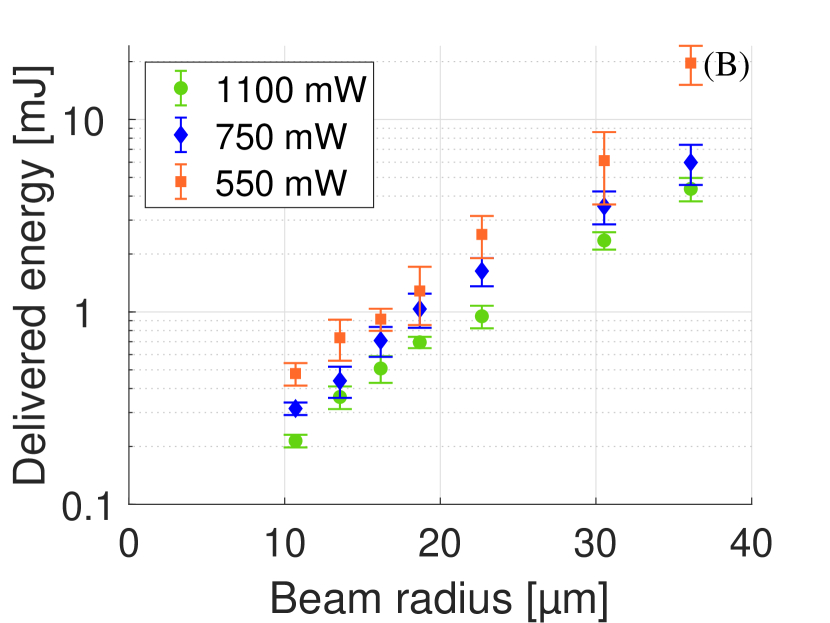
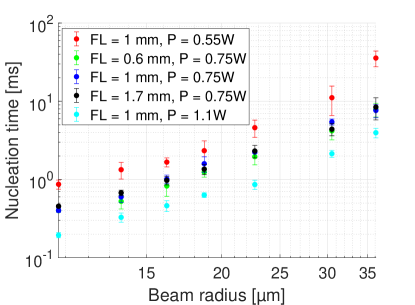
Figure 2A shows the nucleation time as a function of beam radius, for 3 different laser powers. The data points are averaged over at least 6 individual measurements and the error bars indicate the standard deviation. It is clear that the nucleation time increases with increasing beam radius, as well as reducing laser power. These two effects reduce the laser intensity, resulting in slower localized heating of the liquid and therefore a longer nucleation time.
For the middle laser power (750 mW), the experiment was performed for three different filling levels, = 600, 1000 and 1700 µm. It was found that the filling level did not have any significant effect on the nucleation time (see Figure SI 2). This is explained as the filling levels are 8 to 20 times larger than the absorption length ( 80 µm) and therefore the additional liquid has no effect on the heating, as all the optical power is absorbed before reaching the position of the meniscus for the smallest filling level ( = 600 µm). The typical length over which heat diffusion takes place, , is calculated as [38]
| (1) |
where is the thermal diffusivity (0.14 mm2/s for water). Even for the longest nucleation time (35 ms), µm, and therefore at least one order of magnitude smaller than the filling level. Therefore, it can be assumed that changes in the filling level do not affect the nucleation times.
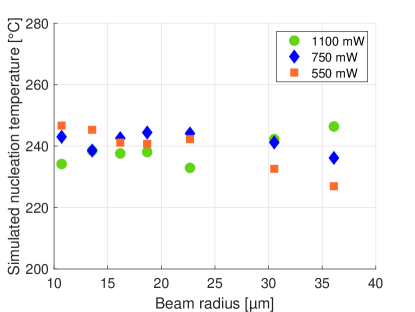
In the numerical simulations using COMSOL, the energy absorption and heat transfer in the liquid experiment is simulated until the moment of nucleation, which we took from the experimental nucleation times. These experimental nucleation times are in agreement with simulated times with a maximum local temperature of 237°C, see solid lines in Figure 2A. This agreement indicates that nucleation temperature is independent of laser beam radius and power. However, the two lowest laser intensities show an exception; where the beam radius is large and laser power small. In such cases, the experiment gives a smaller temperature due to a larger heated region, which is up to 30 times larger compared to the other cases. In such situations, nucleation may happen at lower temperatures, and thus shorter nucleation times. For all other data points, the temperature is very close to the 237°C, with a standard deviation of 5°C (see Figure SI 3). These temperatures are all well above the boiling temperature of water at atmospheric pressure (100°C), which is explained by the existence of an energy barrier for nucleation. Due to this energy barrier, higher temperatures are needed for bubble formation in microfluidic volumes on short timescales (ms). On the other hand, these temperatures are well below the spinodal temperature at atmospheric pressure (306°C [33]), which is explained as the bubble forms at a wall, where the energy barrier for bubble formation is lower [39]. Due to this energy barrier, the nucleation itself is a stochastic event [25, 33], which could further explains the slight variations in nucleation time and temperature. Furthermore, impurities such as gas molecules also reduce the energy barrier and therefore nucleation temperature.
In literature, different temperatures are noted for bubble formation using a CW laser, either through thermocavitation (direct heating of the liquid) or plasmonic heating (indirect heating of the liquid through plasmonic nanoparticles), see Figure 3. For thermocavitation, studies report different values, either close to the boiling temperature or the spinodal temperature, both of which are unlikely due to the above-mentioned reasons. Our values are in agreement to temperatures found for plasmonic bubbles, therefore, we conclude that our values are closer to the actual temperatures in thermocavitation. Nonetheless, heterogeneous nucleation depends on impurities, which act as nucleation sites [33, 40]. These impurities, such as surface roughness [39], surfactants or dissolved gas molecules [41, 42], reduce the energy barrier and therefore result in earlier nucleation.
Figure 2B shows the delivered energy at the moment of nucleation as a function of beam radius, which is calculated by the laser power multiplied by the nucleation time (E = ). We observe an increase of beam radius or decrease of laser power results in an increase in energy. Furthermore, E spans over two orders of magnitude (0.2 - 20 mJ), for a single thermocavitation set-up. Especially the beam radius plays a significant role in the delivered energy, which makes this set-up an optimal way to accurately control the amount of delivered energy.
3.2 Bubble growth and energy conversion
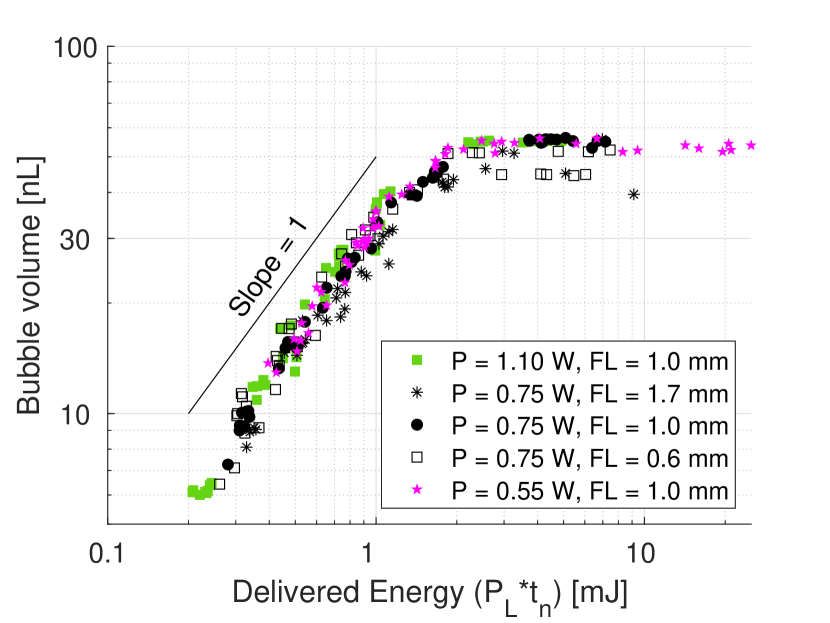
The maximum bubble volumes are shown in Figure 5 as a function of delivered energy. For all experimental parameters, the maximum bubble volume increases linearly with delivered energy (see logarithmic slope of 1). As all data points are along the same curve, there is little influence of laser power or filling level. However, for large values of delivered energies (E 2 mJ), the bubble volume plateaus. This plateau is explained by the limited channel length, as the bubble collapses at the moment they coalesce with the surrounding air (see example in Figure SI 4). Therefore, the bubble never reaches its potential maximum volume and larger bubbles cannot be observed in this configuration. This is most apparent for the smallest filling level ( mm, green diamonds), where already for smaller bubble volumes it can grow beyond the contact line and coalesce with the air inside the channel, resulting in lower plateau values in Figure 5.
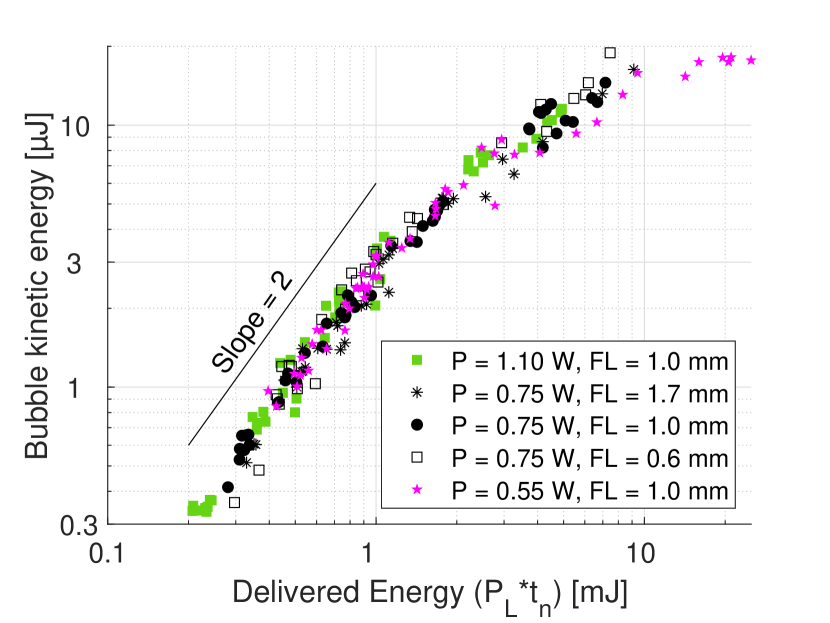
Figure 5 shows the kinetic energy of the bubble as a function of delivered energy. The kinetic energy is Emv2, where m is the liquid mass in the channel and v the maximum bubble growth velocity (change of length over per unit time). We note that the bubble kinetic energy increases quadratically (log slope = 2) with the delivered energy, independent of the laser or liquid parameters. This means that for a constant filling level, the bubble growth rate increases linearly with the delivered energy, as was also found in our earlier work [24]. Here, we now also find that the mass (m ) does not affect the energy transfer and therefore the bubble growth rate v scales with v , which matches previous qualitative observations [45]. For applications such as jet formation for printing or needle-free injection, this means that the liquid velocity can be controlled through the mass of liquid in the confinement. Furthermore, this independence of laser parameters contrasts with pulsed lasers, where an increase in beam radius results in a slower growing bubble [22, 24]. For large values of the delivered energy, the slope in Figure 5 decreases. This is explained by heat diffusion, as this large amount of energy is achieved through long nucleation times, at which point heat dissipation into the glass plays a significant role (see Equation 1). This is especially the case for the smallest laser power (P = 0.55 mW, pink stars), which requires the longest nucleation times to reach those energies, resulting in more heat dissipation.
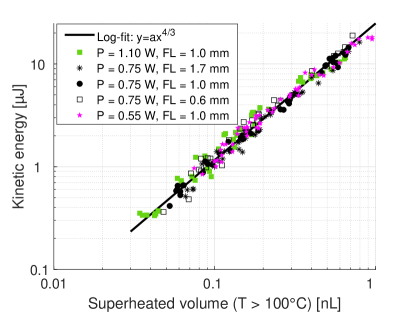
One of the goals of the COMSOL simulations was to investigate the heat dissipation during the absorption of optical energy until moment of nucleation. As discussed in section 3.1, nucleation happens at approximately 237°C. However, after nucleation has occurred and the energy barrier has been overcome, liquid at a lower temperature (but still above 100°C) may also contribute to this growing bubble. Figure 6 shows the bubble kinetic energy as a function of the volume of superheated water (T 100°C) at the moment of nucleation. This superheated volume is taken from the COMSOL simulations at the moment of nucleation in the experiment. In contrast to Figure 5, where the initial quadratic relation seems to decrease, the slope in Figure 6 remains constant, which is explained as heat dissipation is included in this simulation.
Microbubbles can also be created by different means, such as pulsed lasers [24], plasmonic bubbles [44], discharge with low- [46] or high-voltage [47], microheaters [48] and the tube arrest method [49]. These methods can create similar bubble sizes as in this study and require similar amounts of energy [24, 46]. Follow-up studies could focus on a quantitative comparison between the bubble dynamics and their R(t)-curves to find the best method for different applications. However, most of these methods are invasive, which reduces the ease of use and making chip fabrication more complex. The laser-generated bubbles allow for local heating and generation of bubbles on-chip, and more specifically the use of CW lasers allow for small and affordable set-up.
4 Conclusion
We proposed and developed a novel set-up to accurately control the laser beam size for thermocavitation in microfluidic confinement. We compared experimental results using high-speed imaging to numerical simulations on the energy absorption and heat transfer. This study focused on the influence of laser beam characteristics on thermocavitation in microfluidic confinement and the energy conversion. We found that the nucleation time increases with increasing beam radius as well as decreasing laser power. Numerical simulations of the heat transfer show that the maximum temperature at the moment of nucleation is 237 10°C and independent of laser beam parameters. This temperature is below the spinodal temperature (306°C), but well above the boiling temperature (100°C) and is in agreement to earlier work on plasmonic bubbles. As the filling level is much larger than the absorption length, it does not influence the nucleation time or temperature.
Furthermore, we found that the maximum bubble volume increases linearly with delivered energy and the conversion is independent of laser parameters. For the largest energies, the maximum bubble volume reaches a plateau as the bubble coalesces with the surrounding air at the opening of the microfluidic channel before reaches its maximum potential volume. The bubble kinetic energy increases quadratically with the delivered energy. However, for large energies, the conversion efficiency decreases, which is explained by the heat dissipation, as the nucleation time is on the same timescale as thermal diffusion. From the temperature profiles in the numerical simulations we find that the bubble kinetic energy increases with volume of superheated liquid (T 100°C), with a power law of 4/3. As heat dissipation is included in these simulations, this relation holds for all data points, independent of the laser or liquid parameters.
Our findings contribute to the understanding and use of thermocavitation, and allow for a better control over the bubble characteristics in real life applications. The laser power and beam radius control the nucleation time and delivered energy, and can therefore control the bubble size and growth rate. This allows for optimal use of thermocavitation in a wide range of applications, including laser-actuated jet injection.
Acknowledgements
J.J.S and D.F.R. acknowledge the funding from the European Research Council (ERC) under the European Union’s Horizon 2020 Research and Innovation Programme (Grant Agreement No. 851630). J.J.S. would like to thank Stefan Schlautmann for the fabrication of the microfluidic chips.
Competing interest
The authors declare that they have no known competing financial interests or personal relationships that could have appeared to influence the work reported in this paper.
CRediT authorship contribution statement
Jelle J. Schoppink: Conceptualization, Methodology, Formal analysis, Investigation, Data Curation, Writing - Original Draft, Visualization Jose A. Alvarez-Chavez: Conceptualization, Writing - Review & Editing. David Fernandez Rivas: Conceptualization, Supervision, Project administration, Funding acquisition, Writing - Review & Editing.
References
- [1] S.. Rastopov and A.. Sukhodol’skiî “Self-organization of the heat cycle due to thermal cavitation during continuous laser heating of a liquid” In Soviet Physics Doklady 32, 1987, pp. 671
- [2] V.. Chudnovskii et al. “Laser-induced boiling of biological liquids in medical technologies” In Quantum Electronics 47.4 Turpion-Moscow Limited, 2017, pp. 361–370 DOI: 10.1070/qel16298
- [3] S.. Afanador-Delgado, V.. Marañón-Ruíz, R. Sevilla-Escoboza and R. Chiu “Synthesis of SiO2 nanoparticles assisted by thermocavitation in natural dye (Hibiscus sabdariffa L.)” In Optics and Laser Technology 147.October 2021, 2022 DOI: 10.1016/j.optlastec.2021.107559
- [4] Vikram Korede et al. “A review on laser-induced crystallization from solution” In Crystal Growth and Design 23, 2023, pp. 3873–3916 DOI: 10.1021/acs.cgd.2c01526
- [5] N.. García-Morales, B. Morales-Cruzado, S. Camacho-López, R. Romero-Méndez, Luis Felipe Devia-Cruz and Francisco G. Pérez-Gutiérrez “Numerical modeling of a micropump without mobile parts actuated by thermocavitation bubbles” In Microsystem Technologies 27.3, 2021, pp. 801–812 DOI: 10.1007/s00542-020-04998-0
- [6] Rafael Zaca Moran, Cesar Amaxal-Cuatetl, Placido Zaca-Moran, Juan Castillo Mixcoatl, Ruben Ramos-Garcia and Juan Pablo Padilla-Martinez “Thermocavitation: A novel mechanism to pulse fiber lasers” In Optics Express 29.15, 2021, pp. 23439–23446 DOI: 10.1364/oe.430319
- [7] A. Guzmán-Barraza, J.G. Ortega-Mendoza, P. Zaca-Morán, N.I. Toto-Arellano, C. Toxqui-Quitl and J.P. Padilla-Martinez “Optical cavitation in non-absorbent solutions using a continuous-wave laser via optical fiber” In Optics and Laser Technology 154.January, 2022, pp. 108330 DOI: 10.1016/j.optlastec.2022.108330
- [8] N. Korneev, P. Montero, Ruben Ramos-Garcia, J.. Ramirez-San-Juan and J.. Padilla-Martinez “Ultrasound induced by CW laser cavitation bubbles” In Journal of Physics: Conference Series 278.1, 2011 DOI: 10.1088/1742-6596/278/1/012029
- [9] Rafael Zaca Moran et al. “Theoretical and experimental study of acoustic waves generated by thermocavitation and its application in the generation of liquid jets” In Optics Express 28.4, 2020, pp. 4928–4937 DOI: 10.1364/oe.375900
- [10] J.. Sarabia-Alonso et al. “Optothermal generation, trapping, and manipulation of microbubbles” In Optics Express 28.12, 2020, pp. 17672 DOI: 10.1364/oe.389980
- [11] J.. Sarabia-Alonso, J.. Ortega-Mendoza, S. Mansurova, F.. Muñoz-Pérez and Ruben Ramos-Garcia “3D trapping of microbubbles by the Marangoni force” In Optics Letters 46.23, 2021, pp. 5786 DOI: 10.1364/ol.440290
- [12] Pol Sopeña, Javier Arrese, Sergio González-Torres, Juan Marcos Fernández-Pradas, Albert Cirera and Pere Serra “Low-Cost Fabrication of Printed Electronics Devices through Continuous Wave Laser-Induced Forward Transfer” In ACS Applied Materials and Interfaces 9.35, 2017, pp. 29412–29417 DOI: 10.1021/acsami.7b04409
- [13] Zia Ur Rehman, Fei Yang, Mengmeng Wang and Tong Zhu “Fundamentals and Advances in Laser-Induced Transfer” In Optics and Laser Technology 160.November 2022 Elsevier Ltd, 2023, pp. 109065 DOI: 10.1016/j.optlastec.2022.109065
- [14] Jelle Schoppink and David Fernandez Rivas “Jet injectors: Perspectives for small volume delivery with lasers” In Advanced Drug Delivery Reviews 182 Elsevier, 2022, pp. 114109 DOI: 10.1016/j.addr.2021.114109
- [15] Diana L. Ven, Davide Morrone, Miguel A. Quetzeri-Santiago and David Fernandez Rivas “Microfluidic jet impact: spreading, splashing, soft substrate deformation and injection” In Journal of Colloid and Interface Science 636, 2023, pp. 549–558 DOI: 10.1016/j.jcis.2023.01.024
- [16] Jelle J. Schoppink, Keerthana Mohan, Miguel A. Quetzeri-Santiago, Gareth McKinley, David Fernandez Rivas and Andrew K. Dickerson “Cavitation-induced microjets tuned by channels with alternating wettability patterns” In Physics of Fluids 35.032017, 2023 DOI: 10.1063/5.0143223
- [17] J.. Padilla-Martinez, J.. Ramirez-San-Juan, N. Korneev, N. Banks, Guillermo Aguilar and Ruben Ramos-Garcia “Breaking the Rayleigh-Plateau instability limit using thermocavitation within a droplet” In Atomization and Sprays 23.6, 2013, pp. 517–533 DOI: 10.1615/AtomizSpr.2013007155
- [18] Nancy Elizabeth González-sierra, José Manuel Perez-corte, Juan Pablo Padilla-martinez, Samuel Cruz-vanegas and Silvio Bonfadini “Bubble dynamics and speed of jets for needle-free injections produced by thermocavitation” In Journal of Biomedical Optics 28.7, 2023, pp. 1–19 DOI: 10.1117/1.JBO.28.7.075004
- [19] Tae-hee Han, Jung-moo Hah, Jack J Yoh, Tae-hee Han, Jung-moo Hah and Jack J Yoh “Drug injection into fat tissue with a laser based microjet injector Drug injection into fat tissue with a laser based microjet injector” In Journal of Applied Physics 093105.2011, 2011, pp. 107–110 DOI: 10.1063/1.3584813
- [20] Yoshiyuki Tagawa, Nikolai Oudalov, A. Ghalbzouri, Chao Sun and Detlef Lohse “Needle-free injection into skin and soft matter with highly focused microjets” In Lab on a Chip, 2013 DOI: 10.1039/c2lc41204g
- [21] Jan Krizek, Paul Delrot and Christophe Moser “Repetitive regime of highly focused liquid microjets for needle-free injection” In Scientific Reports, 2020 DOI: 10.1038/s41598-020-61924-0
- [22] Jan Krizek, Frédéric De Goumoëns, Paul Delrot and Christophe Moser “Needle-free delivery of fluids from compact laser- based jet injector” In Lab on a Chip Royal Society of Chemistry, 2020, pp. 3784–3791 DOI: 10.1039/d0lc00646g
- [23] M. Moradiafrapoli and Jeremy O. Marston “High-speed video investigation of jet dynamics from narrow orifices for needle-free injection” In Chemical Engineering Research and Design, 2017 DOI: 10.1016/j.cherd.2016.10.023
- [24] Jelle J. Schoppink, Jan Krizek, Christophe Moser and David Fernandez Rivas “Cavitation induced by pulsed and continuous-wave fiber lasers in confinement” In Experimental Thermal and Fluid Science 146, 2023, pp. 110926 DOI: 10.1016/j.expthermflusci.2023.110926
- [25] J.. Padilla-Martinez, C. Berrospe-Rodriguez, Guillermo Aguilar, J.. Ramirez-San-Juan and Ruben Ramos-Garcia “Optic cavitation with CW lasers: A review” In Physics of Fluids 26.12, 2014 DOI: 10.1063/1.4904718
- [26] Yuliang Wang et al. “Giant and explosive plasmonic bubbles by delayed nucleation” In Proceedings of the National Academy of Sciences of the United States of America, 2018 DOI: 10.1073/pnas.1805912115
- [27] J.C. Ramirez-San-Juan et al. “Time-resolved analysis of cavitation induced by CW lasers in absorbing liquids” In Optics Express 18.9, 2010, pp. 8735 DOI: 10.1364/oe.18.008735
- [28] Bin Zhang, Darren Banks, Vicente Robles, Luis Felipe, Devia Cruz and Guillermo Aguilar “High resolution optical investigation of laser intensity and solution temperature effects on thermocavitation” In Experimental Thermal and Fluid Science 136.April Elsevier Inc., 2022, pp. 110683 DOI: 10.1016/j.expthermflusci.2022.110683
- [29] S.. Afanador-Delgado, R. Sevilla-Escoboza, V.. Marañón-Ruíz and R. Chiu “Influence of the anthocyanin concentration in ethanolic extracts of Hibiscus Sabdariffa on thermocavitation: An analysis of the pulse frequency and amplitude” In Optics and Laser Technology 132 Elsevier Ltd, 2020 DOI: 10.1016/j.optlastec.2020.106468
- [30] J.. Padilla-Martinez, Guillermo Aguilar, J.. Ramirez-San-Juan and Ruben Ramos-Garcia “Temporal evolution of thermocavitation bubbles using high speed video camera” In Optical Trapping and Optical Micromanipulation VIII 8097.September 2011, 2011, pp. 809727 DOI: 10.1117/12.894467
- [31] D. Banks, V. Robles, B. Zhang, Luis Felipe Devia-Cruz, S. Camacho-Lopez and Guillermo Aguilar “Planar laser induced fluorescence for temperature measurement of optical thermocavitation” In Experimental Thermal and Fluid Science 103, 2019, pp. 385–393 DOI: 10.1016/j.expthermflusci.2019.01.030
- [32] D. Ross, M. Gaitan and L.. Locascio “Temperature measurement in microfluidic systems using a temperature-dependent fluorescent dye” In Analytical Chemistry 73.17, 2001, pp. 4117–4123 DOI: 10.1021/ac010370l
- [33] Frédéric Caupin and Eric Herbert “Cavitation in water: a review” In Comptes Rendus Physique 7.9-10, 2006, pp. 1000–1017 DOI: 10.1016/j.crhy.2006.10.015
- [34] C.. Avedisian “The Homogeneous Nucleation Limits of Liquids” In Journal of Physical and Chemical Reference Data 14.3, 1985, pp. 695–729 DOI: 10.1063/1.555734
- [35] Ruru Deng, Yingqing He, Yan Qin, Qidong Chen and Lei Chen “Measuring pure water absorption coefficient in the near-infrared spectrum ( 900 — 2500 nm )” In Journal of Remote Sensing 16.1, 2012, pp. 192–206
- [36] E. Jansen, Ton G. Leeuwen, Massoud Motamedi, Cornelius Borst and Ashley J. Welch “Temperature dependence of the absorption coefficient of water for midinfrared laser radiation” In Lasers in Surgery and Medicine 14.3, 1994, pp. 258–268 DOI: 10.1002/lsm.1900140308
- [37] Björn I. Lange, Tobias Brendel and Gereon Hüttmann “Temperature dependence of light absorption in water at holmium and thulium laser wavelengths” In Applied Optics 41.27, 2002, pp. 5797 DOI: 10.1364/ao.41.005797
- [38] Günther Paltauf and Peter E. Dyer “Photomechanical processes and effects in ablation” In Chemical Reviews 103.2, 2003, pp. 487–518 DOI: 10.1021/cr010436c
- [39] Anthony A. Atchley and Andrea Prosperetti “The crevice model of bubble nucleation” In Journal of the Acoustical Society of America 86.3, 1989, pp. 1065–1084 DOI: 10.1121/1.398098
- [40] Andrea Prosperetti “Vapor Bubbles” In Annual Review of Fluid Mechanics, 2017 DOI: 10.1146/annurev-fluid-010816-060221
- [41] M.. Pettersen, S. Balibar and H.. Maris “Experimental investigation of cavitation in superfluid He4” In Physical Review B 49.17 American Physical Society, 1994, pp. 12062–12070 DOI: 10.1103/PhysRevB.49.12062
- [42] Patricia Pfeiffer et al. “Thermally Assisted Heterogeneous Cavitation through Gas Supersaturation” In Physical Review Letters 128.19 American Physical Society, 2022, pp. 194501 DOI: 10.1103/PhysRevLett.128.194501
- [43] Guillaume Baffou, Julien Polleux, Hervé Rigneault and Serge Monneret “Super-heating and micro-bubble generation around plasmonic nanoparticles under cw illumination” In Journal of Physical Chemistry C 118.9, 2014, pp. 4890–4898 DOI: 10.1021/jp411519k
- [44] Xiaolai Li et al. “Plasmonic Bubble Nucleation and Growth in Water: Effect of Dissolved Air” In Journal of Physical Chemistry C, 2019 DOI: 10.1021/acs.jpcc.9b05374
- [45] Loreto Oyarte Gálvez, Arjan Fraters, Herman L. Offerhaus, Michel Versluis, Ian W. Hunter and David Fernández Rivas “Microfluidics control the ballistic energy of thermocavitation liquid jets for needle-free injections” In Journal of Applied Physics, 2020 DOI: 10.1063/1.5140264
- [46] Darjan Podbevšek, Žiga Lokar, Jure Podobnikar, Rok Petkovšek and Matevž Dular “Experimental evaluation of methodologies for single transient cavitation bubble generation in liquids” In Experiments in Fluids 62.8 Springer Berlin Heidelberg, 2021, pp. 1–28 DOI: 10.1007/s00348-021-03260-1
- [47] Silvestreroberto R. Gonzalez Avila, Chaolong Song and Claus-Dieter Ohl “Fast transient microjets induced by hemispherical cavitation bubbles” In Journal of Fluid Mechanics, 2015 DOI: 10.1017/jfm.2015.33
- [48] Dang Minh Nguyen, Muttikulangara Swaminathan Sanathanan, Jianmin Miao, David Fernandez Rivas and Claus Dieter Ohl “In-phase synchronization between two auto-oscillating bubbles” In Physical Review Fluids 4.4 American Physical Society, 2019, pp. 43601 DOI: 10.1103/PhysRevFluids.4.043601
- [49] Hengzhu Bao, Fabian Reuter, Hongchao Zhang, Jian Lu and Claus Dieter Ohl “Impact-driven cavitation bubble dynamics” In Experiments in Fluids 64.2 Springer Berlin Heidelberg, 2023, pp. 1–13 DOI: 10.1007/s00348-023-03569-z
- [50] George M. Hale and Marvin R. Querry “Optical Constants of Water in the 200-nm to 200-m Wavelength Region” In Applied Optics 12.3 The Optical Society, 1973, pp. 555 DOI: 10.1364/ao.12.000555
- [51] John M. Senior “Optical Fiber Communications: Principles and practice” Pearson, 2009
- [52] Saktioto et al. “Birefringence and Polarization Mode Dispersion Phenomena of Commercial Optical Fiber in Telecommunication Networks” In Journal of Physics: Conference Series 1655.1, 2020 DOI: 10.1088/1742-6596/1655/1/012160
- [53] Frank Andrew M. Kowalevicz, Jr.; Bucholtz “Beam Divergence from an SMF-28 Optical Fiber” In Naval Research Laboratory, 2006, pp. 17
- [54] Alfred Vogel and Vasan Venugopalan “Mechanisms of pulsed laser ablation of biological tissues” In Chemical Reviews 103.2, 2003, pp. 577–644 DOI: 10.1021/cr010379n
- [55] SCHOTT “BOROFLOAT ® 33-Optical Properties Optical index of refraction Optical data” URL: www.schott.com/borofloat
SI 1 Numerical simulations: Ray tracing
Geometry & Material
To calculate the size of the laser beam at the glass-water interface, ray tracing simulations were performed in COMSOL (version 6.0).
The 3D geometry in the simulation is an exact copy of the microfluidic chip. Due to axial symmetry at and , only a quarter of the domain has been simulated. The material properties of the air and the Schott BOROFLOAT ® 33 glass were taken from the in-built materials. The water was taken as the in-built material from Hale and Quarry [50].
Calculation of initial beam divergence
The initial beam divergence from the fiber tip in air can be calculated using fiber parameters. First, the V-value at our wavelength, which is the normalized frequency, is calculated [51]
| (2) |
where is the wavelength (1.95 µm), a the fiber core radius (4.1 µm). is the relative refractive index difference, calculated as
| (3) |
where and are the refractive index of the SMF28 fiber core and cladding respectively [52], which results in a value of .
Using this value for in Equation 2, results in a V-value of 1.62. With this value, the mode field diameter (MFD) can be calculated [51]
| (4) |
From the MFD, the Rayleigh range can be calculated by [53]
| (5) |
Ray modeling
The laser beam was simulated as a Gaussian beam consisting of a total of 7651 individual rays, over a total of 50 polar angles. The initial divergence in air is 0.097 rad, as calculated in Equation 8. They were released at the various -positions of the fiber tip in the experiment. At the air-glass interface, each ray is refracted according to their incident angle. At the liquid-water interface, the rays were captured and their positions () and powers were saved to text files. Furthermore, 50 µm further into the channel, the rays were captured again, and their position and power were saved as well to quantify the effect of the divergence inside the water. In MATLAB, the individual rays were combined into a single curve for the incident power as a function of the radial position (). This was fitted with a Gaussian curve to get the standard deviation, which is close to the beam radius. The resulting beam radii can be found in Table SI 1.
To ensure that the time steps and mesh cells were sufficient small enough, the simulation was repeated for a range of time steps and meshes for one specific value of (440 µm) as can be seen in Table SI 2. It was found that time steps of ns were sufficiently small enough, and the smallest mesh was chosen as it did not increase the computational time that much.
| Distance fiber tip to water channel (µm) | 147 | 193 | 236 | 276 | 339 | 470 | 567 |
|---|---|---|---|---|---|---|---|
| Laser beam radius at channel interface (µm) | 7.2 | 9.6 | 11.9 | 14.0 | 17.5 | 24.6 | 29.8 |
| Laser beam radius 50 µm into the channel (µm) | 10.7 | 13.6 | 16.2 | 18.7 | 22.7 | 30.5 | 36.1 |
|
3e-6 | 1e-5 | 3e-5 | 1e-4 | ||
|---|---|---|---|---|---|---|
| Extremely fine | 24.67 | 24.57 | 24.27 | 10.14 | ||
| Extra fine | 24.67 | 24.57 | 24.27 | 9.55 | ||
| Finer | 24.67 | 24.56 | 24.27 | 9.51 | ||
| Fine | 24.74 | 24.64 | 24.34 | 9.55 | ||
| Normal | 24.68 | 24.58 | 24.28 | 9.12 |
SI 2 Heat transfer simulations
To simulate the heating of the liquid, the radiative beam in absorbing media module in COMSOL is used, in combination of the heat transfer in solids. The radiative beam is taken as a parallel Gaussian beam with the radii found in the earlier described ray tracing simulations (see Section SI 1). As the beam is still expanding inside the water, this should be taken into account. To compensate for this effect, the laser beam radius is taken halfway across the absorption length, which is approximately 50 µm into the channel.
The absorption coefficient at the laser wavelength (µm) is equal to m-1 [35]. However, it is found that the optical absorption of water in the 2 µm region decreases with increasing temperature [54], which is caused by the shift of the absorption peak towards shorter wavelengths [36]. This decrease of absorption coefficient at the wavelength of 2.014 µm was found to be -25.9 K-1m-1 [37]. The optical absorption in the glass at the laser wavelength is negligible [55] and therefore set to zero in the simulation. However, through heat dissipation from the water, the glass chip is heated, which results in a loss of energy conversion from the laser to the liquid.
As the channel is mirror symmetrical along and , only a quarter of the channel is simulated. Due to the high absorption coefficient, the water channel is set to a length of 1000 µm, as no heat absorption or diffusion is expected to take place further into the channel. The time steps differ for each simulation, depending on the laser power and beam size, such that there are at least 300 time steps per simulation.
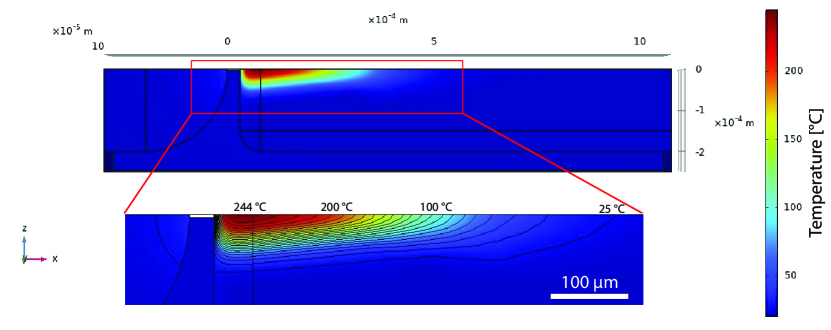
These simulations give the temperature profile at the moment of nucleation, which is taken from the experiment (see Figures 2A and SI 2). From these temperature profiles (example shown in Figure SI 1), we obtain the maximum temperature, which is always in the center of the laser beam, close to the wall, where the optical intensity is the highest. Furthermore, the temperature profile allows to calculate the volume of liquid which is superheated (T 100°C), which gives an indication of the liquid volume that can contribute to the bubble formation (see Figure 6).
SI 3 Experimental nucleation times
The experimental nucleation times for the different laser powers and filling levels are shown in Figure SI 2. This Figure shows that the nucleation time only depends on the beam radius and power. For P = 0.75W, three different filling levels are used. This filling level does not seem to influence the nucleation time, which can be expected as the filling level is much larger than the typical absorption length (1/ 80 µm).
SI 4 Simulated nucleation temperatures
The heat transfer simulations (Section SI 2) were executed to find the values and profile of the temperature at the moment of nucleation. Figure SI 3 shows these maximum simulated temperatures found in the liquid at the experimental nucleation time. The values are approximately constant at 237 10°C. Only for the smallest laser power (550 mW) and the larger beam radii, the found temperatures are lower. This could be explained by the simulation settings of the glass-liquid interface. At this interface, the temperature on equal sides are equal, which slightly increases the heat dissipation, and therefore slightly decreases the found temperatures, which is especially apparent for the longest nucleation times.
SI 5 Maximum bubble volume
In most cases, reaches it’s maximum volume and then collapses again by condensation of the vapor (see example in Figure 1). However, for large bubbles, the bubble may grow very large such that it comes in contact with the surrounding air. In these cases, the bubble ’collapses’ instantaneously. Such an example is shown in Figure SI 4.