Abstract
The Great Gatsby Curve measures the relationship between income inequality and intergenerational income persistence. By utilizing genealogical data of over 245,000 mentor-mentee pairs and their academic publications from 22 different disciplines, this study demonstrates that an academic Great Gatsby Curve exists as well, in the form of a positive correlation between academic impact inequality and the persistence of impact across academic generations. We also provide a detailed breakdown of academic persistence, showing that the correlation between the impact of mentors and that of their mentees has increased over time, indicating an overall decrease in academic intergenerational mobility. We analyze such persistence across a variety of dimensions, including mentorship types, gender, and institutional prestige.
Introduction
Intergenerational income mobility, which measures the extent to which income is passed on from one generation to the next, reflects the degree of openness in a society. Lower levels of mobility imply higher class persistence, meaning that an individual’s economic status is largely determined by their family background [1, 2]. In recent years, the issues of declining mobility [3] and rising inequality [4], as well as their interrelationship [5], have attracted considerable attention from scholars and policymakers. The empirically observed positive correlation between income inequality and intergenerational income persistence [6, 7] is often referred to as the Great Gatsby Curve in the literature, based on the 1925 novel by F. Scott Fitzgerald exploring — among others — the theme of class persistence. Such a relationship has important implications for understanding the mechanisms of social mobility in different contexts, and the potential policy levers to enhance it.
A number of recent studies have investigated concepts that represent the academic equivalents of inequality and intergenerational persistence. The former refers to the uneven distribution of opportunity [8] and academic impact [9, 10], which — in spite of its multifaceted nature — is usually operationalized in terms of the volume of citations accrued by publications over time [11]. The latter is instead quantified by the influence that a mentor’s status may have on their protégés’ academic success [12, 13, 14, 15].
In this paper we seek to determine whether an “academic Great Gatsby Curve” exists, i.e., whether academic inequality and intergenerational persistence are positively correlated. In line with the above studies, we quantify academic inequality as the concentration of impact in a population of authors, as measured by the Gini coefficient of the distribution of citations. We operationalize academic intergenerational persistence as the correlation between the academic impact of mentors and that of their protégés, mirroring the association between parents’ and children’s economic well-being. In fact, a mentor can sometimes be seen as a mentee’s “academic parent”, as reflected by the German terms for supervisor, Doktorvater or Doktormutter, literally meaning doctoral father or mother. However, unlike the transmission of economic welfare from parents to children, the inheritance between mentors and mentees mainly involves the transfer of research skills and experience, knowledge of the field [16] and professional networks [13, 14, 15]. We expect a high level of persistence across academic generations to be associated with unequal opportunities in academia, which we seek to detect as inequality in the distribution of citations across authors in a discipline.
We already documented a positive relationship between academic impact inequality and lack of mobility in impact rankings in a previous study [10]. In that case, the notion of mobility we considered was related to different moments in an author’s career. Here, instead, we are interested in mobility across academic generations, and therefore in comparing an author’s academic status with that of their mentors. This is the closest academic equivalent to intergenerational mobility as considered in the Social Sciences.
In the following, we analyze genealogical data on more than 300,000 academics who published nearly 10 million papers in 22 disciplines from 2000 to 2013 (See Methods), examining temporal trends of academic persistence between mentors and their mentees, and comparing such trends across different mentorship types, different mentor-mentee gender combinations and different tiers of institutional prestige. Finally, we document the existence of an academic Great Gatsby Curve, namely the positive relationship between academic impact inequality and academic intergenerational persistence.
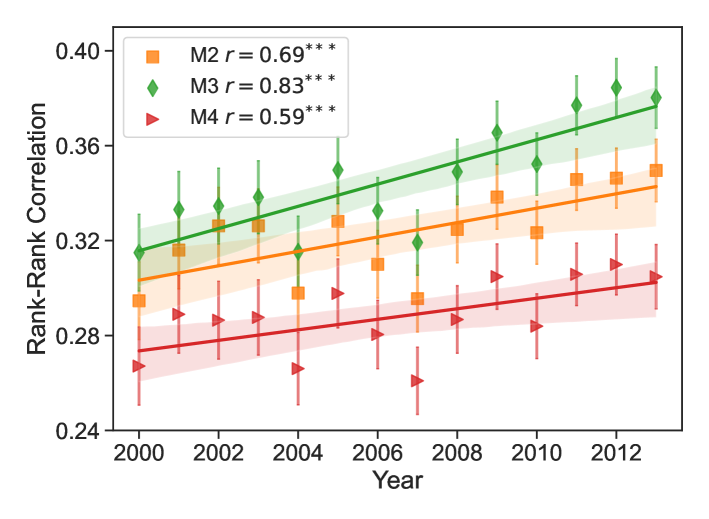
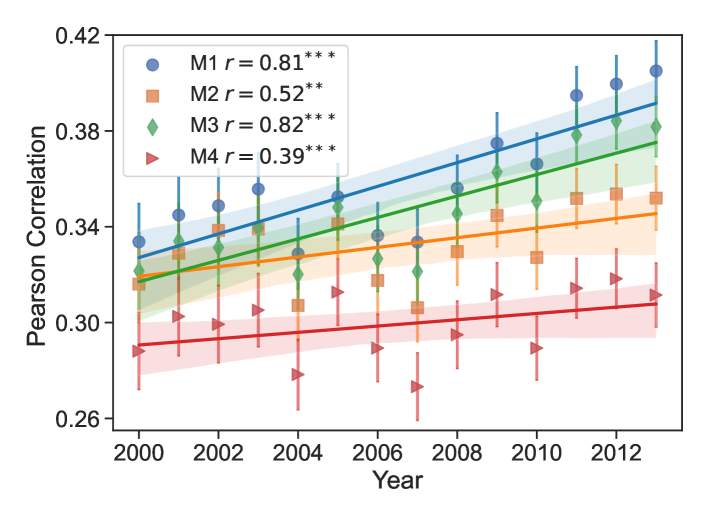
Results
Fig. 1a illustrates how we quantify the academic impact of mentors and mentees within a 5-year time window before and after the final year of their mentor-mentee relationship (hereafter referred to as “final mentorship year”), such as, e.g., the year of the mentee’s doctoral graduation. The aggregated impact of a mentor or mentee over this 5-year period is calculated as the sum of the citations received by their papers (within 5 years of their publication) published during such period. To analyze the persistence of impact across academic generations, we calculate the Spearman rank correlation coefficients between the impact percentile ranks of mentors and mentees for cohorts with different final mentorship years. In other words, we measure the similarity between the positions of mentors and their mentees in the impact rankings of their discipline: The higher the rank-rank correlation, the more a mentee’s scientific impact is correlated to that of their mentor, the higher the intergenerational persistence. Fig. 1b shows a significant upward trend in rank-rank correlations, indicating an increasing trajectory of persistence across subsequent mentor-mentee cohorts. This suggests that over time mentees have become increasingly likely to share a similar positions in their discipline’s impact ranking as their own mentors. This finding is consistent with the observation that the academic impact of early-career researchers is increasingly influenced by the prominence and reputation of supervisors [15] and/or collaborators [14], as well as with the existence of a “chaperone effect” in scientific publishing [13]. To verify that this trend is not just an artifact due to our definition of academic impact, we reevaluate impact after normalizing citations over time and disciplines, and reevaluate the impact of mentors over longer periods of time, i.e., from the year of their initial publication to the final mentorship year, reaching the same conclusion (see Fig. S1). To further test the robustness of our results, we also measure the Pearson correlation between the logarithmic impact of mentors and mentees, once again reaching the same conclusions (see Fig. S2).
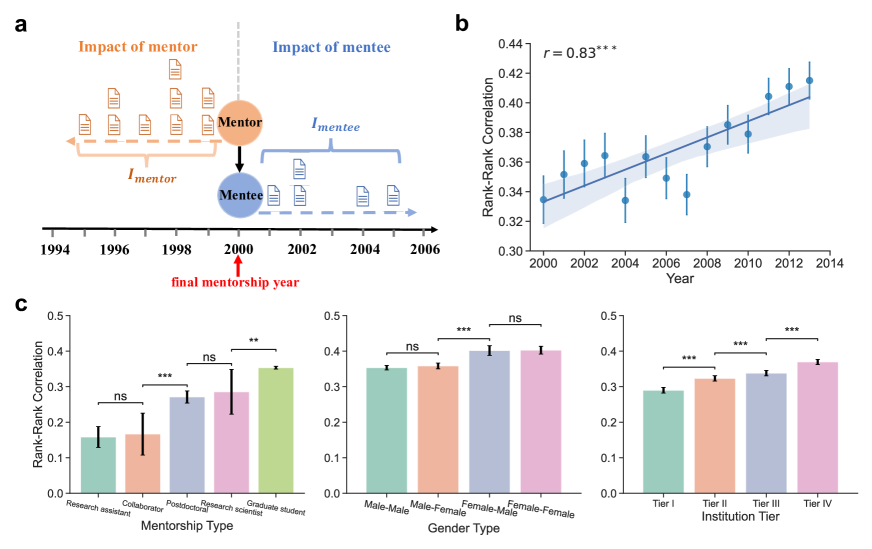
We now proceed to investigate the disparities in impact persistence across various dimensions. We compare persistence across five different mentorship types (Table. S1 and Fig. 1c left), finding that Research assistants and Collaborators display the lowest rank-rank correlations with their mentors, followed by Research scientists and Postdoctoral fellows. The highest rank-rank correlation (i.e., the highest impact persistence) is observed for Graduate students, in line with the expectation that supervisors may have a closer and more supportive relationship with their students, and therefore a stronger influence on their career prospects [17, 15]. In addition, we investigate impact persistence between different mentor-mentee gender combinations in the middle panel of Fig. 1c. Our results show a slightly higher persistence associated with female mentors. This is possibly due to female mentors having a lasting positive impacts on mentees [18], or providing career development facilitation to a larger extent than male mentors [19]. After controlling for the mentor’s gender, we find no statistically significant difference in persistence among mentees of different genders. Furthermore, to understand whether intergenerational impact persistence varies according to the prestige of institutions in which the mentorship took place, we first rank institutions based on the total number of citations received by papers published by authors affiliated with them (as a proxy of their prestige), and then divide institutions equally into four tiers based on the quartiles of such ranking. The right panel of Fig. 1c reveals that the impact persistence between mentors and mentees is negatively correlated with the prestige of their institution, implying that persistence is relatively lower for top-tier institutions.
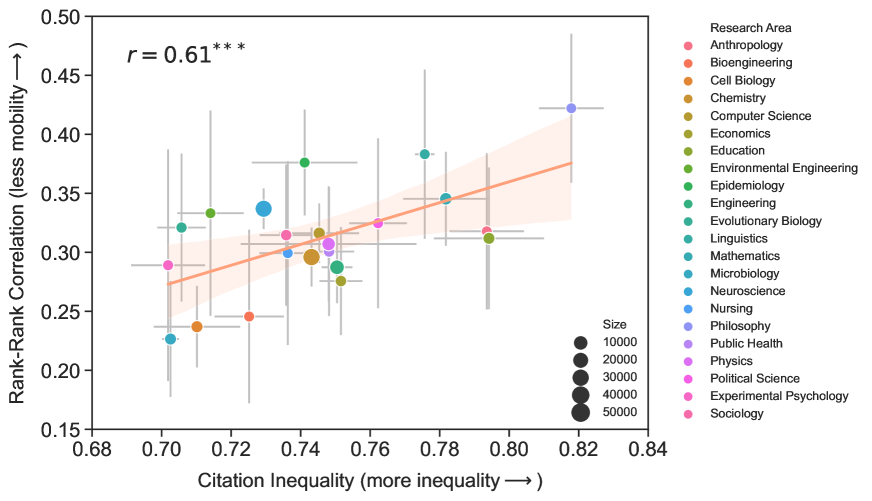
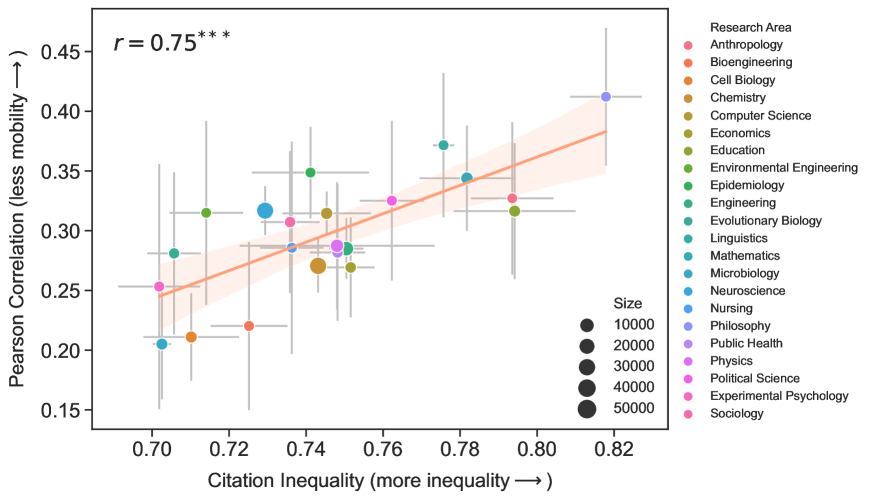
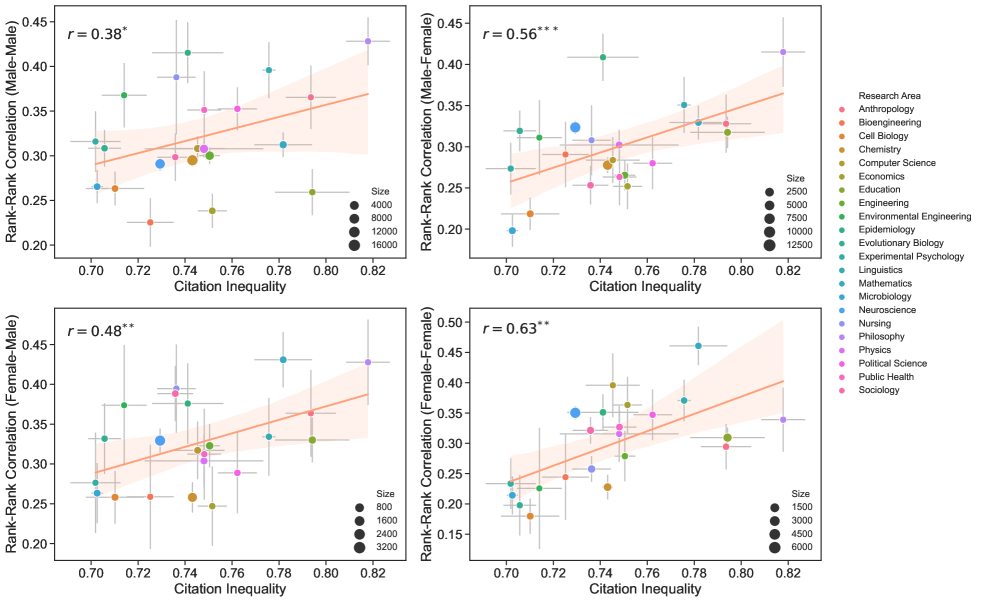
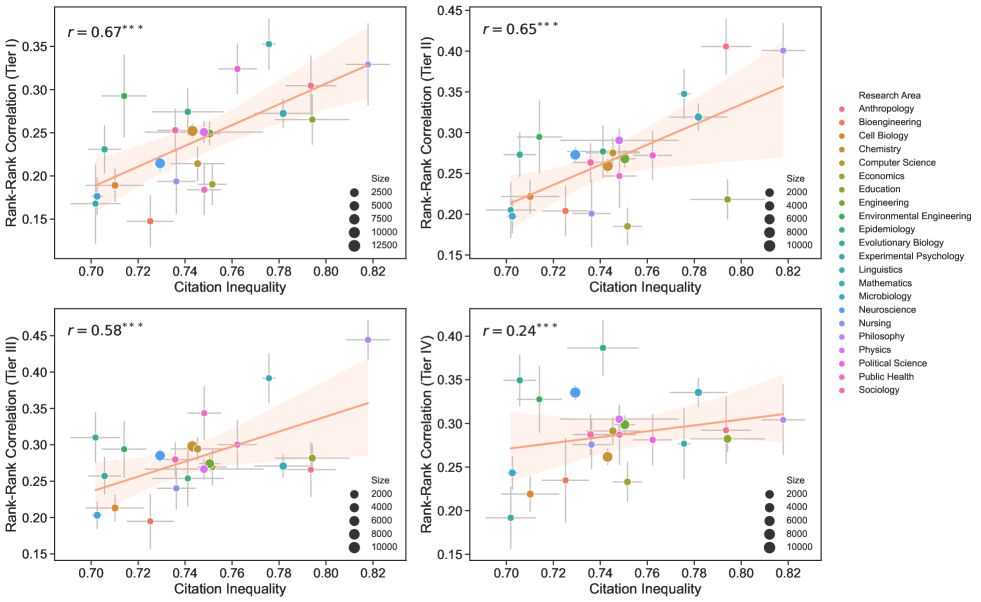
Inspired by the Great Gatsby Curve in the Social Sciences [5], we examine the association between impact inequality and intergenerational impact persistence. Fig. 2 ranks the disciplines included in our analysis along these two dimensions. The horizontal axis shows the impact inequality in a research area, measured by the Gini coefficient of the distribution of citations received by its authors. Over the past decade, researchers in areas such as Experimental Psychology, Microbiology and Evolutionary Biology experienced the most egalitarian citation distribution, while those in Philosophy, Education and Anthropology the most unequal. The vertical axis shows intergenerational impact persistence, obtained via the Spearman rank correlation as explained above. In disciplines like Microbiology, Cell Biology and Bioengineering, the correlation between the impact of mentors and mentees is the weakest. On the contrary, in some liberal arts and medical disciplines like Philosophy, Linguistics and Epidemiology the persistence of impact across academic generations is rather strong. The values of mentor-mentee impact correlation and inequality in each specific research area are summarized in Table S2. More importantly, we observe a significant positive correlation between these two quantities (with Pearson’s , ), suggesting that disciplines with greater inequality in their distributions of impact also tend to be areas in which academic impact is more likely to be passed on from mentors to mentees. We ran robustness checks using Pearson correlation instead of Spearman to quantify persistence, finding a consistent positive correlation between impact persistence and inequality (Fig. S3), with Pearson’s , . The positive correlation between impact persistence and inequality remains even when controlling for different mentor-mentee gender combinations (Fig. S4) and levels of institutional prestige (Fig. S5). Taken together, these results suggest a robust negative association between impact inequality in a given discipline and the potential for its early-career researchers (i.e., mentees) to achieve upward mobility.
Discussion
In this paper, we find that academia is not immune from the phenomenon of intergenerational persistence, which has been widely documented in the Social Sciences across dimensions such as income, wealth and occupation [1, 2]. We examined intergenerational academic persistence by analogizing academic mentors and mentees to parents and children, and academic impact (as measured with citations) to income. The persistence of income through genealogical generations and the persistence of impact through academic ones both reflect the transmission of resources and status, and they capture the extent to which the success of one generation may depend on that of the previous one. However, while there is a clear analogy between the mechanisms at play in these two contexts, there are also obvious differences. On one hand, both mechanisms involve the inheritance of a network, be it social, professional, or both [20, 21]. On the other hand, the transfer of economic status is — to a good extent — mechanistic, as it is grounded upon the inheritance of wealth. The transfer of academic status is instead grounded upon the inheritance of intangibles [16], such as knowledge and visibility.
Our findings suggest that academia has become less open and more stratified over time, as newer protégé cohorts are characterized by lower intergenerational mobility than their predecessors. We also demonstrated that there are significant differences in impact persistence across different types of mentorship, mentor-mentee gender combinations, and levels of institutional prestige.
Finally, we demonstrated the existence of an “academic Great Gatsby Curve”, i.e., of a positive relationship between academic impact inequality and intergenerational persistence, in analogy with the Great Gatsby Curve observed between income inequality and intergenerational persistence in the Social Sciences. This result makes it clear that academic impact — as quantified by citations — is to some extent inherited. As such, citation-based bibliometric indicators should be handled with care when used to assess the performance of academics.
Methods
Dataset
We collected genealogical data on mentorship relationships from the Academic Family Tree (AFT, Academictree.org), including 245,506 mentor-mentee relationships among 304,395 authors who published 9,809,145 papers across 22 disciplines. For each author, we record the person’s ID, name, gender, affiliation and discipline. For each mentor-mentee relationship, we record the IDs of the mentor and mentee, the mentorship type (i.e., graduate student, postdoc or research assistant), the institution where the mentorship took place, and the first and final mentorship years. Our analysis is based on mentorship relationships that ended between 2000 and 2013. The reason we use 2000 as the starting point of our analysis is that before that year records of mentor-mentee pairs in our data are much sparser and fluctuate significantly from year to year. We use 2013 as the final year to keep track of publications for a period of five years after the final mentorship year, plus an additional five years to allow for the accumulation of citations received by such publications.
We merged the aforementioned genealogy data with the authors’ publication records, citations and institutional affiliations by linking AFT with the Microsoft Academic Graph (MAG), one of the largest multidisciplinary bibliographic databases. One advantage of using the MAG database is that all entities in it (i.e., scientists, institutions and publications) have already been disambiguated and associated with unique identifiers, allowing for a sequential matching between AFT and MAG authors and affiliations. The integrated AFT and MAG data have been obtained from Ref. [22], and citation information of publications authored by AFT authors is retrieved from the MAG database.
Measures of mentor-mentee impact persistence
Spearman rank correlation. As one of the most common measures to of intergenerational persistence, it quantifies the extent to which a mentee’s impact rank tends to be associated with their mentor’s impact rank, without requiring the relationship between the two to be log-linear. This measure provides a concise summary of positional persistence, which is independent of any changes in the distribution of citations between the two generations. Therefore, it can be easily used to make comparisons across disciplines for temporal analyses.
Pearson correlation. An alternative measure of intergenerational persistence is the Pearson correlation, which captures the correlation between the logarithmic citation impact of mentors and mentees:
| (1) |
where and are, respectively, the logarithmic citation impact of mentors and mentees received within a 5-y time window before and after the final mentorship year .
References
- [1] Chetty, R., Hendren, N., Kline, P. & Saez, E. Where is the land of opportunity? the geography of intergenerational mobility in the united states. The Quarterly Journal of Economics 129, 1553–1623 (2014).
- [2] Xie, Y., Dong, H., Zhou, X. & Song, X. Trends in social mobility in postrevolution china. Proceedings of the National Academy of Sciences 119, e2117471119 (2022).
- [3] Song, X. et al. Long-term decline in intergenerational mobility in the united states since the 1850s. Proceedings of the National Academy of Sciences 117, 251–258 (2020).
- [4] Saez, E. & Zucman, G. Wealth inequality in the united states since 1913: Evidence from capitalized income tax data. The Quarterly Journal of Economics 131, 519–578 (2016).
- [5] Corak, M. Income inequality, equality of opportunity, and intergenerational mobility. Journal of Economic Perspectives 27, 79–102 (2013).
- [6] Andrews, D. & Leigh, A. More inequality, less social mobility. Applied economics letters 16, 1489–1492 (2009).
- [7] Krueger, A. B. The rise and consequences of inequality in the united states. Speech at the Center for American Progress (Washington, DC, 12 January). URL https://cdn.americanprogress.org/wp-content/uploads/events/2012/01/pdf/krueger.pdf.
- [8] Graves Jr, J. L., Kearney, M., Barabino, G. & Malcom, S. Inequality in science and the case for a new agenda. Proceedings of the National Academy of Sciences 119, e2117831119 (2022).
- [9] Nielsen, M. W. & Andersen, J. P. Global citation inequality is on the rise. Proceedings of the National Academy of Sciences 118, e2012208118 (2021).
- [10] Sun, Y., Caccioli, F. & Livan, G. Ranking mobility and impact inequality in early academic careers. Proceedings of the National Academy of Sciences 120, e2305196120 (2023).
- [11] Fortunato, S. et al. Science of science. Science 359, eaao0185 (2018).
- [12] Malmgren, R. D., Ottino, J. M. & Nunes Amaral, L. A. The role of mentorship in protégé performance. Nature 465, 622–626 (2010).
- [13] Sekara, V. et al. The chaperone effect in scientific publishing. Proceedings of the National Academy of Sciences 115, 12603–12607 (2018).
- [14] Li, W., Aste, T., Caccioli, F. & Livan, G. Early coauthorship with top scientists predicts success in academic careers. Nature Communications 10, 5170 (2019).
- [15] Ma, Y., Mukherjee, S. & Uzzi, B. Mentorship and protégé success in stem fields. Proceedings of the National Academy of Sciences 117, 14077–14083 (2020).
- [16] Liénard, J. F., Achakulvisut, T., Acuna, D. E. & David, S. V. Intellectual synthesis in mentorship determines success in academic careers. Nature communications 9, 4840 (2018).
- [17] Gardner, S. K. Conceptualizing success in doctoral education: Perspectives of faculty in seven disciplines. The Review of Higher Education 32, 383–406 (2009).
- [18] Wu, D. J., Thiem, K. C. & Dasgupta, N. Female peer mentors early in college have lasting positive impacts on female engineering students that persist beyond graduation. Nature Communications 13, 6837 (2022).
- [19] Fowler, J. L., Gudmundsson, A. J. & O’Gorman, J. G. The relationship between mentee-mentor gender combination and the provision of distinct mentoring functions. Women in Management Review 22, 666–681 (2007).
- [20] Robison, L. J., Schmid, A. A. & Siles, M. E. Is social capital really capital? Review of social economy 60, 1–21 (2002).
- [21] Morgan, A. C. et al. Socioeconomic roots of academic faculty. Nature Human Behaviour 6, 1625–1633 (2022).
- [22] Ke, Q., Liang, L., Ding, Y., David, S. V. & Acuna, D. E. A dataset of mentorship in bioscience with semantic and demographic estimations. Scientific Data 9, 467 (2022).
Data availability
The data used in the study are publicly available from the Academic Family Tree (https://academictree.org) and the Microsoft Academic Graph (https://zenodo.org/record/2628216). The link between the two data is derived from https://zenodo.org/record/4917086. All other data are included in the manuscript and/or SI Appendix.
Acknowledgements
Y.S. and G.L. acknowledge support from a Leverhulme Trust research project grant (RPG-2021-282).
Author contributions
Y.S., F.C. and G.L. conceived and designed research; Y.S. and X.L. collected the data; Y.S. performed research; Y.S., F.C., X.L. and G.L. analyzed data; Y.S., F.C., X.L. and G.L. wrote and edited the paper.
Competing interests
The authors declare that they have no competing interests.
Supplementary Information for:
The academic Great Gatsby Curve
Ye Sun1, Fabio Caccioli1,2,3, Xiancheng Li4, Giacomo Livan5,1,∗
1Department of Computer Science, University College London, 66-72 Gower Street, London WC1E 6EA, United Kingdom
2London School of Economics and Political Science, Systemic Risk Centre, London WC2A 2AE, United Kingdom
3London Mathematical Laboratory, United Kingdom
4School of Business and Management, Queen Mary University of London, Mile End Road, London E1 4NS, United Kingdom
5Dipartimento di Fisica, Università degli Studi di Pavia, via Bassi 6, 27100 Pavia, Italy
∗Corresponding author. Email: giacomo.livan@unipv.it
| Mentorship type | Description | Count | Persistence (Spearman) |
|---|---|---|---|
| 1. Research assistant | Undergraduate, pre-bachelor’s degree | 4,444 | 0.16 |
| 2. Graduate student | Work lead to master’s or doctoral dissertation | 231,431 | 0.36 |
| 3. Postdoctoral fellow | Short-term employment after earning doctorate | 11,909 | 0.27 |
| 4. Research scientist | Long-term employment after doctorate | 846 | 0.29 |
| 5. Collaborator | Non-directional, work together influenced each other’s thinking | 1,077 | 0.17 |
| Research area | Size | Persistence (Spearman) | Persistence (Pearson) | Inequality |
|---|---|---|---|---|
| 1. Anthropology | 2,686 | 0.32 | 0.33 | 0.79 |
| 2. Bioengineering | 3,366 | 0.25 | 0.22 | 0.73 |
| 3. Cell Biology | 10,104 | 0.24 | 0.21 | 0.71 |
| 4. Chemistry | 50,892 | 0.30 | 0.27 | 0.74 |
| 5. Computer Science | 11,864 | 0.32 | 0.31 | 0.75 |
| 6. Economics | 6,795 | 0.28 | 0.27 | 0.75 |
| 7. Education | 9,758 | 0.31 | 0.32 | 0.79 |
| 8. Environmental Engineering | 2,798 | 0.33 | 0.31 | 0.71 |
| 9. Epidemiology | 3,437 | 0.38 | 0.35 | 0.74 |
| 10. Engineering | 28,396 | 0.29 | 0.28 | 0.75 |
| 11. Evolutionary Biology | 5,120 | 0.32 | 0.28 | 0.71 |
| 12. Linguistics | 3,232 | 0.38 | 0.37 | 0.78 |
| 13. Mathematics | 13,359 | 0.35 | 0.34 | 0.78 |
| 14. Microbiology | 9,644 | 0.23 | 0.21 | 0.70 |
| 15. Neuroscience | 49,028 | 0.34 | 0.32 | 0.73 |
| 16. Nursing | 3,509 | 0.30 | 0.29 | 0.74 |
| 17. Philosophy | 2,628 | 0.42 | 0.41 | 0.82 |
| 18. Public Health | 5,483 | 0.30 | 0.28 | 0.75 |
| 19. Physics | 19,761 | 0.31 | 0.29 | 0.75 |
| 20. Political Science | 3,815 | 0.32 | 0.33 | 0.76 |
| 21. Experimental Psychology | 3,891 | 0.29 | 0.25 | 0.70 |
| 22. Sociology | 6,319 | 0.31 | 0.31 | 0.74 |