The dynamical lineage of field ultra-diffuse galaxies
Abstract
Ultra-diffuse galaxies (UDGs) exhibit morphological similarities with other low luminosity galaxies indicating a possible evolutionary connection. We investigate for a common dynamical origin of field UDGs with other low luminosity field galaxies, namely the low surface brightness galaxies (LSBs) and the dwarf irregulars (dIrrs). Obtaining the scaling relations between (i) central stellar surface density and exponential stellar disk scale length, (ii) stellar and atomic hydrogen mass, and (iii) stellar and dynamical mass for LSBs and dIrrs respectively, and superposing the data for UDGs on them, we note that UDGs evolve fairly akin to dIrrs. We next construct distribution function-based stellar-dynamical models of these galaxies. Comparison of the modelled radial-to-vertical velocity dispersion ratio, and the rotational velocity-to-total stellar velocity dispersion ratio also indicate that the stellar kinematics of UDGs and dIrrs are similar. Finally, we conducted a principal component analysis to identify the key parameters accounting for the variance in the structure and kinematical data for the respective galaxy populations. We observe that the total HI-mass mostly regulates the variance for the UDGs and dIrrs, while the ratio of radial-to-vertical velocity dispersion dominates the same in LSBs. We therefore conclude that field UDGs and dIrrs possibly share a common dynamical lineage.
1 Introduction
With the advancement of observational facilities, an increasingly large number of faint galaxies have been discovered of late. These low luminosity galaxies constitute a significant fraction of the galaxy population in the nearby universe (van Dokkum et al. 2015; Yagi et al. 2016; Román & Trujillo 2017; Shi et al. 2017; Prole et al. 2019; Ikeda et al. 2023). In general, they are gas-rich and dark matter dominated, and hence constitute ideal test-beds for galaxy formation and evolution models (Sandage & Binggeli 1984; Impey et al. 1988; Bothun et al. 1997). Ultra diffuse galaxies (UDGs) are characterized by very low central surface brightness, and relatively large stellar disk scale lengths given their masses in the dwarf galaxy regime ( 106-9 ). The term ultra-diffuse galaxy “UDG” was coined by van Dokkum et al. (2015), who defined these as galaxies with central band surface brightness 24 mag arcsec-2 and effective radii kpc. Further, UDGs can be found in a range of environments from clusters, groups to fields, and their structure and kinematics seem to vary significantly with their environment.
Several observational studies have identified morphological and kinematical similarities between UDGs and other low luminosity galaxies, thus hinting at possible evolutionary links among them. Venhola et al. (2017) found that dwarf LSBs and UDGs in the Fornax cluster share similar structural properties, which perhaps indicates a common genesis of these galaxy populations. While studying the kinematic properties of two field dwarf irregular galaxies (dIrrs), Bellazzini et al. (2017) concluded that dIrrs and UDGs lie close to each other in the magnitude-effective radius space, among others. Based on their size and absolute magnitude distribution, Conselice (2018) concluded that UDGs and dwarf elliptical galaxies (dEs) in clusters are essentially the same objects. A similar proposition was made by Chilingarian et al. (2019) who found that the UDGs lie in between dEs/dwarf lenticular galaxies (dS0s) and dwarf spheroidal galaxies (dSphs), both with respect to the Faber-Jackson relation as well as the mass-metallicity relation. This may suggest that UDGs constitute an intermediate evolutionary state between dE0/dS0 and dSphs. In the recent past, by studying the stellar kinematics of KDG64, a large dSph galaxy in the M81 group, Afanasiev et al. (2023) concluded that it is possibly in a transitional stage between a dSph and a UDG. Despite empirical evidence hinting at evolutionary connection between UDGs and other low luminosity galaxies, to our knowledge, a systematic dynamical study has not been done so far to investigate a possibly common dynamical origin of these galaxies. Moreover, the UDGs in our study are field UDGs: incidentally, field UDGs were not considered in the literature so far for studying the possible evolutionary link with other low luminosity galaxies.
Our primary aim in this paper is to investigate the dynamical lineage of UDGs and other low luminosity samples, namely low surface brightness galaxies (LSBs) and dwarf irregulars (dIrrs), and look for a common dynamical origin, if any. Though LSBs have significantly higher dynamical mass, field UDGs are commonly considered as LSBs with lower mass but larger extents (for example Martin et al. 2019; Prole et al. 2021; Brook et al. 2021; Zhou et al. 2022). We first check for viable correlations between different pairs of structural and kinematic parameters for each of the above galaxy populations, and in case of a correlation, note if the different samples obey the same scaling relation. We then construct the distribution function-based dynamical models of some of the galaxies in the three respective populations, employing the publicly-available stellar dynamical code Action-based Galaxy Modeling Architecture (AGAMA) (Vasiliev, 2019). Finally, for each galaxy population, we do a Principal Component Analysis (PCA) of the dynamical parameters obtained from mostly their dynamical models and identify the dominant physical mechanisms regulating the dynamics of each population, and whether these are same or different for the different galaxy samples (For reference Bro & Smilde 2014).
The paper is organized as follows: In §2, we introduce galaxy scaling relations, and in §3, the dynamical modelling technique. In §4, 5 and 6, we present our galaxy samples, the source of input parameters and our methodologies including creation of mock galaxy samples and Principal Component Analysis. We present results and discussion in §7, and finally the conclusions in §8.
2 Galaxy Scaling Relations
According to the current paradigm of galaxy formation, galactic disks are formed at the centers of slowly rotating dark matter halos due to cooling and condensation of gas followed by star formation and feedback. Theoretical models of galaxy formation are constrained by the remarkable regularities exhibited by the observed scaling relations between different pairs of structural and kinematic properties of a galaxy population: the Tully-Fisher relation, the Faber-Jackson relation, the Fall relation, and the Kennicutt-Schmidt relation are some of the well-known scaling relations observed in galaxies (see for example da Costa & Renzini 1997). However, the details of the scaling relations may tend to vary with galaxies of different morphological types, possibly indicating their different evolutionary routes (Roychowdhury et al. 2009; Wyder et al. 2009; Jadhav Y & Banerjee 2019; Narayanan & Banerjee 2022 and the references therein). Compliance of UDGs with the scaling relations obeyed by ordinary disk galaxies has been checked earlier in the literature (for example Poulain et al. 2022; Benavides et al. 2023; For et al. 2023; Hu et al. 2023 and the references therein). In this work, we look for feasible scaling relations between a few other pairs of dynamical parameters for the LSB and the dIrr samples, and check if the distribution of the sample UDGs is resemblant of the LSB or the dIrr population.
3 Dynamical model
We employed the publicly-available stellar dynamical code Action-based Galaxy Modelling Architecture (AGAMA) to construct distribution function-based dynamical models for our sample galaxies. (Vasiliev, 2019). Our galaxy model consists of a self-gravitating stellar disk, characterized by a distribution DF, in the additional external potentials of the gas disk and the dark matter halo. According to the strong Jeans’ Theorem, the DF can be expressed as a function of the actions that depend on the total potential of the system, and being the position and velocity of the stellar disk particles.
In this work, we have considered the stellar component of the galaxy to have a quasi-isothermal distribution function (DF) which is expressed as follows :
| (1) |
Here and represent the epicyclic frequencies in the radial and vertical directions respectively, while and are the velocity dispersions in the corresponding directions. , and respectively correspond to the , and components of action of the stellar disk. The total action is given by and can be represented as . Here is associated with the density of the stellar (), gas () and dark matter () component via the Poisson equation as :
| (2) |
We assume that the stellar and gas components have disk-like density profiles with sérsic index equal to 1. The dark matter component, on the other hand, is considered to have a spheroidal density distribution. In AGAMA framework, the density profile of a disk distribution is given by :
| (3) |
where and denote the central surface brightness and disk scale length respectively. is the vertical disk scale height, and an inner cut-off radius that modifies the inner density distribution of the disk. For our galaxies, values are found to be zero. The density profile corresponding to the spheroidal profile is given by :
| (4) |
In this expression, and denote the dark matter core density and core radius. , and are the parameters to control the steepness between the inner and outer power-law slopes, the power-law index of the outer profile and the inner profile of the dark matter distribution respectively. By setting their values, we can recover various popular dark matter profiles; for example for , and gives the pseudo-isothermal density distribution. represents the length scale for truncation in the outer disk while characterizes the steepness of the exponential cut-off. Here we set and . The dark matter halos for the LSBs and dIrrs in our study are assumed to have a pseudo-isothermal density distribution. For UDGs, we used the values for these parameters already presented in Table 2 of Kong et al. (2022) (See §5). Theoretically, the density, the mean velocity and the mean velocity dispersion of the stellar disk can be determined from the moments of the distribution function as given below:
| (5) | |||||
| (6) | |||||
| (7) | |||||
| (8) |
In this problem, the DF and the density profile of the stellar disk have been parameterized, whereas the gas disk and the dark matter halo have a fixed profile. The problem essentially reduces to determining a suitable set of parameters for the DF and the density profile consistent with Equations 1, 2, 5 and 8. The calculation scheme is as follows. We start with a set of trial values for the above parameters. At first, the epicyclic frequencies ( and ), and the three components of the action (, and ) are calculated from the combined potential of the stellar, gas and dark matter of the galaxy. Using the above values, and the trial values of the stellar dispersions, we then calculate the distribution function using Equation 1. Next, we compare the density calculated from the zero-th moment of the above distribution function (Equation 5) and try to match with the original profile (Equation 3) by tweaking the values of its parameters. Further, we calculate the stellar dispersion values using Equations 6 and 8 as mentioned earlier. We repeat the above set of steps a few times until a convergence is achieved. We emphasize, that in this problem, the gas density and the dark matter density are fixed, whereas the stellar density is determined iteratively.
| Galaxy | Stellar | Exponential | Stellar | HI surface | Exponential | HI scale | DM core | DM core |
|---|---|---|---|---|---|---|---|---|
| Names | surface | stellar scale | scale height | density | HI-disk scale | height | density | radius |
| density () | radius () | () | () | radius () | () | () | () | |
| kpc | kpc | kpc | kpc | 106 | kpc | |||
| UDGs | ||||||||
| AGC114905 | 9.92 | 1.79 | 0.29 | 4.77 | 11.4 | 2.85 | 1.77 | 4.15 |
| AGC122966 | 0.49 | 4.15 | 0.69 | 4.2 | 11.2 | 2.8 | 21.87 | 1.34 |
| AGC219533 | 3.16 | 2.35 | 0.39 | 6.04 | 14.2 | 3.55 | 19.48 | 1.61 |
| AGC242019 | 2.01 | 5.41 | 0.9 | 3.41 | 10.4 | 2.6 | 2.75 | 5.24 |
| AGC248945 | 12.18 | 2.08 | 0.35 | 5.81 | 7.6 | 1.9 | 7.07 | 1.94 |
| AGC334315 | 0.96 | 3.76 | 0.63 | 6.62 | 14.4 | 3.6 | 4.26 | 3.01 |
| AGC749290 | 5.87 | 2.38 | 0.39 | 5.86 | 9.7 | 2.43 | 4.78 | 2.52 |
| LSBs | ||||||||
| F563-1 | 20.94 | 3.24 | 0.54 | 5.29 | 11.74 | 2.94 | 79 | 1.72 |
| F563-V2 | 85.71 | 1.56 | 0.26 | 7.96 | 9.56 | 2.39 | 96.6 | 1.7 |
| F568-3 | 34.75 | 3.03 | 0.51 | 4.97 | 12.2 | 3.05 | 25.7 | 3.07 |
| F568-V1 | 28.38 | 2.38 | 0.39 | 4.18 | 14.34 | 3.58 | 146.1 | 1.41 |
| F574-1 | 28.12 | 3.49 | 0.58 | 3.15 | 14.88 | 3.72 | 63.1 | 1.74 |
| F579-V1 | 43.75 | 3.1 | 0.52 | 3.91 | 12.27 | 3.06 | 694.4 | 0.55 |
| F583-4 | 18.58 | 2.02 | 0.34 | 2.16 | 5.96 | 1.48 | 80.6 | 1.02 |
| dIrrs | ||||||||
| CVnIdwA | 0.79 | 0.83 | 0.14 | 14.5 | 0.5 | 0.13 | 8.19 | 2.01 |
| DDO 52 | 6.26 | 1.33 | 0.22 | 7.27 | 4.28 | 1.07 | 48.81 | 1.33 |
| DDO70 | 8.58 | 0.48 | 0.08 | 9.39 | 0.96 | 0.24 | 119.95 | 0.51 |
| DDO101 | 16.61 | 0.87 | 0.15 | 3.44 | 2.85 | 0.71 | 849.14 | 0.32 |
| DDO216 | 6.48 | 0.59 | 0.09 | 2.45 | 0.94 | 0.24 | 127.02 | 0.15 |
| NGC2366 | 7.77 | 1.29 | 0.22 | 17.92 | 4.11 | 1.02 | 43.89 | 1.21 |
| NGC3738 | 69.88 | 0.6 | 0.1 | 36.25 | 1.03 | 0.26 | 2132.36 | 0.45 |
4 Sample of galaxies
For constructing each scaling relation, we consider suitable samples from the set of 19 LSBs from de Blok et al. (1996) and de Blok et al. (2001), 26 dIrrs from the LITTLE THINGS survey (Oh et al., 2015) as per the availability of required data, and all the 7 UDGs from Mancera Piña et al. (2020) and Kong et al. (2022). Our original sample for constructing dynamical models and carrying out PCA consists of 7 LSBs from de Blok et al. (1996), 7 dIrrs from Oh et al. (2015) chosen based on the quality of available data, and again all the 7 UDGs from Mancera Piña et al. (2020), Shi (2021), Kong et al. (2022). However, since the number of galaxies is not large enough to carry out a PCA, we create mock galaxies corresponding to each galaxy in our respective samples, using the Monte Carlo (MC) method (see, for example, . Considering the distribution of values of the different input parameters, 300 mock galaxies are generated from each original galaxy in a sample. Thus we have an enlarged sample of 2,100 galaxies for each of the UDG, LSB and dIrr population. We construct dynamical models and carry out PCA using this enlarged sample. The original galaxy samples corresponding to different populations used for dynamical modeling and PCA are listed in Table 1. For constructing each scaling relation, we consider suitable samples from the set of 19 LSBs from de Blok et al. (1996) and de Blok et al. (2001), 26 dIrrs from the LITTLE THINGS survey (Oh et al., 2015) as per the availability of required data, and all the 7 UDGs from Mancera Piña et al. (2020) and Kong et al. (2022). Our original sample for constructing dynamical models and carrying out PCA consists of 7 LSBs from de Blok et al. (1996), 7 dIrrs from Oh et al. (2015) chosen based on the quality of available data, and again all the 7 UDGs from Mancera Piña et al. (2020), Shi (2021), Kong et al. (2022). However, since the number of galaxies is not large enough to carry out a PCA, we create mock galaxies corresponding to each galaxy in our respective samples, using the Monte Carlo (MC) method. Considering the distribution of values of the different input parameters, 300 mock galaxies are generated from each original galaxy in a sample. Thus we have an enlarged sample of 2,100 galaxies for each of the UDG, LSB and dIrr population. We construct dynamical models and carry out PCA using this enlarged sample. The original galaxy samples corresponding to different populations used for dynamical modeling and PCA are listed in Table 1.
5 Input parameters
We construct the dynamical models of the original and mock galaxies constrained by the observations. In the AGAMA framework, the following input parameters are required for generating the net potential of the stars, gas and the dark matter halo : (1) for dark matter component: core density () and core radius () (2) for the stellar component: central surface density (), exponential scale radius () & scale height (), (3) for the gas component: central surface density (), exponential scale radius () & scale height (). The aforementioned parameters are listed for all galaxies in our sample in Table 1. We used = relation to calculate the stellar surface density of the galaxies, assuming their stellar disk component to be exponential in nature (Freeman, 1970). Besides, and are chosen as one-sixth and one-fourth of the stellar () (van der Kruit & Searle, 1981) and gas scale radius () respectively. We may note that changing the value of does not change our results. Further, to create the distribution function for the stellar disk, the following input parameters are given : central surface density (), exponential scale radius (), stellar radial () and vertical () velocity dispersion. An indicative value is used for in the distribution function as (Mancera Piña et al., 2020), while was considered to be as suggest by Dehnen & Binney (1998).
6 Methodology
6.1 Creation of mock galaxies
The process of generating mock galaxies is as follows. We choose one original galaxy of our sample and consider each of the eight input parameters {, , , } of the galaxy mentioned in §5 have a Gaussian distribution. We create a Gaussian distribution of each whose mean is equal to the value corresponding to the original galaxy (), and standard deviation equal to the error. From the multi-Gaussian distribution of {, , , }, we randomly choose eight parameters {, , , } by implementing the MC simulation. We employ {, , , } in AGAMA to create the distribution function for the stellar component and the net potential produced by the stellar, gas and dark matter of the mock galaxy. We use the python module NUMPY for the mock galaxy creation.
6.2 Principal Component Analysis
Principal component analysis (PCA) is used to understand the relative importance of the dynamical parameters to explain the variance in data (for reference Bro & Smilde 2014). In PCA, the covariance matrix in the chosen parameter space is solved whose th diagonal element () describes the covariance in the th parameter with itself i.e. the variance and th component () gives the covariance between and , their expressions being :
| (9) | |||||
| (10) |
In their expressions, each barred quantity denote mean value of the corresponding parameter and is the number of samples taken into account.
The eigenvectors of this matrix are the principal components while their eigenvalues indicate the relative importance of the principal components. In principle, the data will cluster around the principal component with highest eigenvalue in the principal component space, followed by the principal component with second largest eigenvalue. Thus if we project the data from original space to the principal component space, we see variation in the data is mainly explained by the first two principal components hence leading to dimensionality reduction.
Moreover, the principal components can be considered represented as linear combinations of the original parameters, their coefficients called loadings. Parameter corresponding to the largest loading primarily describes variance in the data.
To obtain the PCA loading values we maintain the following steps every time : (1) we perform PCA analysis, (2) take vector-sum of the first two principal components and normalize the loadings with the highest loading, (3) identify the parameter which has largest loading and normalize other loadings with that, (4) eliminate the parameter with insignificant loading and repeat. Following these steps, we perform PCA for UDGs, LSBs and dIrrs separately. For all rounds, we see the first two principal components explain nearly 80-90% variance in the data. We note that the parameters with significantly large loadings consistently show the nearly similar trend, while the possibly insignificant parameters continue to become weaker. Finally, we end up with the final list of parameters to study the dynamics of our samples. We have employed sklearn module in python to perform the principal component analysis (Pedregosa et al., 2011)
7 Results & Discussion
We present the results in three parts. In the first part, we look for preliminary correlations between the the basic variables. In the second part, we compare the stellar kinematics obtained from the dynamical models. Finally, we identify the crucial dynamical parameters from the PCA analysis for each of our galaxy populations.
7.1 Possible galaxy scaling relations
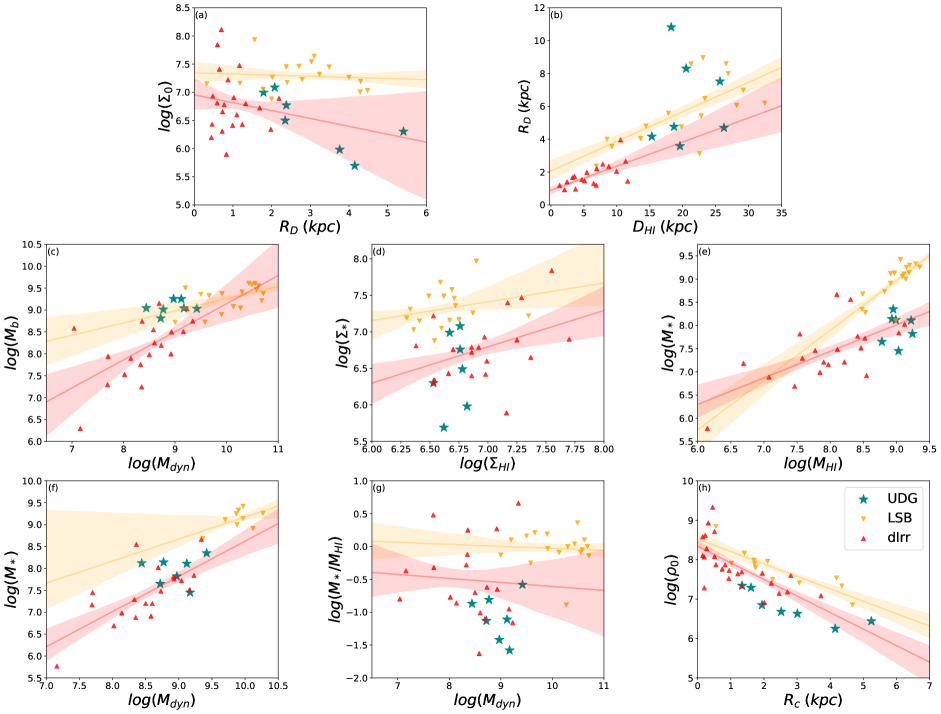
In Figure 1, we compare the results of statistical analysis of the primary properties of UDGs, LSBs and dIrrs.
UDGs are generally defined by their very low values of central surface brightness with relatively large effective radii (van Dokkum et al., 2015). In panel () of row, we compare the central stellar surface density () and exponential scale radius of our sample the UDGs with LSBs and dIrrs. We obtain the regression line fits with the 68% ( 1) confidence interval for our sample LSBs and dIrrs separately, and superpose the data for our UDGs on the same.
We observe that the UDGs mostly comply with the size-surface brightness relation of the dIrrs. Interestingly, however, the dIrrs have smaller disk size ( 0.5 - 2.2 kpc) whereas the UDGs have relatively large stellar disks ( 1.8 - 5.5 kpc). LSBs, on the other hand, seem to encompass the whole range of values.
One may note that the conventional definitions of neither of the LSBs nor the dIrrs are based on their and values taken together. While the definition of LSBs is related to their surface brightness values, dIrrs are defined on the basis of their total dynamical mass. The adopted definitions, however, may play a crucial role in the physical understanding of the formation mechanism of UDGs (Van Nest et al., 2022).
In panel () of the same row, we present the HI-diameters () versus exponential scale radii () for our sample UDGs, LSBs and dIrrs. We again indicated the separate regression fits for LSBs and dIrrs with their 68% confidence intervals and superposed the UDG data on the same, as done in panel (). It is well known that similar to dIrrs and LSBs, field UDGs have remarkably high HI-masses for their stellar content (Trujillo et al. 2017; Mancera Piña et al. 2020). For normal spiral galaxies, the ratio of the HI-to-optical diameter is nearly 2 (Broeils & Rhee, 1997), yet there are several galaxies which have unusually extended HI-disks (Begum et al. 2005; Wang et al. 2016, add gentile paper). The extended HI disk can be attributed to gas accretion or merger, though the origin of such large gas disks is still debatable (Noordermeer et al., 2005).
The HI-mass () and diameter () of a galaxy has been found to follow a strong correlation : log = 0.51log - 3.29 (Broeils & Rhee, 1997). Using this relation, we obtained the .
We note that as far as the - scaling relation is concerned, UDGs do not seem to comply with either the LSB or the dIrr populations.
The extraordinary low surface brightness of UDGs can be attributed to inefficient star formation in these galaxies (McGaugh & de Blok 1997a; Impey & Bothun 1997). Hence we investigate their dynamical parameters which may offer useful insight into the star formation of these galaxy populations and the results are presented in the row of Figure 1.
In panel (), we present the respective regression fit with the 1-confidence intervals between baryonic () and dynamical () mass for LSBs and dIrrs. We compare the dynamical masses enclosed inside the stellar scale radius as and the baryonic mass being . Interestingly, in contrast to panel (), UDGs clearly obey the regression fit for the LSBs. UDGs and dIrrs have nearly similar order of dynamical masses in the range 7 - 9.5 (in log scale) with the UDGs falling at the higher end. Comparatively, LSBs have much higher order of dynamical masses in the range 9 - 11 (in the log scale). Yet in terms of the baryonic mass, UDGs share a similar range with LSBs ( - ). Hence UDGs appear to be just LSBs with a smaller dynamical mass.
The star formation surface density correlates tightly with the gas surface density - an empirical law by Kennicutt (1989). The star formation rate surface density () can be equivalently considered as the time derivative of stellar mass surface density (), which, in turn, correlates with the stellar surface density . As shown by Westfall et al. (2014), the stellar surface density strongly correlates with . Hence on panel () of Figure 1, we plot the correlation between stellar () versus HI surface density ().
We note that UDGs are not quite in compliance with either of the LSB or dIrr populations. We further observe that does not determine the star formation rate uniquely for our sample of UDGs.
Furthermore, by the definition of gas depletion time (), the slope of the regression fit can give an approximate measure of the inverse of gas depletion time of the galaxy. As discussed by van Zee (2001), this suggests that the dIrrs and UDGs form stars at a lower rate compared to LSBs which can be a possible explanation of relatively their low surface brightness.
In panel (), we present the correlation between the stellar mass () and the HI-mass () of LSBs and dIrrs and observe that the UDGs obey the dIrr regression fit. Since star formation rate increases with increasing stellar mass, UDGs and dIrrs will have relatively smaller star formation rate than the LSBs with lower HI-depletion time (Figure 8 of Zhou et al. 2018).
Since dwarf galaxies are dark matter dominated at all radii, dark matter plays an important role in their dynamics and can be crucial to explain their low luminosity (Battaglia & Nipoti, 2022). Finally, in the row of Figure 1, we discuss the correlations between dynamical parameters that may explain the role of dark matter in regulating their evolution.
In panel (), we present the correlation between stellar mass () and dynamical mass () for our galaxy samples. Most of the UDGs in our sample seem to comply with the regression fit for the dIrrs. Further, they share similar stellar and dynamical mass ranges, with the UDGs having slightly values.
In a way and scaling relation indicates the star formation rate as a function of the dark matter mass of a galaxy. Hence, the difference in their correlation may imply the difference in the way the dark matter regulates the star formation rate.
In panel () we plot the ratio of stellar-to-HI mass () as a function of the total dynamical mass () for LSBs and dIrrs with the data points for the UDGs overlaid on the same. can be considered as a proxy for the star formation efficiency. Hence the variation of with the dynamical mass may indicate the effect of dark matter in the galaxies in governing star formation efficiency.
We note that for a given dynamical mass, UDGs show much lower value of star formation efficiency as compared to LSBs and dIrrs (see for example Wyder et al. 2009).
At last, on panel (), we show the correlation between dark matter core density () and core radius () which is routinely used to study the dark matter dominance in galaxies (de Blok et al. 2001; Banerjee & Bapat 2017).
For a given value, LSBs have a more cuspy halo, while UDGs are more cored, dIrrs being an intermediate population. UDGs do not obey any of their regression fits.
Thus, in most of the correlation plots, we see UDGs follow the regression fits for dIrrs more closely than the LSBs. The clearest trends are observed in log vs (panel ()), log vs log (panel ()) and vs (panel ()). Yet we find a non-negligible similarity between UDGs and LSBs as given their regression fit in panel (). Hence it is difficult to infer similarities or dissimilarities between our galaxy samples based only on their correlation plots.
7.2 Stellar kinematics from dynamical modeling using AGAMA
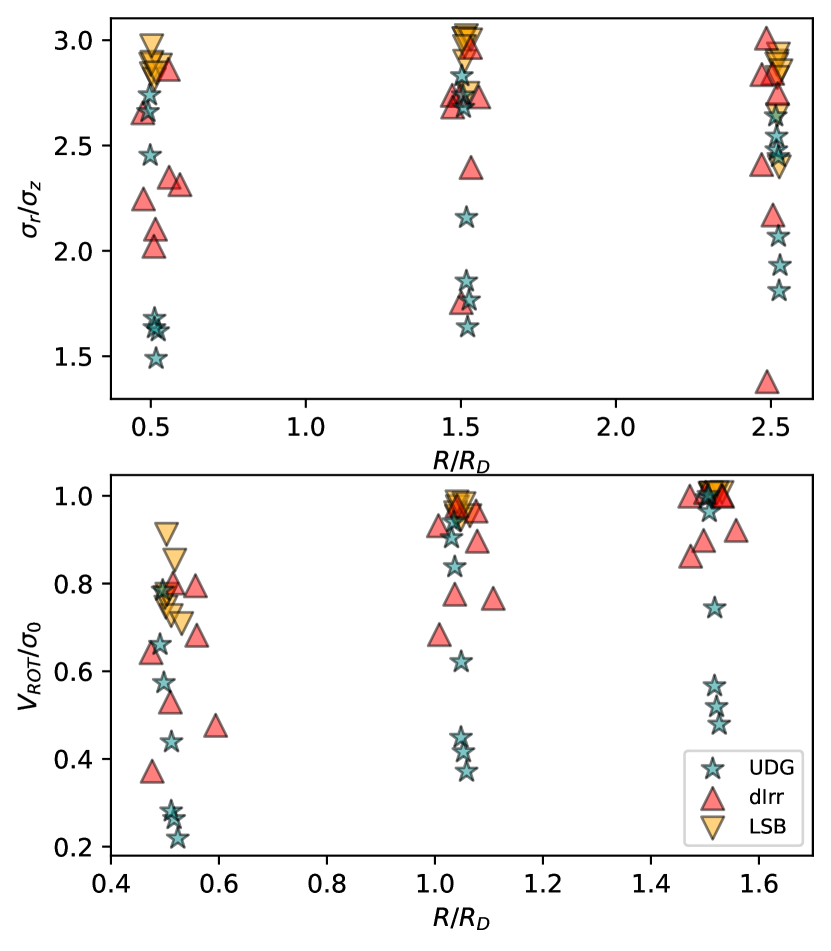
Stellar kinematics constitute a primary diagnostic tracer of the dynamical and secular evolution of a galaxy (Pinna et al., 2018). We construct dynamical models of our galaxies using AGAMA and obtain their radial-to-vertical stellar velocity dispersion ratios (). While is mostly regulated by radial heating due to disk non-axisymmetric features like bars and spiral arms, is governed by isotropic heating due the giant molecular clouds (Pinna et al. 2018 and the citations therein). Hence may indicate the dominance of radial versus vertical heating mechanisms. In the panel of Figure 2, we plot at a few galacto-centric radii normalized by their exponential stellar disk scale length , for our sample of LSBs, UDGs and dIrrs. According to Shapiro et al. (2003), -type galaxies have 0.5 (i.e., 2), while -type galaxies have . We note that at almost all radii, the values of the UDGs range between 1.5 - 3, and the corresponding values for the dIrrs seem to mostly overlap with them. However, the average for the LSB population is higher, lying between 2.5 - 3 consistently at all radii, and is therefore starkly different from those of the UDGs and the dIrrs. The larger anisotropy in the stellar velocity dispersion values in LSBs implies possible radial heating due to non-axisymmetric instabilities like bars and spiral arms. Interestingly, due to their higher gas surface density values as compared to UDGs and dIrrs, LSBs are more unstable to the growth of non-axisymmetric instabilities (Jog 1996, 2012). Therefore, as far as the shape of the stellar velocity ellipsoid is concerned, LSBs are representative of the late-type population, whereas dIrrs and UDGs do not exhibit any definitive trait.
In the panel of Figure 2, we present the ratio of the rotational velocity-to-the-total stellar velocity dispersion () at , and . is a measure of the angular momentum-to-random motion support against gravitational collapse in a galaxy (Toloba et al. 2009; Fraser-McKelvie & Cortese 2022). Falcón-Barroso et al. (2019) found that elliptical galaxies have relatively lower values of which increases as we move from left to right in the Hubble sequence. Low and high values of indicate slow and fast rotators respectively. We note that at the inner radii, for the LSBs lie between 0.7 and 1, while at the intermediate and the outer radii, the value is close to 1, indicating that LSBs are fast rotators. This is in line with their late-type kinematics found above. For the dIrrs and the UDGs, the average value of lies around 0.5 at the inner radii. At the intermediate and outer radii, the average for the dIrrs are 0.8 and 0.9 respectively, though with a large variance. For the UDGs, the corresponding both the values are about 0.6, again with a fairly large scatter. Therefore, we can say that on an average, dIrrs are fast rotators while UDGs are slow rotators, with dIrrs constituting a transition population between LSBs and UDGs. However, due to the scatter, dIrrs and UDGs may often have similar values. Therefore, we conclude that UDGs are similar to dIrrs, but quite different from LSBs as far as kinematics is concerned. As it is believed that slow and fast rotators may possibly have distinct formation mechanism (for example dwarf elliptical, see , Toloba et al. (2009) for details), the overlap of values between UDGs and dIrrs may indicate a nearly similar origin different from the LSBs.
7.3 The key dynamical parameters of our galaxy samples: Principal Component Analysis
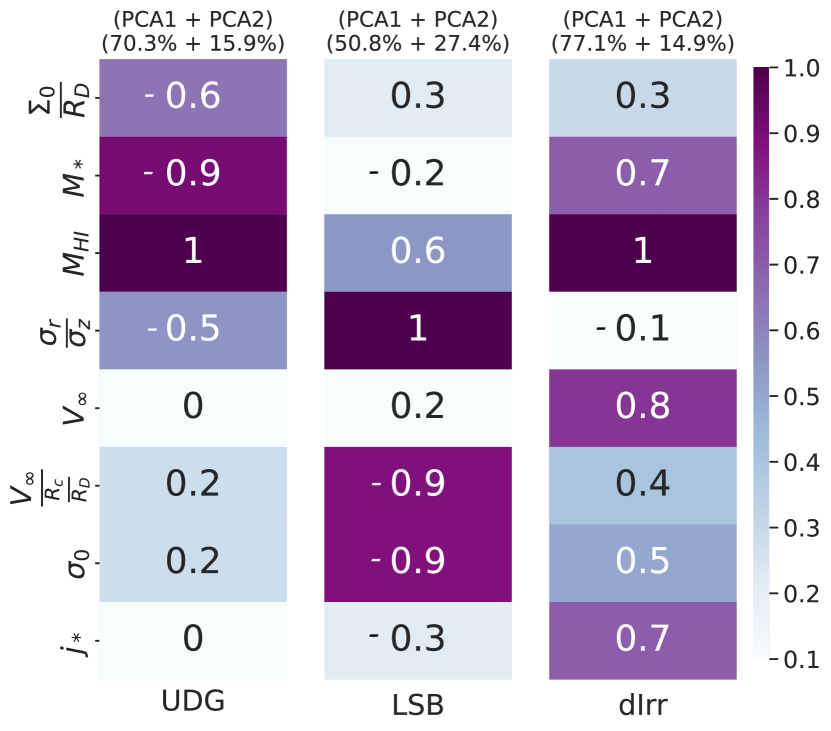
Finally, we present the results obtained from the PCA of a set of dynamical parameters for each of our galaxy samples, possibly driving their disk dynamics in Figure 3. Through trial and error, we choose the following set of dynamical parameters for our galaxy samples (for details §6.2).
-
•
() : By definition UDGs have very low central surface brightness with relatively large effective radii, compared to other low surface brightness galaxies (van Dokkum et al., 2015). Thus we may consider the ratio of stellar surface density to stellar scale radius as a defining parameter of UDGs.
-
•
() : The stars constitute one of three basic building blocks of a galaxy, the others being the gas and dark matter halo. The stellar mass correlates with the dark matter mass as well as with the star-formation histories thus revealing key information about the formation and evolution of the galaxy (Conroy & Wechsler, 2009).
-
•
() : For a self-gravitating system, correlates with several fundamental galaxy properties thus indicating the stage of the galaxy evolution as suggested by McGaugh & de Blok (1997b). They observed that the correlation between galaxy gas content and the central surface brightness of disk galaxies is the strongest, making a crucial dynamical component especially for low-surface brightness galaxies.
-
•
() : has a tight correlation with the total baryonic mass of a galaxy through baryonic Tully-Fisher relation. Moreover, can be considered as a proxy of the total dynamical mass of a galaxy, and hence can be considered as a dynamical parameter, as understood seen in previous studies (Aditya et al., 2023).
-
•
() : Specific angular momentum is one of the fundamental dynamical parameters of a galaxy that traces the accretion history of the gas disk thus revealing important information about formation and evolution of galaxies. There is a strong correlation between the stellar specific angular momentum and the stellar mass of the galaxies followed by various morphological types observed from different redshifts (Fall 1983; Romanowsky & Fall 2012). We have calculated the specific angular momentum as :
(11) considering an exponential stellar surface density profile and velocity profile to be : ( and being the fitting parameters of the rotation curve).
-
•
() : Rotation-supported self-gravitating disks are unstable against gravitational instabilities and random motion of stars quantified by velocity dispersion of the disk is crucial for their stability, as indicated by the Toomre-Q parameter (Toomre & Rott, 1964). Furthermore, stellar total velocity dispersion shows a correlation with the dark matter halo mass thus implying dark matter dominance in galaxy evolution (Zahid et al., 2018).
-
•
() : Stellar velocity ellipsoid (SVE) constitutes a fingerprint of the disk heating mechanisms of a galaxy. quantifies the flattening of the SVE and can be considered as an indicator of the secular evolution of a galaxy. (van der Kruit & de Grijs, 1999).
-
•
() : In the earlier studies by Aditya et al. (2023), it was observed that can be considered in order to explain dark matter dominance in the central region of the galaxy.
In Figure 3, from left to right, we present the sum of the first two loadings of the PCA corresponding to our UDGs, LSBs and dIrrs, which account for 85%, 78%, and 90% variance in the data respectively. We observe that for both UDGs and dIrrs, total HI mass can explain the maximum variance in the respective data. Curiously, this is in compliance with the findings by Bellazzini et al. (2017) where they reported the discovery of two field dIrrs SdI-1 and SdI-2 which closely follow the properties of UDGs. Though their spectroscopic images reveal remarkable irregular features, their sizes are comparable to UDGs as demonstrated by their -band magnitude-effective radii distribution and hence in further studies they are considered to be isolated UDGs (e.g. Papastergis et al. 2017). For LSBs, on the other hand,, the ratio of radial-to-vertical velocity dispersion mostly explains the variance in the data. The dynamical parameter of importance next in line is the total stellar mass for the UDGs, and the total dynamical mass as indicated by the asymptotic velocity , closely followed by the total stellar mass and the stellar specific angular momentum for the dIrrs. For the LSBs, on the other hand, the other relevant dynamical parameters are the compactness of the mass distribution given by and the total stellar velocity dispersion . Interestingly, one may note here that in a similar study, Aditya et al. (2023) found that was the primary dynamical parameter driving the superthin stellar disks of a class of low surface brightness galaxies known as superthin galaxies. As observed by Mancera Piña et al. (2020), the mass fraction of dark matter in UDGs is relatively low, and therefore it is not surprising that and have emerged as the fundamental dynamical parameters for the UDGs from the PCA analysis. Hence, we may conclude that UDGs and dIrrs share an almost same set of key dynamical parameters regulating their disk dynamics, namely and . However, also appears to be a crucial parameter for the dIrrs but not for UDGs. This is in contradiction to the predictions of Mancera Piña et al. (2020), who argued that UDGs are possibly hosted in high-spin dark matter halo which may regulate their formation scenario.
8 Conclusions
In this work, we study the dynamical lineage of UDGs and look for a possible common origin with other low luminosity galaxies, namely the low surface brightness galaxies (LSBs) and the dwarf irregulars (dIrrs). We consider a sample of galaxies for each of the above galaxy populations and first construct possible scaling relations between pairs of structural and kinematical parameters as obtained from the literature. We plot the separate regression fits for the LSB and dIrr data with the corresponding 68% confidence intervals, and superpose the data points for the UDGs on them. We observe that UDGs mostly follow the scaling relations of the dIrrs, the stellar central surface brightness versus exponential stellar scale radius ( - ), stellar mass versus HI mass (log - log ) and stellar mass versus total dynamical mass (log - log ) fits, in particular. Next, we constructed their dynamical models employing the publicly available stellar dynamical code AGAMA, their mass models constructed from their stellar photometry and HI-21cm radio-synthesis observations being already available in the literature. We find that as far as the stellar velocity anisotropy i.e., the ratio of vertical-to-radial stellar dispersion is concerned, LSBs closely represent the late-type population, whereas the dIrrs and UDGs do not exhibit any particular trend. Further, considering the ratio of the rotational velocity-to-total stellar velocity dispersion, we find the UDGs comply with slow-rotators whereas the LSBs with fast-rotators. The dIrrs, on the other hand, constitute a transition population. Finally, we carry out a Principal Component Analysis of a fixed set of dynamical parameters for each galaxy population which plausibly regulates its disk dynamics. We find that while for the UDGs and the dIrrs the variance in the data is mostly explained by the total HI mass, for the LSBs, the same is accounted for by the radial-to-vertical stellar velocity dispersion ratio. Therefore, considering above, UDGs seem to share a common dynamical lineage with the dIrrs but not with the LSBs.
Acknowledgements
We thank Prime Minister’s Research Fellowship (PMRF ID - 0902007) for funding this project.
References
- Aditya et al. (2023) Aditya, K., Banerjee, A., Kamphuis, P., et al. 2023, MNRAS [\eprint[arXiv]2308.13312]
- Afanasiev et al. (2023) Afanasiev, A. V., Chilingarian, I. V., Grishin, K. A., et al. 2023, MNRAS, 520, 6312
- Banerjee & Bapat (2017) Banerjee, A. & Bapat, D. 2017, MNRAS, 466, 3753
- Battaglia & Nipoti (2022) Battaglia, G. & Nipoti, C. 2022, Nature Astronomy, 6, 659
- Begum et al. (2005) Begum, A., Chengalur, J. N., & Karachentsev, I. D. 2005, A&A, 433, L1
- Bellazzini et al. (2017) Bellazzini, M., Belokurov, V., Magrini, L., et al. 2017, MNRAS, 467, 3751
- Benavides et al. (2023) Benavides, J. A., Sales, L. V., Abadi, M. G., et al. 2023, MNRAS, 522, 1033
- Bothun et al. (1997) Bothun, G., Impey, C., & McGaugh, S. 1997, PASP, 109, 745
- Bro & Smilde (2014) Bro, R. & Smilde, A. K. 2014, Analytical methods, 6, 2812
- Broeils & Rhee (1997) Broeils, A. H. & Rhee, M. H. 1997, A&A, 324, 877
- Brook et al. (2021) Brook, C. B., Di Cintio, A., Macciò, A. V., & Blank, M. 2021, ApJ, 919, L1
- Chilingarian et al. (2019) Chilingarian, I. V., Afanasiev, A. V., Grishin, K. A., Fabricant, D., & Moran, S. 2019, ApJ, 884, 79
- Conroy & Wechsler (2009) Conroy, C. & Wechsler, R. H. 2009, ApJ, 696, 620
- Conselice (2018) Conselice, C. J. 2018, Research Notes of the American Astronomical Society, 2, 43
- da Costa & Renzini (1997) da Costa, L. N. & Renzini, A. 1997, Galaxy scaling relations: origins, evolution and applications. Proceedings.
- de Blok et al. (2001) de Blok, W. J. G., McGaugh, S. S., & Rubin, V. C. 2001, AJ, 122, 2396
- de Blok et al. (1996) de Blok, W. J. G., McGaugh, S. S., & van der Hulst, J. M. 1996, MNRAS, 283, 18
- Dehnen & Binney (1998) Dehnen, W. & Binney, J. 1998, MNRAS, 294, 429
- Falcón-Barroso et al. (2019) Falcón-Barroso, J., van de Ven, G., Lyubenova, M., et al. 2019, A&A, 632, A59
- Fall (1983) Fall, S. M. 1983, in Internal Kinematics and Dynamics of Galaxies, ed. E. Athanassoula, Vol. 100, 391–398
- For et al. (2023) For, B. Q., Spekkens, K., Staveley-Smith, L., et al. 2023, arXiv e-prints, arXiv:2309.11799
- Fraser-McKelvie & Cortese (2022) Fraser-McKelvie, A. & Cortese, L. 2022, ApJ, 937, 117
- Freeman (1970) Freeman, K. C. 1970, ApJ, 160, 811
- Hu et al. (2023) Hu, H.-J., Guo, Q., Zheng, Z., et al. 2023, ApJ, 947, L9
- Ikeda et al. (2023) Ikeda, R., Morishita, T., Tsukui, T., et al. 2023, MNRAS, 523, 6310
- Impey & Bothun (1997) Impey, C. & Bothun, G. 1997, ARA&A, 35, 267
- Impey et al. (1988) Impey, C., Bothun, G., & Malin, D. 1988, ApJ, 330, 634
- Jadhav Y & Banerjee (2019) Jadhav Y, V. & Banerjee, A. 2019, MNRAS, 488, 547
- Jog (1996) Jog, C. J. 1996, MNRAS, 278, 209
- Jog (2012) Jog, C. J. 2012, in Astronomical Society of India Conference Series, Vol. 4, Astronomical Society of India Conference Series, 145
- Kennicutt (1989) Kennicutt, Robert C., J. 1989, ApJ, 344, 685
- Kong et al. (2022) Kong, D., Kaplinghat, M., Yu, H.-B., Fraternali, F., & Mancera Piña, P. E. 2022, ApJ, 936, 166
- Mancera Piña et al. (2020) Mancera Piña, P. E., Fraternali, F., Oman, K. A., et al. 2020, MNRAS, 495, 3636
- Martin et al. (2019) Martin, G., Kaviraj, S., Laigle, C., et al. 2019, MNRAS, 485, 796
- McGaugh & de Blok (1997a) McGaugh, S. & de Blok, E. 1997a, in American Institute of Physics Conference Series, Vol. 393, The Seventh Astrophysical Conference: Star formation, near and far, ed. S. S. Holt & L. G. Mundy, 510–513
- McGaugh & de Blok (1997b) McGaugh, S. S. & de Blok, W. J. G. 1997b, ApJ, 481, 689
- Narayanan & Banerjee (2022) Narayanan, G. & Banerjee, A. 2022, MNRAS, 514, 5126
- Noordermeer et al. (2005) Noordermeer, E., van der Hulst, J. M., Sancisi, R., Swaters, R. A., & van Albada, T. S. 2005, A&A, 442, 137
- Oh et al. (2015) Oh, S.-H., Hunter, D. A., Brinks, E., et al. 2015, AJ, 149, 180
- Papastergis et al. (2017) Papastergis, E., Adams, E. A. K., & Romanowsky, A. J. 2017, A&A, 601, L10
- Pedregosa et al. (2011) Pedregosa, F., Varoquaux, G., Gramfort, A., et al. 2011, Journal of Machine Learning Research, 12, 2825
- Pinna et al. (2018) Pinna, F., Falcón-Barroso, J., Martig, M., et al. 2018, MNRAS, 475, 2697
- Poulain et al. (2022) Poulain, M., Marleau, F. R., Habas, R., et al. 2022, A&A, 659, A14
- Prole et al. (2019) Prole, D. J., van der Burg, R. F. J., Hilker, M., & Davies, J. I. 2019, MNRAS, 488, 2143
- Prole et al. (2021) Prole, D. J., van der Burg, R. F. J., Hilker, M., & Spitler, L. R. 2021, MNRAS, 500, 2049
- Román & Trujillo (2017) Román, J. & Trujillo, I. 2017, MNRAS, 468, 4039
- Romanowsky & Fall (2012) Romanowsky, A. J. & Fall, S. M. 2012, ApJS, 203, 17
- Roychowdhury et al. (2009) Roychowdhury, S., Chengalur, J. N., Begum, A., & Karachentsev, I. D. 2009, MNRAS, 397, 1435
- Sandage & Binggeli (1984) Sandage, A. & Binggeli, B. 1984, ApJ, 89, 919
- Shapiro et al. (2003) Shapiro, K. L., Gerssen, J., & van der Marel, R. P. 2003, AJ, 126, 2707
- Shi et al. (2017) Shi, D. D., Zheng, X. Z., Zhao, H. B., et al. 2017, ApJ, 846, 26
- Shi (2021) Shi, Y. 2021, in American Astronomical Society Meeting Abstracts, Vol. 53, American Astronomical Society Meeting Abstracts, 156.07
- Toloba et al. (2009) Toloba, E., Boselli, A., Gorgas, J., et al. 2009, ApJ, 707, L17
- Toomre & Rott (1964) Toomre, A. & Rott, N. 1964, Journal of Fluid Mechanics, 19, 1
- Trujillo et al. (2017) Trujillo, I., Roman, J., Filho, M., & Sánchez Almeida, J. 2017, ApJ, 836, 191
- van der Kruit & de Grijs (1999) van der Kruit, P. C. & de Grijs, R. 1999, A&A, 352, 129
- van der Kruit & Searle (1981) van der Kruit, P. C. & Searle, L. 1981, A&A, 95, 105
- van Dokkum et al. (2015) van Dokkum, P. G., Abraham, R., Merritt, A., et al. 2015, ApJ, 798, L45
- Van Nest et al. (2022) Van Nest, J. D., Munshi, F., Wright, A. C., et al. 2022, ApJ, 926, 92
- van Zee (2001) van Zee, L. 2001, AJ, 121, 2003
- Vasiliev (2019) Vasiliev, E. 2019, MNRAS, 482, 1525
- Venhola et al. (2017) Venhola, A., Peletier, R., Laurikainen, E., et al. 2017, A&A, 608, A142
- Wang et al. (2016) Wang, J., Koribalski, B. S., Serra, P., et al. 2016, MNRAS, 460, 2143
- Westfall et al. (2014) Westfall, K. B., Andersen, D. R., Bershady, M. A., et al. 2014, ApJ, 785, 43
- Wyder et al. (2009) Wyder, T. K., Martin, D. C., Barlow, T. A., et al. 2009, ApJ, 696, 1834
- Yagi et al. (2016) Yagi, M., Koda, J., Komiyama, Y., & Yamanoi, H. 2016, ApJS, 225, 11
- Zahid et al. (2018) Zahid, H. J., Sohn, J., & Geller, M. J. 2018, ApJ, 859, 96
- Zhou et al. (2022) Zhou, Y.-F., Sengupta, C., Chandola, Y., et al. 2022, MNRAS, 516, 1781
- Zhou et al. (2018) Zhou, Z., Wu, H., Zhou, X., & Ma, J. 2018, PASP, 130, 094101