Demonstration of chronometric leveling using transportable optical clocks beyond laser coherence limit
Abstract
Optical clock network requires the establishment of optical frequency transmission link between multiple optical clocks, utilizing narrow linewidth lasers. Despite achieving link noise levels of 10-20, the final accuracy is limited by the phase noise of the clock laser. Correlation spectroscopy is developed to transmit frequency information between two optical clocks directly, enabling optical clock comparison beyond the phase noise limit of clock lasers, and significantly enhancing the measurement accuracy or shorten the measurement time. In this letter, two compact transportable 40Ca+ clocks are employed to accomplish the correlation spectroscopy comparison, demonstrating an 10 cm level measurement accuracy of chronometric leveling using a mediocre clock laser with linewidth of 200 Hz. The relative frequency instability reaches , which is about 20 times better than the result with Rabi spectroscopy using the same clock laser. This research greatly reduces the harsh requirements on the performance of the clock laser, so that an ordinary stable-laser can also be employed in the construction of optical clock network, which is essential for the field applications, especially for the chronometric leveling.
I Introduction
Optical atomic clocks with fractional systematic uncertainties at the 10-18 level or below[1, 2, 3, 4, 5, 6, 7, 8] are the most precise measurement devices of any kind, driven greatly by the progress in ultrastable lasers[9]. In metrology, a single clock can serve as the absolute frequency standard in principle[10, 11]. However, numerous other applications require two or more optical clocks to establish a network, facilitating the desired observation by comparing frequency difference between each clock[12, 13, 14, 15, 16]. In such comparison-mode scenarios, the frequency difference measurement stability is limited by the laser noise, which restricts the clock probe time and introduces Dick effect noise[17]. Better clock laser system, e.g. locking to cryogenic silicon cavity has been built to extend the clock probe time and increase the duty cycle[18]. However, these kinds of high-performance ultrastable cavities are always bulky, and sensitive to the environment, so the robustness is inadequate to satisfy a wide range of applications such as chronometric leveling in the field, even in harsh environments for global geodetic observation networks[6, 19, 20, 21, 22]. Furthermore, the narrow linewidth laser serves solely as the carrier of the frequency difference information between clock transitions, and not as the key information required in the optical clock comparisons. Consequently, it is possible to achieve clock comparison far beyond the laser coherence time limit by appropriate methods.
To achieve frequency comparison beyond clock laser’s coherent time, it is necessary to measure the evolution of coherence between the optical clocks. One of these methods is to prepare an entangled state of two trapped ions through fiber network, which requires high-fidelity entanglement preparation between remote trapped ion systems[23, 24, 25]. In contrast, correlation spectroscopy is simple and robust for building a global optical clock network as it takes up fewer resources[26, 27]. With this method, coherence between two independent 27Al+ clocks at probe duration as long as 8 s on the clock transition was observed[27]. According to the contrast in the correlation spectrum, an estimated instability of is possible in the ion clocks comparison and thus comparable to the performance of using optical lattice clocks[27].
In this research, we demonstrated the closed-loop operation of clocks based on correlation spectroscopy method and applied it to the chronometric leveling using a clock laser with poor coherence. Using two transportable 40Ca+ optical clocks, a 729 nm clock laser with an intentionally destroyed coherence time of 2.6 ms, corresponding to a linewidth of 200 Hz is employed to achieve 100 ms Ramsey probe durations for the clocks comparison. The chronometric leveling results are consistent with the values obtained by the traditional method of Rabi spectroscopy, and the accuracy is limited to the level of 10 cm due to the systematic uncertainties of both clocks[28, 29], the instability of frequency difference measurement has been significantly improved to , which is about 20 times better than the result obtained with clocks operated at 2 ms Rabi probe time using the same intentionally destroyed clock laser.
II Experiment methods and results
For simplicity, only two sets of single-ion optical clock are involved here. Assuming that the two ions have the same ground state and excited state , a Ramsey-type clock comparison scheme is described as the following three steps: (1) Prepare a quantum superposition state of each ion with a clock pulse; (2) Turn off the clock laser and let the ions distributed in different traps to evolve independently for a preset time of ; (3) Apply the second pulse to the ion and measure the population of each ion in the state. If there is a mismatch between the frequency of the clock laser and the atomic resonant frequency , and , the ion will accumulate a phase during the Ramsey probe duration. Therefore, the interference fringe will be observed, where A is defined as the fringe contrast and is the initial phase associated with laser detuning. When both ions are interrogated simultaneously using the common laser, we can measure the parity instead of the transition probability to realize a correlation spectroscopy. Here is defined as the time-average of the parity operator , where represent the Pauli operator of trapped ion in the i-th trap. The measurement result is the product of the oscillations of the two systems[27]:
| (1) |
where and . If the free evolution time is long enough compared to the laser coherence time, the first term in Eq. (1) will be averaged to zero. The phase decoherence of the laser is averaged due to the common mode effect of the two ion systems, leaving only the independent spontaneous emission parts of the two ion systems. Introducing a decay rate due to spontaneous emission, the correlation measurements will give the following interference fringe:
| (2) |
The frequency difference information of the two ions appears in the interference fringe, and the common mode of the laser phase noise is suppressed. If the feedback control method is adopted to track the maximum slope points of the interference fringe, the following measurement instability can be obtained:
| (3) |
Here, the measurement instability is not limited by the coherence time of the clock laser, but only related to the spontaneous emission rate of the ion’s clock transition.

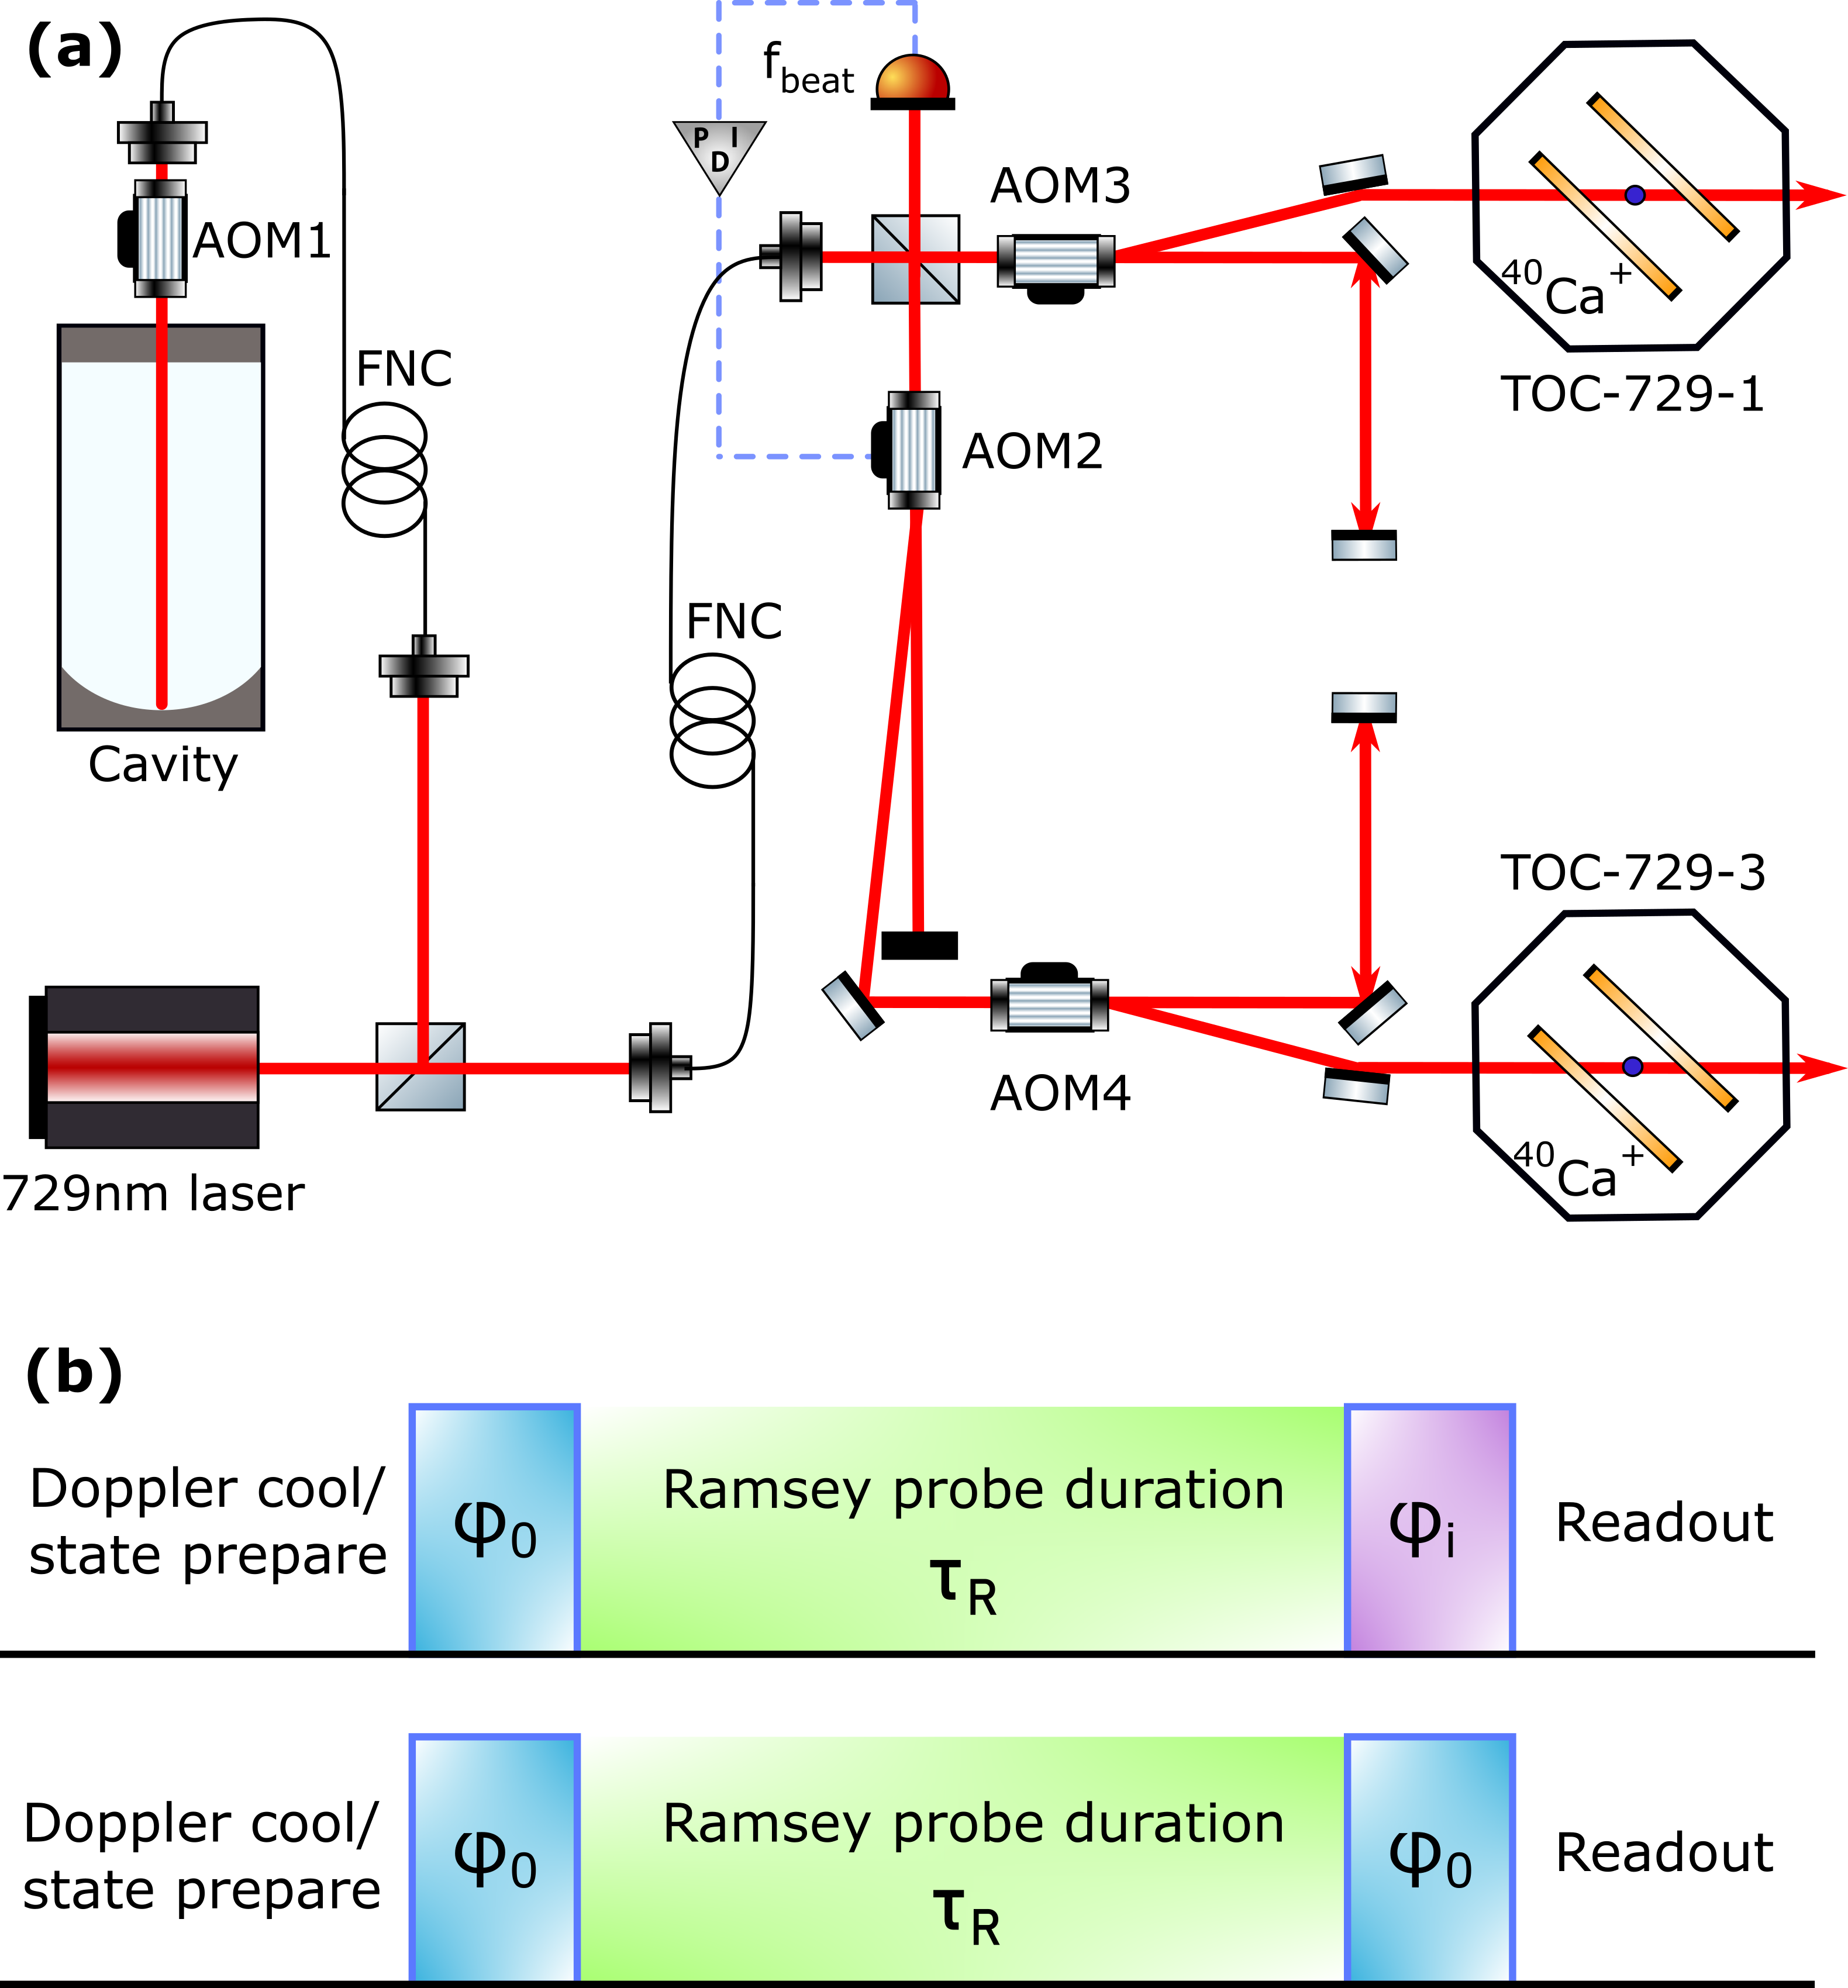
As shown in Fig. 1, our experimental setup consists of two separate transportable optical clocks based on single trapped 40Ca+ ion (labeled as TOC-729-1 and TOC-729-3). The clock transition of 40Ca+ is interrogated by a shared 729 nm laser referenced on a 10 cm ultrastable cavity. Normally, the linewidth of this clock laser is about 1 Hz, and its short-term stability reaches the level of [30]. To simulate a laser with poor coherence in this experiment, white noise modulation is added to the driver of an acousto-optical modulator (AOM 1) in the cavity path. A fiber noise cancellation system is established to synchronize the laser noise between the two trapped-ion systems. The beat signal is obtained from the zero-order optical reflections of AOM 3 and AOM 4, and its frequency noise is directed to the driver of AOM 2 by a servo to keep the coherence of the laser consistent between the two trapped ion systems. To eliminate the spatial laser noise as much as possible, the free space transmission distance of the zero-order optical reflections of each AOM is about the same as the distance from the AOM to the ion.
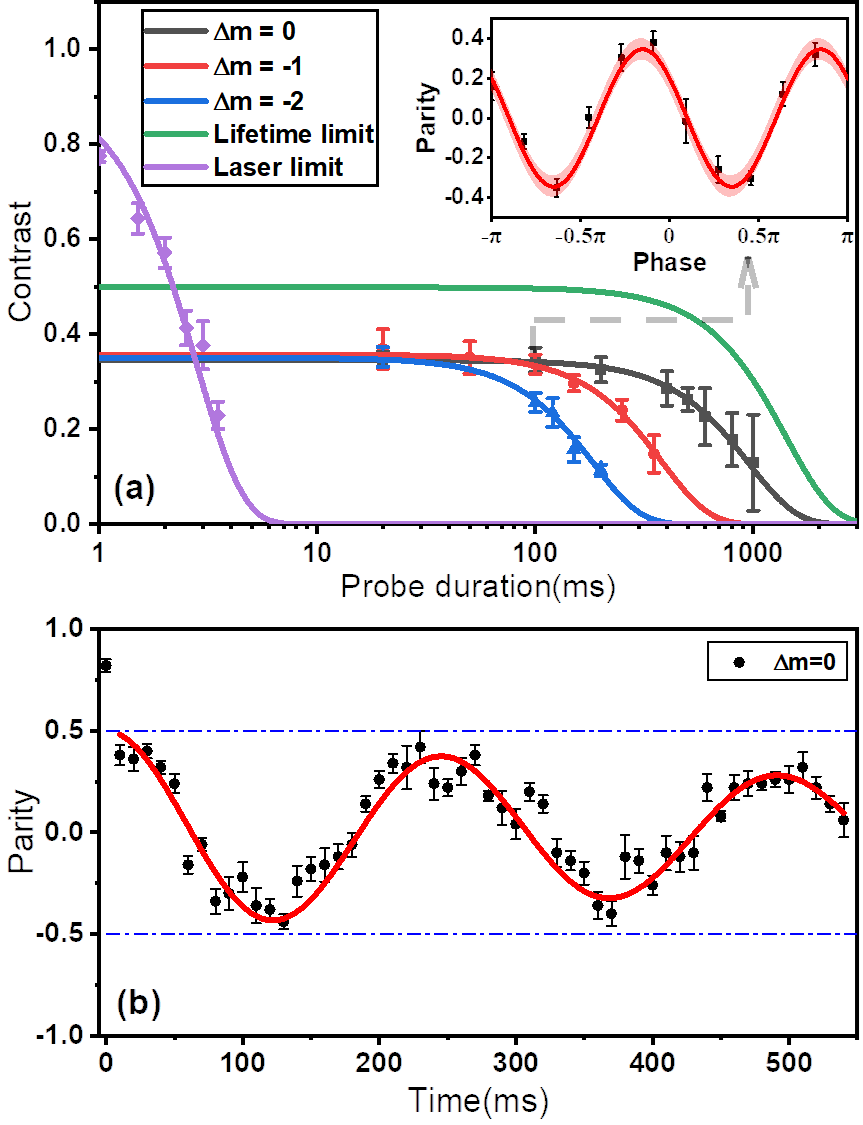
During the clock interrogation, the phase of the second pulse on TOC-729-1 is scanned relative to TOC-729-3, and the parity fringe is observed as shown in the inset of Fig. 2(a). Series of fringe contrasts under different free evolution time are measured, and the results are shown in Fig. 2(a), along with the laser coherence limited Ramsey spectroscopy contrast. In these measurements, due to the limited power of the 729 nm laser, the pulse time is approximately 400 us, so the laser coherence time is intentionally destroyed to 2.6 ms and it’s verified that the laser linewidth is degenerated to about 200 Hz by heterodyne beating with a narrow linewidth laser. There’s no further destruction of the laser coherence time to a much shorter scale. But, in principle, lasers with arbitrary linewidths can be employed to achieve high-precision frequency comparison once the laser’s coherence time is long enough to perform pulse but shorter than the free evolution time of the Ramsey-type interrogation.
We find that the measured coherence time using correlation spectroscopy does not reach the 1.17 s lifetime of the upper state of 40Ca+ due to the decoherence from the magnetic field noise. This can be verified by comparing the parity fringes of three Zeeman components with different magnetic sensitivities. The decoherence times of the m=0, -1, and -2 transitions are 797(16) ms, 317(13) ms, and 153(5) ms, respectively. Although the magnetic field noise now becomes the main limitation of the further extension of the clocks probe time, this experiment demonstrated a scheme with clock interrogation time far beyond the laser’s coherent time. As a comparison, the coherence time of two ions in the same linear trap (TOC-729-1) is measured using correlation spectroscopy with the m=0 transition (see Fig. 2 (b)). The maximal contrast is close to 0.5, which is better than the contrast obtained by two ions in different linear traps. Trapping in the same trap suppressed the ambient noise, including laser propagation noise and magnetic field noise, makes it possible to reach a coherent time of 827(252) ms.

The phase difference of the correlation spectrum is closely related to the frequency difference of the interrogated transition. So the frequency difference of the same transition of two ions can be calculated from the phase of the selected peak of the parity fringes:
| (4) |
where is the free evolution time, is the phase of the selected peak in the parity fringe, and is an integer constant related to the initial frequency difference. Take the results of the inset in Fig.2(a) as an example, since the magnetic field difference between TOC-729-1 and TOC-729-3 ions is about 2905(1) nT, the corresponding frequency difference of m=0 transition is 16302.7(11.2) Hz, the frequencies of ions’ free evaluation during the Ramsey probe time are different in these two clocks. Considering that the frequency of the transitions is different between the two ions, the phase difference detected by the parity fringes under the free evolution time of 100 ms should be -1630.27(1.12), this result is consistent with the peak phase -0.153(0.03) of the parity fringe fitting.

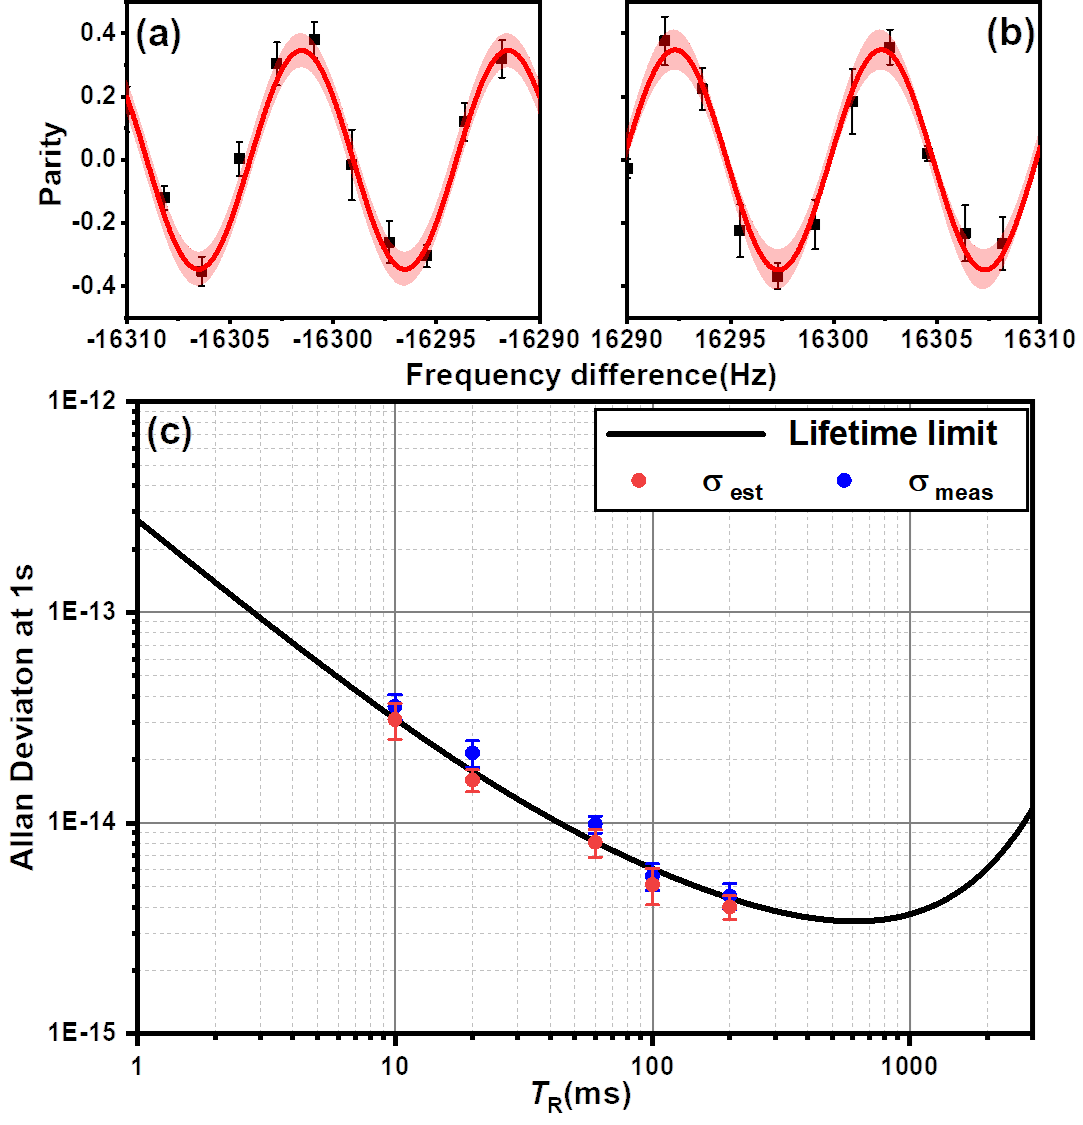
The peak phase tracking of the parity fringes can be achieved by interrogating at the two points with a parity fringe on both sides of the specified peak. In the experiment, the inquiry of these peaks is also added to judge whether the locking is normal. Based on this, we demonstrate the closed-loop clock operation with a pair of Zeeman components.The correlation spectrum obtained from ) and are shown in Fig.3(a,b) where the scanned phase has been calculated as frequency difference of each peak. Frequency comparisons with the parity fringes of m=0 transitions at the different interrogation time range from 10 ms to 200 ms are then demonstrated, and their self-comparison instability results are shown as in Fig.3(c). The instabilities estimated by the contrast of parity fringes and the instability calculated with the lifetime of are shown in Fig.3(c). The measured results is in great agreement with the estimated instability within the error range.
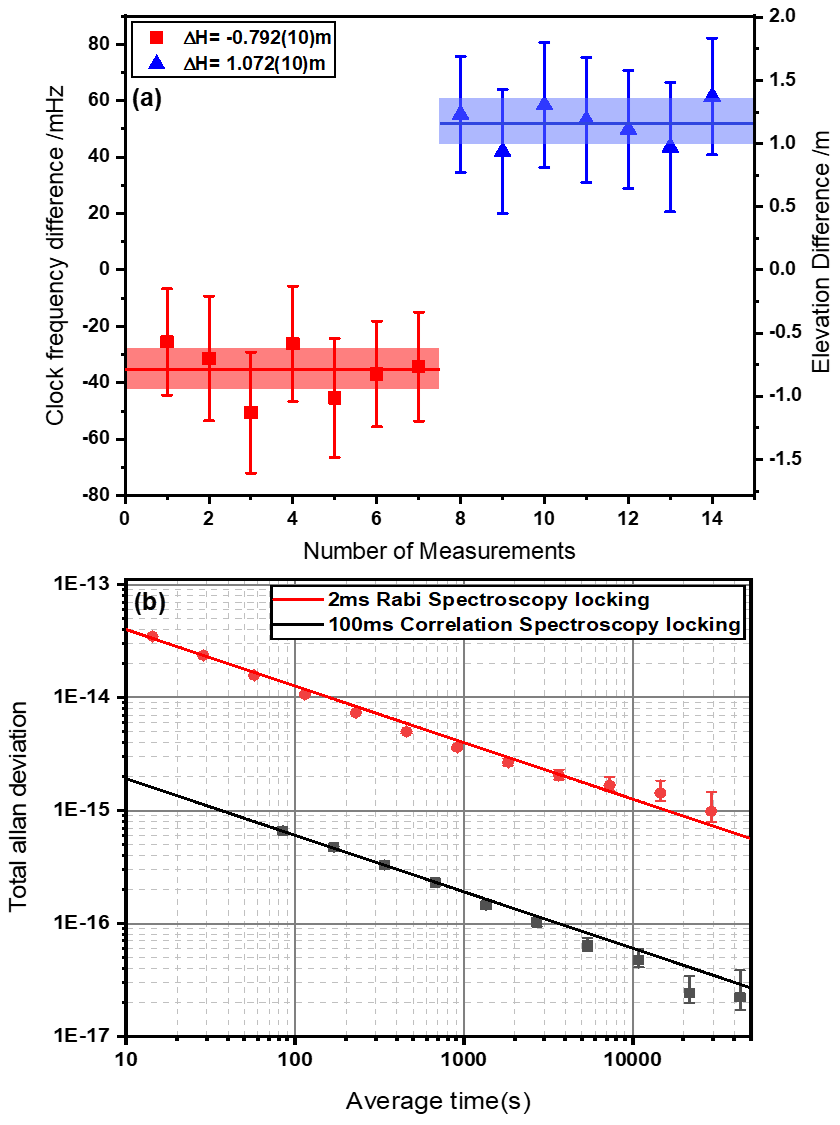
The frequency shift due to the electric quadrupole effect is eliminated by averaging three inner pairs of Zeeman components with magnetic sublevels =1/2, 3/2, and 5/2 of the upper state, sequentially in each cycle during the lock runs. The effective data duration of each measurement is approximately four hours, and the instability of the frequency difference data obtained by seven groups of measurements reaches 6.0 (Fig.4(b)) It’s about 20 times better than the limit measured by the traditional Rabi method under the same laser linewidth.

| Statistical frequency difference | System frequency shift | Absolute frequency difference | Elevation difference | |
|---|---|---|---|---|
| /cm | /mHz | /mHz | /mHz | /cm |
| -79.2(1.0) | -50.5(3.3) | -15.2(6.4) | -35.3(7.2) | -78.8(16.1) |
| 107.2(1.0) | 39.1(2.6) | -12.8(7.7) | 51.9(8.2) | 115.9(18.3) |
After these efforts, we performed a laboratory demonstration of chronometric leveling with this new method of correlation spectroscopy. TOC-729-1 is acting as a reference when placed on an optical table, and TOC-729-3 is placed on two locations successively with geometric height difference (relative to TOC-729-1) -0.792(10) m and 1.072(10) m, respectively. As shown in Fig.4(a) and Table 1, at two different elevations, the frequency differences between TOC-729-1 and TOC-729-3 are measured as -50.5(3.3) mHz and 39.1(2.6) mHz, respectively. Most of the systematic frequency shift evaluation process is the same as in our previous work[29, 28]. Since only the information of the frequency difference of the two optical clocks can be obtained in the clocks’ operation with correlation spectroscopy, frequency shifts caused by servo, electric quadrupole, and magnetic field drifts are evaluated in differential mode. After correcting the systemic shifts of -15.2(6.4) mHz and -12.8(7.7) mHz, the absolute frequency differences at two different elevations are synthesized to be -35.3(7.2) mHz and 51.9(8.2) mHz, respectively. The fractional frequency shifts are calculated as -8.6(1.8) and -12.6(2.0).
According to Einstein’s general theory of relativity, the frequency change of the optical clock due to the change of geopotential difference can be expressed as g [31] ,Where is the clock transition frequency, is the clock frequency difference caused by the geopotential difference, is the gravitational acceleration, is the elevation difference, and is the speed of light. According to the gravitational acceleration =9.793461(2) m/s2 at the locations of clocks, the elevation differences measured by the optical clocks are -78.8 (16.1) cm and 115.9 (18.3) cm, respectively. These results are consistent with the elevation differences obtained by the geometric measurement within the error range, and are also consistent with the results obtained by the traditional method of Rabi spectroscopy[28].
III Conclusion
As a conclusion, we demonstrate the closed-loop clock operation on the order of 100 ms using an interrogation laser with artificially destructed coherence time at the millisecond level based on the method of correlation spectroscopy. Frequency comparison with the instability of 6.0/ is achieved, which is 20 times better than that of the traditional Rabi spectroscopy using the same destructive laser. Our scheme is applied to an elevation difference measurements experiment using transportable optical clocks. This result has proved that correlation spectroscopy between independent optical clocks at different locations can improve the measurement precision beyond the laser coherence time significantly.
In this demonstration, the clock probe time is limited to 100 ms level due to the strong magnetic sensitivity of 40Ca+ ion. In the future, frequency comparison with correlation spectroscopy can be applied to other clock systems that are very insensitive to magnetic field noise, such as 176Lu+, 171Yb+(E3 transition), 27Al+, and of course neutral atoms like 87Sr, 171Yb, and so on[32]. Considering that the clock lifetime of these atoms is in tens of seconds or even longer, the clock probe time can be easily extended to several seconds or even tens of seconds using correlation spectroscopy, which means that the instability of the frequency comparison can reach the level of 1/ or better. This excellent stability of frequency comparison accessing a statistical uncertainty of 1 in several hours opens a new avenue for geodetic surveys, which resolves an elevation difference of one centimeter in a short averaging time. Correlation spectroscopy is suitable for the frequency difference measurement of optical clocks in complex environments outside the laboratory, which greatly reduces the dependence of optical clock network on ultra-stable lasers, and has a bright application prospect in the field of chronometric leveling.
Acknowledgements.
We thank Dr. Z. Zhang for helpful comments on the manuscript. This work was supported by the Basic Frontier Science Research Program of Chinese Academy of Sciences (Grant No. ZDBS-LY-DQC028), the National Key Research and Development Program of China (Grant No. 2017YFA0304404), and the National Natural Science Foundation of China (Grant No. 11674357 and U21A20431).References
- Chou et al. [2010] C. W. Chou, D. B. Hume, J. C. J. Koelemeij, D. J. Wineland, and T. Rosenband, Frequency comparison of two high-accuracy + optical clocks, Phys. Rev. Lett. 104, 070802 (2010).
- Ushijima et al. [2015] I. Ushijima, M. Takamoto, M. Das, T. Ohkubo, and H. Katori, Cryogenic optical lattice clocks, Nat. Photonics 9, 185 (2015).
- Nicholson et al. [2015] T. L. Nicholson, S. Campbell, R. Hutson, G. Marti, B. Bloom, R. McNally, W. Zhang, M. Barrett, M. Safronova, G. Strouse, et al., Systematic evaluation of an atomic clock at 2 10-18 total uncertainty, Nat. Commun. 6, 6896 (2015).
- Huntemann et al. [2016] N. Huntemann, C. Sanner, B. Lipphardt, C. Tamm, and E. Peik, Single-ion atomic clock with systematic uncertainty, Phys. Rev. Lett. 116, 063001 (2016).
- McGrew et al. [2018] W. F. McGrew, X. Zhang, R. J. Fasano, S. A. Schäffer, K. Beloy, D. Nicolodi, R. C. Brown, N. Hinkley, G. Milani, M. Schioppo, et al., Atomic clock performance enabling geodesy below the centimetre level, Nature 564, 87 (2018).
- Takamoto et al. [2020] M. Takamoto, I. Ushijima, N. Ohmae, T. Yahagi, K. Kokado, H. Shinkai, and H. Katori, Test of general relativity by a pair of transportable optical lattice clocks, Nat. Photonics 14, 411 (2020).
- Huang et al. [2022] Y. Huang, B. Zhang, M. Zeng, Y. Hao, Z. Ma, H. Zhang, H. Guan, Z. Chen, M. Wang, and K. Gao, Liquid-nitrogen-cooled + optical clock with systematic uncertainty of , Phys. Rev. Appl. 17, 034041 (2022).
- Zhang et al. [2023] Z. Zhang, K. J. Arnold, R. Kaewuam, and M. D. Barrett, 176+ clock comparison at the level via correlation spectroscopy, Sci. Adv. 9, eadg1971 (2023).
- Milner et al. [2019] W. R. Milner, J. M. Robinson, C. J. Kennedy, T. Bothwell, D. Kedar, D. G. Matei, T. Legero, U. Sterr, F. Riehle, H. Leopardi, et al., Demonstration of a timescale based on a stable optical carrier, Phys. Rev. Lett. 123, 173201 (2019).
- Gill [2005] P. Gill, Optical frequency standards, Metrologia 42, S125 (2005).
- Falke et al. [2011] S. Falke, H. Schnatz, J. S. R. V. Winfred, T. Middelmann, S. Vogt, S. Weyers, B. Lipphardt, G. Grosche, F. Riehle, U. Sterr, and C. Lisdat, The 87 optical frequency standard at , Metrologia 48, 399 (2011).
- Lisdat et al. [2016] C. Lisdat, G. Grosche, N. Quintin, C. Shi, S. Raupach, C. Grebing, D. Nicolodi, F. Stefani, A. Al-Masoudi, S. Dörscher, et al., A clock network for geodesy and fundamental science, Nat. Commun. 7, 12443 (2016).
- Riehle [2017] F. Riehle, Optical clock networks, Nat. Photonics 11, 25 (2017).
- Beloy et al. [2021] K. Beloy, M. I. Bodine, T. Bothwell, S. M. Brewer, S. L. Bromley, J.-S. Chen, J.-D. Deschênes, S. A. Diddams, R. J. Fasano, T. M. Fortier, et al., Frequency ratio measurements at 18-digit accuracy using an optical clock network, Nature 591, 564 (2021).
- Derevianko and Pospelov [2014] A. Derevianko and M. Pospelov, Hunting for topological dark matter with atomic clocks, Nat. Phys. 10, 933 (2014).
- Kolkowitz et al. [2016] S. Kolkowitz, I. Pikovski, N. Langellier, M. D. Lukin, R. L. Walsworth, and J. Ye, Gravitational wave detection with optical lattice atomic clocks, Phys. Rev. D 94, 124043 (2016).
- Quessada et al. [2003] A. Quessada, R. P. Kovacich, I. Courtillot, A. Clairon, G. Santarelli, and P. Lemonde, The dick effect for an optical frequency standard, J. Opt. B: Quantum Semiclass. Opt. 5, S150 (2003).
- Oelker et al. [2019] E. Oelker, R. B. Hutson, C. J. Kennedy, L. Sonderhouse, T. Bothwell, A. Goban, D. Kedar, C. Sanner, J. M. Robinson, G. E. Marti, et al., Demonstration of 4.8 10-17 stability at 1 s for two independent optical clocks, Nat. Photonics 13, 714 (2019).
- Takano et al. [2016] T. Takano, M. Takamoto, I. Ushijima, N. Ohmae, T. Akatsuka, A. Yamaguchi, Y. Kuroishi, H. Munekane, B. Miyahara, and H. Katori, Geopotential measurements with synchronously linked optical lattice clocks, Nat. Photonics 10, 662 (2016).
- Grotti et al. [2018] J. Grotti, S. Koller, S. Vogt, S. Häfner, U. Sterr, C. Lisdat, H. Denker, C. Voigt, L. Timmen, A. Rolland, et al., Geodesy and metrology with a transportable optical clock, Nat. Phys. 14, 437 (2018).
- Mehlstäubler et al. [2018] T. E. Mehlstäubler, G. Grosche, C. Lisdat, P. O. Schmidt, and H. Denker, Atomic clocks for geodesy, Rep. Prog. Phys. 81, 064401 (2018).
- Lion et al. [2017] G. Lion, I. Panet, P. Wolf, C. Guerlin, S. Bize, and P. Delva, Determination of a high spatial resolution geopotential model using atomic clock comparisons, J. Geod. 91, 597 (2017).
- Manovitz et al. [2019] T. Manovitz, R. Shaniv, Y. Shapira, R. Ozeri, and N. Akerman, Precision measurement of atomic isotope shifts using a two-isotope entangled state, Phys. Rev. Lett. 123, 203001 (2019).
- Colombo et al. [2022] S. Colombo, E. Pedrozo-Peñafiel, and V. Vuletić, Entanglement-enhanced optical atomic clocks, Appl. Phys. Lett. 121, 10.1063/5.0121372 (2022).
- Nichol et al. [2022] B. C. Nichol, R. Srinivas, D. P. Nadlinger, P. Drmota, D. Main, G. Araneda, C. J. Ballance, and D. M. Lucas, An elementary quantum network of entangled optical atomic clocks, Nature 609, 689 (2022).
- Chwalla et al. [2007] M. Chwalla, K. Kim, T. Monz, P. Schindler, M. Riebe, C. Roos, and R. Blatt, Precision spectroscopy with two correlated atoms, Appl. Phys. B 89, 483 (2007).
- Clements et al. [2020] E. R. Clements, M. E. Kim, K. Cui, A. M. Hankin, S. M. Brewer, J. Valencia, J.-S. Chen, C.-W. Chou, D. R. Leibrandt, and D. B. Hume, Lifetime-limited interrogation of two independent 27+ clocks using correlation spectroscopy, Phys. Rev. Lett. 125, 243602 (2020).
- Liu et al. [2023] D. Liu, J. Cao, J. Yuan, K. Cui, Y. Yuan, P. Zhang, S. Chao, H. Shu, and X. Huang, Laboratory demonstration of geopotential measurement using transportable optical clocks, Chin. Phys. B 32, 010601 (2023).
- Cao et al. [2022] J. Cao, J. Yuan, S. Wang, P. Zhang, Y. Yuan, D. Liu, K. Cui, S. Chao, H. Shu, Y. Lin, et al., A compact, transportable optical clock with 1 10-17 uncertainty and its absolute frequency measurement, Appl. Phys. Lett. 120, 054003 (2022).
- Shang et al. [2017] J. Shang, J. Cao, K. Cui, S. Wang, P. Zhang, J. Yuan, S. Chao, H. Shu, and X. Huang, A compact, sub-hertz linewidth 729nm laser for a miniaturized 40+ optical clock, Opt. Commun. 382, 410 (2017).
- Pound and Rebka [1960] R. V. Pound and G. A. Rebka, Apparent weight of photons, Phys. Rev. Lett. 4, 337 (1960).
- Ludlow et al. [2015] A. D. Ludlow, M. M. Boyd, J. Ye, E. Peik, and P. O. Schmidt, Optical atomic clocks, Rev. Mod. Phys. 87, 637 (2015).