Political Elites in False Statements on the Internet
Abstract.
Political elites play a critical role in driving engagement with misinformation on the internet. However, an understanding of the strategies with which the political left and right attempt to harness animosity toward political elites in their misinformation stories is missing. To this end, we collected a comprehensive dataset consisting of 35,014 true and false statements that have been fact-checked by renowned fact-checking organizations (e. g., snopes.com) between 2008 and 2023, i. e., within an observation period of 15 years. Subsequently, we perform content analysis and explanatory regression modeling to analyze how veracity is linked to mentions of US political elites (Republicans and Democrats) in fact-checked statements. Our analysis yields four main findings: (i) False statements are, on average, 20% more likely to mention political elites than true statements. (ii) However, there is a partisan asymmetry such that false statements are 88.1% more likely to mention Democrats, but 26.5% less likely to mention Republicans. (iii) Mentions of political elites in false statements reach the highest level during the months preceding elections. (iiii) False statements that mention political elites carry stronger other-condemning emotions. In sum, these empirical findings shed new light on the connection between online misinformation and political elites – and suggest that authors of misinformation frequently harness animosity toward the political out-groups in their misinformation stories.
1. Introduction
Online misinformation poses significant challenges to societies of the twenty-first century (Lazer et al., 2018; Gawronski et al., 2023; Chuai and Zhao, 2022; Ecker et al., 2022). Detrimental effects of misinformation have been repeatedly observed across various events such as, for example, during elections and crises (Allcott and Gentzkow, 2017; Briand et al., 2021; Suciu, 2022; Mosleh and Rand, 2022; Hartman et al., 2022; Pierri et al., 2022; Geissler et al., 2023; Jakubik et al., 2023; Bär et al., 2023). Hence, countering the spread of misinformation has become an urgent priority, with extensive research efforts dedicated to analysis of its online diffusion and detection (Gradoń et al., 2021; Raponi et al., 2022; Wu et al., 2019; Ecker et al., 2022; Horta Ribeiro et al., 2023; Vosoughi et al., 2018; Drolsbach and Pröllochs, 2023a; Pröllochs et al., 2021; Chuai et al., 2023). However, despite these efforts, the misinformation problem is still largely unresolved (Glockner et al., 2022). It is thus vital to better understand the nature of misinformation and how its characteristics differ from truthful content (Rastogi, 2022).
Recent research suggests that political elites (i. e., politicians, political figures) may play a key role in the proliferation of misinformation on the internet (Flores et al., 2022; Mosleh and Rand, 2022). Over the past 30 years, political figures were increasingly mentioned in media representations with the goal of politicizing (seemingly apolitical) issues (Chinn et al., 2020). The strategy of mentioning politicians in news stories can drive engagement (Osmundsen et al., 2021; Shin and Thorson, 2017) and help to foster specific political interests, ideologies, or agendas (Druckman, 2022; Chinn et al., 2020; Hart et al., 2020). At the same time, politicization contributes to partisan polarization, characterized by growing disparities in viewpoints between adherents of opposing political parties (Chinn et al., 2020; Simon et al., 2019; Hart et al., 2020; Raymond et al., 2022; Saveski et al., 2022; Lin and Chung, 2020). For instance, misinformation mentioning politicians has been shown to fragment online political debates and intensify divisions in public support for policies related to COVID-19 and climate change (Flores et al., 2022; Heiberger et al., 2022; Chinn et al., 2020). In light of a substantial body of research highlighting the influence of political elites on individuals’ attitudes and behaviors (Pierri et al., 2022; Mosleh and Rand, 2022; Enders et al., 2022; Green et al., 2022), the politicization of misinformation has become an urgent and pressing concern that requires further scrutiny and investigation.
A frequently employed strategy to politicize misinformation is to harness animosity toward political elites of the political out-group (Hartman et al., 2022; Rathje et al., 2021). Prior research has observed that partisans are more likely to share false statements that dislike political opponents (Rathje et al., 2021; Hartman et al., 2022; Osmundsen et al., 2021). During previous US presidential elections, partisans selectively shared misinformation that denigrates out-group candidates (Shin and Thorson, 2017). Despite the relatively well-documented role of online users’ political ideologies in misinformation diffusion (Garrett and Bond, 2021; Nikolov et al., 2021; Chen et al., 2021; Rathje et al., 2021; Osmundsen et al., 2021), the mechanisms through which false statements mention politicians and interact with users’ partisan orientations are largely unclear. Specifically, previous research lacks an understanding of the strategies with which the political left and right attempt to harness animosity toward political elites in their misinformation stories.
Research goal: In this paper, we conduct a holistic analysis of mentions of political elites within true and false statements on the internet. To this end, we collect true and false statements that have been fact-checked by renowned organizations, namely, PolitiFact (politifact.com) and Snopes (snopes.com) between 2008 and 2023, i. e., within an observation period of 15 years. Additionally, we construct a database of US politicians, containing political elites (Republicans and Democrats) to measure politicization within the fact-checked statements. Subsequently, we estimate logistic regression models to analyze how veracity is linked to mentions of US political elites in fact-checked statements. We also study how this link varies across topics and between election cycles, and perform content analysis to explore the role of moral emotions in the politicization of statements.
Contributions: Our work sheds new light on the connection between online misinformation and mentions of political elites. Specifically, our analysis contributes four main findings: (i) False statements are, on average, 20% more likely to mention political elites than true statements. (ii) However, there is a partisan asymmetry such that false statements are 88.1% more likely to mention Democrats, but 26.5% less likely to mention Republicans. (iii) Mentions of political elites in false statements reach the highest level during the months preceding elections. (iiii) False statements that mention political elites carry stronger other-condemning emotions. These results suggest that authors of misinformation frequently harness animosity toward the political out-groups in their misinformation stories. In sum, our study bridges important findings on the intersection between misinformation and politicization and has important practical implications for the fight against misinformation on the internet.
2. Background & Research Questions
Misinformation on the internet has been a pressing societal problem that platforms, policymakers, and researchers continue to grapple with. The reason is that there are serious concerns that misinformation on social media is damaging societies and democratic institutions (Lazer et al., 2018). In recent years, negative effects of online misinformation on modern societies have been repeatedly observed, especially in the context of elections and crises (Briand et al., 2021; Suciu, 2022; Allcott and Gentzkow, 2017; Mosleh and Rand, 2022; Hartman et al., 2022; Pierri et al., 2022). Despite massive research efforts attempting to define, characterize, detect, and intervene misinformation (Gradoń et al., 2021; Raponi et al., 2022; Wu et al., 2019; Ecker et al., 2022; Horta Ribeiro et al., 2023; Drolsbach and Pröllochs, 2023b), the misinformation problem is still not well resolved (Glockner et al., 2022). Due to its pervasive nature, an important challenge is to better understand the nature of misinformation and how its characteristics differ from truthful content (Rastogi, 2022).
The intersection of misinformation and political elites has garnered increased attention lately (Mosleh and Rand, 2022; Flores et al., 2022; Osmundsen et al., 2021; Green et al., 2022). Existing works show that misinformation reporting on (alleged) activities of politicians can have profound impacts on voter attitudes and other offline behaviors, such as, for example, COVID-19 vaccine hesitancy and climate change denial (Chinn et al., 2020; Hart et al., 2020; Shin and Thorson, 2017; Pierri et al., 2022; Mosleh and Rand, 2022; Enders et al., 2022; Green et al., 2022). There has been a surge of news stories featuring political figures to politicize social issues, which can contribute to partisan polarization (Chinn et al., 2020; Hart et al., 2020; Rathje et al., 2021). Previous studies further suggest that partisans selectively share misinformation that expresses animosity toward political opponents (Rathje et al., 2021; Shin and Thorson, 2017). Yet, an understanding of how misinformation mentions political elites and harnesses animosity is missing. In the following, we derive four research questions (RQ1–4), all of which aim to extract new insights into the connection between online misinformation and political elites.
Politicization (RQ1): Mentioning political elites is a primary strategy to politicize (true and false) stories (Hart et al., 2020; Chinn et al., 2020; Druckman, 2022). Since politicization can drive engagement and help to foster political agendas (Druckman, 2022; Chinn et al., 2020; Hart et al., 2020; Shin and Thorson, 2017; Osmundsen et al., 2021), political figures were increasingly mentioned in media representations over the last 30 years (Chinn et al., 2020). Understanding politicization in true and false statements is important as politicization can contribute to polarization, which, in turn, strongly affects how people evaluate information (Chinn et al., 2020; Shin and Thorson, 2017; Flores et al., 2022; Jenke, 2023). For instance, the politicization of the (seemingly unpolitical) topic of climate change has contributed to a polarized environment that fosters climate change denial and misinformation (Chinn et al., 2020). Likewise, during elections, partisans have been observed to selectively share (oftentimes false) statements that support their in-group candidates or denigrate out-group ones (Shin and Thorson, 2017). However, an understanding of how the mentioning of political elites differs across true and false stories on the internet is missing. Accordingly, our first research question (RQ1) states:
RQ1: Are false statements more likely to mention political elites than true statements?
Partisan asymmetry (RQ2): Politicization typically has a distinct partisan leaning, supporting either conservative (Republican, right-leaning) or opposite liberal (Democratic, left-leaning) opinion (Garrett and Bond, 2021). In accordance with the theories of motivated cognition and confirmation bias (Rathje et al., 2021; Ecker et al., 2022), individuals intend to process information that is consistent with their partisan identities or preexisting beliefs. Put differently, both conservatives and liberals are more likely to believe in-group favorable claims and reject in-group harming claims (Rathje et al., 2021; Gawronski et al., 2023; Garrett and Bond, 2021). Furthermore, there is ample evidence that the political left and right use the internet differently, a phenomenon known as ideological asymmetry (González-Bailón et al., 2022). Adherents of the right have been observed to be more likely to believe and share misinformation than adherents of the left (Garrett and Bond, 2021; Mosleh and Rand, 2022; Nikolov et al., 2021; González-Bailón et al., 2022; Shin and Thorson, 2017). Given this asymmetry, our second research question (RQ2) is to gauge whether mentions of Democrats and Republicans vary across true and false statements.
RQ2: Is there an asymmetry in the mentions of Democrats and Republicans across true and false statements?
Elections (RQ3): Elections are the most important political event in Western democracies. Upcoming elections and campaigning activities of political candidates inherently attract a large number of (true and false) statements, which can affect voters’ attitudes and behaviors (Mathur and Moschis, 2022; Suciu, 2022). It is thus important to understand whether the level of politicization in true and false statements increases during election periods, and whether the changes in true and false statements differ. Our third research question (RQ3) states:
RQ3: Does the level of mentioning political elites in true and false fact-checked statements increase as elections approach?
Other-condemning emotions (RQ4): Out-group animosity is an effective strategy for expressing one’s partisan identity and generating engaging online content. For instance, it has been found that out-party animosity exerts a more substantial influence on voting behaviors and the spread of political misinformation when contrasted with in-party warmth (Rathje et al., 2021). Animosity toward the out-group is frequently expressed through the use of other-condemning emotions (i. e., contempt, anger, and disgust), a subset of the moral emotions families (Solovev and Pröllochs, 2022; Dastani and Pankov, 2017). Studying the role of other-condemning emotions in politicized statements thus allows one to better understand whether the political left and right harness animosity toward the political out-groups in false statements. Accordingly, our fourth research question (RQ4) analyzes whether statements that mention political elites contain more other-condemning emotions compared to statements that do not mention political elites.
RQ4: Do statements that mention political elites contain more other-condemning emotions than statements that do not mention political elites?
3. Materials and Methods
3.1. Data Source: Fact-Checked Statements
For our analysis, we collect a large-scale dataset consisting of true and false statements that have been fact-checked between 2008 and 2023 (i. e., within an observation period of 15 years) by two reputable fact-checking organizations, namely, PolitiFact (politifact.com) and Snopes (snopes.com). We scrape all fact-checked statements, including associated information such as verdicts, fact-checking dates, fact-checkers, and topic tags, from these websites (see examples in Table 1). As a result, our dataset comprises a total of fact-checked statements, with statements originating from PolitiFact and statements originating from Snopes. The fact-checks have been carried out by 608 different fact-checkers. Given that PolitiFact and Snopes have different scales for rating the veracities of the statements, we classify the ratings into distinct true or false categories. Specifically, PolitiFact provides six truthfulness ratings, namely, true, mostly true, half true, mostly false, false, and pants on fire. We consider half true, mostly false, false, and pants on fire as false ratings, and others are true ratings. For Snopes, we consider mixture, mostly false, false, miscaptioned, misattributed, scam, and fake as false ratings. True, mostly true, correct attribution, legit, and recall are taken as true ratings.
| Date | Statement | Topic Tag | Veracity |
| 2022-05-27 | These mass shootings happen so much that Ted Cruz really got a template ready to tweet whenever they occur. | Crime, Guns | False |
| 2022-03-03 | NEW: Biden Admin. instructs Americans to social distance and wear masks in the event of a Nuclear Fallout. | Coronavirus, Ukraine etc. | False |
| 2020-05-18 | Pelosi’s new coronavirus bill allows illegals to receive billions in relief funds in past, current, and future payments. | Coronavirus, Economy, etc. | True |
In addition to the fact-checking verdicts, we clean the fine-grained topic tags provided by the fact-checking organizations and integrate them into our dataset. Specifically, there are in total 202 topic tags categorized by the two organizations. The topic tags include many specific social issues, such as, for example, Coronavirus, Guns, and Immigration. An overview of the dataset and summary statistics are reported in Suppl. A.
3.2. Politicization
We examine the politicization of true and false statements based on the mentions of political elites (see Table 1), which is the core of most conceptualizations of politicization (Hart et al., 2020; Chinn et al., 2020). For this purpose, we gather a comprehensive list of US political elites based on two sources: (i) we collect public figure names from the People section on the web page of PolitiFact.111https://www.politifact.com/personalities/ (ii) We additionally collect the names of all members of the US Congress since 2008 from the official website.222https://www.congress.gov/members We merge both data sources together and only consider the political elites affiliated with either the Republican or the Democratic party. The resulting list includes the names of political elites, out of which are Republicans and are Democrats. Note that the list of political elites used in this paper is substantially more comprehensive than the lists used in earlier research (Hart et al., 2020; Rathje et al., 2021; Mosleh and Rand, 2022). This allows us to maximize the matches with political elites mentioned in the fact-checked statements.
We use the list of political elites to perform string matching of the fact-checked statements. For this purpose, we first preprocess the texts by removing non-alphabetic and non-numerical characters. Subsequently, we use the names of political elites as keywords to match the cleaned texts. Statements are considered politicized when they mention one or more political elites. Out of statements, (26.6%) are categorized as politicized.
Additionally, each political elite has a distinct political affiliation, namely, Republican or Democrat (Rathje et al., 2021; Nikolov et al., 2021). We code the statements according to the political affiliations of the political elites mentioned in the textual content. If the political elite is Democrat, the partisan score is , and if the political elite is Republican, the partisan score is . If the statements contain the names of more than one political elite, we sum the partisan scores. A positive score () indicates that the statement predominantly mentions Republicans, whereas a negative score () signifies a predominant mentioning of Democrats. Out of all fact-checked statements, statements predominantly mention Republicans, and statements predominantly mention Democrats.
3.3. Other-Condemning Emotions
Other-condemning emotions are a subset of moral emotions and comprise the emotions contempt, anger, and disgust (Solovev and Pröllochs, 2022; Dastani and Pankov, 2017). We use a dictionary-based approach analogous to previous research (Vosoughi et al., 2018; Chuai and Zhao, 2022; Pröllochs et al., 2021; Solovev and Pröllochs, 2022, 2023; Wormwood et al., 2019) to computationally measure the expression of other-condemning emotions. Specifically, we employ the NRC emotion lexicon to match emotion words in the cleaned text of the fact-checked statements. The NRC emotion lexicon includes unique English words and their associations with eight basic emotions (Mohammad and Turney, 2013). Additionally, the eight basic emotions, namely, anger, anticipation, disgust, fear, joy, sadness, surprise, and trust, can be combined into 24 complex emotional dyads (Plutchik, 1991). For example, contempt is composed of anger and disgust. In line with prior work (Solovev and Pröllochs, 2022), we calculate the scores of the eight basic emotions and the 24 derived emotions based on the frequency of words belonging to each emotion category. Subsequently, the score of other-condemning emotions is calculated as the sum of the scores for contempt, anger, and disgust. The mean score for other-condemning emotions in the fact-checked statements is 0.096 (see details in Suppl. A).
3.4. Explanatory Regression Models
In this study, we employ explanatory regression modeling to answer our research questions. The variables included in our models are as follows (summary statistics are in Suppl. A):
-
•
: A dummy variable indicating whether the statement mentions political elites (1; otherwise 0).
-
•
: A dummy variable indicating whether the statement predominantly mentions Republicans (1; otherwise 0).
-
•
: A dummy variable indicating whether the statement predominantly mentions Democrats (1; otherwise 0).
-
•
: A dummy variable indicating whether the statement is labeled as false (1; otherwise 0).
-
•
(Months From Elections): A continuous variable indicating the monthly time interval from the date of the latest election.
-
•
: The number of words in the cleaned text of each statement. To some extent, text length can reflect the different writing styles of true and false information (Miani et al., 2022).
-
•
: A continuous variable measuring other-condemning emotions in each statement.
To address research questions RQ1, RQ2, and RQ3, we treat , , and as dependent variables. Note that some fact-checkers might be more focused on politics and, thus, may prefer to check statements that mention political elites. Hence, we control for such possible heterogeneity among fact-checkers through the use of fact-checker-specific random effects. Formally, we specify the following three logistic regression models (one for each of the three dependent variables):
| (1) | ||||
where is the binary dependent variable (i.e., , , or ), is the intercept, to are the coefficients of the explanatory variables, are yearly fixed effects, and are random effects specific to the fact-checkers. Notably, we also include an interaction term , which allows us to analyze whether the level of politicization in false statements differs from that in true statements during election periods (RQ3).
To address RQ4, we consider as the dependent variable, while treating as an independent variable. The rationale is that the politicization of statements may be linked to the expression of other-condemning emotions (Rathje et al., 2021; Solovev and Pröllochs, 2022; Dastani and Pankov, 2017). Consequently, we specify the following linear regression model with fact-checker-specific random effects and yearly fixed effects:
| (2) | ||||
Notably, we also consider the interactions of with both and . This allows us to investigate potential variations concerning the politicization of true and false statements and how the effects may vary during elections.
4. Empirical Results
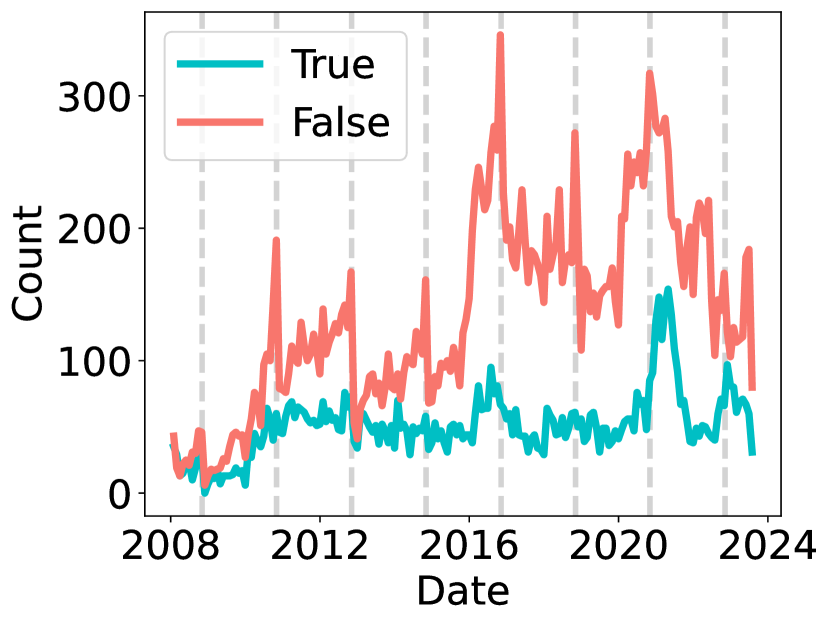
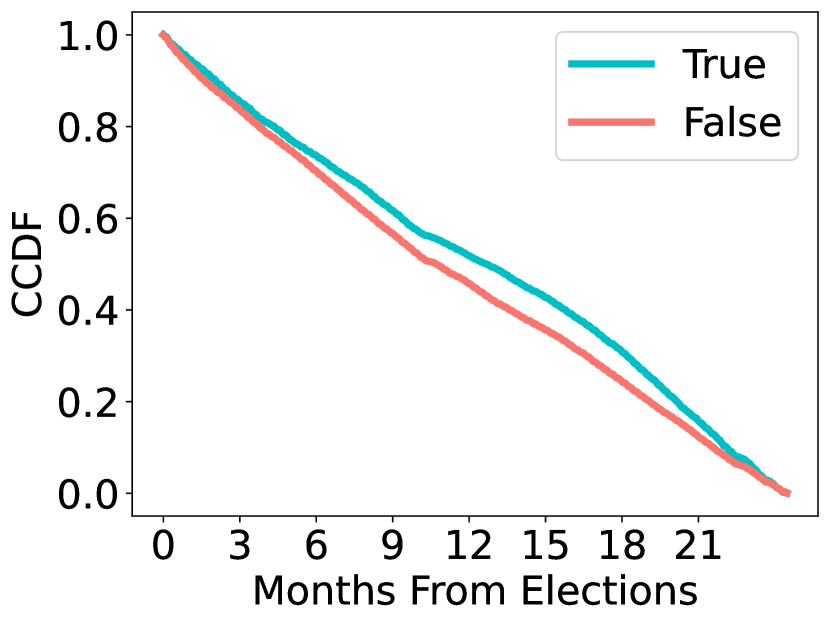
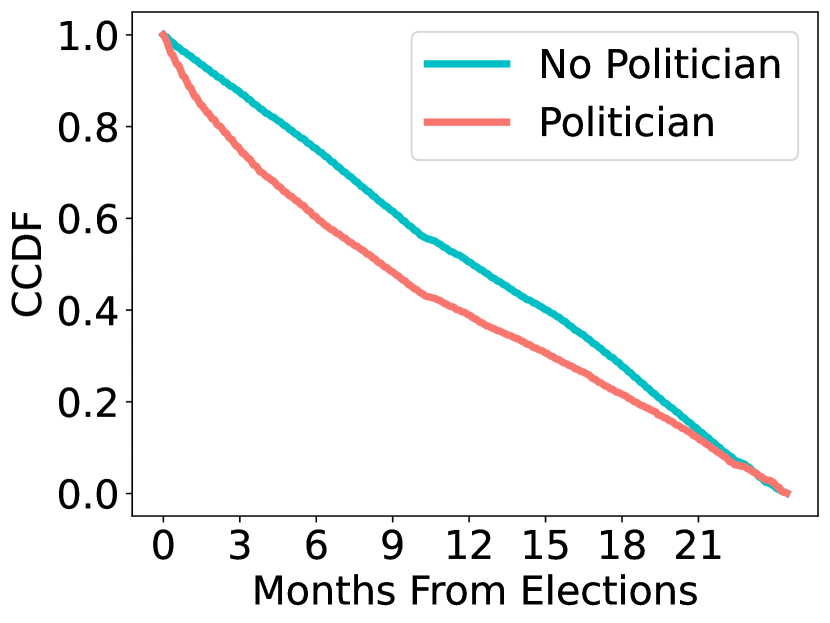
Our dataset consists of true and false statements that have been fact-checked by reputable fact-checking organizations between January 2008 and July 2023. The dataset thus spans an observation period of approximately 15 years, including eight US Midterm and Presidential elections. The number of false statements tended to increase when approaching elections, with the highest peak observed during the 2016 US Presidential election (Fig. 1(a)). In contrast, the number of true statements was relatively stable with a significant peak after the 2020 US Presidential election. Fig. 1(b) shows that the mean of the variable Months From Elections () in false statements (mean of 11.321) is smaller than that in true statements (mean of 12.349). This implies that false statements are more likely to be created closer to elections than true statements. Furthermore, the mean of in statements mentioning political elites (mean of 10.031) is smaller than that in statements not mentioning political elites (mean of 12.173). This suggests that, close to elections, statements are more likely to be politicized (Fig. 1(c)).
4.1. Mentions of Political Elites (RQ1 & RQ2)
Coefficient estimates: We estimate logistic regression models to analyze how veracity is linked to mentions of US political elites (Republicans and Democrats) in the fact-checked statements (RQ1 & RQ2). The regression results are reported in Table 2. Columns (1), (2), and (3) correspond to the dependent variables , , and , respectively. As shown in Column (1), the coefficient estimate of is statistically significant and positive (), with an odds ratio of . This implies that false statements are 20% more likely to mention political elites, as compared to true statements (RQ1).
Subsequently, we examine how the mentions of Republicans and Democrats differ between true and false statements. For [Column (2)], we find the coefficient estimate of is significantly negative (); and the odds ratio is . This implies that false statements are 26.5% less likely to mention Republicans compared to true statements. Conversely, when examining [Column (3)], we find a statistically significant positive coefficient estimate for (). Here, the odds ratio is , which indicates that false statements are 88.1% more likely to mention Democrats compared to true statements. In summary, our findings imply that false statements are more likely to mention Democrats and less likely to mention Republicans (RQ2).
| (1) | (2) | (3) | |
| Politician | Republican | Democrat | |
| Falsehood | ∗∗∗ | ∗∗∗ | ∗∗∗ |
| MFE | ∗∗∗ | ∗∗∗ | ∗∗∗ |
| Falsehood MFE | ∗∗∗ | ||
| Words | ∗∗∗ | ∗∗∗ | ∗∗∗ |
| Year | ✓ | ✓ | ✓ |
| Intercept | ∗∗∗ | ∗∗∗ | ∗∗∗ |
| ∗ , ∗∗ , ∗∗∗ . | |||
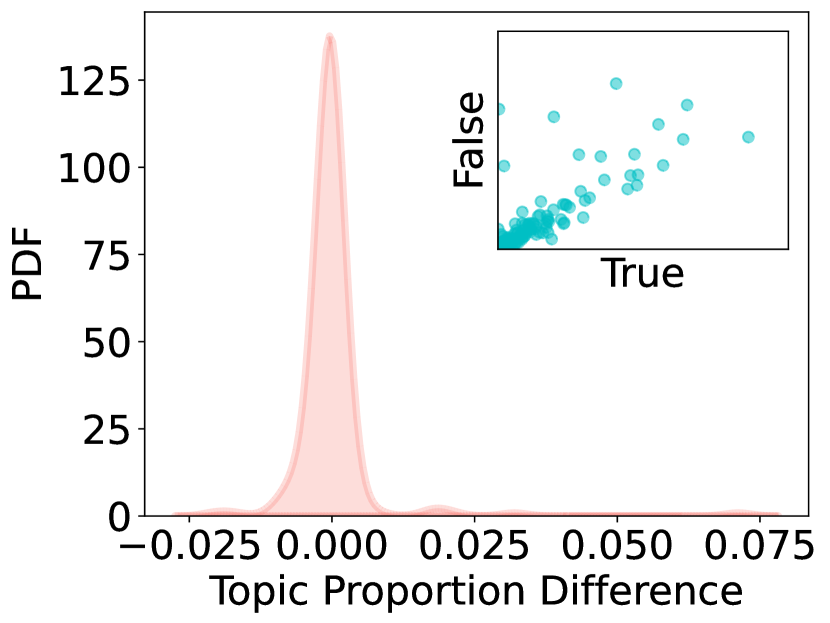
Analysis across topics: The fact-checked statements in our data concern a wide spectrum of 202 topics (see Materials and Methods). Notably, out of the 202 topics, 194 (96%) are present in both true and false statements. As shown in the embedded figure within Fig. 2(a), the proportions of topics in true statements have significantly positive correlations with those in false statements (). Moreover, using a paired two-sample -test (), we find that the proportions of each shared topic in true and false statements do not differ significantly (Fig. 2(a)). This suggests that the distribution of statements across topics is not veracity-specific.
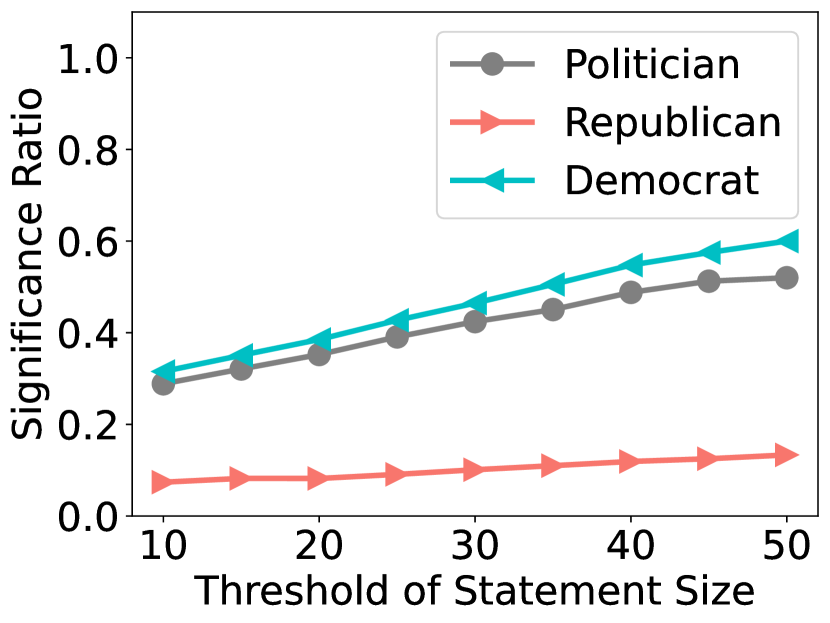
We further examine how mentions of political elites, Republicans, and Democrats in true and false statements vary across topics. While the distribution of topics appears to be independent of veracity (Fig. 2(a)), the degree of politicization within true and false claims may differ across social issues. Given that a single statement can discuss multiple topics, we assess each topic within the same statement separately. To this end, we count all statements that share the same topic as a statement group. Within each statement group, we employ a Chi-Square test to evaluate the association between politicization and veracity. For these in-group tests, it’s worth noting that some groups may lack a sufficient number of samples. Therefore, we set a group size threshold ranging from 10 to 50 (in increments of 5) to assess within-group differences.
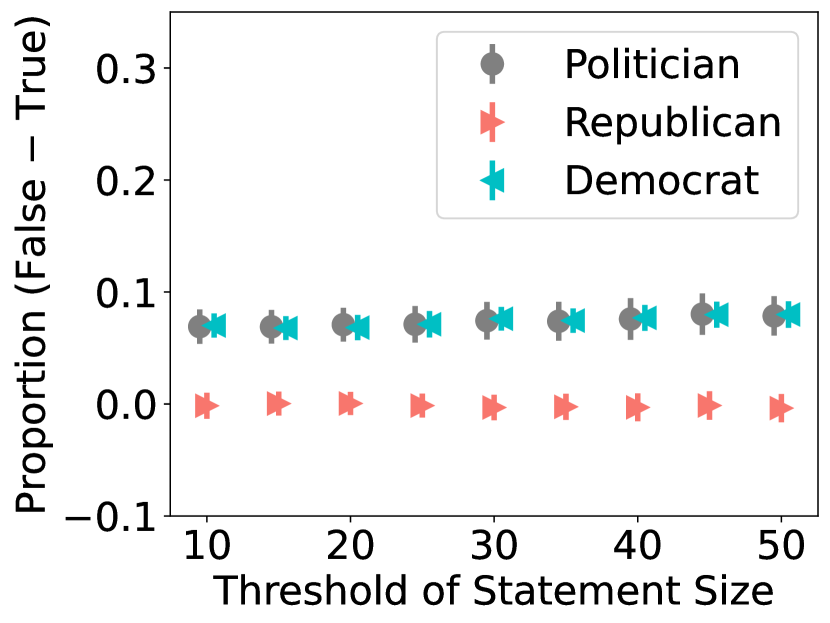
As shown in Fig. 2(b), the proportion of statement groups in which mentions of political elites exhibit a statistically significant relationship with veracity increases from 28.9% to 52.0% with increasing group size thresholds. Notably, the proportion of statement groups in which mentions of Republicans show a significant association with veracity remains relatively low, ranging from 7.4% to 13.3%. Conversely, the proportion of statement groups in which mentions of Democrats show a significant relationship with veracity rises from 31.5% to 60.0%. These findings suggest that across various topics, false and true statements consistently show opposing tendencies when it comes to mentioning political elites, particularly Democrats. Additionally, we consider the politicization ratio within each group and conduct out-group paired -tests under each group size threshold. The politicization ratio indicates the proportion of statements mentioning political elites, Republicans, or Democrats relative to all statements in each group. We consistently observe that the politicization ratio in false statements is significantly higher than that in true statements. This disparity primarily arises from the increased likelihood of false statements mentioning Democrats, while no statistically significant difference between true and false statements is found with regard to mentions of Republicans (Fig. 2(c)).
4.2. Elections (RQ3)
Next, we examine how the frequency of mentions of political elites varies with regard to the time distance to US elections (RQ3). The coefficient estimates for the variable (see Table 2) are consistently negative and statistically significant [ in Column (1), in Column (2), and in Column (3)]. This suggests that statements are more likely to mention political elites (both Republicans and Democrats) as elections approach. Furthermore, the coefficient for the interaction in Column (2) is significantly positive (). This implies that a one-month increase in decreases the odds of mentioning Republicans by for true statements and for false statements. Put differently, the decrease in the odds of mentioning Republicans for false statements is only 46.9% of the decrease for true statements. The coefficient estimates of are not statistically significant (see Column (1) and Column (3) of Table 2), which indicates that there is no corresponding difference in the change in mentions before elections for Democrats between true and false statements.
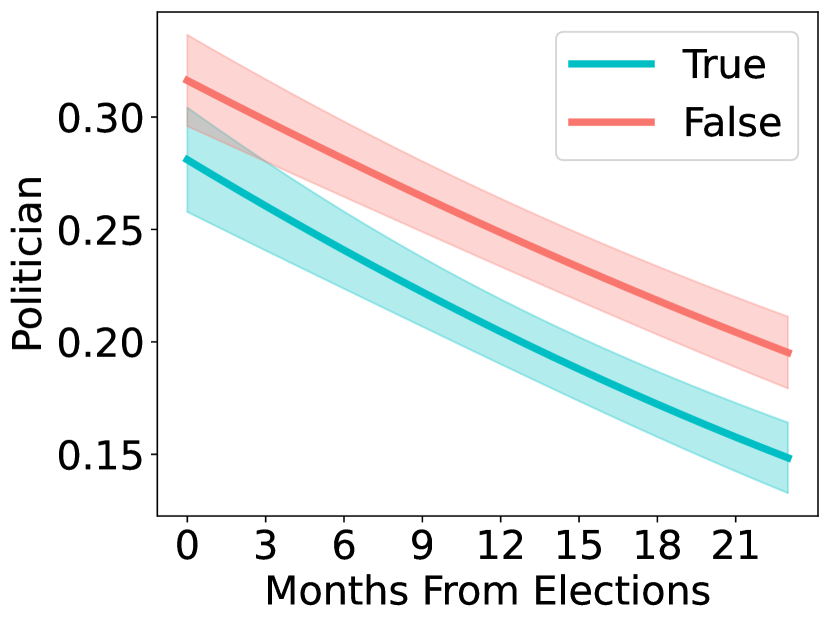
To better examine the interaction , we compare the predicted marginal means between true and false statements (see Fig. 3). Within our logistic regression models, the predicted marginal means indicate the probability of mentioning political elites, Republicans, or Democrats in the fact-checked statements. Fig. 3(a) shows that within the last two months before elections, both true and false statements reach their peaks in mentioning political elites. Additionally, the predicted marginal means for false statements are higher than that for true statements but the differences are not statistically significant. With increasing values of , the predicted marginal means for true and false statements both decrease, while false statements are consistently more likely to mention political elites compared to true statements. In addition, the Average Marginal Effect (AME) of for false statements (, 95% CI: [, ]) is slightly higher than that for true statements (, 95% CI: [, ]), while the difference is not significant at common statistical significance thresholds.
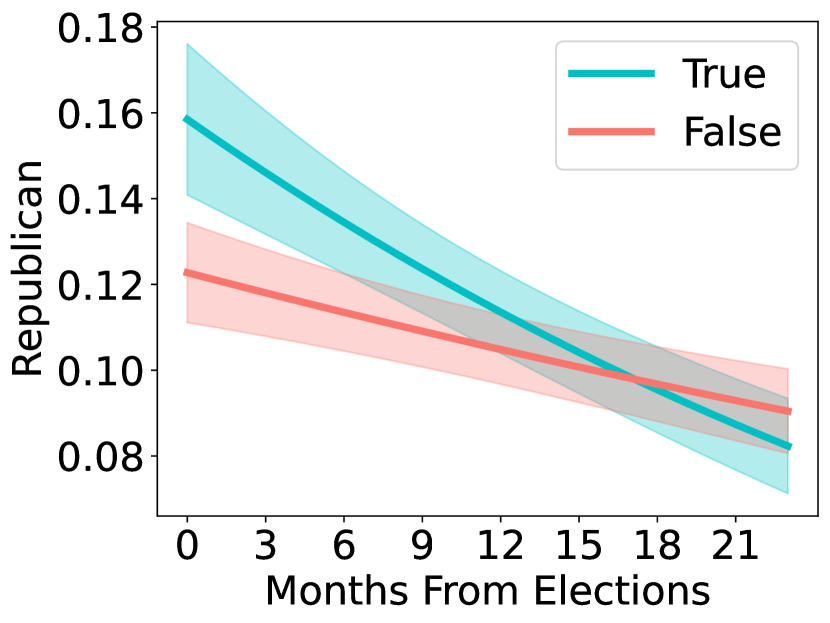
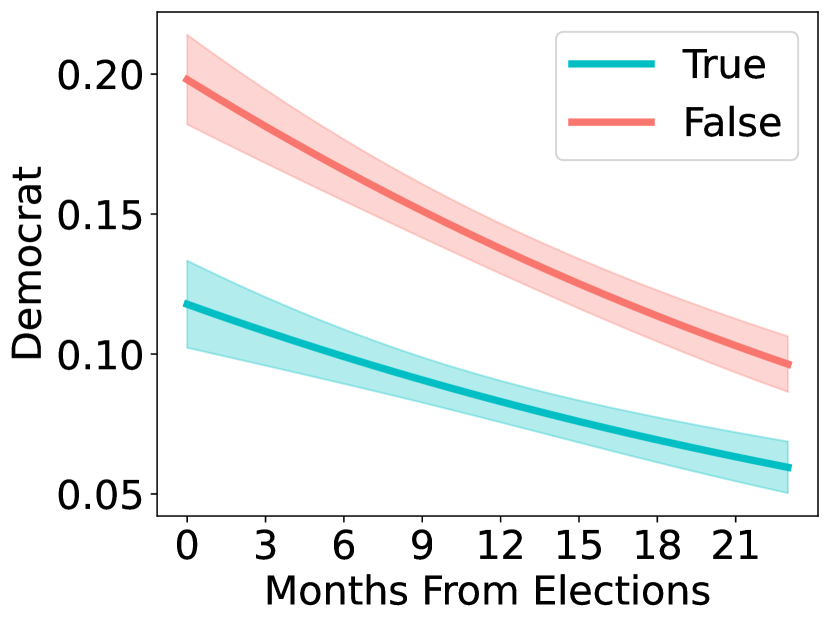
Furthermore, Fig. 3(b) shows that within around 6 months before elections, true statements have a significantly higher probability to mention Republicans than false statements. However, the predicted marginal means for true statements decrease faster compared to false statements. The AME for true statements (, 95% CI: [, ]) is 2.36 times that for false statements (, 95% CI: [, ]). Moreover, Fig. 3(c) shows that false statements consistently have a higher probability of mentioning Democrats compared to true statements. On average, the difference of AMEs between true statements (, 95% CI: [, ]) and false statements (, 95% CI: [, ]) is 0.0019. Given the disparity between the predicted marginal means for true and false statements on mentioning Democrats, the difference in AMEs is likely not large enough to render the interaction significant. Taken together, the analysis of predicted marginal means and AMEs is consistent with the findings of the coefficient analysis (i. e., the interpretation via odds ratios).
4.3. Other-Condemning Emotions (RQ4)
We now analyze whether statements that mention political elites are more likely to carry other-condemning emotions compared to statements that do not mention political elites (RQ4). The regression results are reported in Table 3. We first examine a baseline model without interactions [Column (1)]. The coefficient of is significantly positive (), which means that statements with political elites carry more other-condemning emotions compared to those without political elites. The significantly positive coefficient of also suggests that false statements contain more other-condemning emotions compared to true statements (). However, the coefficient of is not statistically significant, indicating that the expression of other-condemning emotions is not significantly linked to elections.
We further examine the moderating effects of the variables and on . As shown in Column (2) of Table 3, the coefficient of the interaction is not significant, while the coefficient of is significantly positive (). This suggests that false statements carry more other-condemning emotions compared to true statements, regardless of whether political elites are mentioned. In contrast, the coefficient of is significantly negative (), whereas the coefficient of is not significant. This suggests that the expression of other-condemning emotions in statements mentioning political elites decreases as the time period moves further away from elections. Notably, we include and in the model [Column (3) of Table 3] and find that the coefficients of the two variables are both not statistically significant. This indicates that mentioning political elites, either Republican or Democrat, has a similarly positive association with other-condemning emotions.
| (1) | (2) | (3) | |
| Politician | ∗∗∗ | ∗∗∗ | ∗ |
| Republican | |||
| Democrat | |||
| Falsehood | ∗∗ | ∗∗ | ∗∗ |
| Politician Falsehood | |||
| MFE | |||
| Politician MFE | ∗∗ | ∗∗ | |
| Words | ∗∗∗ | ∗∗∗ | ∗∗∗ |
| Year | ✓ | ✓ | ✓ |
| Intercept | ∗∗∗ | ∗∗∗ | ∗∗∗ |
| ∗ , ∗∗ , ∗∗∗ | |||
4.4. Exploratory Analyses & Robustness Checks
Partisan leanings of source statements: Our study suggests that false statements are more likely to mention Democrats than Republicans. However, previous research indicates that widely shared false statements tend to be pro-Republican (i. e., benefiting the political right, right-leaning) (Garrett and Bond, 2021; Chen et al., 2021). This dissonance may possibly be reconciled by false statements being more likely to harness animosity toward Democrats. To test this notion, we further examine the use of other-condemning emotions toward political elites and explore the partisan leanings of true and false statements. Here, we code statements as pro-Republican if they utilize other-condemning emotions toward Democrats; and vice versa (see details in Suppl. B). Concordant with our hypothesis, we find that false statements are indeed more likely to be pro-Republican. Furthermore, pro-Republican false statements are more frequently authored by Republicans (same pattern for pro-Democrat false statements), which is reinforced when elections approach. These results strengthen the interpretation of our findings and suggest that partisans are more likely to harness animosity toward political out-groups in false statements to support their in-groups.
Robustness checks: We conduct several additional checks to validate the robustness of our results: (1) We check for possible multicollinearity issues. The cross-correlations among the independent variables in our analysis are fairly small. Additionally, the variance inflation factors for the independent variables are all close to one; and, thus, well below the critical threshold of four (see details in Suppl. C). Taken together, these findings indicate that multicollinearity is not an issue in our analysis. (2) We repeat our analysis with additional fixed effects for the third-party fact-checking organizations (i. e., for PolitiFact and Snopes); see details in Suppl. D. (3) We repeat our analysis with author-level fixed effects, i. e., we additionally control for the party affiliations of the authors of the fact-checked statements (see details in Suppl. E). (4) We conduct propensity score matching to balance the samples in our dataset and repeat our analysis (see details in Suppl. F). Our findings are persistently supported by all of these checks.
5. Discussion
Relevance: Over the past 30 years, political figures were increasingly mentioned in media representations with the goal of politicizing seemingly apolitical issues (Chinn et al., 2020). While previous research has shown that political elites play a critical role in driving engagement with misinformation (Garrett and Bond, 2021; Mosleh and Rand, 2022; Rathje et al., 2021; Osmundsen et al., 2021; Shin and Thorson, 2017), an understanding of the strategies with which the political left and right attempt to harness animosity toward political elites in their misinformation stories is missing. Here, we contribute to research at the intersection of misinformation and politicization by conducting a large-scale analysis characterizing mentions of political elites in true and false statements on the internet.
Summary of findings: Our key findings are as follows: (i) False statements are, on average, 20% more likely to mention political elites than true statements. (ii) However, there is a partisan asymmetry such that false statements are 88.1% more likely to mention Democrats, but 26.5% less likely to mention Republicans. (iii) Mentions of political elites in false statements reach the highest level during the months preceding elections. (iiii) False statements that mention political elites carry stronger other-condemning emotions. In sum, our results suggest that authors of misinformation frequently harness animosity toward the political out-groups in their misinformation stories.
Implications: Our findings imply that false statements on the internet are frequently politicized. This is concerning as politicization is an antecedent of polarization (Simon et al., 2019). Polarization, in turn, can increase belief in in-group congruent misinformation and partisan bias, which has been found to be a strong and reliable predictor of misinformation susceptibility and sharing (Gawronski et al., 2023; Osmundsen et al., 2021).
We further observe a pronounced role of out-group animosity in politicized misinformation – with significant differences across political leanings. Overall, false statements are significantly more likely to mention Democrats; and more likely to be pro-Republican, as compared to true statements. Additionally, partisans (of either political party) are more likely to harness animosity toward political out-groups in false statements to support their in-groups. Such a high prevalence of misinformation about political out-groups is worrying as it could imply that more in-group members believe and share this kind of misinformation (Rathje et al., 2021; Jenke, 2023). Moreover, our finding that politicized misinformation is more likely to be pro-Republican may help explain the phenomena that the political right in the US tends to be more likely to hold misconceptions (Mosleh and Rand, 2022).
Concerningly, we find a particularly high frequency of politicized misinformation embedding other-condemning emotions during election months. While it is expected that statements mentioning political elites would increase when elections approach (Wolf, 2022; Coelho et al., 2023; Capozzi et al., 2023), our findings also suggest that partisans, either right or left, increasingly harness animosity toward political opponents in their misinformation stories.
From a practical perspective, our findings can help to improve prebunking and debunking strategies to prevent the spread of politicized misinformation. General warnings and redirection strategy, as two typical prebunking interventions, are frequently implemented on popular websites and social media platforms, such as Google Search and TikTok (Ecker et al., 2022; Saltz et al., 2021; Google, 2019). Our findings imply that false statements are more likely to be politicized and frequently carry other-condemning emotions. Hence, platforms could attempt to automatically recognize politicized statements with other-condemning emotions to provide specific warning messages, especially during election periods.
Furthermore, fact-checking is a reliable debunking intervention that can provide specific counter-evidence for widespread online misinformation. Currently, social media platforms, such as Facebook, collaborate with third-party fact-checking organizations to moderate online content (Meta, 2023). Based on the ratings from experts, the platforms can reduce the visibility of misinformation stories or remove them. Additionally, Community-based fact-checking (e. g., X’s Community Notes platform) is a promising fact-checking strategy (Pröllochs, 2022). However, manual fact-checking is a time-consuming process. Thus, platforms could prioritize politicized statements as part of a pre-selection mechanism to speed-up the fact-checking process. Alternatively, machine learning-based fact-checking can automatically process large volumes of statements in a timely manner (Shu et al., 2019), but may not be as reliable as manual fact-checking (Glockner et al., 2022). Explicitly considering features for political elites and other-condemning emotions may help improve the performance of state-of-the-art models in detecting politicized misinformation.
Limitations and future research: Our study poses several limitations and open questions, which provide promising opportunities for future research. First, similar to other observational misinformation studies (Vosoughi et al., 2018; Solovev and Pröllochs, 2022; Chuai and Zhao, 2022; Pröllochs, 2022; Pröllochs et al., 2021), we report associations but refrain from making causal claims. Future research should validate our results with rigorous randomized controlled experiments. Second, this study primarily measures politicization through mentions of political elites, which might miss some other forms of politicization (e. g., non-official political activists). Nevertheless, focusing on mentions of political elites is a common choice in previous research and ensures that we do not overestimate politicization in false statements (Chinn et al., 2020). Third, this paper focuses on statements in English and the context of US politics. More data from other countries and languages need to be collected to foster a more generalized understanding of the link between politicization and misinformation across cultures. Fourth, we observe that political elites are increasingly mentioned during election cycles. However, the effects of politicization on the behaviors of individuals change over time remains to be revealed. Finally, given the important role of out-group animosity in driving the spread of misinformation, this paper focuses on the analysis of other-condemning emotions within true and false statements. Future research may further analyze the role of partisanship in the source statements and collect engagement data (e. g., from social media) to better understand the effect of out-group animosity on the (online) behavior of individuals.
6. Conclusion
Political elites play a critical role in driving engagement with misinformation on the internet. However, an understanding of the strategies with which the political left and right attempt to harness animosity toward political elites in their misinformation stories is missing. Here, we provide a comprehensive analysis of political elites in true and false statements on the internet. We find that false statements are more likely to mention politicians than true statements, especially those affiliated with the Democratic party and during election months. Furthermore, we demonstrate a pronounced role of out-group animosity in the politicization of misinformation. Taken together, our study sheds new light on the connection between online misinformation and political elites; and suggests that authors of misinformation frequently harness animosity toward the political out-group in their misinformation stories. In the next step, our findings may help to improve strategies to prevent the spread of politicized misinformation on the internet.
7. Ethics Statement
This research has received ethical approval from the Ethics Review Panel of the University of Luxembourg (ref. ERP 23-053 REMEDIS). All analyses are based on publicly available data. We declare no competing interests.
Acknowledgements.
This research is supported by the Luxembourg National Research Fund (FNR) and Belgian National Fund for Scientific Research (FNRS), as part of the project REgulatory Solutions to MitigatE DISinformation (REMEDIS), grant ref. INTER_FNRS_21_16554939 _REMEDIS. We sincerely thank Haoye Tian and Xengie Cheng Doan for providing valuable comments for this paper.References
- (1)
- Allcott and Gentzkow (2017) Hunt Allcott and Matthew Gentzkow. 2017. Social media and fake news in the 2016 election. Journal of Economic Perspectives 31, 2 (2017), 211–236.
- Briand et al. (2021) Sylvie C. Briand, Matteo Cinelli, Tim Nguyen, Rosamund Lewis, Dimitri Prybylski, Carlo M. Valensise, Vittoria Colizza, Alberto Eugenio Tozzi, Nicola Perra, Andrea Baronchelli, Michele Tizzoni, Fabiana Zollo, Antonio Scala, Tina Purnat, Christine Czerniak, Adam J. Kucharski, Akhona Tshangela, Lei Zhou, and Walter Quattrociocchi. 2021. Infodemics: A new challenge for public health. Cell 184, 25 (2021), 6010–6014.
- Bär et al. (2023) Dominik Bär, Nicolas Pröllochs, and Stefan Feuerriegel. 2023. New threats to society from free-speech social media platforms. Commun. ACM 66, 10 (2023).
- Capozzi et al. (2023) Arthur Capozzi, Gianmarco De Francisci Morales, Yelena Mejova, Corrado Monti, and André Panisson. 2023. The thin ideology of populist advertising on Facebook during the 2019 EU elections. In Proceedings of the ACM Web Conference 2023 (WWW ’23). Association for Computing Machinery, New York, NY, USA, 2852–2862.
- Chen et al. (2021) Wen Chen, Diogo Pacheco, Kai-Cheng Yang, and Filippo Menczer. 2021. Neutral bots probe political bias on social media. Nature Communications 12, 1 (2021), 5580.
- Chinn et al. (2020) Sedona Chinn, P. Sol Hart, and Stuart Soroka. 2020. Politicization and polarization in climate change news content, 1985-2017. Science Communication 42, 1 (2020), 112–129.
- Chuai et al. (2023) Yuwei Chuai, Haoye Tian, Nicolas Pröllochs, and Gabriele Lenzini. 2023. The roll-out of Community Notes did not reduce engagement with misinformation on Twitter. arXiv:2307.07960.
- Chuai and Zhao (2022) Yuwei Chuai and Jichang Zhao. 2022. Anger can make fake news viral online. Frontiers in Physics 10 (2022), 970174.
- Coelho et al. (2023) Bruno Coelho, Tobias Lauinger, Laura Edelson, Ian Goldstein, and Damon McCoy. 2023. Propaganda política pagada: Exploring U.S. political Facebook ads en Español. In Proceedings of the ACM Web Conference 2023 (WWW ’23). Association for Computing Machinery, New York, NY, USA, 2742–2753.
- Dastani and Pankov (2017) Mehdi Dastani and Alexander Pankov. 2017. Other-condemning moral emotions: Anger, contempt and disgust. ACM Transactions on Internet Technology 17, 1 (2017), 4:1–4:24.
- Drolsbach and Pröllochs (2023a) Chiara Drolsbach and Nicolas Pröllochs. 2023a. Diffusion of community fact-checked misinformation on Twitter. Proceedings of the ACM on Human-Computer Interaction 7, CSCW2 (2023), 267.
- Drolsbach and Pröllochs (2023b) Chiara Patricia Drolsbach and Nicolas Pröllochs. 2023b. Believability and harmfulness shape the virality of misleading social media posts. In Proceedings of the ACM Web Conference 2023 (WWW ’23). Association for Computing Machinery, New York, NY, USA, 4172–4177.
- Druckman (2022) James N. Druckman. 2022. Threats to science: Politicization, misinformation, and inequalities. The ANNALS of the American Academy of Political and Social Science 700, 1 (2022), 8–24.
- Ecker et al. (2022) Ullrich KH Ecker, Stephan Lewandowsky, John Cook, Philipp Schmid, Lisa K Fazio, Nadia Brashier, Panayiota Kendeou, Emily K Vraga, and Michelle A Amazeen. 2022. The psychological drivers of misinformation belief and its resistance to correction. Nature Reviews Psychology 1, 1 (2022), 13–29.
- Enders et al. (2022) Adam M. Enders, Joseph Uscinski, Casey Klofstad, and Justin Stoler. 2022. On the relationship between conspiracy theory beliefs, misinformation, and vaccine hesitancy. Plos One 17, 10 (2022), e0276082.
- Flores et al. (2022) Alexandra Flores, Jennifer C. Cole, Stephan Dickert, Kimin Eom, Gabriela M. Jiga-Boy, Tehila Kogut, Riley Loria, Marcus Mayorga, Eric J. Pedersen, Beatriz Pereira, Enrico Rubaltelli, David K. Sherman, Paul Slovic, Daniel Västfjäll, and Leaf Van Boven. 2022. Politicians polarize and experts depolarize public support for COVID-19 management policies across countries. PNAS 119, 3 (2022), e2117543119.
- Garrett and Bond (2021) R. Kelly Garrett and Robert M. Bond. 2021. Conservatives’ susceptibility to political misperceptions. Science Advances 7, 23 (2021), eabf1234.
- Gawronski et al. (2023) Bertram Gawronski, Nyx L Ng, and Dillon M Luke. 2023. Truth sensitivity and partisan bias in responses to misinformation. Journal of Experimental Psychology (2023).
- Geissler et al. (2023) Dominique Geissler, Dominik Bär, Nicolas Pröllochs, and Stefan Feuerriegel. 2023. Russian propaganda on social media during the 2022 invasion of Ukraine. EPJ Data Science 12, 1 (2023), 1–20.
- Glockner et al. (2022) Max Glockner, Yufang Hou, and Iryna Gurevych. 2022. Missing counter-evidence renders NLP fact-checking unrealistic for misinformation. In Proceedings of the 2022 Conference on Empirical Methods in Natural Language Processing. Association for Computational Linguistics, Abu Dhabi, United Arab Emirates, 5916–5936.
- González-Bailón et al. (2022) Sandra González-Bailón, Valeria d’Andrea, Deen Freelon, and Manlio De Domenico. 2022. The advantage of the right in social media news sharing. PNAS Nexus 1, 3 (2022), pgac137.
- Google (2019) Google. 2019. Fighting disinformation across our products. https://blog.google/around-the-globe/google-europe/fighting-disinformation-across-our-products/
- Gradoń et al. (2021) Kacper T. Gradoń, Janusz A. Hołyst, Wesley R. Moy, Julian Sienkiewicz, and Krzysztof Suchecki. 2021. Countering misinformation: A multidisciplinary approach. Big Data & Society 8, 1 (2021), 20539517211013848.
- Green et al. (2022) Jon Green, William Hobbs, Stefan McCabe, and David Lazer. 2022. Online engagement with 2020 election misinformation and turnout in the 2021 Georgia runoff election. PNAS 119, 34 (2022), e2115900119.
- Hart et al. (2020) P. Sol Hart, Sedona Chinn, and Stuart Soroka. 2020. Politicization and polarization in COVID-19 news coverage. Science Communication 42, 5 (2020), 679–697.
- Hartman et al. (2022) Rachel Hartman, Will Blakey, Jake Womick, Chris Bail, Eli J. Finkel, Hahrie Han, John Sarrouf, Juliana Schroeder, Paschal Sheeran, Jay J. Van Bavel, Robb Willer, and Kurt Gray. 2022. Interventions to reduce partisan animosity. Nature Human Behaviour 6, 9 (2022), 1194–1205.
- Heiberger et al. (2022) Raphael Heiberger, Silvia Majó-Vázquez, Laia Castro Herrero, Rasmus K. Nielsen, and Frank Esser. 2022. Do not blame the media! The role of politicians and parties in fragmenting online political debate. The International Journal of Press/Politics 27, 4 (2022), 910–941.
- Horta Ribeiro et al. (2023) Manoel Horta Ribeiro, Justin Cheng, and Robert West. 2023. Automated content moderation increases adherence to community guidelines. In Proceedings of the ACM Web Conference 2023 (WWW ’23). Association for Computing Machinery, New York, NY, USA, 2666–2676.
- Jakubik et al. (2023) Johannes Jakubik, Michael Vössing, Nicolas Pröllochs, Dominik Bär, and Stefan Feuerriegel. 2023. Online emotions during the storming of the U.S. Capitol: Evidence from the social media network Parler. Proceedings of the International AAAI Conference on Web and Social Media 17 (2023), 423–434.
- Jenke (2023) Libby Jenke. 2023. Affective polarization and misinformation belief. Political Behavior (2023), 1–60.
- Lazer et al. (2018) David MJ Lazer, Matthew A Baum, Yochai Benkler, Adam J Berinsky, Kelly M Greenhill, Filippo Menczer, Miriam J Metzger, Brendan Nyhan, Gordon Pennycook, David Rothschild, and others. 2018. The science of fake news. Science 359, 6380 (2018), 1094–1096.
- Lin and Chung (2020) Yu-Ru Lin and Wen-Ting Chung. 2020. The dynamics of Twitter users’ gun narratives across major mass shooting events. Humanities and Social Sciences Communications 7, 1 (2020), 1–16.
- Mathur and Moschis (2022) Anil Mathur and George P. Moschis. 2022. How do information sources shape voters’ political views?: Comparing mainstream and social-media effects on Democrats, Republicans, and the undecided. Journal of Advertising Research 62, 2 (2022), 176–195.
- Meta (2023) Meta. 2023. Meta’s third-party fact-checking program. https://www.facebook.com/formedia/mjp/programs/third-party-fact-checking
- Miani et al. (2022) Alessandro Miani, Thomas Hills, and Adrian Bangerter. 2022. Interconnectedness and (in)coherence as a signature of conspiracy worldviews. Science Advances 8, 43 (2022), eabq3668.
- Mohammad and Turney (2013) Saif M. Mohammad and Peter D. Turney. 2013. Crowdsourcing a word–emotion association lexicon. Computational Intelligence 29, 3 (2013), 436–465.
- Mosleh and Rand (2022) Mohsen Mosleh and David G. Rand. 2022. Measuring exposure to misinformation from political elites on Twitter. Nature Communications 13, 1 (2022), 7144.
- Nikolov et al. (2021) Dimitar Nikolov, Alessandro Flammini, and Filippo Menczer. 2021. Right and left, partisanship predicts (asymmetric) vulnerability to misinformation. Harvard Kennedy School Misinformation Review (2021).
- Osmundsen et al. (2021) Mathias Osmundsen, Alexander Bor, Peter Bjerregaard Vahlstrup, Anja Bechmann, and Michael Bang Petersen. 2021. Partisan polarization is the primary psychological motivation behind political fake news sharing on Twitter. American Political Science Review 115, 3 (2021), 999–1015.
- Pierri et al. (2022) Francesco Pierri, Brea L. Perry, Matthew R. DeVerna, Kai-Cheng Yang, Alessandro Flammini, Filippo Menczer, and John Bryden. 2022. Online misinformation is linked to early COVID-19 vaccination hesitancy and refusal. Scientific Reports 12, 1 (2022), 5966.
- Plutchik (1991) Robert Plutchik. 1991. The emotions. University Press of America.
- Pröllochs (2022) Nicolas Pröllochs. 2022. Community-based fact-checking on Twitter’s Birdwatch platform. Proceedings of the International AAAI Conference on Web and Social Media 16 (2022), 794–805.
- Pröllochs et al. (2021) Nicolas Pröllochs, Dominik Bär, and Stefan Feuerriegel. 2021. Emotions explain differences in the diffusion of true vs. false social media rumors. Scientific Reports 11, 1 (2021), 22721.
- Raponi et al. (2022) Simone Raponi, Zeinab Khalifa, Gabriele Oligeri, and Roberto Di Pietro. 2022. Fake news propagation: A review of epidemic models, datasets, and insights. ACM Transactions on the Web 16, 3 (2022), 12:1–12:34.
- Rastogi (2022) Ananya Rastogi. 2022. Modeling and combating misinformation spread. Nature Computational Science 2, 7 (2022), 413–413.
- Rathje et al. (2021) Steve Rathje, Jay J. Van Bavel, and Sander van der Linden. 2021. Out-group animosity drives engagement on social media. PNAS 118, 26 (2021), e2024292118.
- Raymond et al. (2022) Cameron Raymond, Isaac Waller, and Ashton Anderson. 2022. Measuring alignment of online grassroots political communities with political campaigns. Proceedings of the International AAAI Conference on Web and Social Media 16 (2022), 806–816.
- Saltz et al. (2021) Emily Saltz, Soubhik Barari, Claire Leibowicz, and Claire Wardle. 2021. Misinformation interventions are common, divisive, and poorly understood. Harvard Kennedy School Misinformation Review (2021).
- Saveski et al. (2022) Martin Saveski, Doug Beeferman, David McClure, and Deb Roy. 2022. Engaging politically diverse audiences on social media. Proceedings of the International AAAI Conference on Web and Social Media 16 (2022), 873–884.
- Shin and Thorson (2017) Jieun Shin and Kjerstin Thorson. 2017. Partisan selective sharing: The biased diffusion of fact-checking messages on social media. Journal of Communication 67, 2 (2017), 233–255.
- Shu et al. (2019) Kai Shu, Limeng Cui, Suhang Wang, Dongwon Lee, and Huan Liu. 2019. DEFEND: Explainable fake news detection. In Proceedings of the 25th ACM SIGKDD International Conference on Knowledge Discovery & Data Mining (KDD ’19). Association for Computing Machinery, New York, NY, USA, 395–405.
- Simon et al. (2019) Bernd Simon, Klaus Michael Reininger, Christoph Daniel Schaefer, Steffen Zitzmann, and Sabrina Krys. 2019. Politicization as an antecedent of polarization: Evidence from two different political and national contexts. British Journal of Social Psychology 58, 4 (2019), 769–785.
- Solovev and Pröllochs (2022) Kirill Solovev and Nicolas Pröllochs. 2022. Moral emotions shape the virality of COVID-19 misinformation on social media. In Proceedings of the ACM Web Conference 2022 (WWW ’22). Association for Computing Machinery, New York, NY, USA, 3706–3717.
- Solovev and Pröllochs (2023) Kirill Solovev and Nicolas Pröllochs. 2023. Moralized language predicts hate speech on social media. PNAS Nexus 2, 1 (2023), pgac281.
- Suciu (2022) Peter Suciu. 2022. Bots and misinformation on social media could undermine the midterm elections. https://www.forbes.com/sites/petersuciu/2022/11/02/bots-and-misinformation-on-social-media-could-undermine-the-midterm-elections/
- Vosoughi et al. (2018) Soroush Vosoughi, Deb Roy, and Sinan Aral. 2018. The spread of true and false news online. Science 359, 6380 (2018), 1146–1151.
- Wolf (2022) Zachary B. Wolf. 2022. Misinformation and hate are trending in this election year. https://www.cnn.com/2022/10/31/politics/misinformation-midterms-antisemitism-what-matters/index.html
- Wormwood et al. (2019) Jolie Baumann Wormwood, Yu-Ru Lin, Spencer K. Lynn, Lisa Feldman Barrett, and Karen S. Quigley. 2019. Psychological impact of mass violence depends on affective tone of media content. Plos One 14, 4 (2019), e0213891.
- Wu et al. (2019) Liang Wu, Fred Morstatter, Kathleen M. Carley, and Huan Liu. 2019. Misinformation in social media: Definition, manipulation, and detection. ACM SIGKDD Explorations Newsletter 21, 2 (2019), 80–90.
Supplementary Materials
Appendix A Dataset Overview
An overview of the dataset used in this study is shown in Table S1.
| (1) | (2) | (3) | |
| All | PolitiFact | Snopes | |
| Number of Statements | 35,014 | 22,561 | 12,453 |
| Observation Start Date | 01/02/2008 | 01/02/2008 | 01/04/2008 |
| Observation End Date | 07/19/2023 | 07/19/2023 | 07/17/2023 |
| Number of Fact-Checkers | 608 | 585 | 23 |
| Number of Topics | 202 | 152 | 66 |
| Politician | 9,308 | 6,363 | 2,945 |
| (26.6%) | (28.2%) | (23.6%) | |
| Republican | 4,403 | 2,881 | 1,522 |
| (12.6%) | (12.8%) | (12.2%) | |
| Democrat | 4,455 | 3,207 | 1,248 |
| (12.7%) | (14.2%) | (10.0%) | |
| Veracity | |||
| True | 9,616 | 6,199 | 3,417 |
| (27.5%) | (27.5%) | (27.4%) | |
| False | 25,398 | 16,362 | 9,036 |
| (72.5%) | (72.5%) | (72.6%) | |
| Months From Elections | 11.603 | 11.078 | 12.555 |
| (0.039) | (0.048) | (0.067) | |
| Other-Condemning Emotions | 0.096 | 0.092 | 0.103 |
| (0.001) | (0.001) | (0.002) | |
| Words | 18.376 | 18.237 | 18.628 |
| (0.042) | (0.054) | (0.064) |
Appendix B Partisan Leanings of Source Statements
We explore the partisan leanings of true and false statements. Here, we code statements as pro-Republican if they utilize other-condemning emotions toward Democrats; and vice versa. Formally, we define a dependent variable as:
| (3) |
where means that the statement is right-leaning (pro-Republican), and means that the statement is left-leaning (pro-Democrat). Subsequently, we analyze the partisan leaning of false statements [Column (1) of Table S2]. Notably, PolitiFact provides author information for the statements. We can partially identify the political elites who posted the statements based on our politician database and further explore how political elites politicize their statements [Column (2) and (3) in Table S2].
The coefficient estimates of are all significantly positive across the columns [ in Column (1), in Column (2), in Column (3)]. It indicates that false statements are more pro-Republican and more likely to use other-condemning emotions to harness animosity toward Democrats, compared to true statements. The predicted marginal means for partisan leanings in true and false statements are (95% CI: [, ]) and (95% CI: [, ]), respectively. This indicates that, on average, false statements are pro-Republican, whereas true statements are pro-Democrat.
The coefficients of are significantly negative in Column (2) () and Column (3) (), which suggests that statements from Democrats are more pro-Democrat, compared to statements not from Democrats. The coefficients of are significantly positive in Column (2) () and Column (3) (), which indicates that statements from Republicans are more pro-Republican, compared to statements not from Republicans. Additionally, the coefficient of is significantly negative (), and the coefficient of is significantly positive (). This indicates that the in-group leanings for Republicans and Democrats are stronger in false statements than in true statements. The coefficient for is significantly positive (), and the coefficient of is significantly negative (). This suggests that the tendency that the political left and right harness animosity toward political out-groups is strengthened when elections approach.
| (1) | (2) | (3) | (4) | |
| Falsehood | ∗∗∗ | ∗∗∗ | ∗∗∗ | |
| MFE | ||||
| ∗∗∗ | ∗∗∗ | ∗∗∗ | ||
| ∗∗∗ | ∗∗∗ | ∗∗∗ | ||
| Falsehood | ∗∗∗ | |||
| Falsehood | ∗ | |||
| MFE | ∗∗∗ | ∗∗∗ | ||
| MFE | ∗∗∗ | ∗∗∗ | ||
| Words | ||||
| Year | ✓ | ✓ | ✓ | |
| Intercept | ∗∗∗ | ∗∗∗ | ∗∗∗ | ∗ |
| ∗ , ∗∗ , ∗∗∗ . | ||||
Furthermore, we specifically analyze how political elites harness out-group animosity in their misinformation stories [Column (4) of Table S2]. The predicted marginal mean for partisan leaning of false statements from Republicans is (95% CI: [, ]), while the predicted marginal mean for partisan leaning of false statements from Democrats is (95% CI: [, ]). The magnitudes of the predicted marginal means in false statements from Democrats and Republicans are similar, which indicates that the pattern of harnessing animosity toward the political out-group is shared by both Republicans and Democrats in their misinformation stories.
Appendix C Cross-Correlations & Variance Inflation Factors
The cross-correlations of the independent variables and their variance inflation factors are shown in Table S3 and Table S4, respectively.
| Politician | Falsehood | MFE | Words | |
| Politician | ||||
| Falsehood | ||||
| MFE | ||||
| Words |
| VIF | 1/VIF | |
| Politician | ||
| Falsehood | ||
| MFE | ||
| Words |
Appendix D Organization-Specific Fixed Effects
We repeat our analysis with organization-specific fixed effects. The results are reported in Table S5 and Table S6.
| (1) | (2) | (3) | |
| Politician | Republican | Democrat | |
| Falsehood | ∗∗∗ | ∗∗∗ | ∗∗∗ |
| MFE | ∗∗∗ | ∗∗∗ | ∗∗∗ |
| Falsehood MFE | ∗∗∗ | ||
| Words | ∗∗∗ | ∗∗∗ | ∗∗∗ |
| Year | ✓ | ✓ | ✓ |
| Org | ✓ | ✓ | ✓ |
| Intercept | ∗∗∗ | ∗∗∗ | ∗∗∗ |
| ∗ , ∗∗ , ∗∗∗ . | |||
| (1) | (2) | (3) | |
| Politician | ∗∗∗ | ∗∗∗ | ∗ |
| Republican | |||
| Democrat | |||
| Falsehood | ∗∗ | ∗∗ | ∗∗ |
| Politician Falsehood | |||
| MFE | |||
| Politician MFE | ∗∗ | ∗∗ | |
| Words | ∗∗∗ | ∗∗∗ | ∗∗∗ |
| Year | ✓ | ✓ | ✓ |
| Org | ✓ | ✓ | ✓ |
| Intercept | ∗∗∗ | ∗∗∗ | ∗∗∗ |
| ∗ , ∗∗ , ∗∗∗ . | |||
Appendix E Author-Specific Fixed Effects
We repeat our analysis with author-specific fixed effects to control for the types of authors, i. e., Republicans, Democrats, or others. The results are reported in Table S7 and Table S8.
| (1) | (2) | (3) | |
| Politician | Republican | Democrat | |
| Falsehood | ∗∗∗ | ∗ | ∗∗∗ |
| MFE | ∗∗∗ | ∗∗∗ | ∗∗∗ |
| Falsehood MFE | ∗∗∗ | ||
| Words | ∗∗∗ | ∗∗∗ | ∗∗∗ |
| Year | ✓ | ✓ | ✓ |
| Author | ✓ | ✓ | ✓ |
| Intercept | ∗∗∗ | ∗∗∗ | ∗∗∗ |
| ∗ , ∗∗ , ∗∗∗ . | |||
| (1) | (2) | (3) | |
| Politician | ∗∗∗ | ∗∗∗ | ∗ |
| Republican | |||
| Democrat | |||
| Falsehood | ∗ | ∗ | ∗ |
| Politician Falsehood | |||
| MFE | |||
| Politician MFE | ∗∗ | ∗∗ | |
| Words | ∗∗∗ | ∗∗∗ | ∗∗∗ |
| Year | ✓ | ✓ | ✓ |
| Author | ✓ | ✓ | ✓ |
| Intercept | ∗∗∗ | ∗∗∗ | ∗∗∗ |
| ∗ , ∗∗ , ∗∗∗ . | |||
Appendix F Propensity Score Matching
| (1) | (2) | (3) | |
| Politician | Republican | Democrat | |
| Falsehood | ∗∗∗ | ∗∗∗ | |
| MFE | ∗∗∗ | ∗∗∗ | ∗∗∗ |
| Falsehood MFE | |||
| Words | ∗∗∗ | ∗∗∗ | ∗∗∗ |
| Year | ✓ | ✓ | ✓ |
| Org | ✓ | ✓ | ✓ |
| Author | ✓ | ✓ | ✓ |
| Intercept | ∗∗∗ | ∗∗∗ | ∗∗∗ |
| ∗ , ∗∗ , ∗∗∗ . | |||
We conduct propensity score matching for true and false statements to check the robustness of the regression results for RQ1–3. Specifically, we match true and false statements based on the pre-defined variables, i. e., , , yearly dummies, organization-specific dummies, and author-specific dummies. With the caliper of 0.001, “common” support, and “noreplacement” settings, we discard false statements and achieve all biases lower than 0.05 across the independent variables. The regression results based on the matched true and false samples are reported in Table S9. Additionally, to validate the results for RQ4, we conduct the same propensity score matching for statements mentioning political elites and statements not mentioning political elites according to the pre-defined variables: , , , yearly dummies, organization-specific dummies, and author-specific dummies. We achieve all biases lower than 0.05 by discarding 69 statements that mention political elites. We regress the matched statements again for predicting other-condemning emotions and report the results in Table S10.
| (1) | (2) | (3) | |
| Politician | ∗∗∗ | ∗∗∗ | ∗ |
| Republican | |||
| Democrat | |||
| Falsehood | ∗ | ∗ | ∗ |
| Politician Falsehood | |||
| MFE | |||
| Politician MFE | ∗∗ | ∗∗ | |
| Words | ∗∗∗ | ∗∗∗ | ∗∗∗ |
| Year | ✓ | ✓ | ✓ |
| Org | ✓ | ✓ | ✓ |
| Author | ✓ | ✓ | ✓ |
| Intercept | ∗∗∗ | ∗∗∗ | ∗∗∗ |
| ∗ , ∗∗ , ∗∗∗ . | |||