Measuring Sources of Bias in Diving Competitions
Abstract
We examine bias in diving scores from high school meets. Usually, examination of bias in sports where judges assign subjective scores has been examined in terms of nationalistic bias, where judges award favorable scores to athletes from their own home countries. In this work, bias is defined as difference between the judge’s scores for a given meet and the ability of the diver. As a measure of the ability of a diver, we calculate a mean score for all dives and all meets in which the diver has participated. We call this mean score a diver’s competency score. We use the difference between judges’ scores within a given meet and the diver’s competency to define a discrepancy: the difference between a judge’s estimation of a diver’s ability and their true ability. We examine this discrepancy with respect to age, gender, direction of dive, position of dive, round of competition, and dive difficulty.
Key Words: scoring bias, subjective scores, springboard diving competitions
Introduction
Sports analytics usually bring to mind analysis of outcomes associated with football, soccer, basketball, hockey, and baseball. While it might not generate as much revenue as the “big 5”, diving is a beautiful sport and is one of the most watched Olympic sports, along with gymnastics and track & field. It is also in the top 3 sports searched on the Internet during the Olympics, and has the second most newspaper articles published during the Olympics [12]. Diving, swimming, synchronized diving, and water polo are often lumped together as “aquatics”. Diving is also a popular high school sport and collegiate sport, and aquatics as a whole is ranked as the 5th easiest scholarship to get for both men and women, just behind football and baseball for men and soccer and field hockey for women [8]. Generally, 85% of the 14 total D1 scholarships are allocated to the swim team and 15% to the dive team [2]. For its popularity, scores in diving have not been well studied.
Diving, like gymnastics, ice skating and ski-jumping, is scored by a panel of judges; therefore, there is a subjective element to a diving score. Regardless of competition level, dives are scored on a scale of 0 to 10 in increments of 0.5, with 0 being a failed dive, and 10 being a perfect dive. Most high school scores are in the range of 4-7. A panel of an odd number of judges, usually 5 although sometimes 3, 7, or 9, gives their scores independently for each diver for each round of a competition. The exception to independent scoring is a failed dive. To fail a dive and give the diver a score of 0, the entire panel of judges must agree to do so. The net score for each diver in each round is the sum of the three judges’ scores in the middle of the sorted scores per round, and the award for the round is the net score multiplied by the degree of difficulty (DD) of the dive. The DD is determined by the Fédération Internationale de Natation (FINA, the international governing body for aquatic sports), and is not up for discussion. The meet score for each diver is the sum of their awards for each round. The diver with the largest sum is the winner of the meet.
More prestigious competitions typically have 11 rounds, in which a diver must perform 2 dives in each direction (forward, backward, reverse, inward, or twist) and an dive of the diver’s choice [6]. More precisely, the diver performs a series of voluntary dives and optional dives. The voluntary dives consist of one dive from each of the 5 diving directions. The sum of the DDs for the voluntary dives must be . The six optional dives consist of one dive from each of the 5 diving directions with one direction represented twice. The DD when added for the optional dives must be a minimum of 11.5 for girls and 12.0 for boys. In addition, all five groups must be represented in the first 8 rounds of diving and all 11 dives must be totally different dives [6]. For example, performing a 1.5 forward somersault in a pike position is the same as performing a 1.5 forward somersault in the tuck position; thus this combination would not be permissible. However, a backward 1.5 somersault in the tuck position and a forward 1.5 somersault in the tuck position are different dives.
Measuring Bias in Judges’ Scores
When considering bias in judging, the mind goes to thoughts of national bias in the Olympics or other world championships - where a judge favors a diver from his or her own country. There are plenty of recent scandals in ice skating [3] and gymnastics [13] to feed the imagination. There has been previous work showing evidence of nationalistic bias in diving in the 2000 Olympics [5, 4]. The data considered for this paper are from high school competitions, and there is no information on the judge affiliation; therefore, it is not possible to spin juicy tales about bias between rival high schools. However, nationalistic bias is not the only type of bias. FINA warns against reputation bias, round bias, dive-order bias, difficulty bias, seeding bias, and conformity bias [1]. This paper focuses on difficulty bias, which is typically defined as awarding a diver more points for a more difficult dive, and round bias, where a diver’s scores systematically do not reflect the diver’s ability as a competition wears on.
Difficulty bias and round bias are defined in terms of a judges’ mark that does not reflect a diver’s ability. In other words, the definition of statistical bias applies, as given by , where represents a diver’s true ability and represents an estimate of a diver’s ability. Ideally, the expected value of the difference of the diver’s ability and the estimate of that ability is 0. In order to estimate the score bias, we need a reasonable estimate for a diver’s true ability, .
Measuring overall diver ability is a tricky thing. Diving, especially high school diving, does not have a technical judging panel, as in ice skating or gymnastics, to assure that the athletes do the jumps and flips that a routine demands. In high school competitions, there are no announcers examining every frame of an instant replay. There is research using videos from a diving competition to measure characteristics of dives that typically differentiate a good dive from a bad one, such as height of splash, distance of entry from the end of the board, and angle of entry [9]. That work showed that the judges’ scores are closely aligned with quantitative values measured from the video evidence, and only in one instance of multiple dives would the ordinal standing of the divers have been affected in a way that mattered by a difference between scores using only the video evidence and versus scores given by the judges. In other words, trained diving judges are generally quite accurate when it comes to judging dive quality within a diving competition. The same work also showed that untrained diving judges are unreliable when it comes to qualitative scores matching quantitative measurements [9].
For the current study, there is no video evidence or panel of technical judges. To define diver ability, the mean net score for every dive of each diver over all competitions in which that diver has competed is computed. There is a precedent in several previous papers on diving, ice skating, and gymnastics for using the median score as a measure of ability [5, 4, 10]; however, we use the mean score for this work as the there is generally little variability in scores for each round. We call this average measure per diver the “competency” score, , for that diver. Mathematically,
| (1) |
where is the number of meets in which a diver, denoted by , participates between 2017 and 2022, which is the time span of the data. is the number of rounds in the dive meet. Usually . The data set from divemeets.com contains information on 39105 dives from 261 unique meets, 1911 unique athletes, and 86 unique dives. All divers are high school divers. As a measure of bias, we measure the discrepancy,
| (2) |
where is defined in Equation 1 and the net score is the sum of the middle three scores given by judges for a particular diver (d) in a particular meet (m) during a particular round (r).
The goal of this study is to determine whether discrepancy is independent of age, gender, round, and difficulty. These items are those over which a diver has little or no control. A positive discrepancy indicates that the judges’ net score is greater than the diver’s ability, which indicates lenient judging. A negative discrepancy indicates that the judges’ score is less than the ability of the diver, which indicates strict judging. For unbiased judging, discrepancy is independent of any characteristic that the diver cannot control.
Results
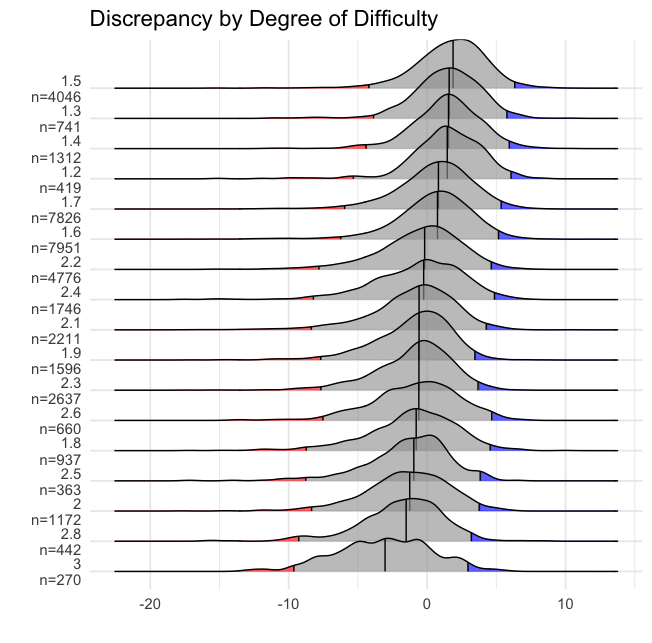
Potential explanatory variables for discrepancy were gender, age, degree of difficulty, dive direction, and dive position. For all meets, divers, and dives, ridgeline plots are used to show the distribution of the discrepancy according to gender, age, dive position, dive direction, and DD (Figures 1(a) - 3). The y axis for each plot gives different categories for an explanatory variable. The x-axis is the discrepancy, which is typically in a range of -25 to 15. The black line in the middle of each curve is the median discrepancy, the red area marks the percentile for the discrepancies, and the blue area marks the percentile for the discrepancies. For all ridgeline plots, the categories are ordered by the median discrepancy. For each category, the total number of dives is given under the category name on the vertical axis.
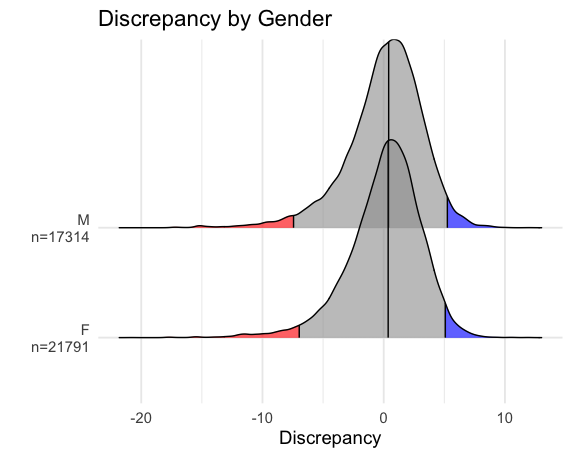
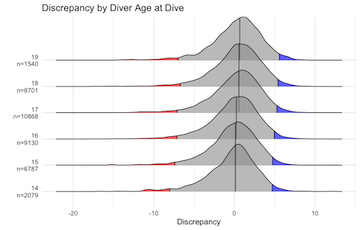
Figure 1(a) shows a plot of the distribution of the discrepancy for male and female divers. The black lines in the middle of each curve correspond to the median discrepancy. The medians are aligned at 0 for both genders; therefore, there is no evidence of gender bias as a main effect. Figure 1(b) shows the discrepancy plotted for each age. There is a slight shift to the right as the divers age. For younger divers, the scores are unbiased. The shift might indicate improvement in diver ability with experience in diving as much as it would indicate favoritism for older divers.
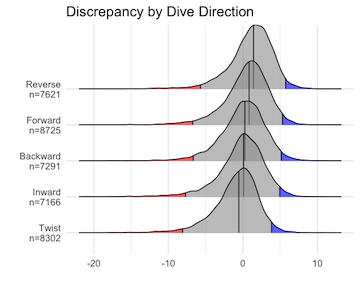
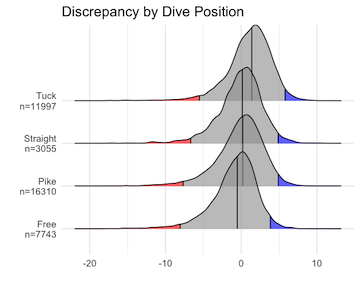
Figures 2(a) and 2(b) show the distribution of discrepancy scores for dive directions and dive positions, respectively. The five directions are forward, backward, inward, reverse, and twist. To perform a forward dive, the diver faces the pool on take off and rotates forward. For a reverse dive, the diver faces the pool on take off and rotates backward toward the board (the opposite direction of a forward dive). To perform a backward dive, the diver turns his or her back to the pool and rotates backward. An inward dive is performed by turning one’s back to the pool and rotating toward the board on take off. Generally, reverse and inward dives are considered more difficult than forward and backward dives in the sense that a dive in a forward direction will have a lower degree of difficulty than that same dive in a reverse direction. The median discrepancy (bias) for all directions is close to 0, with a slightly negative discrepancy for twisting dives and a slightly positive discrepancy for reverse dives.
The positions are tuck, straight, pike, and free. Free is most often reserved for twisting dives, where the diver is free to twist in any position. Generally, the pike and straight positions are considered more difficult. For example, a 1.5 forward somersault in a tuck position has a DD of 1.5, while a 1.5 forward somersault in a pike position has a DD of 1.7. Again, there is little deviation from 0 for any position, except for the tuck position. There is evidence of judges scoring dives in the tuck position more leniently.
Difficulty Bias
Dive position and dive direction are associated with degree of difficulty (DD). FINA assigns DD for each direction and position of dive. The lowest DD is 1.0 (for a straight forward jump into the pool) and the highest in the divemeets.com data set is a 3.4 (a reverse dive with 2.5 somersaults in a tuck position). For further examination of DD, the values of the DD assigned by FINA were plotted on the vertical axis with the discrepancy on the horizontal axis (Figure 3). Because few dives at this level have DD greater than 2.7, any dive with a DD between of 2.7 to 2.9 was assigned to a DD of 2.8, and any dive with DD of 3.0 or greater was assigned a DD of 3.0. Easier dives, with degrees of difficulty between 1.2 and 1.6, are more leniently judged, while more difficult dives, with DD of 2.1 or greater are more harshly judged. It is not strictly true that more difficult dives are more harshly judged, as dives with DD of 1.8, for example, are judged more harshly than dives with a DD or 2.3 or 2.6. Therefore, there is evidence of difficulty bias, but not in the direction originally assumed. It is presumed that more difficult dives are judged more leniently, but this does not seem to be the case. In other words, from these data, it appears that it is better to do a less difficult dive well than it is to attempt a difficult dive and do it poorly.
Round Bias
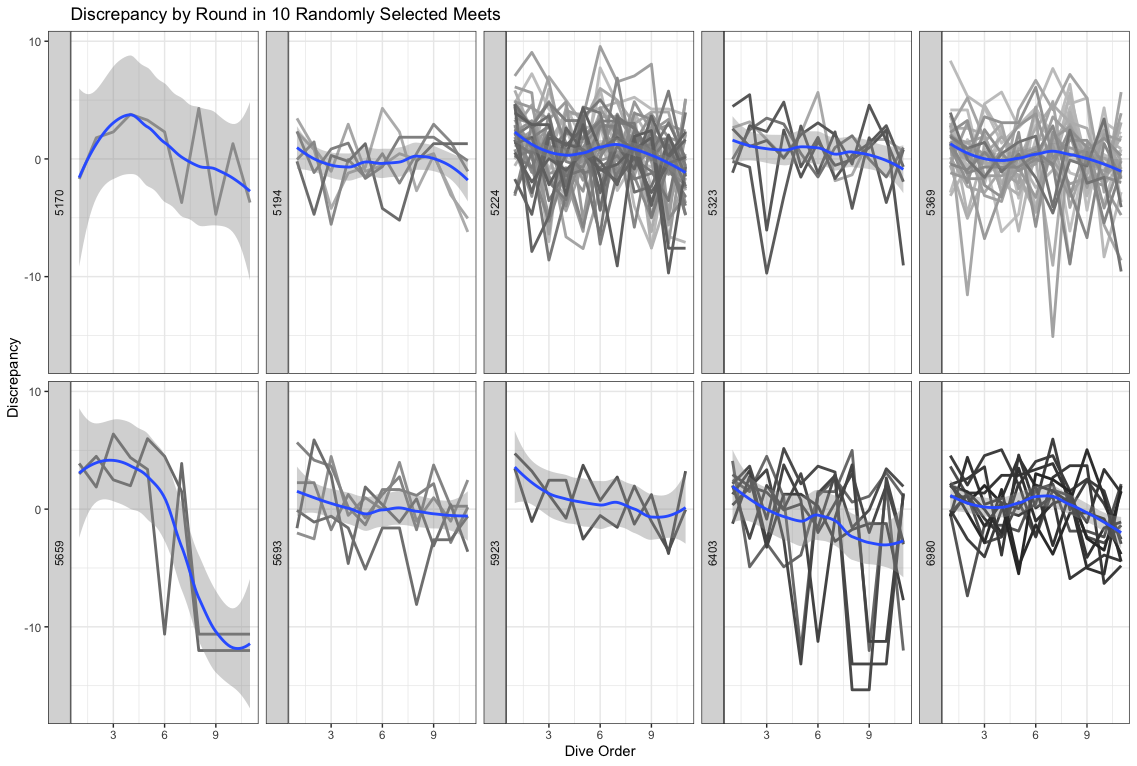
We have visual evidence for a difficulty bias in the opposite direction for which difficulty bias is usually seen. Another potential bias to examine is “round bias” to determine whether dives in the beginning of meet are judged more harshly (or leniently) than dives at the end of a meet. Recall that each meet is 11 rounds, and, depending on the number of divers in a meet, the judges could be judging for several hours.
Figure 4 shows discrepancies for all divers in ten randomly selected meets. Each frame represents a single meet, and each dark gray or black line represents the discrepancies for a different diver. The discrepancy is plotted on the vertical axis and the round in which a dive was performed on the horizontal axes for all frames. The number within the left-hand strip for each frame is the unique meet ID. Some of the meets had only one or two divers. The blue curve within each frame is a loess smoothed line. We can see a definite trend toward harsher scores as the meet wears on, regardless of the meet or number of divers, although the effect is less for meets with a large number of divers, which we would expect by the law of large numbers. Interestingly, the effect is there regardless of the meet, which is confounded with the judging panel. In other words, it seems that judges in different meets behave similarly, regardless of the particular judge or the number of divers within a meet.
There is a bit of confounding with round and dive. Divers are free to perform dives in almost any order for a given meet, with respect to the stipulations on voluntary vs. optional dives mentioned in the introduction. Unfortunately, we do not have access to sequential diver order; that is, the data do not have an indicator for which diver went first, which went second, etc. We have access to the round in which each dive was performed for each diver; however, the data does not designate which dives are voluntary and which are optional. It is possible to determine voluntary from optional dives in a reasonable fashion and examine the discrepancies between voluntary vs. optional dives, but this is left for future research.
Mixed Effects Model
The figures show discrepancies for each variable separately. We wish to model them simultaneously in order to control for the fixed effects. We use a mixed effects model with a random intercept for diver. Round, Age, and DD are fixed effects. Girls and boys were modeled separately.
Table 1 shows the parameter estimates, standard error, and t-statistics for each of the fixed effects. The coefficients on the round are small; however, the t-statistic is large. The round effect is similar for boys and girls. For every round that passes, the discrepancy decreases by approximately 0.08, indicating that the judges tend to judge more harshly (net scores are less than the diver’s competency) as a competition continues, adjusted for age and DD. This finding matches the visual evidence seen in Figure 4. The coefficient for age is 0.28 for girls and 0.30 for boys, which indicates that judges tend to judge more favorably for each year increase in age of the diver. This finding is commensurate with Figure 1(b). These coefficients for age are small, but they are large enough to make a difference in the outcome of a competition because the net score changes during a meet while the diver ability remains constant. An increase (or decrease) of a fraction of a point per round could change ordinal standings for a given meet.
| Girls, , ICC = 4% | Boys, , ICC = 2% | |||||
|---|---|---|---|---|---|---|
| Effect | Estimate | SE | t-statistic | Estimate | SE | t-statistic |
| Intercept | 1.8 | 0.33 | 5.47 | -0.33 | 0.37 | -0.91 |
| Round | -0.09 | 0.0006 | -14.79 | -0.08 | 0.007 | -11.56 |
| Age | 0.28 | 0.019 | 14.63 | 0.30 | 0.021 | 14.26 |
| DD | -3.26 | 0.065 | -50.04 | -2.20 | 0.063 | -34.84 |
The largest coefficient belongs to degree of difficulty (DD), and the coefficients for boys and girls are one point apart. Girls seem to get penalized more for more difficult dives than do boys. Perhaps this is a reflection of the fact that boys are expected to engage in riskier behavior (trying dives that are beyond their ability) than girls are; therefore, they are less penalized, on average, for those difficult dives. This assertion needs to be further tested with a more careful data analysis.
Note that the adjusted intraclass coefficients (ICC) for the girls and boys are small (0.04 and 0.02, respectively). We report the adjusted ICC because it gives proportion of variability associated with the random effects without accounting for the fixed effects in the model [11]. The ICC can be interpreted as the proportion of variance that is attributable to the “grouping structure” in the population [7]. Here, the random intercept, which represents a different starting discrepancy for each diver, defines the “grouping structure”. Therefore, only 4% of the variability in discrepancy for girls and 2% of the variability in discrepancy for boys is accounted for by different starting discrepancies for each diver. In plain language, any effect of discrepancy that an individual diver contributes is completely overshadowed by the fixed effects.
Discussion and Conclusion
To sum up, there seems to be a bias for the round of competition, difficulty of the dive, and age of the diver. While we did not see a bias for gender of the diver when visually examining discrepancies by gender, there is some evidence from the coefficients of the mixed model in Table 1 that girls and boys are scored differently with respect to DD, when controlling for age and round. We have the data to examine the specific order of the dives performed; however, we did not attempt an analysis with dive order for this study. Dive order is confounded with round, because each diver can choose his or her own dive order within certain parameters. Finally, we did not have information on sequential order, which would be the order of divers within a competition. We had only the dive order in which a particular diver performed a particular dive. In later studies, we hope to obtain information on the order of the divers within a meet and to examine sequential bias and conformity bias.
We also leave a statistical model for future work. Clearly we have a random effect for diver and repeated measurements for each diver. We also have divers nested within meet, and each meet has a different panel of judges; therefore we can use meet as a surrogate for a panel of judges. There are fixed effects for DD, gender, age, direction, and position, and a correlation between direction, position, and DD. In future work, we will use a more sophisticated model accounting for repeated measures and nesting effects.
Some caveats: like all observational data, confounding factors exist in the diving data, and we do not have information in these data to account for several of these factors within a statistical model. However, given our measure of diver competency, the results showed that biases exist for degree of difficulty and round of the meet.
References
- [1] FINA judging module. Online, 2023.
- [2] Women’s diving recruiting scores and scholarships. NCSA College Recruiting, 2023. Accessed October 3, 2023.
- [3] Christine Brennan. U.S. figure skating committee picks Olympic stars but leaves heartbreak in its wake, 2018.
- [4] John W. Emerson and Silas Meredith. Nationalistic judging bias in the 2000 olympic diving competition. Math Horizons, 18(3):8–11, 2011.
- [5] John W. Emerson, Miki Seltzer, and David Lin. Assessing judging bias: An example from the 2000 olympic games. The American Statistician, 63(2):124–131, 2009.
- [6] Woody Franklin. High school diving competition requirements. LiveAbout.com, October 2018.
- [7] Andrew Gelman and Jennifer Hill. Data Analysis Using Regression and Multilevel Hierarchical Models. Cambridge University Press, 2007.
- [8] Brooke Kruhm. Easiest and hardest sport to get a scholarship. Athlete Sport Management Website, November 2021. Accessed October 3, 2023.
- [9] Bianca Luedeker and Monnie McGee. Relationship between judges’ scores and dive attributes from a video recording of a diving competition. PLoS One, 17(8):e0273374, August 2022.
- [10] Hugues Mercier and Sandro Heiniger. Judging the judges: Evaluating the performance of international gymnastics judges, 2018.
- [11] Shinichi Nakagawa, Paul C. D. Johnson, and Holger Schielzeth. The coefficient of determination r2 and intra-class correlation coefficient from generalized linear mixed-effects models revisited and expanded. Journal of The Royal Society Interface, 14(134), 2017. doi:10.1098/rsif.2017.0213.
- [12] Robert Wood. Most popular Olympic sport. Topend Sports Website, November 2015.
- [13] Nick Zaccardi. Scoring controversy takes center at men’s gymnastics trial. Technical report, Sports Illustrated, 2012.