Resonant inelastic x-ray scattering of the = 1/2 Mott insulator Sr2IrO4 from the density-functional theory
Abstract
We have investigated the electronic structure of Sr2IrO4 within the density-functional theory (DFT) using the generalized gradient approximation while taking into account strong Coulomb correlations (GGA+) in the framework of the fully relativistic spin-polarized Dirac linear muffin-tin orbital band-structure method. We have investigated the x-ray absorption spectra (XAS), x-ray magnetic circular dichroism (XMCD), and resonant inelastic x-ray scattering (RIXS) spectra at the Ir and O edges. The calculated results are in good agreement with the experimental data. The RIXS spectrum of Sr2IrO4 at the Ir edge in addition to the elastic scattering peak at 0 eV possesses a sharp feature below 1.5 eV corresponding to transitions within the Ir levels. The excitation located from 2 eV to 5 eV is due to transitions. The third wide structure situated at 512 eV appears due to transitions between the Ir 5 states derived from the ”tails” of oxygen 2 states and and states. The RIXS spectrum of Sr2IrO4 at the O edge consists of three major inelastic excitations at 0.7 eV, 3.5 eV, and around 6.2 eV. We have found that the first low energy feature is due to interband transitions between occupied and empty O transitions, which appear due to the strong hybridization between oxygen 2 and Ir states in the close vicinity of the Fermi level. The next two peaks at around 3.5 and 6.2 eV reflect the iterband transitions from the occupied O 2 states and the empty oxygen states which arise from the hybridization with Ir and states, respectively. We have found that the theory reproduces well the shape and energy position of the low energy feature, but the second and the third peaks are shifted towards smaller energy in comparison with the experimental measurements. To reproduce the correct energy position of the oxygen 2 band we have used a self-interaction-like correction procedure. We have found that the dependence of the RIXS spectrum at the oxygen edge on the incident photon energy and the momentum transfer vector Q is much stronger in comparison with the correspondent dependence at the Ir edge.
pacs:
75.50.Cc, 71.20.Lp, 71.15.RfI Introduction
In 5 transition metal compounds the energy scale of the spin-orbit coupling (SOC) is comparable to the on-site Coulomb interaction and the crystal-field energy. Due to the strong competition between these interactions fascinating electronic states can arise. The SOC in such systems splits the orbitals into a quartet ( = 3/2) and a doublet ( = 1/2) Jackeli and Khaliullin (2009); Chen et al. (2010); Witczak-Krempa et al. (2014). In 5 (Ir4+) iridium oxides, the quartet = 3/2 is fully occupied, and the relatively narrow = 1/2 doublet occupied by one electron can be splitted by a moderate Hubbard with opening a small band gap called the relativistic Mott gap Kim et al. (2008); Martins et al. (2011); Antonov et al. (2018). Iridates have been at the center of an intensive search in recent years for novel phenomena, such as topological insulators Qi and Zhang (2010); Ando (2013); Wehling et al. (2014); Bansi et al. (2016), Mott insulators Kim et al. (2008, 2009); Jackeli and Khaliullin (2009); Watanabe et al. (2010); Martins et al. (2011), Weyl semimetals Witczak-Krempa and Kim (2012); Go et al. (2012); Sushkov et al. (2015), and quantum spin liquids Jackeli and Khaliullin (2009); Kimchi et al. (2014).
Among iridium compounds, Sr2IrO4, a single-layer member of the Ruddlesden-Popper series iridates, is of special interest. It has a quasi-two-dimensional (2D) square-lattice perovskite structure and was the first discovered spin-orbit = 1/2 Mott insulator Kim et al. (2008). Besides, it has the structural and physical similarity with La2CuO4, a parent compound to high- cuprates, such as the presence of a pseudogap Kim et al. (2015); Yan et al. (2015); Battisti et al. (2017), similar Fermi surfaces and Fermi arcs (in electron- and hole-doped compounds) Damascelli et al. (2003); Kim et al. (2014), -wave symmetry Kim et al. (2016); Terashima et al. (2017), electron-boson coupling Hu et al. (2019), and similarities in the magnetic ordering and magnetic excitations Kim et al. (2012a); Clancy et al. (2019). However, the superconductivity in Sr2IrO4 has not been found yet Bertinshaw et al. (2019).
In this work we focus our attention on the RIXS properties in Sr2IrO4. Since the first publication by Kao et al. on NiO Kao et al. (1996), the resonant inelastic X-ray scattering method has shown remarkable progress in condensed matter physics research as a spectroscopic technique to record the momentum and energy dependence of inelastically scattered photons in complex materials Ament et al. (2011). RIXS nowadays has rapidly become the forefront of experimental photon science. It provides a direct probe of spin and orbital states and dynamics. RIXS has a number of unique features in comparison with other spectroscopic techniques. It covers a large scattering phase space and requires only small sample volumes. It also is bulk sensitive, polarization dependent, as well as element and orbital specific Ament et al. (2011).
Depending on the x-ray resonant energy, RIXS can be divided into two classes: soft x-ray and hard x-ray Ament et al. (2011). For high atomic number transition metal elements, such as 5 transition metal compounds, the -edge resonant energies are in the hard x-ray region. For such spectra high quality single crystals are needed as the key optical elements. The RIXS resolution crucially depends on the availability of a high quality single crystal with a Bragg diffraction peak close to back-scattering at the energy of the -edge of the targeted element. This requirement severely limits the application of RIXS, and thus by far the majority of hard x-ray RIXS studies have been focused on 5 iridates Liu et al. (2012); Hozoi et al. (2014); Clancy et al. (2016); Nag et al. (2018); Takayama et al. (2019); Aczel et al. (2022) and osmates Calder et al. (2016); Taylor et al. (2017); Calder et al. (2017). In a soft RIXS setup, the x-ray energy range is usually below about 2 keV Liu et al. (2015). The -edges of the 3 transition metal elements all fall below this energy scale. The energy resolution in the soft x-ray region is relatively high. For example, the combined energy resolution was 150 meV at the Ni edge (850 eV) in Ta2NiSe5 Monney et al. (2020). The best energy resolution currently achieved for RIXS at the oxygen -edge (530 eV) of the common ligand atoms is about 45-50 meV Lee et al. (2013); Lu et al. (2018), which is much better than the majority of 5 elements probed using -edge RIXS in the hard x-ray region up to date. We should mention, however, that in recent years the experimentalists have achieved a remarkable progress in increasing the resolution for hard RIXS spectra. For example, Kim et al. Kim et al. (2023) have been able to obtain the total resolution of 34.2 meV at the Ir edge in Sr2IrO4. Such resolution permits direct measurements of single-magnon excitations as well as other many-body excitations in strongly correlated systems.
In the x-ray absorption (XA), x-ray magnetic circular dichroism (XMCD), and RIXS processes at the O edge, the 1 core level is involved. The exchange splitting of the 1-core state is extremely small and SOC is absent in the O 1 orbitals, therefore, only the exchange and spin-orbit splitting of the 2 states is responsible for the observed spectra at the oxygen edge. On the other hand, the oxygen valence 2-states of the surrounding ligand atoms are sensitive to the electronic states at neighboring sites because of their delocalized nature. They strongly hybridize with the 5 orbitals. Due to such hybridization combined with high SOC at the 5 ion, information on the elementary excitations can be extracted using an indirect RIXS process at the O edge Lu et al. (2018). Although O RIXS has a much smaller penetration depth (100 nm) than 5 RIXS, a comparison between O and Ir spectra measured on Sr2IrO4 suggests that they have a comparable counting efficiency Lu et al. (2018). The lower penetration depth of soft x-rays has its own advantages providing high sensitivity to ultrathin samples such as films. Soft x-ray RIXS at the O edge is a promising method for studying the electronic and magnetic excitations in 5 compounds. There are several experimental investigations of the RIXS spectra at the oxygen edge Liu et al. (2015); Lu et al. (2018); Paris et al. (2020); Kim et al. (2023) in Sr2IrO4. The Ir RIXS spectra in this oxide are investigated in Refs. Ishii et al. (2011); Kim et al. (2012a); Lupascu et al. (2014); Paris et al. (2020); Bertinshaw et al. (2020); Kim et al. (2023); Clancy et al. (2023).
We carry out here a detailed study of the electronic structure, the XA, XMCD, and RIXS spectra of Sr2IrO4 in terms of the density functional theory. Our study sheds light on the important role of band structure effects and transition metal 5 oxygen 2 hybridization in the spectral properties in 5 oxides. The energy band structure, the XA, XMCD, and RIXS spectra of Sr2IrO4 are investigated in the ab initio approach using the fully relativistic spin-polarized Dirac linear muffin-tin orbital band-structure method. We use both the generalized gradient approximation (GGA) and the GGA+ approach to assess the sensitivity of the RIXS results to different treatment of the correlated electrons.
The paper is organized as follows. The crystal structure of Sr2IrO4 and computational details are presented in Sec. II. Sec. III presents the electronic and magnetic structures of Sr2IrO4. In Sec. IV the theoretical investigations of the XA, XMCD, and RIXS spectra of Sr2IrO4 at the Ir edges are presented, the theoretical results are compared with the experimental measurements. In Sec. V we present the theoretical investigations of the XA and RIXS spectra at the O edge. Finally, the results are summarized in Sec. VI.
II Computational details
X-ray magnetic circular dichroism.
Magneto-optical (MO) effects refer to various changes in the polarization state of light upon interaction with materials possessing a net magnetic moment, including rotation of the plane of linearly polarized light (Faraday, Kerr rotation), and the complementary differential absorption of left and right circularly polarized light (circular dichroism). In the near visible spectral range these effects result from excitation of electrons in the conduction band. Near x-ray absorption edges, or resonances, magneto-optical effects can be enhanced by transitions from well-defined atomic core levels to transition symmetry selected valence states.
Within the one-particle approximation, the absorption coefficient for incident x-ray polarization and photon energy can be determined as the probability of electronic transitions from initial core states with the total angular momentum to final unoccupied Bloch states
| (1) | |||||
where and are the wave function and the energy of a core state with the projection of the total angular momentum ; and are the wave function and the energy of a valence state in the -th band with the wave vector k; is the Fermi energy.
is the electron-photon interaction operator in the dipole approximation
| (2) |
where are the Dirac matrices and is the polarization unit vector of the photon vector potential, with , . Here, and denote, respectively, left and right circular photon polarizations with respect to the magnetization direction in the solid. Then, x-ray magnetic circular and linear dichroisms are given by and , respectively. More detailed expressions of the matrix elements in the electric dipole approximation may be found in Refs. Guo et al. (1994); Antonov et al. (2004); Arola et al. (2004). The matrix elements due to magnetic dipole and electric quadrupole corrections are presented in Ref. Arola et al. (2004).
Resonant inelastic x-ray scattering.
In the direct RIXS process Ament et al. (2011) the incoming photon with energy , momentum , and polarization excites the solid from the ground state with energy to the intermediate state with energy . During relaxation an outgoing photon with energy , momentum and polarization is emitted, and the solid is in state with energy . As a result, an excitation with energy and momentum = is created. Our implementation of the code for the calculation of the RIXS intensity uses Dirac four-component basis functions Nemoshkalenko et al. (1983) in the perturbative approach Arola et al. (1997a, b). RIXS is the second-order process, and its intensity is given by
| (3) | |||||
where the RIXS perturbation operator in the dipole approximation is given by the lattice sum , where are the Dirac matrices. The sum over the intermediate states includes the contributions from different spin-split core states at the given absorption edge. The matrix elements of the RIXS process in the frame of fully relativistic Dirac LMTO method were presented in Ref. Antonov et al. (2022a).
Crystal structure.
The powder-neutron-diffraction measurements show that Sr2IrO4 possesses the tetragonal perovskite structure (group number 142) [Fig. 1(a)] Shimura et al. (1995). The IrO6 octahedra in Sr2IrO4 are rigidly aligned, just as the CuO6 octahedra in cuprates, rotated by 11∘ about the axis in the plane [Fig. 1(b)], and have a local distortion of 4.5% axial elongation.
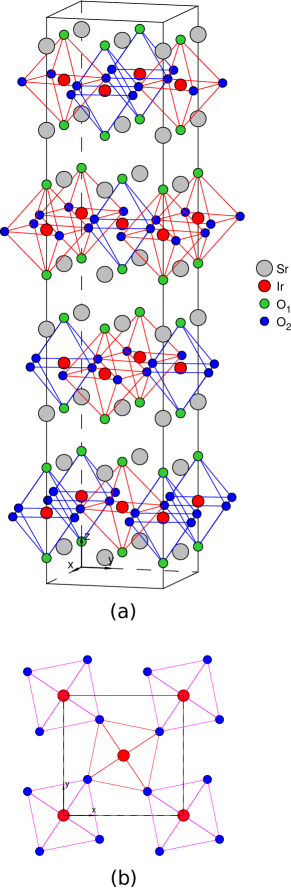
Atomic positions of Sr2IrO4 at 10 K (the lattice constants = 5.48164 Å, = 25.80019 Å) for Sr, Ir, O1, and O2 are (0, 1/4, ), (0, 1/4, 3/8), (0, 1/4, ), and (, + 1/4, ), respectively, with = 0.1996, = 0.5506, and = 0.4548 Shimura et al. (1995). The oxygen atoms surrounding the Ir sites provide an octahedral environment. The IrO1 and IrO2 interatomic distances are equal to 2.05886 Å and 1.97704 Å, respectively. Around each Ir atom there are eight Sr atoms with the Ir-Sr distance = 3.34615 Å. The Ir-Ir distance = 3.87610 Å.
Note that in our electronic structure calculations, we rely on experimentally measured internal parameters , , and lattice constants because they are well established for this material and are probably still more accurate than can be obtained from DFT.
Calculation details
The details of the computational method are described in our previous papers Antonov et al. (2006, 2007, 2010); Antonov et al. (2022a) and here we only mention several aspects. The band structure calculations were performed using the fully relativistic linear muffin-tin orbital (LMTO) method Andersen (1975); Antonov et al. (2004). This implementation of the LMTO method uses four-component basis functions constructed by solving the Dirac equation inside an atomic sphere Nemoshkalenko et al. (1983). The exchange-correlation functional of the generalized gradient approximation (GGA)-type was used in the version of Perdew, Burke and Ernzerhof Perdew et al. (1996). The Brillouin zone integration was performed using the improved tetrahedron method Blöchl et al. (1994). The basis consisted of Ir and Sr , , , and ; and O , , and LMTO’s.
To take into account the electron-electron correlation effects we used in this work the ”relativistic” generalization of the rotationally invariant version of the LSDA+ method Yaresko et al. (2003) which takes into account that in the presence of spin-orbit coupling the occupation matrix of localized electrons becomes non-diagonal in spin indexes. Hubbard was considered as an external parameter and varied from 0.65 eV to 3.65 eV. We used in our calculations the value of exchange Hund coupling =0.65 eV obtained from constrained LSDA calculations Dederichs et al. (1984); Pickett et al. (1998). Thus, the parameter , which roughly determines the splitting between the lower and upper Hubbard bands, varied between 0 eV and 3.0 eV. We adjusted the value of to achieve the best agreement with the experiment.
In the RIXS process an electron is promoted from a core level to an intermediate state, leaving a core hole. As a result, the electronic structure of this state differs from that of the ground state. In order to reproduce the experimental spectrum the self-consistent calculations should be carried out including a core hole. Usually, the core-hole effect has no impact on the shape of XAS at the edges of 5 systems and just a minor effect on the XMCD spectra at these edges Antonov et al. (2004). However, the core hole has a strong effect on the RIXS spectra in transition metal compounds Antonov et al. (2022a, b), therefore we take it into account.
III Electronic and magnetic structures
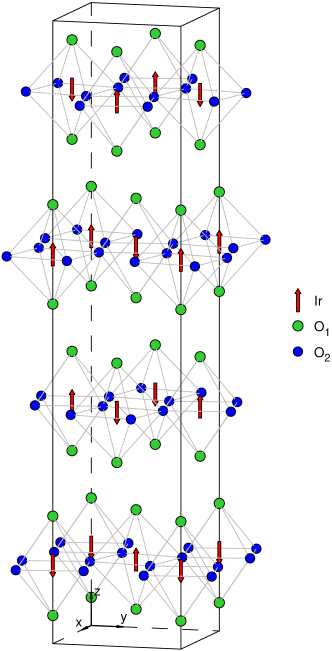
We performed GGA, GGA+SO, and GGA+SO+ calculations of the electronic and magnetic structures of Sr2IrO4 for the experimental crystal structure Shimura et al. (1995) and AFM ordering along the direction (Fig. 2). Although Sr2IrO4 has a canted AFM structure Kim et al. (2009), test calculations for a non-collinear AFM structure gave almost identical optical, XA, XMCD, and RIXS spectra. Fig. 3 (the upper panel) presents the energy band structure of Sr2IrO4 in the energy range of the Ir manifold from 2.1 to 1.0 eV, calculated in the fully relativistic Dirac GGA+SO approximation. The GGA+SO bands are presented by circles proportional in size to their orbital character projected onto the basis set of Ir (blue) and (red) states. The strong SOC splits the manifold into a lower = 3/2 quartet and an upper = 1/2 doublet. The functions of the = 3/2 quartet are dominated by states with some weight of ones, which is determined by the relative strength of SOC and crystal-field splitting. The = 1/2 functions are almost completely given by the linear combinations of states. This allows one to identify the bands with pure character as originating from the = 1/2 states. The GGA+SO approach produces a metallic state in Sr2IrO4. The GGA+SO+ approximation shifts the occupied and empty bands downward and upward, respectively, by /2 producing a dielectric ground state (the lower panel of Fig. 3). The energy gap is increased with increasing Hubbard .
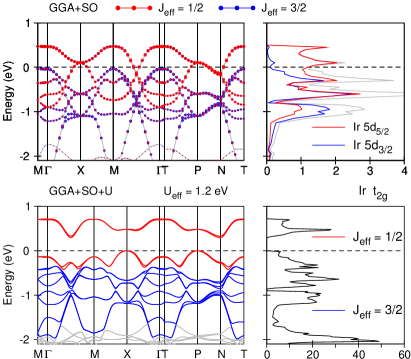
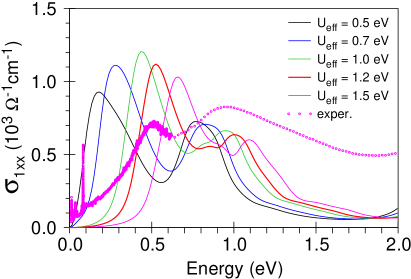
Figure 4 presents the experimentally measured real part of the optical conductivity (open magenta circles), , Pröpper et al. (2016) for the energy below 2 eV in Sr2IrO4 compared with the theoretical spectra calculated in the GGA+SO+ approximation for different values. The experimental optical absorption consists of two peaks at around 0.5 and 1.0 eV. We found that the low energy peak is derived from transitions between initial and final bands formed by pure = 1/2 states near band boundaries, e.g., around the X point or the P-N high-symmetry line. The antiferromagnetic ordering of Ir moments within the plane stabilized by the on-site Coulomb repulsion causes a gap opening near the zone boundary between two pairs of bands which show nearly parallel dispersion what insures high joint density of states for the interband transitions responsible for the low energy peak. This is in line with previous theoretical calculations Zhang et al. (2013); Pröpper et al. (2013) and experimental photoemission results Wang et al. (2013). The high energy peak located around 1 eV is dominated by a contribution from transitions with = 3/2 initial states. Our calculations give the lower absorption peak about twice as strong as the higher energy one, while in the experimental spectra the strength is approximately the same for both. A similar trend was observed also by Pröpper et al. Pröpper et al. (2013) and Kim et al. Kim et al. (2012b). The later authors relate this to an interband mixing of = 3/2 and = 1/2 states, which reflects the itinerancy of the system, i.e., the hybridization of Ir 5 states via neighboring oxygen 2 states. The best agreement between the calculated and experimentally measured energy positions of the optical absorption peaks can be achieved for = 1.2 eV.
Figures 5 and 6 present the energy band structure and partial density of states (DOS), respectively, in Sr2IrO4 calculated in the GGA+SO+ approximation with = 1.2 eV. Five electrons occupy the -type low energy band (LEB) manifold in the energy interval from 1.5 eV to in Sr2IrO4. The empty states [the upper energy band (UEB)] consist of one peak and occupy the energy range from 0.41 eV to 0.82 eV (see Fig. 6). The -type states of Ir are distributed far above the Fermi level from 2.2 eV to 5.1 eV. The 4 states of Sr ions are mostly situated above the Fermi level from 5.3 to 10.8 eV.
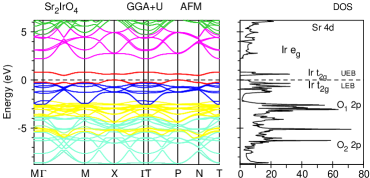
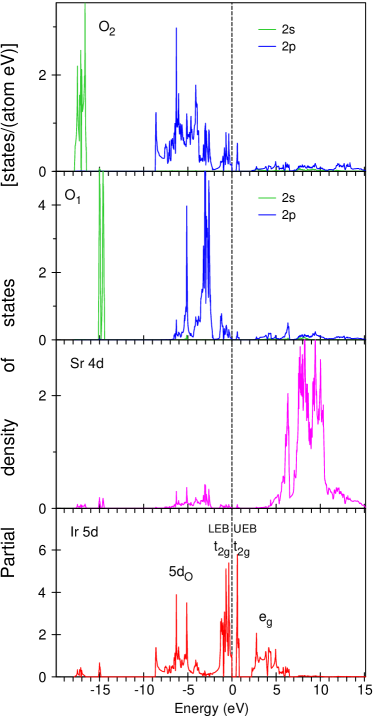
The electronic structure of apical O1 and in-plane O2 ions significantly differ from each other. The apical O1 2 states consist of two very narrow peaks situated at 15.1 and 14.4 eV. The in-plane O2 2 states possess a relatively wider two peak structure from 17.9 to 16.5 eV. The O1 2 states are situated just below Ir LEB between 3.5 and 2.1 eV. There is also a narrow peak at 5.2 eV. The in-plane O2 2 states occupy a relatively wide energy interval from 8.7 to 3.6 eV. The small peaks in the close vicinity of the Fermi level from 1.5 eV to and from 0.41 eV to 0.82 eV are due to the strong hybridization between O 2 and Ir LEB and UEB, respectively.
The occupation number of 5 electrons in the Ir atomic sphere in Sr2IrO4 is equal to 6.3, which is much larger than the expected value of five electrons. The excessive charge is provided by the ”tails” of oxygen 2 states. These 5 states are located at the bottom of oxygen 2 states from 8.7 eV to 3.1 eV and play an essential role in the RIXS spectrum at the Ir edge (see Section IV).
The theoretically calculated spin , orbital , and total magnetic moments using the GGA+SO+ approach ( = 1.2 eV) for the AFM solution are equal to 0.2647 , 0.4447 , and 0.7094 , respectively. The spin and orbital magnetic moments at the Sr site are relatively small ( = 0.0007 and = 0.0015 ). The magnetic moments for apical O1 ions are equal to = 0.0294 , = 0.0254 . For in-plane O2 ions the magnetic moments almost vanish.
IV Ir XMCD and RIXS spectra
Figure 7 presents the experimentally measured x-ray absorption spectra (the upper panel) and XMCD spectra (the lower panel) at the Ir edges for Sr2IrO4 Haskel et al. (2012) (open circles) compared with the theoretically calculated ones in the GGA+SO+ ( = 1.2 eV) approximation (full blue curves). The theoretically calculated Ir XA and XMCD spectra are in good agreement with the experiment. The isotropic XA spectra are dominated by the empty states with a smaller contribution from the empty orbitals at lower energy. The XMCD spectra, however, mainly come from the orbitals ( = 1/2). This results in a shift between the maxima of the XA and XMCD spectra.
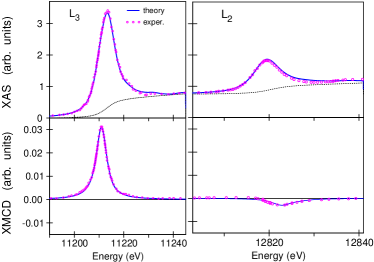
Due to the importance of SOC effects in iridates, it is natural to quantify the strength of the SO interactions in these compounds. One method of accomplishing this is provided by the x-ray absorption spectroscopy. Van der Laan and Thole showed that the so-called branching ratio BR = ( is the integrated intensity of the isotropic XAS at the edges) is an important quantity in the study of 5 oxides related to the SO interaction van der Laan and Thole (1988). The BR is directly related to the ground-state expectation value of the angular part of the spin-orbit coupling through BR = , with = and is the number of holes in 5 states van der Laan and Thole (1988). As a result, XAS provides a direct probe of SO interactions, which is complementary to other techniques such as the magnetic susceptibility, electron paramagnetic resonance, and Mossbauer spectroscopy (which probe SOC through the value of the Lande g-factor). In the limit of negligible SOC effects the statistical branching ratio BR = 2, and the white line is twice the size of the feature van der Laan and Thole (1988). The measured BR in Sr2IrO4 is close to 4.1 Haskel et al. (2012), which differs significantly from the statistical BR = 2 in the absence of orbital magnetization in 5 states. A strong deviation from 2 indicates a strong coupling between the local orbital and spin moments. Our DFT calculations produce BR = 3.56 for the GGA+SO+ ( = 1.2 eV) approximation which is rather close to the experimental data of Haskel et al. Haskel et al. (2012). It should be mentioned that the effect of Coulomb correlations changes the energy band structure of transition metal compounds in two ways. First, occupied states are shifted downward by /2 and empty states are shifted upward by this value relative to the Fermi energy. Second, the Coulomb correlations enhance an effective spin-orbit coupling constant Liu et al. (2008). The relative influence of such effect is increased in a row of 5 transition metal compounds due to an increase of Hubbard and a decrease of the atomic SO coupling constant .
The RIXS spectra at Ir occur from a local excitation between the filled and empty 5 states. More precisely, the incoming photon excites a 2 core electron ( spectrum) or 2 one ( spectrum) into an empty 5 state what is followed by the de-excitation from the occupied 5 state into the core level. Because of the dipole selection rules, apart from 6-states (which have a small contribution to RIXS due to relatively small 2 6 matrix elements Antonov et al. (2004)) only 5-states occur for RIXS, whereas for RIXS 5-states also contribute. Although the 2 5 radial matrix elements are only slightly smaller than the 2 5 ones, the angular matrix elements strongly suppress the 2 5 contribution Antonov et al. (2004). Therefore, the RIXS spectrum at the Ir edge can be viewed as interband transitions between 5 states.
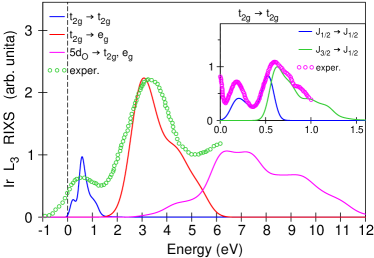
Figure 8 shows the experimental RIXS spectrum (open green circles) measured by Ishii et al. Ishii et al. (2011) at the Ir edge in Sr2IrO4 compared with the theoretically calculated one in the GGA+SO+ approximation (=1.2 eV). The Ir RIXS spectrum consists of two peaks below 5 eV. We found that the low energy peak corresponds to intra- excitations. This fine structure has a two peak structure in our calculations but the measurements of Ishii et al. Ishii et al. (2011) show only one peak. However, Clancy et al. Clancy et al. (2023) using higher resolution were able to distinguish two peaks (see the inset in Fig. 8). The low energy peak at 0.5 eV is due to interband transitions between occupied and empty Ir = 1/2 states (the red curves in the lower panel of Fig. 3). These transitions also contribute to the second high energy peak at around 0.7 eV together with transitions (the green curve in the inset of Fig. 8). The intensive peak at around 3.4 eV (the red curve in Fig. 8) is due to transitions. The next fine structure from 4.5 eV to 12 eV (the magenta curve) is due to 5 , transitions.
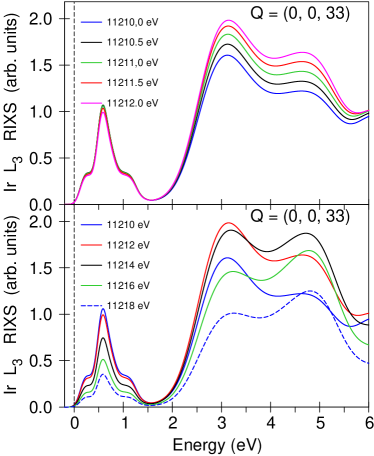
Figure 9 shows the Ir RIXS spectrum as a function of incident photon energy above the corresponding edge with the momentum transfer vector Q = (0, 0, 33). We found that the low energy fine structure corresponding to intra- excitations is slightly decreased when the incident photon energy changes in the interval of 2 eV above the Ir edge, while the high energy peak corresponding to the transitions is monotonically increased (the upper panel of Fig. 9). A similar trend was observed in the measurements of Ishii et al. Ishii et al. (2011). They measured the RIXS spectra of Sr2IrO4 at two representative incident photon energies in the interval of 3 eV and discovered that with increasing the low energy peak is decreased but the high energy peak is increased [for the same momentum transfer vector Q = (0, 0, 33)]. The lower panel of Fig. 9 shows the Ir RIXS spectrum as a function of incident photon energy in the larger energy interval of 18 eV. With increasing the low energy peak is steadily decreased, but the high energy peak shows more complex behavior. First, the intensity of the peak is increased, but then decreased with changing the relative intensity of the two peaks at 3 and 5 eV .
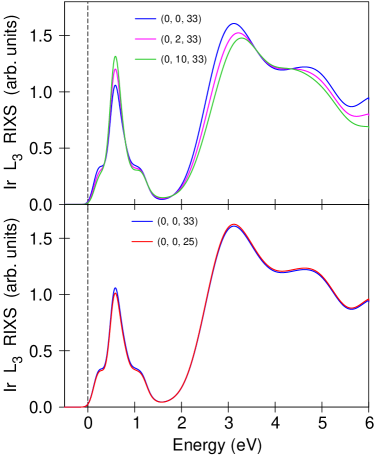
It is widely believed that excitations show only small momentum transfer vector Q dependence in 5 transition metal compounds Liu et al. (2012); Krajewska et al. (2020). In particular, Sr2IrO4 has a layered-perovskite structure, therefore, the momentum dependence along the axis is expected to be small, as in high- cuprates Ishii et al. (2005). Indeed, as we see in the lower panel of Fig. 10, the RIXS spectra are almost identical for the transfer vectors Q = (0, 0, 33) and (0, 0, 25). Similar dependence was observed also in the measurements of Ishii et al. Ishii et al. (2011). The upper panel of Fig. 10 shows the RIXS spectra at the Ir edge in Sr2IrO4 calculated as a function of with the momentum transfer vector Q = (0, Qy, 33) for incident photon energy = 11210 eV. We found that with increasing Qy the first low energy peak is increased and the high energy fine structure is decreased. Analyzing Fig. 10 we can conclude that the momentum dependence of the excitations in Sr2IrO4 is rather small as it was earlier observed in other iridates such as Sr3CuIrO6 Liu et al. (2012) or In2Ir2O7 Krajewska et al. (2020).
V O XAS and RIXS spectra
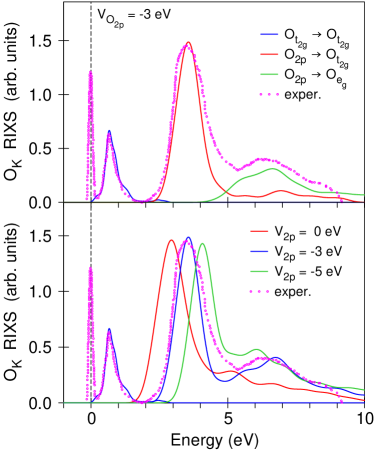
The RIXS spectra at the O edge in Sr2IrO4 were measured by Liu et al. Liu et al. (2015), Lu et al. Lu et al. (2018), Paris et al. Paris et al. (2020), and Kim et al. Kim et al. (2023). The last three investigations concentrate on the analysis of low energy excitations below 1.2 eV. Liu et al. Liu et al. (2015) present the RIXS spectrum up to 12 eV using circular and polarizations of the incident beam. The O RIXS spectrum consists of a peak centered at zero energy loss, which comprises the elastic line and other low-energy features such as phonons, magnons, etc., and three major inelastic excitations at 0.7 eV, 3.5 eV, and around 6.2. We found that the first low energy feature is due to the interband transitions between occupied and empty O states, which appear as a result of the strong hybridization between oxygen 2 states with Ir LEB and UEB in the close vicinity of the Fermi level (see Fig. 6), therefore, the oxygen RIXS spectroscopy can be used for the estimation of the energy band gap and positions of Ir 5 Hubbard bands. The next two peaks at around 3.5 and 6.2 eV reflect the interband transitions from the occupied O 2 states and the empty oxygen states which originate from the hybridization with Ir and states, respectively. We found that the theory reproduces well the shape and energy position of the low energy feature, but the second and the third peaks are shifted towards smaller energy in comparison with the experimental measurements. It means that the DFT calculations cannot produce the correct energy position of the oxygen 2 bands. These bands are almost fully occupied in Sr2IrO4, therefore, they cannot be described by the GGA+ method. To reproduce the correct energy position of the oxygen 2 band in Sr2IrO4 we used a self-interaction-like correction procedure as proposed by Kaneko et al. Kaneko et al. (2013), where the valence bands are shifted downwards by adding a SIC-like orbital-dependent potential into the Hamiltonian. We used as a parameter an adjusted it to produce the correct energy position of the oxygen 2 bands. We found that the best agreement with the experiment can be achieved for = 3.0 eV (see the lower panel of Fig. 11).
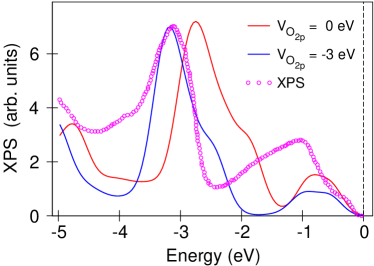
Figure 12 presents the valence band photoemission spectrum of Sr2IrO4 King et al. (2013) compared with total DOS calculated in the GGA+SO++SIC approach ( = 1.2 eV). Two dominant peaks at around 1 and 3.2 eV are observed, which might be attributed to the photoemmision from Ir and oxygen 2 states, respectively King et al. (2013). Like in the case of O RIXS spectrum, the GGA+SO+ approach cannot reproduce the correct energy position of the peak at 3.2 eV. However, the SIC-like approach with = 3 eV improves the situation.
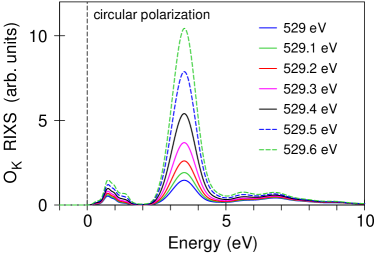
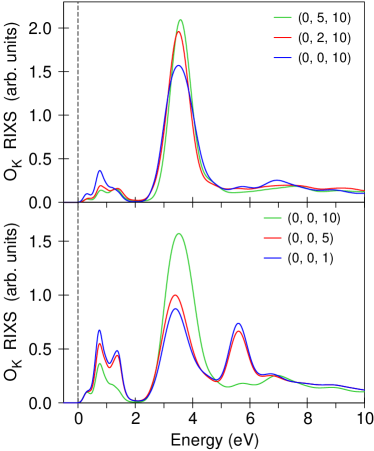
Figure 13 presents the RIXS spectra as a function of incident photon energy calculated at the O edge in Sr2IrO4 with circular polarization. We found much stronger dependence on the incident photon energy in the case of the O RIXS spectrum in comparison with the corresponding dependence at the Ir edge (compare Figs. 9 and 13). With increasing the incident photon energy both peaks at 0.7 eV and 3.5 eV are increased, the later one is increased dramatically. And this occurs in a small energy interval for of 0.6 eV.
Figure 14 shows the RIXS spectra at the O edge in Sr2IrO4 calculated as a function of (the upper panel) and (the lower panel) with the momentum transfer vector Q = (0, Qy, Qz). With decreasing parameters Qx and Qz the intensity of the major peak at 3.5 eV is decreased but the low energy peak at 0.7 eV is increased. There is also a strong change in the shape of the low energy peak at 0.7 eV and the third peak at around 6.2 eV with the change of the parameter Qz.
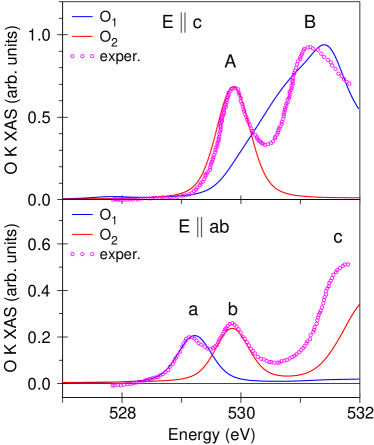
Figure 15 presents the experimental O polarization dependent x-ray absorption spectra (open magenta circles) Kim et al. (2008) compared with the theoretically calculated ones in the GGA+SO++SIC approach ( = 1.2 eV, = 3 eV). Due to the quasi-two-dimensional structure of Sr2IrO4 there is strong anisotropy in the x-ray absorption spectra. There are two small peaks and at 529.1 and 529.9 eV and larger peak at around 531.8 eV for the E polarization and only two peaks and for E at 529.9 and 531.3 eV. We found that the low energy peak for E and the large peak for E are derived from the apical oxygens O1. The peaks and are due to the 1 2 x-ray absorption on the in-plane O2 oxygens. The theory relatively well reproduces the experimentally measured XA spectra.
VI Conclusions
The electronic and magnetic structures of Sr2IrO4 were investigated theoretically in the frame of the fully relativistic spin-polarized Dirac LMTO band-structure method in order to understand the importance of Coulomb interaction and spin-orbit coupling. We also present comprehensive theoretical calculations of the XA, XMCD, and RIXS spectra at the Ir and oxygen edges.
The strong SOC splits the manifold into a lower = 3/2 quartet and an upper = 1/2 doublet. The functions of the = 3/2 quartet are dominated by states with some weight of ones, which is determined by the relative strength of the SOC and crystal-field splitting. The = 1/2 functions are almost completely given by linear combinations of states. This allows one to identify the bands with pure character as originating from the = 1/2 states. The GGA+SO approach produces a metallic state in Sr2IrO4. The GGA+SO+ approximation shifts the occupied and empty bands downward and upward, respectively, by /2 producing a dielectric ground state in Sr2IrO4.
We found that the best agreement between the calculated and experimentally measured optical conductivity spectrum can be achieved for = 1.2 eV. The experimental optical absorption consists of two peaks at around 0.5 and 1.0 eV. The low energy peak is derived from transitions between initial and final bands formed by pure = 1/2 states near band boundaries. The high energy peak located around 1 eV is dominated by a contribution from transitions with = 3/2 initial states.
The theoretically calculated Ir XAS and XMCD spectra are in good agreement with the experiment. The isotropic XA spectra are dominated by the empty states with a smaller contribution from the empty orbitals at lower energy. The XMCD spectra, however, mainly come from the orbitals ( = 1/2). This results in a shift between the maxima of the XA and XMCD spectra. The ratio BR = is an important quantity in the study of the SO interaction in 5 oxides. It is directly related to the ground-state expectation value of the angular part of the spin-orbit coupling. Our DFT calculations produce BR = 3.56 which is rather close to the experimental value of 4.1 Haskel et al. (2012). These values differ significantly from the statistical BR = 2 in the absence of orbital magnetization in 5 states. A strong deviation from 2 indicates a strong coupling between the local orbital and spin moments.
The Ir RIXS spectrum consists of two peaks below 5 eV. We found that the low energy peak corresponds to intra- excitations. This fine structure has a two peak structure. The low energy peak at 0.5 eV is due to interband transitions between occupied and empty Ir = 1/2 states. These transitions also contribute to the second high energy peak at around 0.7 eV together with transitions. The intensive peak at around 3.4 eV is due to transitions. The next fine structure from 4.5 eV to 12 eV is due to 5 , transitions.
We investigated theoretically the influence of the incident photon energy and the momentum transfer vector Q on the shape of the Ir RIXS spectrum. We found that with inreasing of in the interval of 2 eV above the Ir edge the low energy fine structure corresponding to intra- excitations is decreased and the high energy peak corresponding to the transitions is monotonically increased in agreement with the measurements of Ishii et al. Ishii et al. (2011). The momentum dependence of Ir RIXS was found to be relatively small. With increasing Qy the first low energy peak is increased and the high energy fine structure is slightly decreased. The variation of parameter Qz almost does not influence the RIXS spectrum at the Ir edge.
The RIXS spectrum of Sr2IrO4 at the O edge consists of three major inelastic excitations at 0.7 eV, 3.5 eV, and around 6.2 eV. We found that the first low energy feature is due to the interband transitions between occupied and empty O states, which appear as a result of the strong hybridization between oxygen 2 states with Ir LEB and UEB in the close vicinity of the Fermi level. The next two peaks at around 3.5 and 6.2 eV reflect the interband transitions from the occupied O 2 states to the empty oxygen states which originate from the hybridization with Ir and states, respectively. We found that the theory reproduces well the shape and energy position of the low energy feature, but the second and the third peaks are shifted towards smaller energy in comparison with the experimental measurements. It means that the DFT calculations cannot produce the correct position of oxygen 2 bands. To reproduce the correct energy position of the oxygen 2 band in Sr2IrO4 we used a self-interaction-like correction procedure. We added a SIC-like orbital-dependent potential into the Hamiltonian and found that the best agreement with the experiment can be achieved for = 3.0 eV. We found that the dependence of the RIXS spectrum at the oxygen edge on the incident photon energy and the momentum transfer vector Q is much stronger in comparison with the correspondent dependency at the Ir edge.
Due to the quasi-two-dimensional structure of Sr2IrO4 there is strong anisotropy in the x-ray absorption spectra at the oxygen edge. There are two small peaks and at 529.1 and 529.9 eV and a larger peak at around 531.8 eV for the E polarization and only two peaks and for E at 529.9 and 531.3 eV. We found that the low energy peak for E and the large peak for E are derived from the apical oxygens O1. The peaks and are due to the 1 2 x-ray absorption on the in-plane O2 oxygens. The theory relatively well reproduces the experimentally measured XA spectra.
Acknowledgments
We are thankful to Dr. Alexander Yaresko from the Max-Planck-Institute FKF in Stuttgart for helpful discussions.
References
- Jackeli and Khaliullin (2009) G. Jackeli and G. Khaliullin, Phys. Rev. Lett. 102, 017205 (2009).
- Chen et al. (2010) G. Chen, R. Pereira, and L. Balents, Phys. Rev. B 82, 174440 (2010).
- Witczak-Krempa et al. (2014) W. Witczak-Krempa, G. Chen, Y. B. Kim, and L. Balents, Annu. Rev. Condens. Matter Phys. 5, 57 (2014).
- Kim et al. (2008) B. J. Kim, H. Jin, S. J. Moon, J.-Y. Kim, B.-G. Park, C. S. Leem, J. Yu, T. W. Noh, C. Kim, S.-J. Oh, et al., Phys. Rev. Lett. 101, 076402 (2008).
- Martins et al. (2011) C. Martins, M. Aichhorn, L. Vaugier, and S. Biermann, Phys. Rev. Lett. 107, 266404 (2011).
- Antonov et al. (2018) V. N. Antonov, S. Uba, and L. Uba, Phys. Rev. B 98, 245113 (2018).
- Qi and Zhang (2010) X.-L. Qi and S.-C. Zhang, Physics Today 63, 33 (2010).
- Ando (2013) Y. Ando, J. Phys. Soc. Jpn. 82, 102001 (2013).
- Wehling et al. (2014) T. O. Wehling, A. Black-Schafferc, and A. Balatsky, Adv. Phys. 63, 1 (2014).
- Bansi et al. (2016) A. Bansi, L. H, and T. Das, Rev. Mod. Phys. 88, 021004 (2016).
- Kim et al. (2009) B. J. Kim, H. Ohsumi, T. Komesu, S. Sakai, T. Morita, H. Takagi, and T. Arima, Science 323, 1329 (2009).
- Watanabe et al. (2010) H. Watanabe, T. Shirakawa, and S. Yunoki, Phys. Rev. Lett. 105, 216410 (2010).
- Witczak-Krempa and Kim (2012) W. Witczak-Krempa and Y. B. Kim, Phys. Rev. B 85, 045124 (2012).
- Go et al. (2012) A. Go, W. Witczak-Krempa, G. S. Jeon, K. Park, and Y. B. Kim, Phys. Rev. Lett. 109, 066401 (2012).
- Sushkov et al. (2015) A. B. Sushkov, J. B. Hofmann, G. S. Jenkins, J. Ishikawa, S. Nakatsuji, S. DasSarma, and H. D. Drew, Phys. Rev. B 92, 241108 (2015).
- Kimchi et al. (2014) I. Kimchi, J. G. Analytis, and A. Vishwanath, Phys. Rev. B 90, 205126 (2014).
- Kim et al. (2015) B. J. Kim, H. Jin, S. J. Moon, J.-Y. Kim, B.-G. Park, C. S. Leem, J. Yu, T. W. Noh, C. Kim, S.-J.-H. Park, et al., Phys. Rev. B 115, 176402 (2015).
- Yan et al. (2015) Y. Yan, M. Ren, H. Xu, B. Xie, R. Tao, H. Choi, N. Lee, Y. Choi, T. Zhang, and D. Feng, Phys. Rev. X 5, 041018 (2015).
- Battisti et al. (2017) I. Battisti, K. M. Bastiaans, V. Fedoseev, A. de la Torre, N. Iliopoulos, A. Tamai, E. C. Hunter, R. S. Perry, J. Zaanen, F. Baumberger, et al., Nat. Phys. 13, 21 (2017).
- Damascelli et al. (2003) A. Damascelli, Z. Hussain, and Z.-X. Shen, Rev. Mod. Phys. 75, 473 (2003).
- Kim et al. (2014) Y. K. Kim, O. Krupin, J. D. Denlinger, A. Bostwick, E. Rotenberg, Q. Zhao, J. F. Mitchell, J. W. Allen, and B. J. Kim, Science 345, 187 (2014).
- Kim et al. (2016) Y. K. Kim, N. H. Sung, J. D. Denlinger, and B. J. Kim, Nat. Phys. 12, 37 (2016).
- Terashima et al. (2017) K. Terashima, M. Sunagawa, H. Fujiwara, T. Fukura, M. Fujii, K. Okada, K. Horigane, K. Kobayashi, R. Horie, J. Akimitsu, et al., Phys. Rev. B 96, 041106(R) (2017).
- Hu et al. (2019) Y. Hu, X. Chen, S.-T. Peng, C. Lane, M. Matzelle, Z.-L. Sun, M. Hashimoto, D.-H. Lu, E. Schwier, M. Arita, et al., Phys. Rev. Lett. 123, 216402 (2019).
- Kim et al. (2012a) J. Kim, D. Casa, M. H. Upton, T. Gog, Y.-J. Kim, J. F. Mitchell, M. van Veenendaal, M. Daghofer, J. van den Brink, G. Khaliullin, et al., Phys. Rev. Lett. 108, 177003 (2012a).
- Clancy et al. (2019) J. P. Clancy, H. Gretarsson, M. H. Upton, J. Kim, G. Cao, and Y.-J. Kim, Phys. Rev. B 100, 104414 (2019).
- Bertinshaw et al. (2019) J. Bertinshaw, Y. Kim, G. Khaliullin, and B. Kim, Annu. Rev. Condens. Matter Phys. 7, 315 (2019).
- Kao et al. (1996) C.-C. Kao, W. A. L. Caliebe, J. B. Hastings, and J.-M. Gillet, Phys. Rev. B 54, 16361 (1996).
- Ament et al. (2011) L. J. P. Ament, M. van Veenendaal, T. P. Devereaux, J. P. Hill, and J. van den Brink, Rev. Mod. Phys. 83, 705 (2011).
- Liu et al. (2012) X. Liu, V. M. Katukuri, L. Hozoi, W.-G. Yin, M. P. M. Dean, M. H. Upton, J. Kim, D. Casa, A. Said, T. Gog, et al., Phys. Rev. Lett. 109, 157401 (2012).
- Hozoi et al. (2014) L. Hozoi, H. Gretarsson, J. P. Clancy, B.-G. Jeon, B. Lee, K. H. Kim, V. Yushankhai, P. Fulde, D. Casa, T. Gog, et al., Phys. Rev. B 89, 115111 (2014).
- Clancy et al. (2016) J. P. Clancy, H. Gretarsson, E. K. H. Lee, D. Tian, J. Kim, M. H. Upton, D. Casa, T. Gog, Z. Islam, B.-G. Jeon, et al., Phys. Rev. B 94, 024408 (2016).
- Nag et al. (2018) A. Nag, S. Bhowal, A. Chakraborty, M. M. Sala, A. Efimenko, F. Bert, P. K. Biswas, A. D. Hillier, M. Itoh, S. D. Kaushik, et al., Phys. Rev. B 98, 014431 (2018).
- Takayama et al. (2019) T. Takayama, A. Krajewska, A. S. Gibbs, A. N. Yaresko, H. Ishii, H. Yamaoka, K. Ishii, N. Hiraoka, N. P. Funnell, C. L. Bull, et al., Phys. Rev. B 99, 125127 (2019).
- Aczel et al. (2022) A. A. Aczel, Q. Chen, J. P. Clancy, C. dela Cruz, D. R. i Plessis, G. J. MacDougall, C. J. Pollock, M. H. Upton, T. J. Williams, N. LaManna, et al., Phys. Rev. Mater. 6, 094409 (2022).
- Calder et al. (2016) S. Calder, J. Vale, N. Bogdanov, X. Liu, C. Donnerer, M. Upton, D. Casa, A. Said, M. Lumsden, Z. Zhao, et al., Nature Commun. 7, 11651 (2016).
- Taylor et al. (2017) A. E. Taylor, S. Calder, R. Morrow, H. L. Feng, M. H. Upton, M. D. Lumsden, K. Yamaura, P. M. Woodward, and A. D. Christianson, Phys. Rev. Lett. 118, 207202 (2017).
- Calder et al. (2017) S. Calder, J. G. Vale, N. Bogdanov, C. Donnerer, D. Pincini, M. M. Sala, X. Liu, M. H. Upton, D. Casa, Y. G. Shi, et al., Phys. Rev. B 95, 020413(R) (2017).
- Liu et al. (2015) X. Liu, M. P. M. Dean, J. Liu, S. G. Chiuzbaian, N. Jaouen, A. Nicolaou, W. G. Yin, C. R. Serrao, R. Ramesh, H. Ding, et al., J. Phys.: Condens. Matter 27, 202202 (2015).
- Monney et al. (2020) C. Monney, M. Herzog, A. Pulkkinen, Y. Huang, J. Pelliciari, P. Olalde-Velasco, N. Katayama, M. Nohara, H. Takagi, T. Schmitt, et al., Phys. Rev. B 102, 085148 (2020).
- Lee et al. (2013) W. S. Lee, S. Johnston, B. Moritz, J. Lee, M. Yi, K. J. Zhou, T. Schmitt, L. Patthey, V. Strocov, K. Kudo, et al., Phys. Rev. Lett. 110, 265502 (2013).
- Lu et al. (2018) X. Lu, P. Olalde-Velasco, Y. Huang, V. Bisogni, J. Pelliciari, S. Fatale, M. Dantz, J. G. Vale, E. C. Hunter, J. Chang, et al., Phys. Rev. B 97, 041102(R) (2018).
- Kim et al. (2023) J.-K. Kim, C. Dietl, H.-W. J. Kim, S.-H. Ha, J. Kim, A. H. Said, J. Kim, and B. J. Kim, J. Synchrotron Rad. 30, 643 (2023).
- Paris et al. (2020) E. Paris, Y. Tseng, E. M. Pärschke, W. Zhang, M. H. Upton, A. Efimenko, K. Rolfs, , D. E. McNally, L. Maurel, et al., Proceed. Nat. Acad. Sciences USA 117, 24764 (2020).
- Ishii et al. (2011) K. Ishii, I. Jarrige, M. Yoshida, K. Ikeuchi, J. Mizuki, K. Ohashi, T. Takayama, J. Matsuno, and H. Takagi, Phys. Rev. B 83, 115121 (2011).
- Lupascu et al. (2014) A. Lupascu, J. P. Clancy, H. Gretarsson, Z. Nie, J. Nichols, J. Terzic, G. Cao, S. S. A. Seo, Z. Islam, and M. H. U. et al., Phys. Rev. Lett. 112, 147201 (2014).
- Bertinshaw et al. (2020) J. Bertinshaw, J. K. Kim, J. Porras, K. Ueda, N. H. Sung, A. Efimenko, A. Bombardi, J. Kim, B. Keimer, and B. J. Kim, Phys. Rev. B 101, 094428 (2020).
- Clancy et al. (2023) J. P. Clancy, H. Gretarsson, A. Lupascu, J. A. Sears, Z. Nie, M. H. Upton, J. Kim, Z. Islam, M. Uchida, D. G. Schlom, et al., Phys. Rev. B 107, 054423 (2023).
- Guo et al. (1994) G. Y. Guo, H. Ebert, W. M. Temmerman, and P. J. Durham, Phys. Rev. B 50, 3861 (1994).
- Antonov et al. (2004) V. Antonov, B. Harmon, and A. Yaresko, Electronic Structure and Magneto-Optical Properties of Solids (Kluwer, Dordrecht, 2004).
- Arola et al. (2004) E. Arola, M. Horne, P. Strange, H. Winter, Z. Szotek, and W. M. Temmerman, Phys. Rev. B 70, 235127 (2004).
- Nemoshkalenko et al. (1983) V. V. Nemoshkalenko, A. E. Krasovskii, V. N. Antonov, V. N. Antonov, U. Fleck, H. Wonn, and P. Ziesche, Phys. status solidi B 120, 283 (1983).
- Arola et al. (1997a) E. Arola, P. Strange, and B. L. Gyorffy, Phys. Rev. B 55, 472 (1997a).
- Arola et al. (1997b) E. Arola, P. Strange, and B. L. Gyorffy, Phys. Rev. B 55, 472 (1997b).
- Antonov et al. (2022a) V. N. Antonov, D. A. Kukusta, and L. V. Bekenov, Phys. Rev. B 105, 155144 (2022a).
- Shimura et al. (1995) T. Shimura, Y. Inaguma, T. Nakamura, M. Itoh, and Y. Morii, Phys. Rev. B 52, 9143 (1995).
- Antonov et al. (2006) V. N. Antonov, O. Jepsen, A. N. Yaresko, and A. P. Shpak, J. Appl. Phys. 100, 043711 (2006).
- Antonov et al. (2007) V. N. Antonov, B. N. Harmon, A. N. Yaresko, and A. P. Shpak, Phys. Rev. B 75, 184422 (2007).
- Antonov et al. (2010) V. N. Antonov, A. N. Yaresko, and O. Jepsen, Phys. Rev. B 81, 075209 (2010).
- Andersen (1975) O. K. Andersen, Phys. Rev. B 12, 3060 (1975).
- Perdew et al. (1996) J. P. Perdew, K. Burke, and M. Ernzerhof, Phys. Rev. Lett. 77, 3865 (1996).
- Blöchl et al. (1994) P. E. Blöchl, O. Jepsen, and O. K. Andersen, Phys. Rev. B 49, 16223 (1994).
- Yaresko et al. (2003) A. N. Yaresko, V. N. Antonov, and P. Fulde, Phys. Rev. B 67, 155103 (2003).
- Dederichs et al. (1984) P. H. Dederichs, S. Blügel, R. Zeller, and H. Akai, Phys. Rev. Lett. 53, 2512 (1984).
- Pickett et al. (1998) W. E. Pickett, S. C. Erwin, and E. C. Ethridge, Phys. Rev. B 58, 1201 (1998).
- Antonov et al. (2022b) V. N. Antonov, D. A. Kukusta, and L. V. Bekenov, Phys. Rev. B 105, 155145 (2022b).
- Pröpper et al. (2016) D. Pröpper, A. N. Yaresko, M. Höppner, Y. Matiks, Y.-L. Mathis, T. Takayama, A. Matsumoto, H. Takagi, B. Keimer, and A. V. Boris, Phys. Rev. B 94, 035158 (2016).
- Zhang et al. (2013) H. Zhang, K. Haule, and D. Vanderbilt, Phys. Rev. Lett. 111, 246402 (2013).
- Pröpper et al. (2013) D. Pröpper, A. N. Yaresko, M. Höppner, Y. Matiks, Y.-L. Mathis, T. Takayama, A. Matsumoto, H. Takagi, B. Keimer, A. V. Boris, et al., Phys. Rev. B 88, 085125 (2013).
- Wang et al. (2013) Q. Wang, Y. Cao, J. A. Waugh, S. R. Park, T. F. Qi, O. B. Korneta, G. Cao, and D. S. Dessau, Phys. Rev. B 87, 245109 (2013).
- Kim et al. (2012b) B. H. Kim, G. Khaliullin, and B. I. Min, Phys. Rev. Lett. 109, 167205 (2012b).
- Haskel et al. (2012) D. Haskel, G. Fabbris, M. Zhernenkov, P. P. Kong, C. Q. Jin, G. Cao, and M. van Veenendaal, Phys. Rev. Lett. 109, 027204 (2012).
- van der Laan and Thole (1988) G. van der Laan and B. T. Thole, Phys. Rev. Lett. 60, 1977 (1988).
- Liu et al. (2008) G.-Q. Liu, V. N. Antonov, O. Jepsen, and O. K. Andersen, Phys. Rev. Lett. 101, 026408 (2008).
- Krajewska et al. (2020) A. Krajewska, T. Takayama, R. Dinnebier, A. Yaresko, K. Ishii, M. Isobe, and H. Takagi, Phys. Rev. B 101, 121101(R) (2020).
- Ishii et al. (2005) K. Ishii, K. Tsutsui, Y. Endoh, T. Tohyama, S. Maekawa, M. Hoesch, K. Kuzushita, M. Tsubota, T. Inami, J. Mizuki, et al., Phys. Rev. Lett. 94, 207003 (2005).
- Kaneko et al. (2013) T. Kaneko, T. Toriyama, T. Konishi, and Y. Ohta, Phys. Rev. B 87, 035121 (2013).
- King et al. (2013) P. D. C. King, T. Takayama, A. Tamai, E. Rozbicki, S. M. Walker, M. Shi, L. Patthey, R. G. Moore, D. Lu, K. M. Shen, et al., Phys. Rev. B 87, 241106(R) (2013).