Observatory: Characterizing Embeddings of Relational Tables
Abstract.
Language models and specialized table embedding models have recently demonstrated strong performance on many tasks over tabular data. Researchers and practitioners are keen to leverage these models in many new application contexts; but limited understanding of the strengths and weaknesses of these models, and the table representations they generate, makes the process of finding a suitable model for a given task reliant on trial and error. There is an urgent need to gain a comprehensive understanding of these models to minimize inefficiency and failures in downstream usage.
To address this need, we propose Observatory, a formal framework to systematically analyze embedding representations of relational tables. Motivated both by invariants of the relational data model and by statistical considerations regarding data distributions, we define eight primitive properties, and corresponding measures to quantitatively characterize table embeddings for these properties. Based on these properties, we define an extensible framework to evaluate language and table embedding models. We collect and synthesize a suite of datasets and use Observatory to analyze nine such models. Our analysis provides insights into the strengths and weaknesses of learned representations over tables. We find, for example, that some models are sensitive to table structure such as column order, that functional dependencies are rarely reflected in embeddings, and that specialized table embedding models have relatively lower sample fidelity. Such insights help researchers and practitioners better anticipate model behaviors and select appropriate models for their downstream tasks, while guiding researchers in the development of new models.
PVLDB Reference Format:
PVLDB, 17(4): 849 - 862, 2023.
doi:10.14778/3636218.3636237
††This work is licensed under the Creative Commons BY-NC-ND 4.0 International License. Visit https://creativecommons.org/licenses/by-nc-nd/4.0/ to view a copy of this license. For any use beyond those covered by this license, obtain permission by emailing info@vldb.org. Copyright is held by the owner/author(s). Publication rights licensed to the VLDB Endowment.
Proceedings of the VLDB Endowment, Vol. 17, No. 4 ISSN 2150-8097.
doi:10.14778/3636218.3636237
PVLDB Artifact Availability:
The code and data are available at https://github.com/superctj/observatory.
1. Introduction
The advances of pretrained language models for NLP tasks such as summarization and dialog have sparked similar interest and progress in embedding relational tables for tasks such as table question answering (Herzig et al., 2020), entity matching (Deng et al., 2020b; Li et al., 2020), semantic column type annotation (Zhang et al., 2020; Deng et al., 2020b; Suhara et al., 2022), and data integration and augmentation (Cappuzzo et al., 2020; Tang et al., 2021; Cong et al., 2023b). Most of these models are built on top of language models such as BERT (Devlin et al., 2019) and specialized to take into account the structure of tables, for example, by leveraging vertical attention to incorporate information across rows (Yin et al., 2020b).
As these table embedding models have shown strong performance on a variety of tasks, researchers and practitioners are also interested in using these pretrained models for new applications and in new domains. However, the process of identifying a suitable model typically involves trial and error due to a lack of understanding regarding the strengths and limitations of these models and their learned representations. This knowledge gap can produce inefficiency and even failures in downstream usage. Moreover, researchers have little visibility into the behaviors and generalizability of existing table embedding models beyond their performance on particular downstream tasks. Hence, there is a pressing need to understand the strengths and weaknesses of these models, especially in terms of the table embeddings they generate (Dong et al., 2022; Badaro et al., 2023).
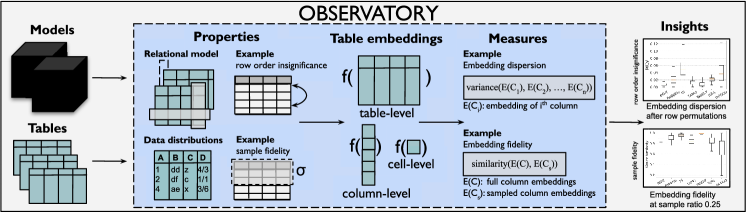
To address this need, we propose Observatory, a formal framework for systematically analyzing language- and table embedding models from the perspective of what characteristics of relational tables these models do and do not capture in their learned embedding representations. Observatory presents eight primitive properties motivated both by invariants in Codd’s relational data model (Codd, 1970, 1979) and by statistical considerations regarding data distributions in downstream tasks: for instance, if embeddings are sensitive to row and column order or sample size. Each of these properties is associated with a measure that quantitatively characterizes embedding representations over relational tables (see Figure 1 for an overview). Analogous to task-agnostic analyses of language models (Ribeiro et al., 2020; Adi et al., 2016), such data-specific evaluations of embeddings offer valuable insights into model behaviors, which are connected to various downstream applications (Section 6 gives more details). With Observatory, we 1) consolidate properties of relational tables important to reflect in table embeddings, 2) contribute a framework and implementation thereof, enabling researchers and practitioners to analyze the capabilities of existing and new models with respect to these properties, and 3) provide insights into the strengths and limitations of nine popular models through their learned representations over tabular data, which can inform researchers and practitioners of model selections and novel model designs.
Along with the implementation of Observatory, we collect and synthesize a suite of datasets for evaluation purposes, and present a comprehensive analysis of nine commonly used language and specialized table embedding models. Some key insights we surface in our analysis are that the embeddings of some models are sensitive to the order of rows and, in particular, the order of columns, while embeddings of some models are robust to uniform sampling. Moreover, we find that none of the models reflect functional dependencies among columns in tables. Although we do not aim to, and cannot, analyze all existing models, our implementation of Observatory is extensible such that researchers and practitioners can use Observatory for analysis of new models by specifying the procedure of embedding inference following the implemented interface. In summary, we make the following contributions:
-
•
We propose Observatory, a framework including eight primitive properties and corresponding measures for systematically analyzing embedding representations over relational tables.
-
•
We implement and open-source a prototype of Observatory, which covers nine popular table embedding models while also being extensible for evaluation of new models.
-
•
We present a comprehensive analysis with Observatory and provide novel insights into the strengths and limitations of evaluated models and their learned table representations.
2. Related Work
2.1. Language and Table Embedding Models
Language Models
BERT (Devlin et al., 2019) is among the first transformer-based pretrained language models, generating contextual embeddings by predicting masked tokens. Subsequent optimizations like RoBERTa (Liu et al., 2019) and expansions in model size and tasks (e.g., T5 (Raffel et al., 2020)) have driven rapid advancements. Language models soon progress from predictive tasks to sequence generation, exemplified by GPT models (Radford et al., 2018). Beyond unstructured language tasks, investigations explore language models’ capabilities for structured inputs like tabular data. Narayan et al. (Narayan et al., 2022) uses T5 for data wrangling, and recent GPT-based conversational models directly handle table understanding tasks(Korini and Bizer, 2023; Kayali et al., 2023).
Table Embedding Models
TaBERT (Yin et al., 2020b) pioneers extending pretrained language models to tabular data. It employs token-level embeddings with additional positional embeddings, incorporating vertical attention for inter-row information and a masked column name prediction objective inspired by BERT. Subsequent models, including TURL (Deng et al., 2020b), TAPAS (Herzig et al., 2020), and TaPEx (Liu et al., 2022), facilitate applications like table question answering, table understanding, and data preparation. For a comprehensive overview, we refer readers to surveys by Dong et al. (Dong et al., 2022) and Badaro et al. (Badaro et al., 2023). The latter emphasizes the need for intrinsic analysis of table embedding models, which we take a first step towards addressing with Observatory.
2.2. Analysis of Embedding Models
Analysis of Language Embedding Models
Efforts to comprehend and evaluate LMs involve task-specific (Wang et al., 2019) and task-agnostic analyses (Ribeiro et al., 2020). Task-agnostic investigations, exemplified by CheckList (Ribeiro et al., 2020), explore internal LM behavior and capacities through unit-test-like assessments (e.g., whether a LM can handle negation). In line with this, Observatory proposes relational data model-inspired properties, considering practical data distribution factors for downstream applications. Recently, Sui et al. (Sui et al., 2023) introduces a benchmark evaluating LMs on seven table tasks (e.g., cell lookup) while varying, among others, prompt designs and table input formatting. However, it falls short in examining fundamental properties of relational tables and data distributions, and excluding specialized table embedding models.
Analysis of Table Embedding Models
Limited analyses exist on table embedding models. Wang et al. (Wang et al., 2022) assess the impact of explicitly modeling table structure in transformer architectures for table retrieval, revealing the modest contribution of table-specific model design. However, this evaluation is confined to retrieval tasks and lacks insights into intrinsic model limitations affecting downstream performance. Dr.Spider (Chang et al., 2023a) benchmarks text-to-SQL models for perturbation robustness, while Observatory introduces novel properties, including perturbation robustness, unexplored until now. Recent work (Srinivas et al., 2023) introduces LakeBench, highlighting performance gaps in specialized table embedding models for data discovery. In contrast, Observatory evaluates embedding representations based on broader table-specific properties relevant to diverse downstream tasks. Koleva et al. (Koleva et al., 2022) examines patterns in table-specific attention mechanisms, remaining task-agnostic. Unlike Observatory, it doesn’t link model analysis with relational and data distribution properties of tables.
3. Observatory
In this section, we present Observatory, our methodology for characterizing embedding representations over relational tables. Observatory features two sets of properties that are agnostic to downstream tasks and motivated by the relational model (Codd, 1970, 1979) and data distributions. For each property, Observatory proposes a measure to quantify how well embedding representations align with the property specification. This allows users to gain insights into the strengths and weaknesses of different models and to even compare models through a consistent lens.
3.1. Problem Statement
Various downstream applications may need different kinds of embeddings. For example, semantic column type detection is based on column embeddings whereas entity matching requires entity embeddings. Given that these embeddings look at different levels of aggregation of the table structure, we refer to these kinds of embeddings as levels of embeddings.
Definition 0 (Table Embedding Characterization).
Given a pretrained model , a corpus of tables , and a property that characterizes a certain level of embeddings with a measure , table embedding characterization infers with over each and computes over the distribution of .
A property can characterize one or more levels of embeddings (e.g., it can apply for both row- and column-level embeddings). Properties in Observatory span five levels of embeddings: table, column, row, cell, and entity (so called table embeddings) while many of them are relevant to column-level embeddings. Observatory also focuses on Transformer-based embedding models. Technically, any pretrained model , regardless of the architecture (encoder or encoder-decoder or decoder-only) can be integrated to and evaluated with Observatory, as long as either natively exposes certain level of embeddings specified by or exposes token-level embeddings that can be further aggregated to the level of .
3.2. Relational Properties
The relational data model specifies both structural invariants and semantics. We first introduce two properties from structural invariants (namely, Row- and Column Order Insignificance), followed by two properties from structural semantics (namely, Join Relationship and Functional Dependencies).
Property 1 (Row Order Insignificance).
A relational table can be viewed as a set of rows of which, in principle, the order is insignificant (Codd, 1970). Tables may be stored in an ordered way, that is, rows may be ordered by dates, or ascending/descending values of a given column. Models that explicitly encode the table structure with position embeddings might reflect this order in the output embeddings. Awareness of the influence of row order on table embeddings is key to using them in a context of unordered tables. We consider column/row/table-level embeddings in this property.
Measure 1.
Given a table , let denote the embedding of column/row/table in the -th row-wise shuffle of for (i.e., there are row-wise permutations). We define the row order sensitivity as a high-dimensional dispersion measure of samples drawn from the embedding distribution, i.e.,
The coefficient of variation (CV), the ratio of the standard deviation to the mean in the univariate setting, is a well-known measure of variability relative to the mean of a population. It has the merit of allowing for the comparison of random variables with different units or different means. Thus, we consider multivariate extensions of CV (MCV) that summarize relative variation of a random vector (instead of a random variable) into a scalar quantity. In particular, we use Albert and Zhang’s MCV (Albert and Zhang, 2010) to compare row order sensitivity across models for the reasons that it takes into account correlations between variables and does not require the covariance matrix to have an inverse (Albert and Zhang, 2010; Aerts et al., 2015), which is especially convenient when the number of observations (number of embeddings) is smaller than the number of variables (embedding dimensionality). Albert and Zhang’s MCV of embeddings is computed as
| (1) |
where is the mean vector and is the covariance matrix.
In practice, the number of possible permutations can be large (i.e., factorial of the number of rows) for tables with high cardinality. For computational efficiency in the experiments, we use at most 1000 randomly generated permutations of each table.
Example 0.
Figure 2 gives an example of row permutations. Given 6 data rows, there are in total possible permutations. Then for each column, we have observations of embeddings, which is smaller than some embedding dimensionality (e.g., 768 of BERT). In this case, the covariance matrix derived from observations is singular. Nevertheless, Albert and Zhang’s MCV can be calculated whereas other MCVs surveyed in (Aerts et al., 2015) can not.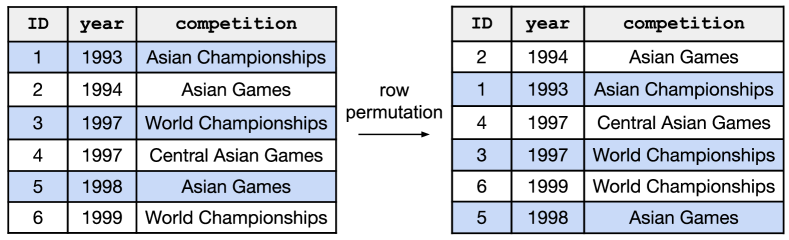
Property 2 (Column Order Insignificance).
Besides row order, some models exploit neighboring columns as context when learning representations based on the intuition that neighboring columns can provide local context (Zhang et al., 2020; Zhang et al., 2023). Analogous to row order insignificance, relational tables usually store data without preserving a particular column order. The (in)sensitivity of embeddings regarding the column order informs their suitability for tasks such as join discovery and table understanding in relational databases with unordered tables versus views on Web and other media that may present data with related attributes next to each other. As in Property 1, we assess column/row/table embeddings.
Measure 2.
Given a table , let be the embedding of column/row/table in the -th column-wise shuffle of . Similarly, we measure the embedding variance using MCV in equation 1.
Property 3 (Join Relationship).
The join operation combining tuples from two or more relational tables, is one of the essential operations for data analysis. Thus the problem of finding join candidates in a table repository has been extensively studied (Zhang et al., 2010; Yakout et al., 2012; Zhu et al., 2016, 2019; Flores et al., 2021; Cong et al., 2023a). Join candidates are typically identified by some notion of value overlap similarity such as Jaccard and containment (Zhu et al., 2016, 2019; Flores et al., 2021) while the embedding approach has also been explored (Cong et al., 2023a). Their findings indicate that columns with significant value overlap are also close to each other in the embedding space. We investigate this postulate by assessing if there is a monotonic relationship between value overlap and embedding similarity.
Measure 3.
Consider pairs of query and candidate columns and their corresponding embeddings . Two random variables can be derived, the embedding similarity measure and the value overlap measure . In experiments, we use cosine similarity for and containment for where and is not biased towards small sets (Zhu et al., 2016, 2019). For completeness, we also experiment with Jaccard similarity (i.e., ) and multiset Jaccard similarity (i.e., ) for measuring value overlap.
With embedding similarity measure and value overlap measure calculated over pairs of query and candidate columns , we compute the Spearman’s
rank correlation coefficient between and as
| (2) |
where denotes the rank of a sample, is the covariance of the rank variables, and denotes the standard deviation.
Note that the Spearman coefficient ranges between -1 and 1, and considers the ranking values of two variables instead of raw variable values. A coefficient of 1 means the rankings of each variable match up for all data pairs and indicates there is a very strong positive monotonic relationship between two variables. We adopt the Spearman coefficient since it does not make any assumption of the underlying variable distributions.
Property 4 (Functional Dependencies).
Let be a relation with a set of attributes . Relation over is said to satisfy a functional dependency, denoted where , if for each pair of tuples in , implies (Abiteboul et al., 1995). Functional dependencies between columns provide a formal mechanism to express semantic constraints to the stored data, which is useful in many applications such as improving schema design, data imputation, and query optimization.
This property surfaces if models implicitly capture the relationship of functional dependencies in their representations (we are not aware of any model that explicitly takes functional dependencies into consideration in pretraining). Analogous to relationships between words (Mikolov et al., 2013) and entities in knowledge bases (Bordes et al., 2013), the functional dependency relationship can be interpreted as a translation in the embedding space. Consider the relation triple (, r, ), where r is the functional dependent relationship between value pair , . As demonstrated in (Bordes et al., 2013), such relationship reflects as a translation between the embeddings and . The translation vector represents relationship , which can be expected to remain equal in direction and magnitude across tuples if the relationship is preserved (Bordes et al., 2013; Mikolov et al., 2013). More precisely, consider any pair of tuples in with a functional dependency . We say that this functional dependency is preserved in an embedding space determined by a model if
given where is the embedding inferred with and denotes a distance metric preserving direction and magnitude.
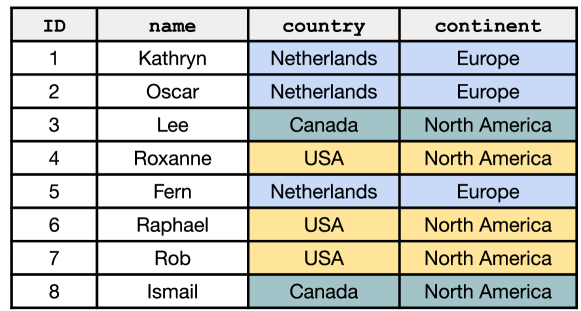
Example 0.
Consider a table containing four columns in Figure 3. There exists a functional dependency between non-key attributes country and continent, i.e., countrycontinent. satisfies this functional dependency because every instance of a specific value in column country, Netherlands for example, corresponds to the same value, i.e. Europe, in the corresponding tuples under column continent. By our definition, if an embedding space preserves functional dependencies, the squared Euclidean distances between embeddings generated for these specific value pairs will be (approximately) equal, despite influence of context on the embeddings.
Measure 4.
Given a table with functional dependency , we refer to the group of tuples with the same value of determinant as FD-group , to the value associated with in the dependent attribute set as , and to the embeddings of these values of the -th entry in the group as and , respectively. For instance, there are three FD-groups under the functional dependency country continent in the table shown in Figure 3, i.e., (Netherlands, Europe), (Canada, North America), (USA, North America) where the FD-group (Netherlands, Europe) has three entries.
Within each FD-group of size , we calculate distance metric for each embedding pair (, ), denoted as .The average group-wise variance over all FD-groups is calculated as:
In our experiments, we take as distance metric the - or -norm following (Bordes et al., 2013), while other distance metrics preserving norm direction and magnitude are valid too. approaches 0 if the translation between the group-wise FD value pairs in (country) and (continent) remains approximately equal for each FD group. We note that this does not require a strictly injective model. That is, the same value across different table contexts is not necessarily mapped to exactly the same vector in the embedding space in order for this measure to approach 0.
In addition, it is expected that this measure shows higher value ranges over column sets without functional dependencies. We collect a set of functional dependencies over tables and a set of tables in which no table contains functional dependent columns. We calculate the measure for all tables in the sets and . This yields two distributions of values. If the embeddings preserve functional dependencies, values over will be close to 0 and in general smaller than those over .
3.3. Data Distribution Properties
In practice, many aspects need to be considered when using embeddings including but not limited to the sample size, domain generalizability, robust representations of semantically similar values, and context. We introduce four properties involving data distributions that concern these four aspects.
Property 5 (Sample Fidelity).
Large relational tables can easily have millions or even billions of rows. Embedding an entire table or even a single large column with a model is often infeasible due to constraints on the input length of models or memory constraints of computing resources. On the other hand, it may not be necessary to embed the full table for a downstream task (Yin et al., 2020b; Suhara et al., 2022; Cong et al., 2023a). In practice, existing work resorts to sampling, either up to the input limit or based on content relevance, as a straightforward workaround. While sampling provides a feasible solution, it also introduces a trade-off between computational cost and the fidelity of the embedding inferred from a smaller sample compared to the embedding that would have been obtained if the entire dataset were used. It is then essential to understand the fidelity of sample embeddings from a model by evaluating the extent to which sample embeddings deviate from the embeddings of full values.
Measure 5.
Given a full column and a sample , we define sample fidelity as a similarity measure between the embedding of the full column and the sample embedding where can be cosine similarity for instance. Similar to (Wang et al., 2021), we split a full column into chunks with the shared header and obtain the full embedding by aggregating the chunk embeddings. This is because a full column may not fit into a single sequence for model ingestion.
For each column , we perform uniform random sampling to get distinct samples from and report the average column sample fidelity
as well as the multivariate coefficient of variation over the embedding set . Since tables in a corpus may have various sizes, we experiment with different sampling fractions (e.g., 0.25, 0.5, and 0.75) instead of varying the absolute number of samples in evaluations.
This simple measure gives a good indication of computing efficiency and monetary cost. For example, provided that cloud vendors take a pay-as-you-go model, users do not need to pull out all their data to infer embeddings and pay the full scanning cost.
Property 6 (Entity Stability).
Stability is a notion in NLP (Wendlandt et al., 2018; Antoniak and Mimno, 2018) that indicates the variability of word embeddings relative to training data, training algorithms, and other factors in embedding model training. The idea is to use the overlap between nearest neighbors of queries (i.e., words) found in different embedding spaces111An embedding space refers to a vector space that represents an original space of inputs (e.g., words or table columns). as a proxy of agreement between embedding spaces. We borrow this notion to explore the (in)stability of entity embeddings.
Given embedding spaces determined by embedding models , consider an entity cell in a relational table where is the entity mention and is associated metadata if exist (such as the entity linked to the cell from a knowledge base, the column name, and the table caption). Retrieve nearest neighbor entities of in each embedding space. The stability of entity across embedding spaces is defined as the average over all pairwise percent overlap between two embedding spaces.
Example 0.
Take the entity column competition in Figure 2 for example. World Championships is an entity mention that links to a Wikipedia entity 1997_World_Championships_in_Athletics_-_Men’s_Decathlon. Depending on the context, the same entity mention may link to another distinct entity, for instance, BWF_World_Championships.
Measure 6.
We consider the case when (i.e., two embedding models and ). We randomly sample entities, and for each entity , let and be the sets of nearest neighbors of in two embedding spaces, respectively. We compute the average entity stability as
which ranges between 0 and 1. A value of 1 indicates a perfect agreement between two embedding spaces while 0 indicates a complete disagreement.
For entity-centric downstream tasks, one can run this experiment over a model to first see if the retrieved sets of nearest neighbors to entities of interest fit their task domains. If not, one may want to try a different model with a low entity stability relative to . This is because a model with high entity stability relative to will be more likely to retrieve a set of entities similar to that of and fail to fit task domains as well.
Property 7 (Perturbation Robustness).
Neural model performance has been found vulnerable to input perturbations. For example, state-of-the-art text-to-SQL models are shown to suffer from nuanced perturbations to database tables, natural language questions, and SQL queries (Chang et al., 2023a). Such perturbations are designed to preserve semantics and can reveal a model’s capacity to capture semantics. We hypothesize that preserving semantic similarities in the embedding space is key, especially, for downstream tasks such as retrieval, text-to-SQL and question answering. We therefore inspect the impact of input perturbations in the embedding space by measuring the robustness of column-level embeddings with respect to semantics-preserving perturbations.
Example 0.
Three database perturbations curated by (Chang et al., 2023a) include schema-synonym, schema-abbreviation, and column- equivalence. schema-synonym and schema-abbreviation replace the name of a column with its synonym (”country” ”nation”) and abbreviation (”CountryName” ”cntry_name”), respectively. column-equivalence further perturbs both column names and contents, and may replace numerical columns with semantic-equivalent ones (”age” ”birthyear”).Measure 7.
Given a set of original columns , we consider a set of perturbed variants for each . The perturbations are semantics-preserving and can be at the schema level or data level or both. We compute the embedding cosine similarity of and average over all pairs for each . We draw a distribution plot of average cosine similarity over across models and also report a single number of cosine similarity averaged over all pairs for each model.
Property 8 (Heterogeneous Context).
Unlike coherent natural language sequences, tables are typically more heterogeneous comprising various types of data such as numeric, categorical, and datetime. As table embedding models mostly extend the architecture of language models and by default take context into consideration, it is less clear how much influence context has on embedding representations, especially for numeric data (Hulsebos et al., 2019; Suhara et al., 2022). Without context (e.g., subject columns222The subject column of a table, if exists, contains the entities the table pertains to. or neighboring columns), non-textual types of data, especially numerical columns, are typically hard to discriminate. Thus, it is important to understand the impact of context for many downstream tasks like semantic type prediction and relation extraction. In this property, we probe into the difference between contextual column embeddings and single-column embeddings for both textual and non-textual types of data.
Example 0.
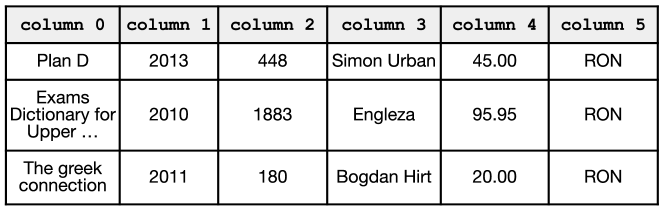
Figure 4 shows a table from the SOTAB benchmark (Korini
et al., 2022). The table does not have a header and consists of both textual and non-textual data columns. Without context, column 4 is hard to interpret on its own, which could be percentages, prices or any metric numbers. However, the neighbor column to the right, namely column 5, which refers to the currency of Romania, can provide clues to the semantic meanings of column 4. In this context, it is more likely that column 4 contains price values.
Measure 8.
To measure the effect of context, we consider four different input settings to get column embeddings as specified below. We compare embeddings of single columns with contextual column embeddings using their cosine similarity.
-
(a)
Only the column itself;
-
(b)
Subject column as context (if not exist, use the first textual column from the left of a table as the proxy);
-
(c)
Immediate neighboring columns on both sides as context;
-
(d)
The entire table as context.
4. Experiment Setup
4.1. Embedding Models
We consider well-established models and their variants that have been adopted for data management problems and open-sourced for public access. In particular, we select representative models from two categories: LMs and specialized table embedding models. Vanilla LMs are those designed for modeling natural language sequences and thus do not take into account the structure of tables or tabular data distributions. We include them in Observatory for comparison as many table embedding models share very similar architectures with weights initialized from LMs.
Language Models
We take in BERT (Devlin et al., 2019), RoBERTa (Liu et al., 2019), and T5 (Raffel et al., 2020). BERT is a pioneer transformer-based model that learns contextual representations from unlabeled text. RoBERTa builds on top of BERT and systematically studies the impact of key hyperparameters and training data size. Both models are go-to options for a wide range of NLP tasks and are bases for many tabular language models. T5 is a representative of large language models whose largest variant has 11 billion parameters. We use base versions of all three models from the HuggingFace library (Wolf et al., 2020) in the experiments.
| Model | Input | Output Embedding | Downstream Task |
|---|---|---|---|
| TURL | Table + metadata | Entity / Col. / Col. pair | Table interpretation/augmentation |
| DODUO | Table | Col. / Col. pair | Column type/relation prediction |
| TAPAS | NL question + table | Question / Table | Semantic parsing |
| TaBERT | NL question + table | Col. / Table | Semantic parsing |
| TaPEx | SQL query + table | Row / Table | Table Question Answering |
| TapTap | Table | Row | Data augmentation/imputation |
Table Embedding Models
We include TURL (Deng et al., 2020b), DODUO (Suhara et al., 2022), TAPAS (Herzig et al., 2020), TaBERT (Yin et al., 2020b), TaPEx (Liu et al., 2022), and TapTap (Zhang et al., 2023). TURL, TAPAS, TaBERT, TaPEx, and TapTap first pretrain models over tables in an unsupervised manner by, for example, predicting masked column names or query execution results. The pretrained models are then fine-tuned for particular downstream tasks. We use pretrained models in the experiments as prescribed in our problem statement. DODUO directly fine-tunes a BERT-based model with labeled data from downstream tasks. See Table 1 for an overview of model specifications. The models we assess in experiments cover all levels of output embeddings, i.e., column, row, cell, and table embeddings.
4.2. Datasets
We use both relational database tables and web tables for evaluation.
WikiTables. The WikiTables (Bhagavatula et al., 2015) corpus contains 1.6M HTML tables of relational data extracted from Wikipedia pages. TURL preprocesses WikiTables and obtains an entity-rich dataset of 670,171 tables. We use the test partition released by TURL (Deng et al., 2020a).
Spider. Spider (Yu et al., 2018a), a widely-used semantic parsing and text-to-SQL dataset, includes 5,693 SQL queries over 200 databases across domains. We use the development set (Yu et al., 2018b) and run HyFD (Papenbrock and Naumann, 2016), a functional dependency discovery algorithm, to create a dataset with annotated functional dependencies. To avoid mining a massive number of functional dependencies, we set the size of determinant to 1 and found 713 functional dependencies. We also collect an equal number of random pairs of columns without the relationship of functional dependencies for our experiments.
Dr.Spider. Dr.Spider (Chang et al., 2023a) designs perturbations to databases, natural language questions, and SQL queries in Spider to test the robustness of text-to-SQL models. We take advantage of database perturbation tests in Dr.Spider (Chang et al., 2023b) to evaluate the property of perturbation robustness.
NextiaJD. Flores et al. (Flores et al., 2021) collected 139 datasets from open repositories such as Kaggle and OpenML for predicting joinable columns. They also divided datasets into four testbeds based on dataset file size. For example, NextiaJD-XS includes datasets smaller than 1 MB while NextiaJD-L consists of datasets larger than 1 GB. Candidate pairs of columns are labeled with the join quality using a measure that takes account of both containment and cardinality proportion with empirically determined thresholds. For our evaluation, we use all pairs with join quality greater than 0.
SOTAB. The Schema.org Table Annotation Benchmark (Korini et al., 2022) provides about 50,000 annotated tables collected from the WDC Schema.org Table Corpus for both column type and column property annotation tasks. We extract a subset that contains 5,000 tables for 20 semantic data types. The subset is balanced in terms of the number of non-textual and textual data types. Non-textual types include DATE, ISBN, POSTAL CODES, MONEY (monetary values), and QUANTITY (measurements as of weight etc.). We use this subset for measuring the property of Heterogeneous Context.
Note that a dataset may not accommodate all the properties. For example, WikiTables does not have information of which two columns can be joined, so we do not measure the property of Join Relationship over WikiTables. On the other hand, properties such as Functional Dependencies and Heterogeneous Context require synthesized datasets for evaluation purposes. Table 2 summarizes the datasets and assessed models for each property. Also note that TURL, TaBERT, and TapTap are excluded from certain experiments. This is because TURL is designed and implemented to output embeddings from entity-rich tables like those in WikiTables; TaBERT yields only column embeddings after the fusion of the vertical attention mechanism; and TapTap encodes single rows independently using a text template serialization strategy and only gives row embeddings.
| Property | Dataset | Models in Scope |
|---|---|---|
| Row order insignificance | WikiTables | Except TapTap |
| Column order insignificance | WikiTables | All |
| Join relationship | NextiaJD | Except TURL and TapTap |
| Functional dependencies | Spider | Except TURL, TaBERT, and TapTap |
| Sample fidelity | WikiTables | Except TapTap |
| Entity stability | WikiTables | Except TaBERT and TapTap |
| Perturbation robustness | Dr. Spider | Except TURL and TapTap |
| Heterogeneous Context | SOTAB | Except TURL and TapTap |
4.3. Implementation
In general, we follow the original papers and their implementations in our evaluation. However, there are subtleties where extra consideration is needed, such as aligning the input and output across models for fair comparison. We make (minimal) design decisions in our implementation as discussed below.
Table Serialization
As Transformer-based models expect to take sequence inputs, a key input processing step is to serialize two-dimensional tabular data into flattened sequences of tokens. Table embedding models considered in this analysis generally follow two common types of serialization methods.
-
(1)
Row-wise serialization. Tables are parsed by rows, which are further concatenated with optional insertions of special tokens as delimiters. TURL, TAPAS, and TaBERT fall under this category despite the difference that TAPAS uses dedicated positional embeddings to indicate the row and column in which a token appears while TaBERT explicitly adds [SEP] tokens to mark boundaries of cells in the sequences.
-
(2)
Column-wise serialization. Alternatively, tables can be serialized by column. For DODUO, [CLS] tokens (as many as the number of columns) are inserted to separate values from different columns and are effectively used as column representations.
For each table embedding model, we adopt the serialization method as proposed in the original papers. Since vanilla language models do not have a default serialization method for tabular data, we experimentally apply row/column-wise serialization as applicable. In practice, models also enforce a length limit to token sequences (e.g. 512 is a common maximum). To ensure that all models take in (almost) the same inputs regardless of serialization methods, we keep all the columns for each table, if possible, and preserve as many rows as the length limit permits. We use binary search to find the maximum number of rows that can fit into the input limit.
Embedding Retrieval
We use the embeddings provided by a model, if they are available. However, due to designs for particular downstream tasks, a model may not readily expose certain levels of embeddings needed for measuring a property. For instance, TAPAS does not give row or column embeddings out of the box. We circumvent this obstacle by observing that all the models can output token-level embeddings and some table embedding models have additional mask embeddings or positional embeddings that indicate to which row and column a token belongs. Therefore, we can aggregate token embeddings (by averaging them for example) to embeddings on a level (e.g. row or column) as needed. In particular, we take advantage of different serialization methods and use special tokens to retrieve row or column or table embeddings. As to cell embeddings needed for the property Functional Dependencies and entity embeddings as needed for the Entity Stability property, we keep track of token positions in the table and aggregate them accordingly. We take this alternative since inserting special tokens for each cell quickly uses up the input limit.
The practice of inserting special tokens and aggregating lower level of embeddings is common in the literature (Yin et al., 2020b; Deng et al., 2020b; Li et al., 2020; Suhara et al., 2022; Cong et al., 2023b). As noted in our problem statement (Section 3.1), we consider pretrained models in Observatory, thereby not fine-tuning any model for downstream tasks. We illustrate in Section 6 that the characterization of pretrained models remain effective for anticipating behaviors of finetuned models on various downstream tasks.
5. Results
In this section, we present the experiment results and our analysis and describe the characteristics of models over the eight properties.
5.1. Row Order Insignificance
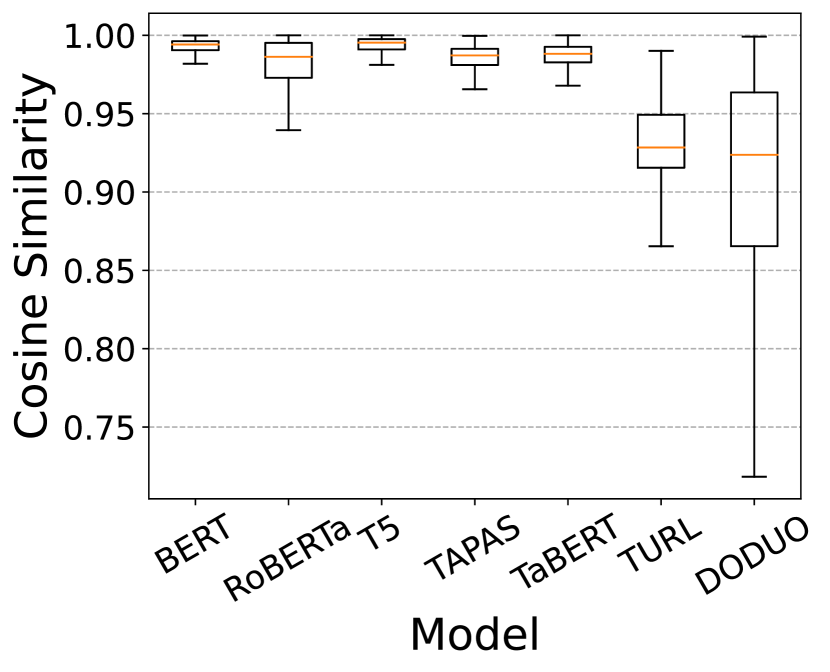
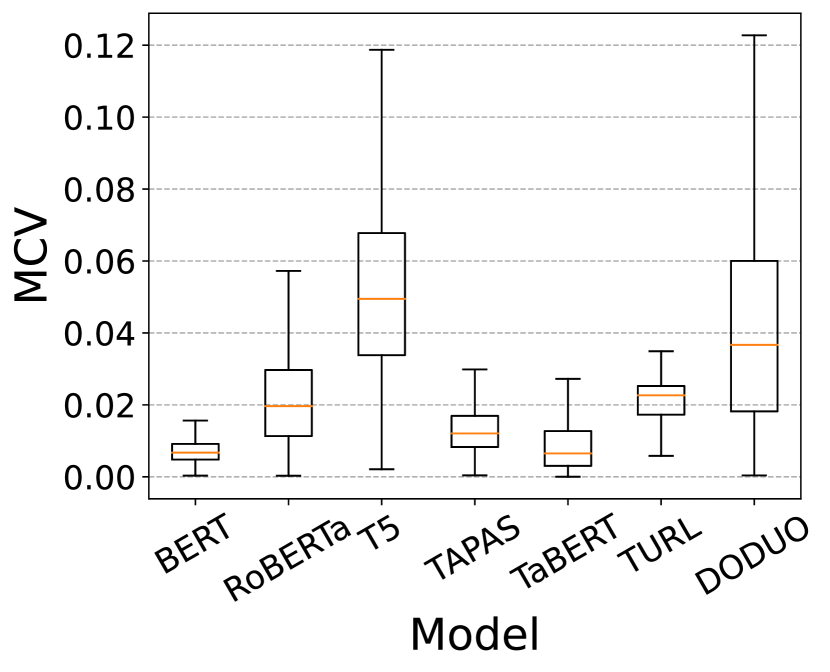
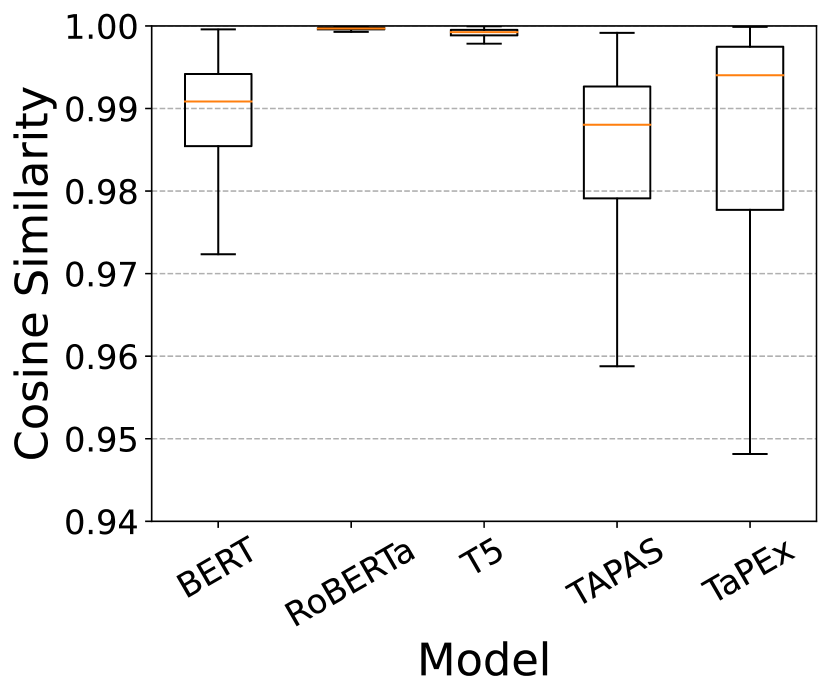
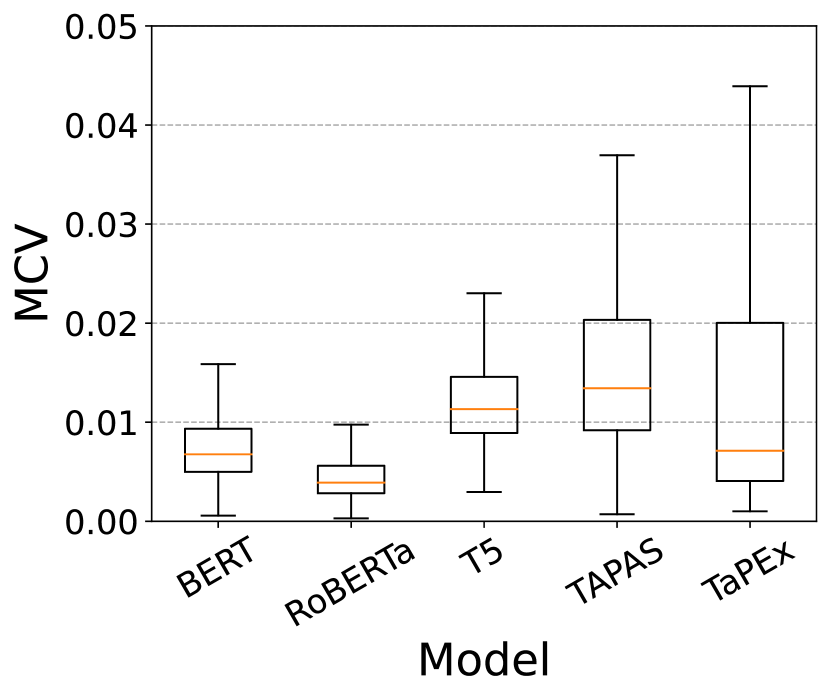
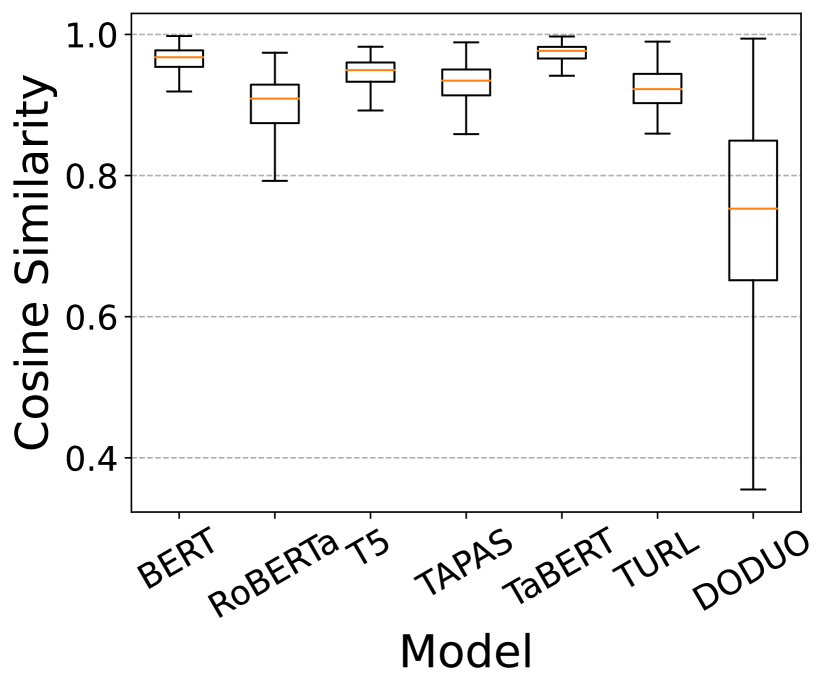
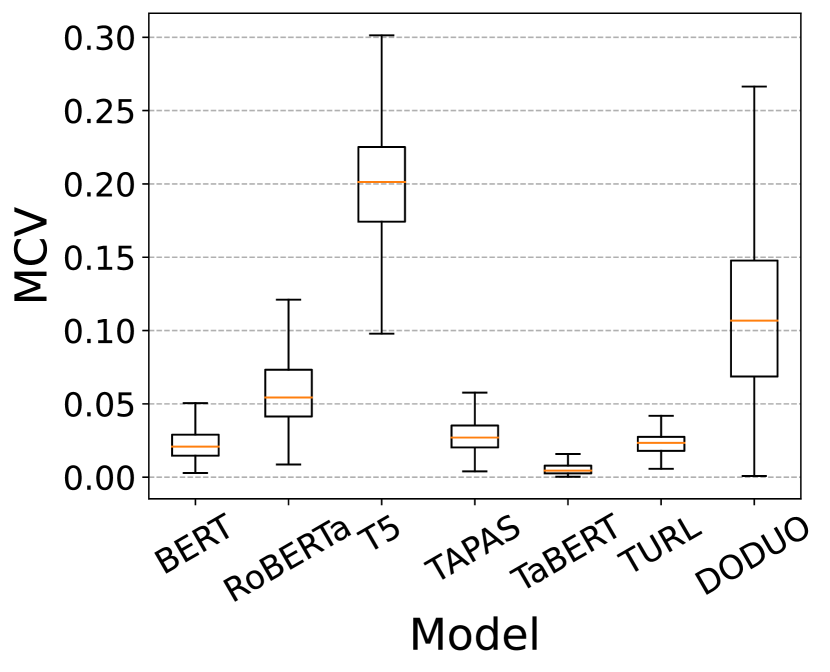
We calculate cosine similarity and MCV (as defined in Measure 1) measures over column, row, and table embeddings and plot their distributions in Figure 5. Overall, table embedding models exhibit comparably lower cosine similarity while both language and table embedding models may exhibit high MCV.
On the top row of Figure 5, column embeddings of five models BERT, RoBERTa, T5, TAPAS, and TaBERT show strong evidence of being robust to row order shuffling in terms of cosine similarity. In particular, the first quartile (Q1) of these models is above 0.97 and the minimum (Q1 - 1.5 interquartile range) is above 0.95 except RoBERTa. TURL follows with Q1 above 0.92 and the minimum above 0.86. DODUO exhibits the largest spread with the minimum below 0.75 while the median is over 0.91. This implies that DODUO is relatively sensitive towards row order, given that the content of these rows is not altered. We illustrate in Section 6 how DODUO’s sensitivity to row order shuffling translates to unstable predictions in a downstream task for which DODUO is proposed.
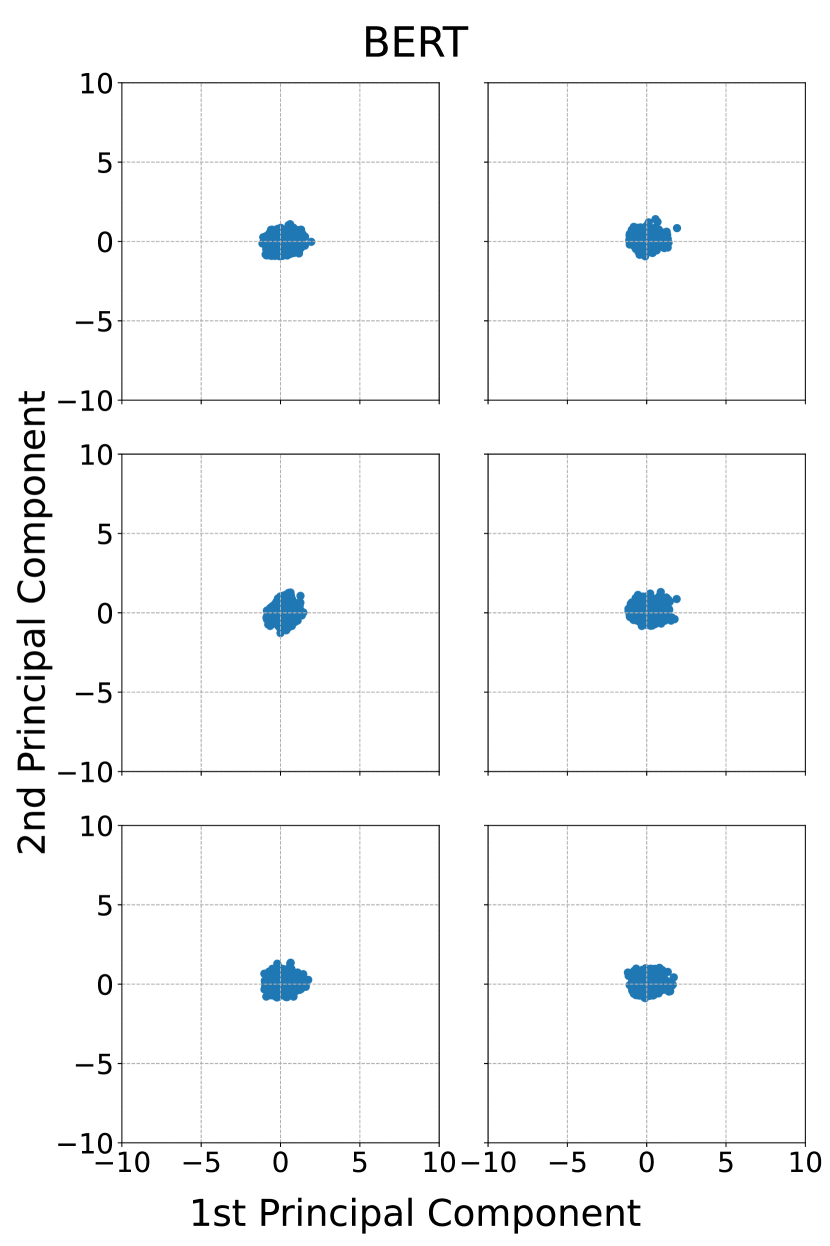
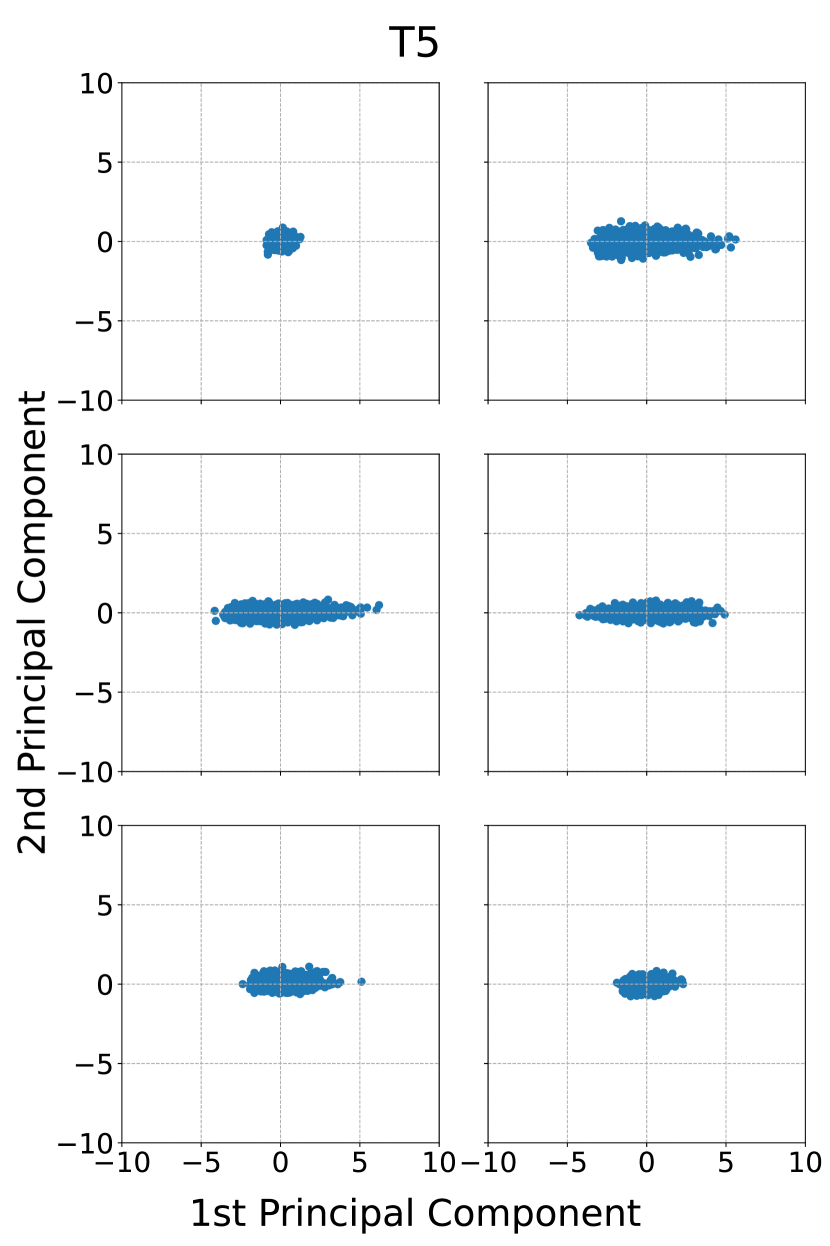
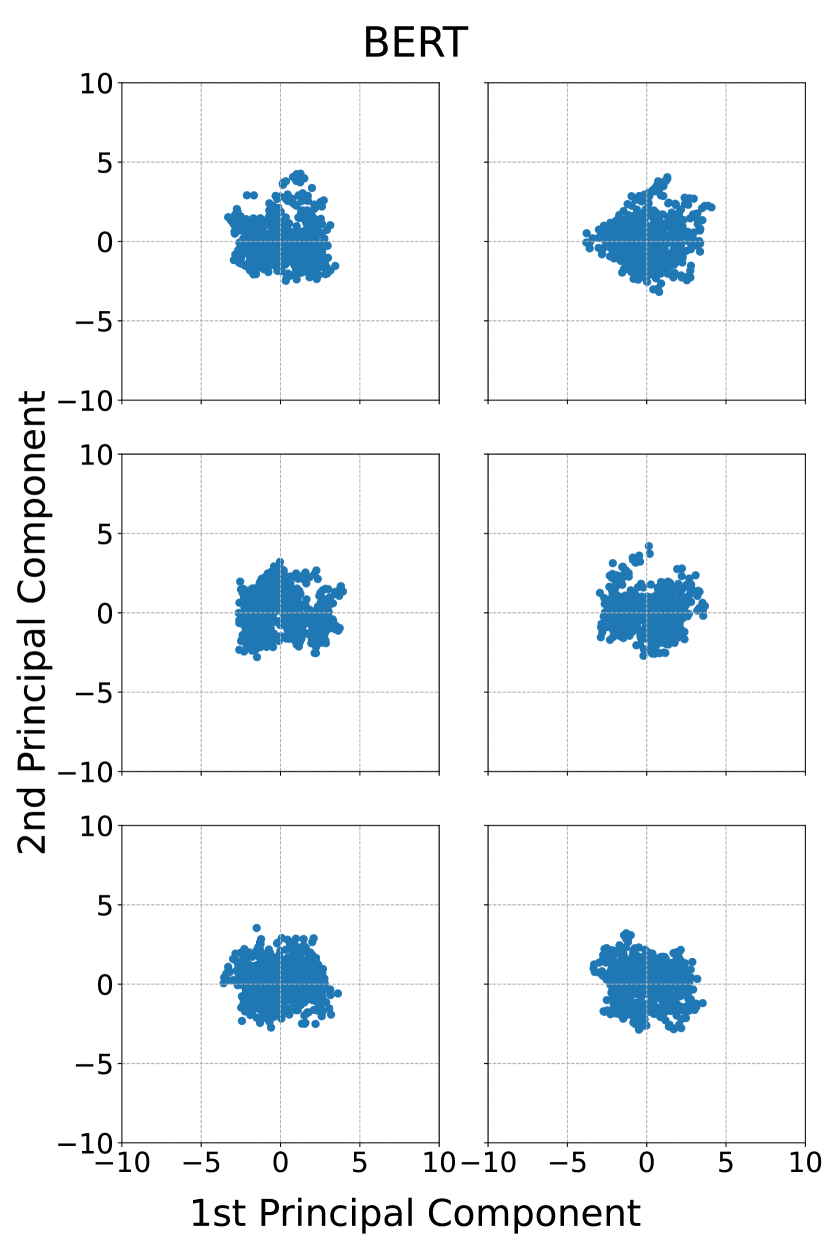
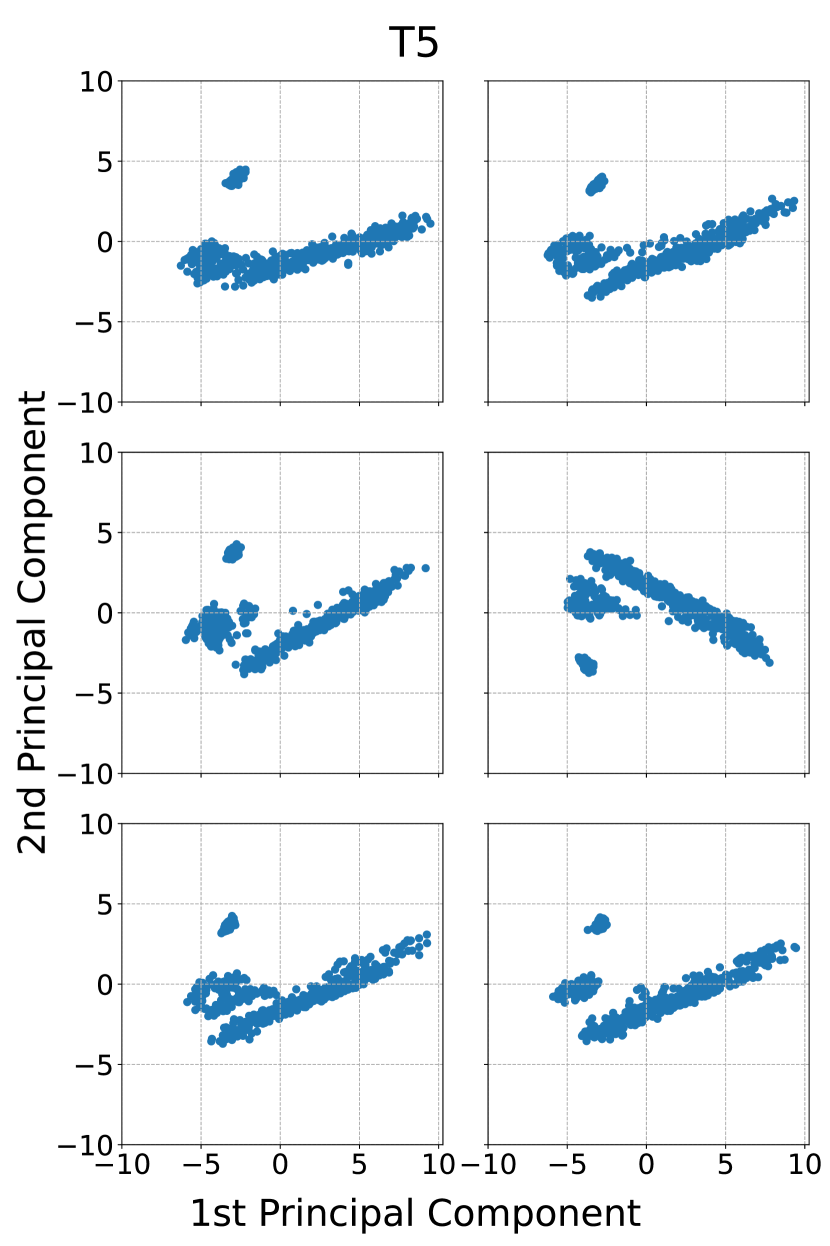
The MCV measure (the lower the better) indicates the variability of different populations (i.e., embedding distributions given by different models), especially when they have different means. It is notable that T5 has the largest third quartile (Q3) and second largest maximum (Q3 + 1.5 interquartile range) while T5 embeddings have high cosine similarities. We hypothesize that this is because T5 embeddings are more dispersed in a specific direction in high-dimensional space compared to models with low MCVs such as BERT. We verify this by visualizing the PCA projections of embeddings in two-dimensional space. For demonstration purposes, we use a table in which T5 embeddings of three columns yield high MCV scores (larger than 0.08, which is higher than Q3). Correspondingly, the projections of T5 embeddings of these three columns (top-right, middle left and middle right) are indeed more stretched along a specific direction than those of BERT as demonstrated in Figure 6.
With regard to row embeddings (the middle row of Figure 5), it is noticeable that BERT obtains high cosine similarity with the minimum above 0.95 and low MCV with Q3 below 0.03. On the other hand, row embeddings of RoBERTa, T5, TAPAS and TaPEx appear to vary more in MCV than their column embeddings. As seen in the bottom row of Figure 5, unlike column and row embeddings, table embeddings of assessed models manifest exceptionally high cosine similarity and low MCV. Precisely, the minimum of the cosine similarity of each model is above 0.94 and the range of MCV is also 5 smaller than that of row embeddings.
These findings also underline the importance of combining the cosine similarity and MCV for measuring row order insignificance, as a single measure would give a limited perspective.
5.2. Column Order Insignificance
The results of column shuffling follow a similar trend as that of row shuffling. Nevertheless, column shuffling appears to cause more variations in all three levels of embeddings for both cosine similarity and MCV measures. In the interest of space, we only show column and row embeddings in Figure 7.
Considering, for example, the column embeddings in Figure 7, the median cosine similarity of RoBERTa embeddings drops by more than and the same statistic of DODUO embeddings drops by more than . The median MCV of both RoBERTa and T5 also increases by four times. To verify such large variations, we again visualize the PCA projections of T5 embeddings in Figure 8 for the same table as used in Figure 6. This figure confirms that the first principal component of T5 embeddings manifests larger spread, and illustrates the spread along the horizontal axis across all columns (instead of merely 3, as when rows are shuffled) indicating a higher sensitivity to column order than row order.
5.3. Join Relationship
| BERT | RoBERTa | T5 | TAPAS | TaBERT | DODUO | |
|---|---|---|---|---|---|---|
| Containment | 0.241 | 0.412 | 0.649 | 0.438 | 0.506 | 0.438 |
| Jaccard | 0.288 | 0.339 | 0.563 | 0.368 | 0.553 | 0.441 |
| Multiset Jaccard | 0.670 | 0.512 | 0.647 | 0.655 | 0.721 | 0.696 |
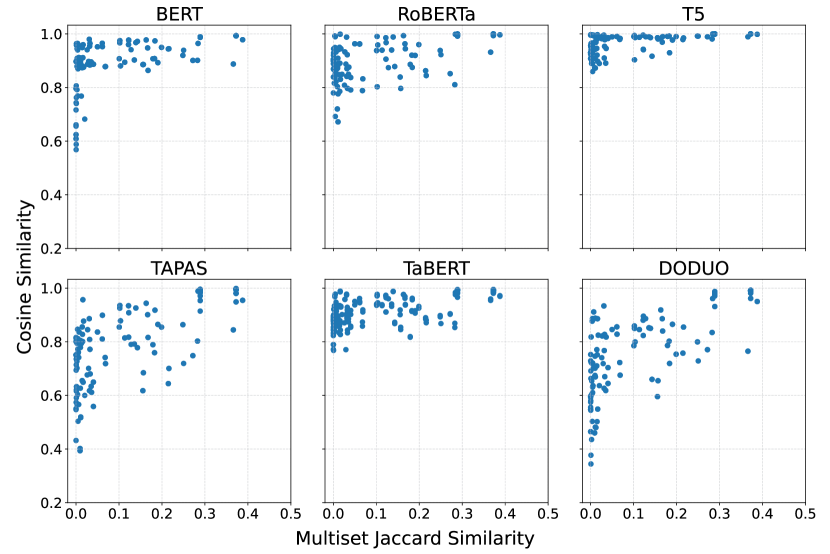
Table 3 presents the Spearman coefficients between a value overlap measure and embedding cosine similarity over joinable pairs of columns from the NextiaJD-XS dataset. We find that, among the considered value overlap measures (containment, Jaccard, and multiset Jaccard), multiset Jaccard similarity is most positively correlated with embedding cosine similarity. For all models, the coefficient value between multiset Jaccard and embedding cosine similarity is above 0.5, which indicates a moderate positive correlation (TaBERT has a coefficient value of 0.72 which indicates a high positive correlation), and is significantly higher than that of the other two measures (). This difference can be attributed to the fact that containment and Jaccard similarity do not take duplicate values into account while we use all values for embedding inference. In Figure 9, we also show scatter plots of embedding cosine similarity versus multiset Jaccard over pairs of joinable columns from NextiaJD-XS for each model, which demonstrates the moderate positive correlation between the two variables. Note that the maximum possible value of multiset Jaccard similarity is 0.5.
Both syntactic and semantic approaches have been employed for data discovery (Nargesian et al., 2018; Bogatu et al., 2020; Cong et al., 2023b). It is valuable to be aware of what syntactic measure is highly correlated with a semantic measure based on embeddings so that one can ensemble less correlated syntactic and embedding measures if they want to find more diverse candidates. For instance, consider the task of join discovery over NextiaJD-XS. Based on Table 3, it is recommended to use containment as the syntactic similarity measure when BERT embeddings are used to measure semantic similarities because these two measures show the least correlation. Similarly, it is recommended to use the Jaccard similarity when TAPAS embeddings are used.
5.4. Functional Dependencies
| BERT | RoBERTa | T5 | TAPAS | DODUO | |
|---|---|---|---|---|---|
| Columns w/ FD | 0.87 | 0.39 | 1.80 | 0.88 | 83.34 |
| Columns w/o FD | 0.78 | 0.34 | 1.13 | 1.12 | 229.77 |
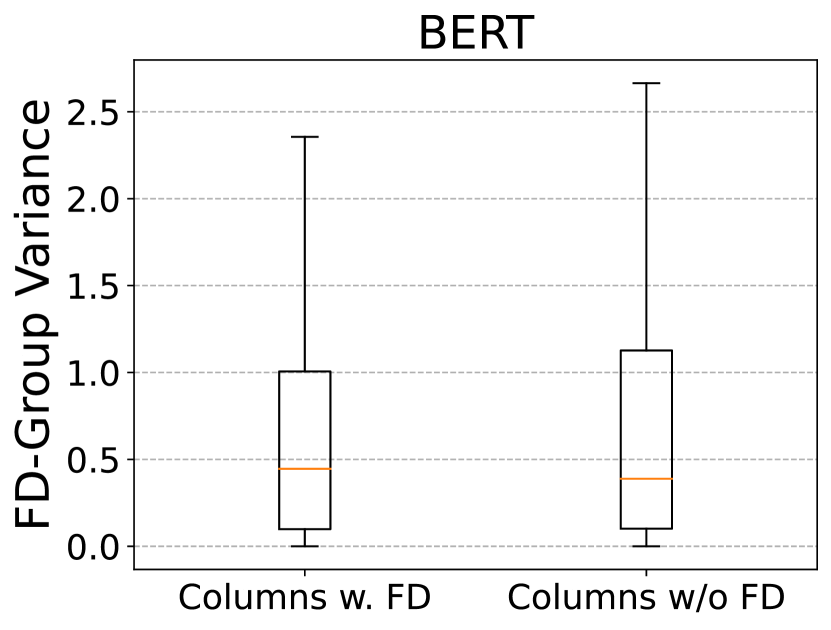
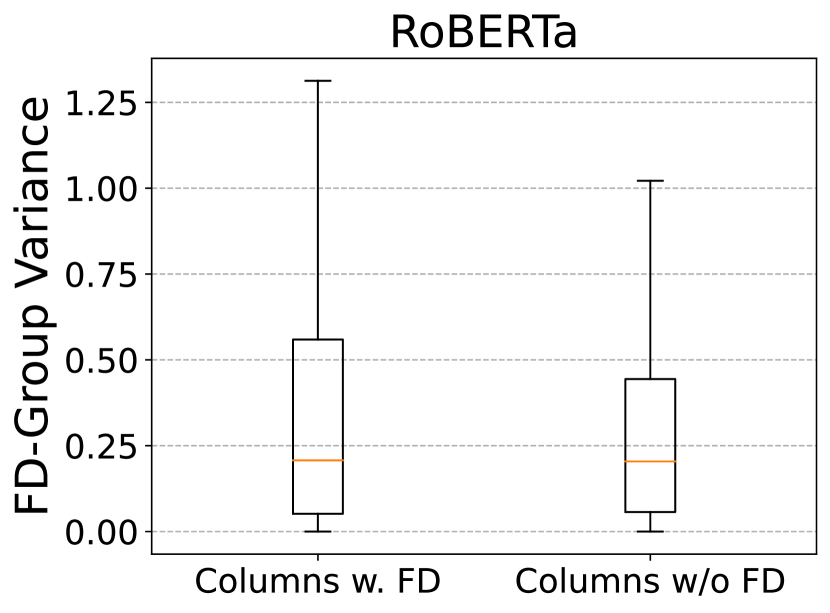
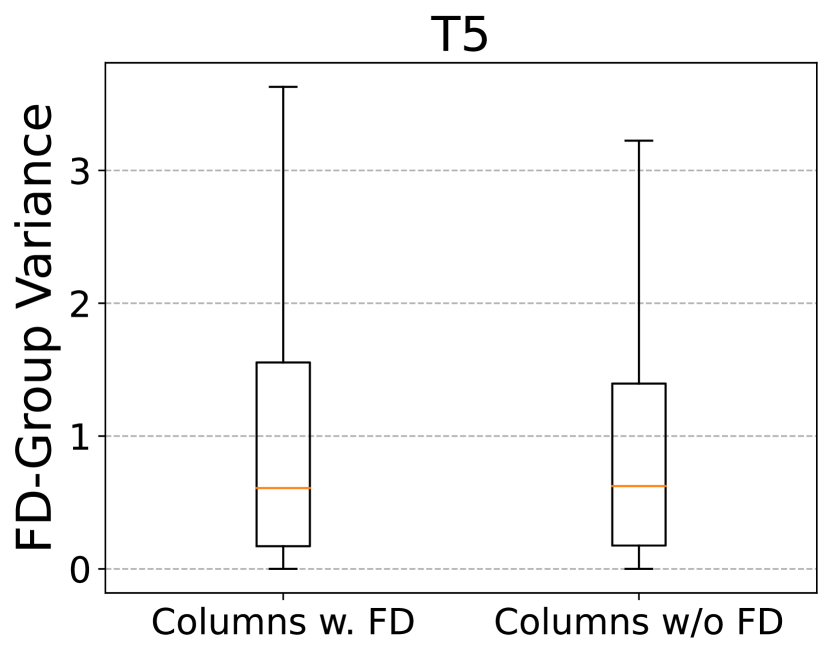
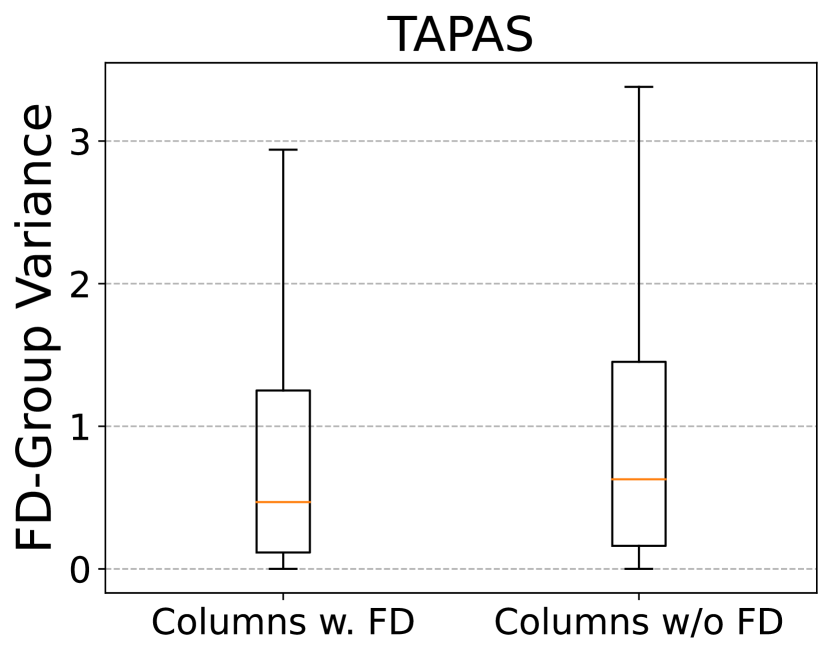
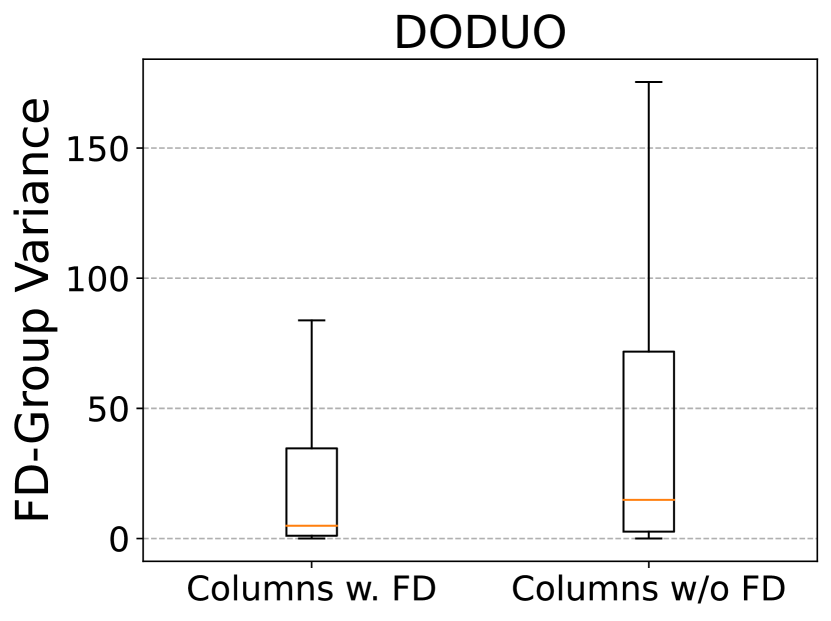
Table 4 displays the average variance of the L2 norm of translation embeddings over column pairs, comparing those with and without functional dependencies. Vanilla language models exhibit no significant reduction in variance for columns with functional dependencies, as expected, given their lack of consideration for table structure during pretraining. In contrast, table embedding models, including DODUO and TAPAS, show variance patterns contrary to vanilla language models, though the average variance of DODUO is not close to 0. Despite TAPAS aligning with expected patterns, Figure 10 reveals that none of the models distinctly separate variance distributions for column pairs with and without functional dependencies. This lack of clear separation provides evidence that none of the models effectively capture the relationship of functional dependencies in their representations.
5.5. Sample Fidelity
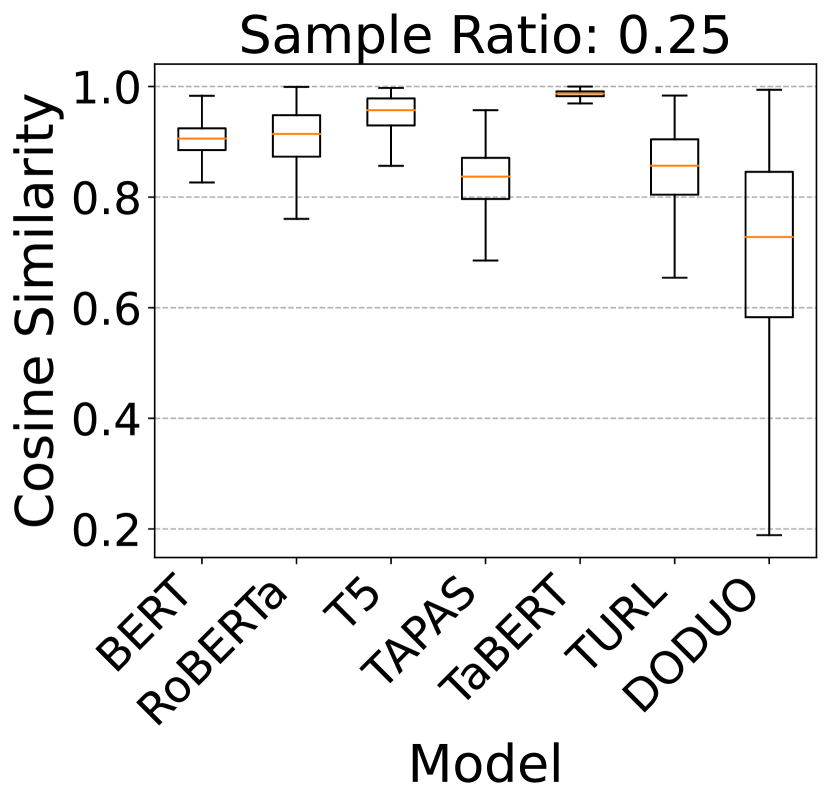
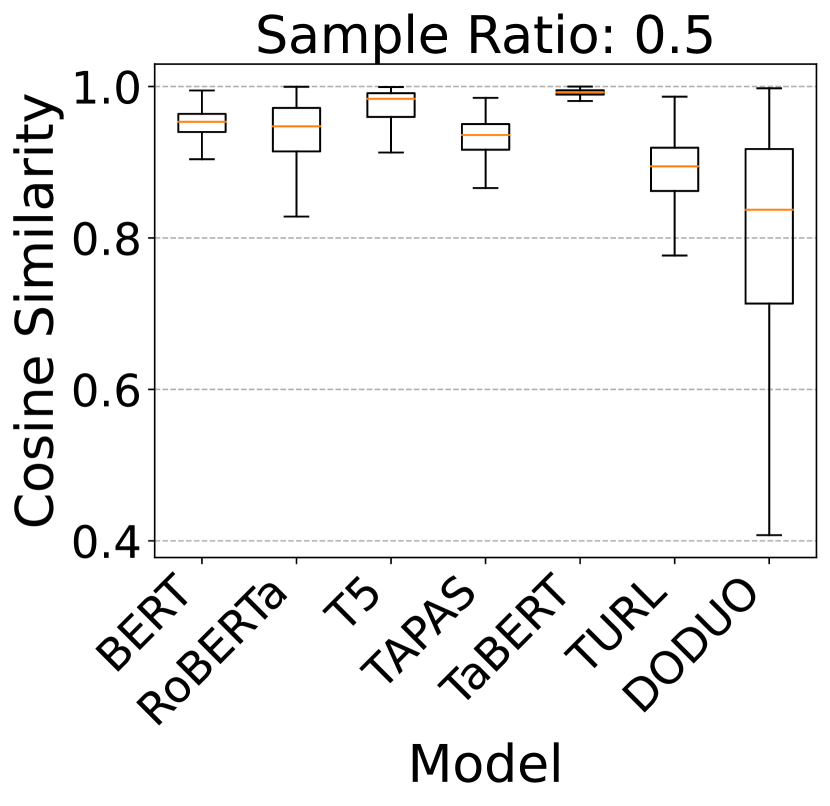
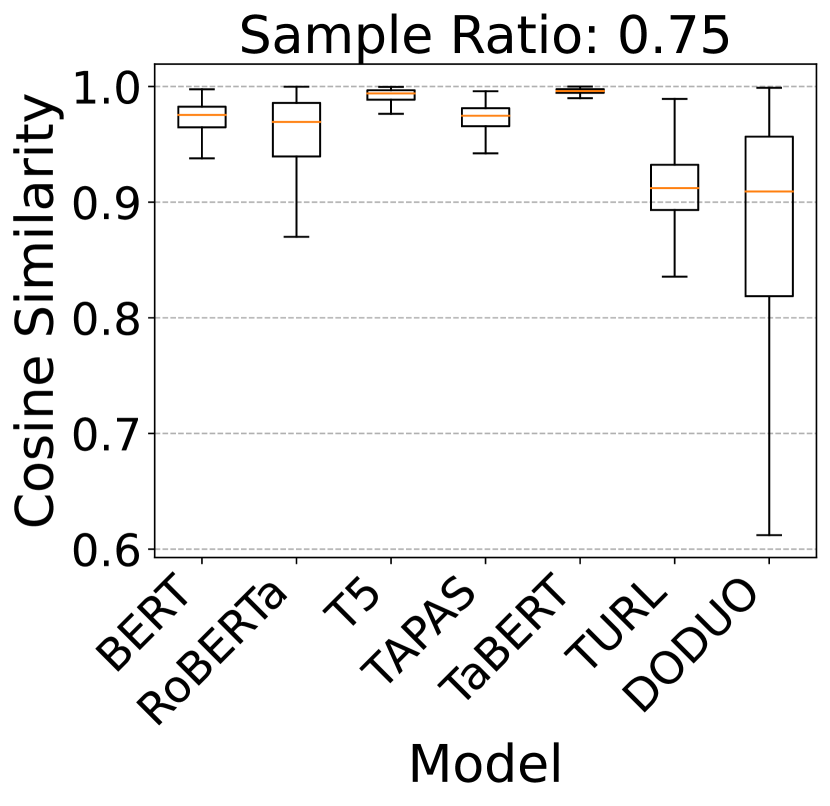
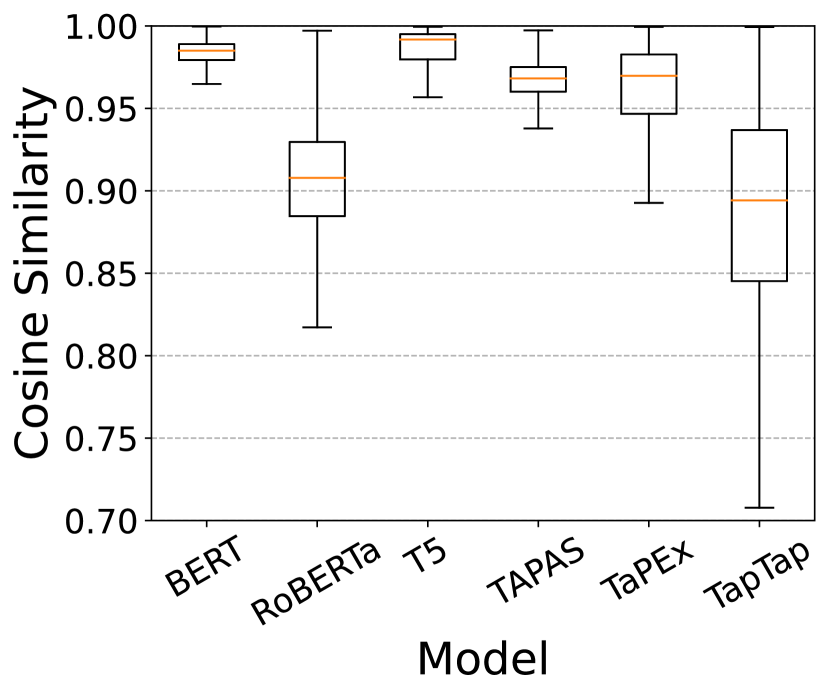
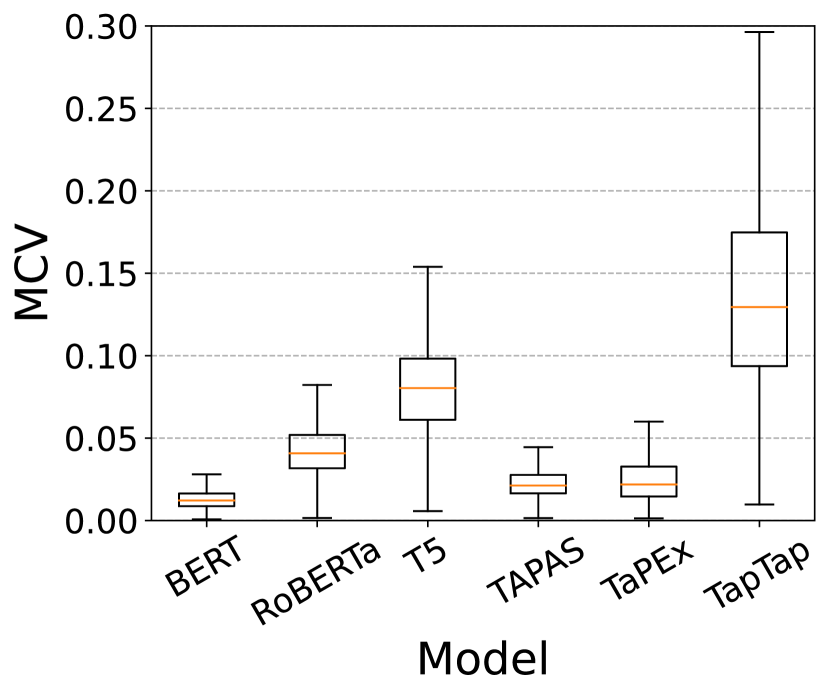
Figure 11 depicts sample fidelity distributions of models across various sample ratios. As the ratio increases, sample embeddings tend to align more closely with those from full values in terms of cosine similarity, evident in the ascending quartile values of embedding cosine similarity in the box plots.
Vanilla language models consistently show high sample fidelity, reaching a median over 0.9 at a 0.25 sample ratio and exceeding 0.95 at a 0.75 ratio. Notably, T5 demonstrates strong robustness to sampling, with over 75% of tested pairs having cosine similarity surpassing 0.95 when half of the values are sampled. Table embedding models, excluding TaBERT, exhibit larger distribution spreads, particularly at a 0.25 sample ratio. TaBERT stands out as the most sample-robust model, consistently maintaining cosine similarity over 0.95 across all sample ratios. This robustness stems from TaBERT’s internal practice of always considering the first three rows (Yin et al., 2020a), increasing the likelihood of overlapping or identical inputs despite sampling. While TAPAS emerges as the next sample-robust model, achieving high fidelity comparable to vanilla language models at a 0.5 sample ratio, DODUO lags behind and proves more sensitive to sampling across all ratios, consistent with the results of row and column shuffling.
5.6. Entity Stability
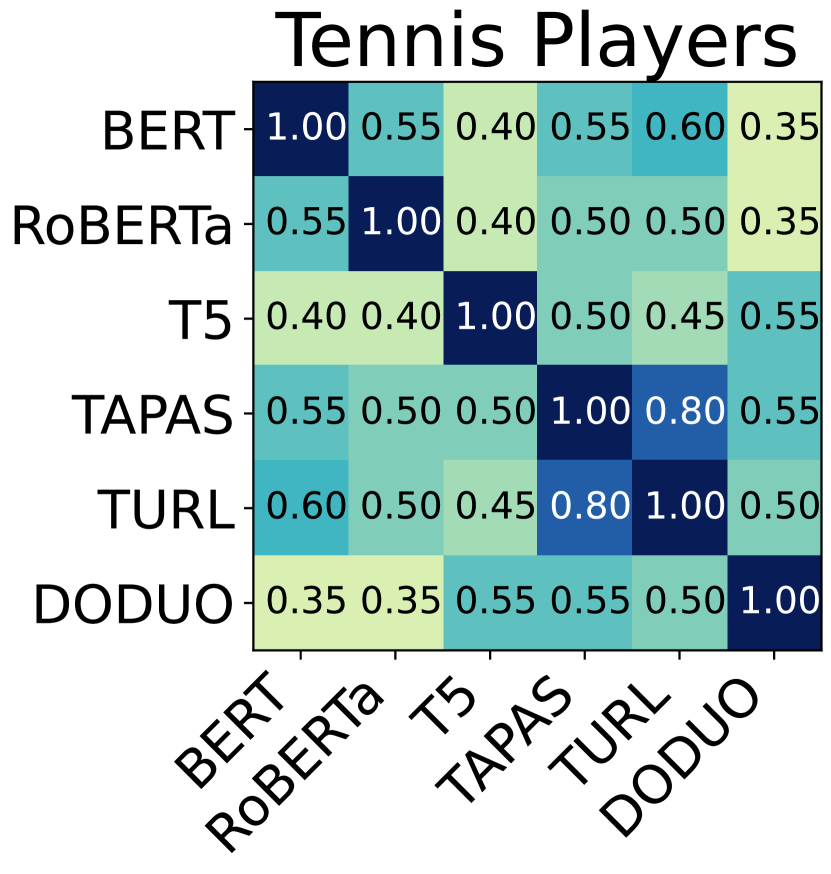
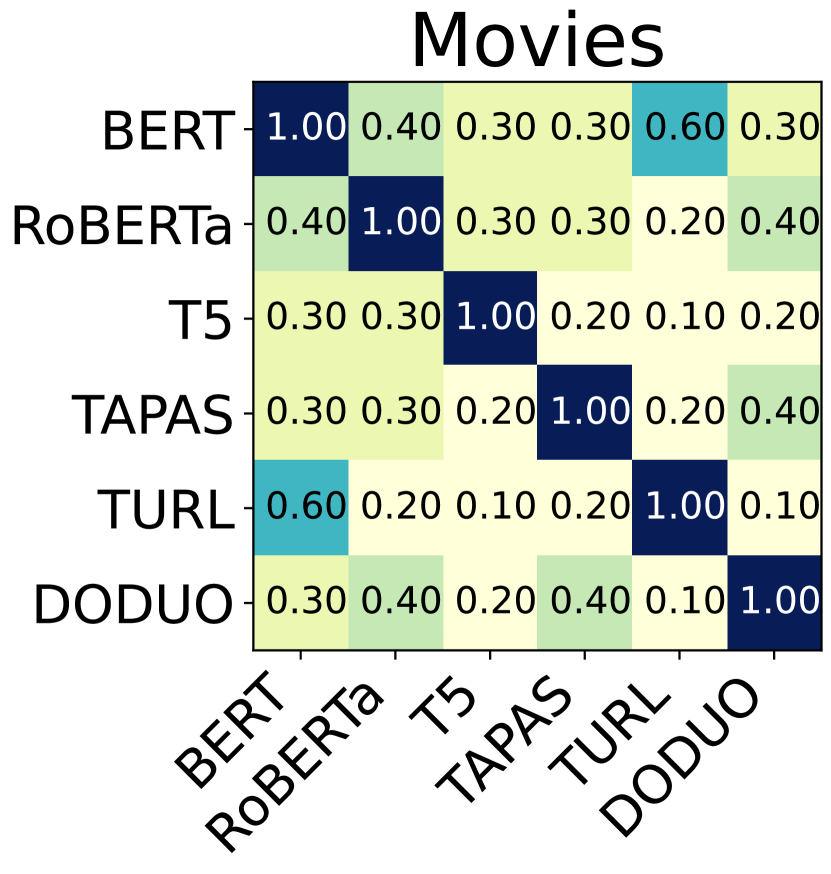
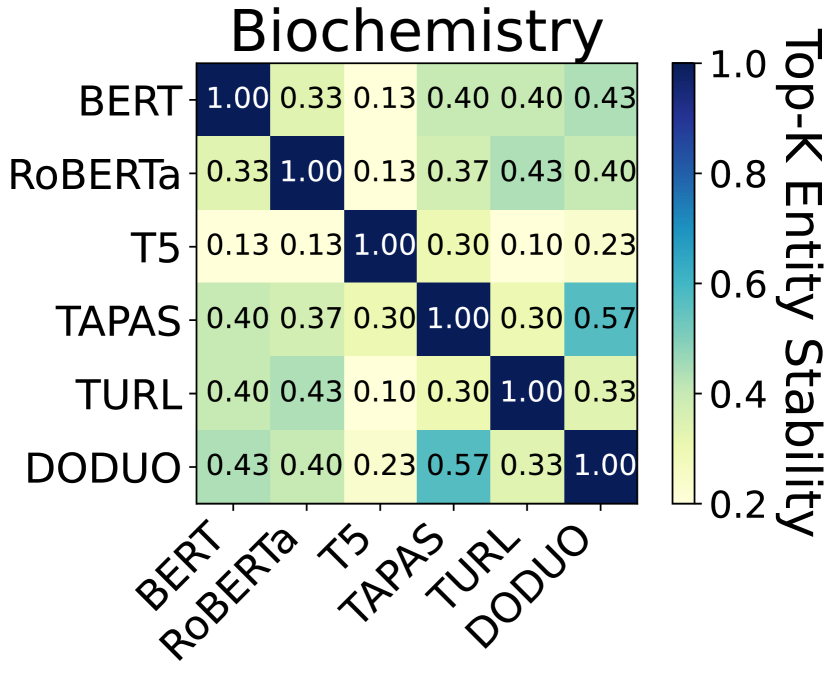
We select query entities from five domains and compare their -nearest neighbors between two embedding spaces: ten greatest men tennis players (Tennis Players), ten most popular movies (Movies), ten most essential nutrients for the body (Biochemistry), ten most valuable technology companies in the U.S., and ten largest countries in the world by area. We plot pairwise average entity stability using heatmaps in Figure 12. Due to space limits, we only show heatmaps of Tennis Players, Movies, and Biochemistry with =10. We observe that domain is a key factor in entity stability. In other words, for different domains, different pairs of models show high entity stability. For instance, BERT and TURL have the highest entity stability for movie entities while TAPAS and DODUO have the highest entity stability for biochemistry entities. This suggests for domain-specific tasks, if one finds model A is not feasible, they may want to try model B with relatively lower entity stability with respect to A.
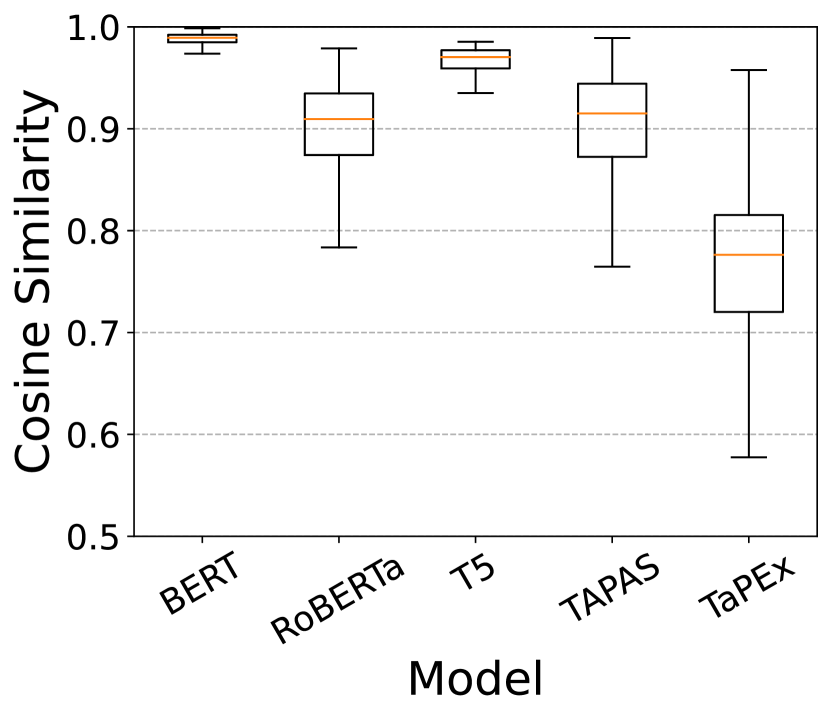
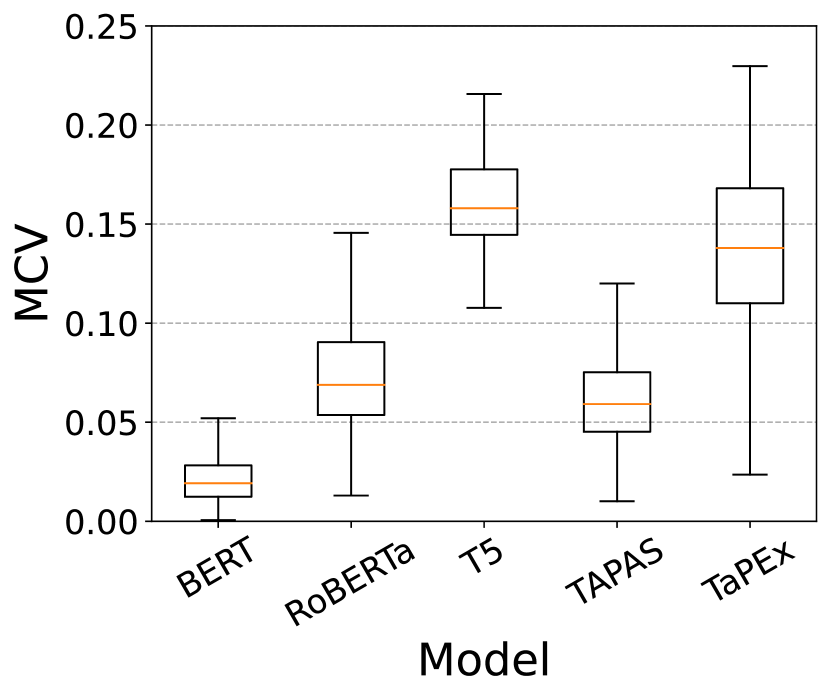
5.7. Perturbation Robustness
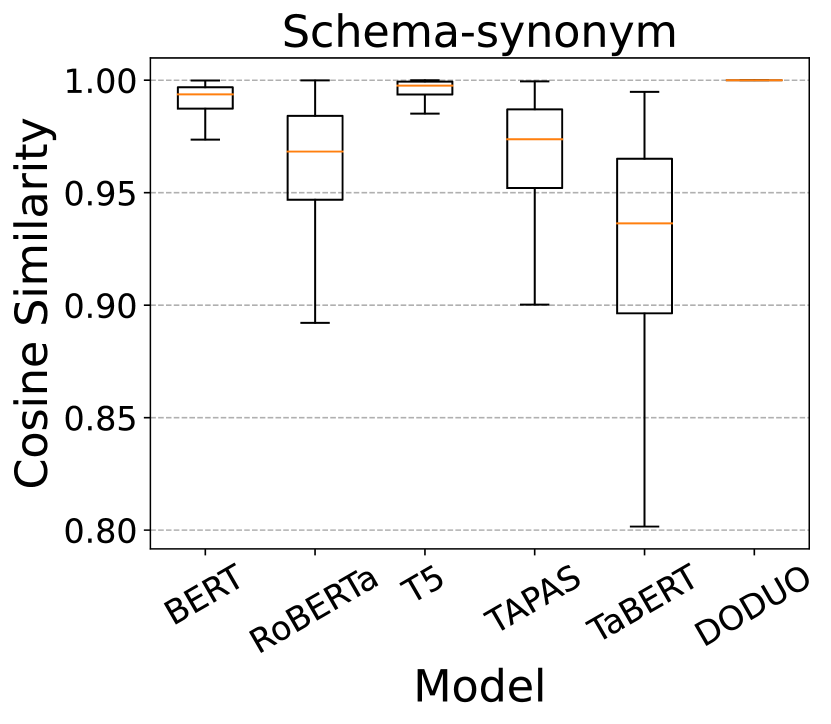
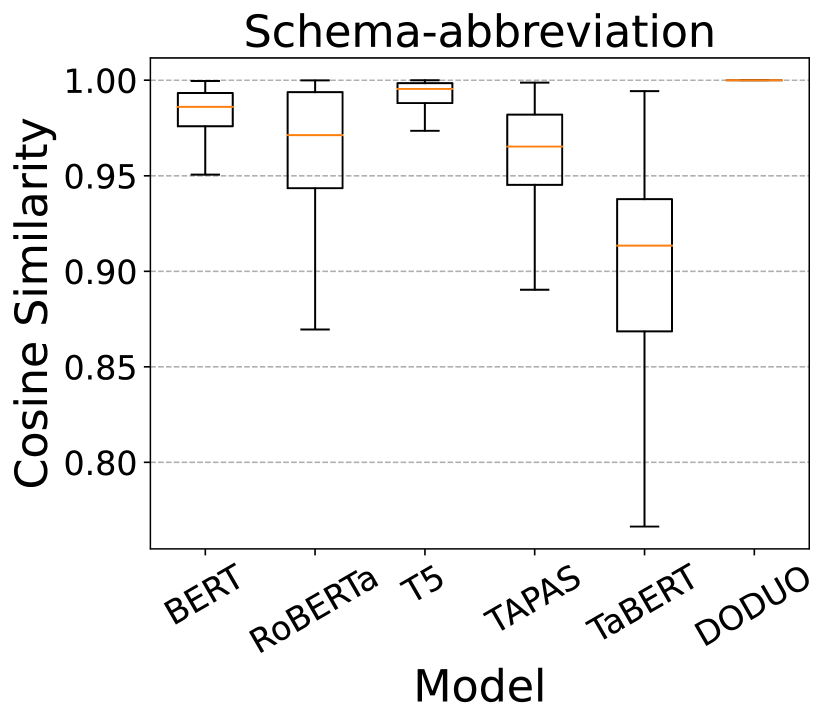
Figure 13 shows distributions of embedding cosine similarities between pairs of an original column and a corresponding perturbed column. Even though both types of perturbations are at the schema level and data values remain unchanged, models exhibit different degrees of robustness, especially in terms of the spread and skewness of the distribution. Vanilla language models BERT and T5 are most robust to schema-level perturbations with first quartile above 0.97 while entire distributions are above 0.90. Despite being a language model, RoBERTa surprisingly shows a larger spread with outliers down to 0.75 in synonym perturbations and to 0.65 in abbreviation perturbations. On the table model side, TaBERT is least robust to perturbations with the lowest median and first quartile among all models. In contrast, TAPAS is more robust with first percentile near 0.95 for both perturbations while it shows relatively large variance as well. DODUO does not show any variance because DODUO only takes in data values for representation inference and simply ignores changes to the schema. Overall, table embedding models in comparison are more sensitive to schema perturbations as they explicitly model the header component of tables and distinguish between headers and data values in representation learning.
5.8. Heterogeneous Context
| Model | Subject Column | Neighboring Columns | Entire Table | ||||||
|---|---|---|---|---|---|---|---|---|---|
| BERT |
|
|
|
||||||
| RoBERTa |
|
|
|
||||||
| T5 |
|
|
|
||||||
| TAPAS |
|
|
|
||||||
| TaBERT |
|
|
|
||||||
| DODUO |
|
|
|
For both non- and textual data types, we infer from each model column embeddings using only the columns themselves, and adding 1) subject columns; 2) immediate neighbor columns; and 3) the entire tables as context respectively. We compute the cosine similarity between corresponding pairs of single column embeddings and contextual embeddings and show their three-number summary in Table 5. Unsurprisingly, adding different contexts to the inputs changes the embeddings to various degrees. For non-textual columns, among three context settings, models except DODUO preserve high cosine similarity when having subject columns as context (e.g., the median number of TaBERT is above 0.96 and that of BERT is close to 0.9) while they (except TaBERT) preserve relatively low cosine similarity when having the entire tables as context (e.g., the median number of TAPAS is below 0.65). We observe that TaBERT embeddings are insensitive to context (the median number is above 0.95 in all three settings) whereas DODUO embeddings are more sensitive to context (the median number is below 0.5 when having the entire tables as context and around 0.6 in the other two settings). We see a consistent trend for textual data. This can have implications that TaBERT may not be a good choice for context sensitive downstream tasks and a user may want to try both single column embeddings and contextual embeddings when using DODUO.
6. Connection to Downstream Tasks
From the model characterization through their embedding representations as per the eight properties P1-8, we deduce below the model behaviors on downstream tasks. We illustrate three connections with experimental findings.
Column Type Prediction (P1/P2)
In the experiments, DODUO is found sensitive to row/column shuffling and sampling, which are indicators of unstable predictions of DODUO over shuffled data in downstream tasks. To investigate this hypothesis, we randomly sample 1,000 tables from the WikiTables dataset used in the experiments and employ DODUO to predict semantic column types for all columns. For each table, we consider at most 1,000 distinct row-wise permutations for computational efficiency and keep track of how many predictions change per permutation relative to the original order. We find that, over this subset of tables with 5.8 columns on average, of the permutated tables yield at least 1 changed column type prediction (averaged over all permutations). of the tables have at least 2 changed type predictions while of tables have at least 3 changed type predictions.
Join Discovery (P5)
T5 exhibits high sample fidelity even when the sample ratio is low, leading us to anticipate T5 to be sample efficient in downstream tasks. We implement T5 in the task of join discovery following the approach and setup in (Cong et al., 2023a). Over the NextiaJD testbeds, sampled T5 embeddings obtain comparable precision and recall as those from full values while the indexing time and lookup time are significantly faster. For instance, on NextiaJD-XS with a sample size of 100 (which is about 5% of the average number of rows in NextiaJD-XS), there is less than variation in precision and recall between sampled T5 embeddings and full-value T5 embeddings. But the indexing time of using sampled values is more than 7x faster and the lookup time is more than 2 faster.
Table Question Answering (P7)
The task of table question answering (TableQA) refers to answering natural language questions based on information from given tables. In our experiments of the Perturbation Robustness property (Section 5.7), we found that TAPAS, among other models, was sensitive to semantics-preserving perturbations to the table schema. Based on this observation, we hypothesize that TAPAS may suffer performance degradation on perturbed tables in downstream tasks, such as TableQA, for which it is designed. As anticipated, the TableQA accuracy of TAPAS under synonym- and abbreviation perturbation drops by 6.2 and 8.3 points respectively on WikiTableQuestions (Pasupat and Liang, 2015), and 19.0 and 22.2 points respectively on WikiSQL (Zhong et al., 2017) (see Table 2 and 7 in (Zhao et al., 2023)).
We emphasize that, despite we focus on the characterization of pretrained models (e.g., pretrained version of TAPAS), our hypotheses predicated on such characterization propagate to finetuned models (in this case, TAPAS models fine-tuned for TableQA).
Additional Connections
Beyond the three empirically supported anticipations of model behaviors on downstream tasks, we also deduce informed expectations listed below as a result of the characterizations obtained with Observatory for the other properties. This list is not exhaustive as the connection between model characteristics and downstream tasks is not a one-to-one relationship.
-
P3
Low Spearman’s coefficient between containment and embedding cosine similarity (e.g., BERT) Join discovery: the containment-based method will complement the embedding-based method in finding join candidates.
-
P4
Not preserving functional dependencies Data imputation: imputed values may not maintain functional dependencies between attributes.
-
P6
Relative to model A, model B has a lower entity stability than model C Entity retrieval: model B will return fewer entities in common with model A than with model C.
-
P8
Insensitive to context change (e.g., RoBERTa) Join discovery: candidates found by single-column and contextual embeddings will largely overlap.
7. Discussion
Impact of Tables with Large Dimensionality
To assess the effect of table dimensions, we examine BERT and TAPAS regarding row- and column order insignificance on the NextiaJD-S dataset, averaging over 209k rows and 56 columns. No significant differences emerge on NextiaJD-S compared to tables from WikiTables. The partitioning of large tables into smaller ones, with aggregated embeddings, aligns with our practice for smaller tables.
Limitations
While Observatory encompasses crucial properties for various applications, implementing measures for all properties is unfeasible. For instance, assessing latent topics in tables, vital for retrieval tasks, lacks established measures and appropriate evaluation datasets. The challenge of evaluating models’ ability to capture signals across diverse data types, from numeric to textual, persists. Our model analysis is constrained to a representative selection, driven by the availability of code and pretrained model weights. However, Observatory is extensible and open-sourced for analyzing additional models. We acknowledge the potential for future investigation into relationships between property metrics. Our analysis, like any empirical work, is subject to the inherent limitations of dataset specificity. Despite these considerations, we initiate the process of characterizing and understanding embedding representations across relational tables.
8. Conclusion
We introduce Observatory, a downstream-task agnostic analysis framework for table embeddings, gauging the alignment of pretrained embeddings with key relational data model and data distributions properties. Our assessment of nine language- and table embedding models reveals diverse capabilities of different models. Notably, some properties of the relational model and data distributions are not consistently reflected in table embeddings. Observatory provides a valuable tool for guiding model selection in various applications, aiding researchers in model evaluation, and informing future research on novel architectures for tabular data.
Acknowledgements.
This research is supported in part by NSF grants 1946932 and 2312931, by Dutch Research Council (NWO) through grantMVI.19.032, and through computational resources and services provided by Advanced Research Computing at the University of Michigan, Ann Arbor.
References
- (1)
- Abiteboul et al. (1995) Serge Abiteboul, Richard Hull, and Victor Vianu. 1995. Foundations of Databases. Addison-Wesley.
- Adi et al. (2016) Yossi Adi, Einat Kermany, Yonatan Belinkov, Ofer Lavi, and Yoav Goldberg. 2016. Fine-grained Analysis of Sentence Embeddings Using Auxiliary Prediction Tasks. CoRR abs/1608.04207 (2016).
- Aerts et al. (2015) Stephanie Aerts, Gentiane Haesbroeck, and Christel Ruwet. 2015. Multivariate coefficients of variation: Comparison and influence functions. J. Multivar. Anal. 142 (2015), 183–198.
- Albert and Zhang (2010) Adelin Albert and Lixin Zhang. 2010. A novel definition of the multivariate coefficient of variation. Biometrical Journal 52, 5 (2010), 667–675.
- Antoniak and Mimno (2018) Maria Antoniak and David Mimno. 2018. Evaluating the Stability of Embedding-based Word Similarities. Trans. Assoc. Comput. Linguistics 6 (2018), 107–119.
- Badaro et al. (2023) Gilbert Badaro, Mohammed Saeed, and Paolo Papotti. 2023. Transformers for tabular data representation: A survey of models and applications. Transactions of the Association for Computational Linguistics (2023).
- Bhagavatula et al. (2015) Chandra Sekhar Bhagavatula, Thanapon Noraset, and Doug Downey. 2015. TabEL: Entity Linking in Web Tables. In The Semantic Web - ISWC 2015 - 14th International Semantic Web Conference, Bethlehem, PA, USA, October 11-15, 2015, Proceedings, Part I (Lecture Notes in Computer Science), Vol. 9366. Springer, 425–441.
- Bogatu et al. (2020) Alex Bogatu, Alvaro A. A. Fernandes, Norman W. Paton, and Nikolaos Konstantinou. 2020. Dataset Discovery in Data Lakes. In 36th IEEE International Conference on Data Engineering, ICDE 2020, Dallas, TX, USA, April 20-24, 2020. IEEE, 709–720.
- Bordes et al. (2013) Antoine Bordes, Nicolas Usunier, Alberto García-Durán, Jason Weston, and Oksana Yakhnenko. 2013. Translating Embeddings for Modeling Multi-relational Data. In Advances in Neural Information Processing Systems. 2787–2795.
- Cappuzzo et al. (2020) Riccardo Cappuzzo, Paolo Papotti, and Saravanan Thirumuruganathan. 2020. Creating Embeddings of Heterogeneous Relational Datasets for Data Integration Tasks. In Proceedings of the 2020 International Conference on Management of Data, SIGMOD Conference 2020, online conference [Portland, OR, USA], June 14-19, 2020. ACM, 1335–1349.
- Chang et al. (2023a) Shuaichen Chang, Jun Wang, Mingwen Dong, Lin Pan, Henghui Zhu, Alexander Hanbo Li, Wuwei Lan, Sheng Zhang, Jiarong Jiang, Joseph Lilien, Steve Ash, William Yang Wang, Zhiguo Wang, Vittorio Castelli, Patrick Ng, and Bing Xiang. 2023a. Dr.Spider: A Diagnostic Evaluation Benchmark towards Text-to-SQL Robustness. CoRR abs/2301.08881 (2023).
- Chang et al. (2023b) Shuaichen Chang, Jun Wang, Mingwen Dong, Lin Pan, Henghui Zhu, Alexander Hanbo Li, Wuwei Lan, Sheng Zhang, Jiarong Jiang, Joseph Lilien, Steve Ash, William Yang Wang, Zhiguo Wang, Vittorio Castelli, Patrick Ng, and Bing Xiang. 2023b. Dr.Spider Data Release. https://github.com/awslabs/diagnostic-robustness-text-to-sql. [Online; accessed October 12, 2023].
- Codd (1970) E. F. Codd. 1970. A Relational Model of Data for Large Shared Data Banks. Commun. ACM 13, 6 (1970), 377–387.
- Codd (1979) E. F. Codd. 1979. Extending the Database Relational Model to Capture More Meaning. ACM Trans. Database Syst. 4, 4 (1979), 397–434.
- Cong et al. (2023a) Tianji Cong, James Gale, Jason Frantz, H. V. Jagadish, and Çagatay Demiralp. 2023a. WarpGate: A Semantic Join Discovery System for Cloud Data Warehouses. In 13th Conference on Innovative Data Systems Research, CIDR 2023, Amsterdam, The Netherlands, January 8-11, 2023. www.cidrdb.org.
- Cong et al. (2023b) Tianji Cong, Fatemeh Nargesian, and H. V. Jagadish. 2023b. Pylon: Semantic Table Union Search in Data Lakes. CoRR abs/2301.04901 (2023).
- Deng et al. (2020a) Xiang Deng, Huan Sun, Alyssa Lees, You Wu, and Cong Yu. 2020a. TURL Data Release. https://github.com/sunlab-osu/TURL#data. [Online; accessed October 12, 2023].
- Deng et al. (2020b) Xiang Deng, Huan Sun, Alyssa Lees, You Wu, and Cong Yu. 2020b. TURL: Table Understanding through Representation Learning. Proc. VLDB Endow. (2020), 307–319.
- Devlin et al. (2019) Jacob Devlin, Ming-Wei Chang, Kenton Lee, and Kristina Toutanova. 2019. BERT: Pre-training of Deep Bidirectional Transformers for Language Understanding. In Proceedings of the Conference on the North American Chapter of the Association for Computational Linguistics: Human Language Technologies, NAACL-HLT. 4171–4186.
- Dong et al. (2022) Haoyu Dong, Zhoujun Cheng, Xinyi He, Mengyu Zhou, Anda Zhou, Fan Zhou, Ao Liu, Shi Han, and Dongmei Zhang. 2022. Table Pre-training: A Survey on Model Architectures, Pre-training Objectives, and Downstream Tasks. In Proceedings of the Thirty-First International Joint Conference on Artificial Intelligence, IJCAI 2022, Vienna, Austria, 23-29 July 2022, Luc De Raedt (Ed.). ijcai.org, 5426–5435.
- Flores et al. (2021) Javier Flores, Sergi Nadal, and Oscar Romero. 2021. Towards Scalable Data Discovery. In Proceedings of the 24th International Conference on Extending Database Technology, EDBT 2021, Nicosia, Cyprus, March 23 - 26, 2021. OpenProceedings.org, 433–438.
- Herzig et al. (2020) Jonathan Herzig, Pawel Krzysztof Nowak, Thomas Müller, Francesco Piccinno, and Julian Martin Eisenschlos. 2020. TaPas: Weakly Supervised Table Parsing via Pre-training. In Proceedings of the 58th Annual Meeting of the Association for Computational Linguistics, ACL 2020, Online, July 5-10, 2020. Association for Computational Linguistics, 4320–4333.
- Hulsebos et al. (2019) Madelon Hulsebos, Kevin Zeng Hu, Michiel A. Bakker, Emanuel Zgraggen, Arvind Satyanarayan, Tim Kraska, Çagatay Demiralp, and César A. Hidalgo. 2019. Sherlock: A Deep Learning Approach to Semantic Data Type Detection. In Proceedings of the 25th ACM SIGKDD International Conference on Knowledge Discovery & Data Mining, KDD 2019, Anchorage, AK, USA, August 4-8, 2019. ACM, 1500–1508.
- Kayali et al. (2023) Moe Kayali, Anton Lykov, Ilias Fountalis, Nikolaos Vasiloglou, Dan Olteanu, and Dan Suciu. 2023. CHORUS: Foundation Models for Unified Data Discovery and Exploration. CoRR abs/2306.09610 (2023).
- Koleva et al. (2022) Aneta Koleva, Martin Ringsquandl, and Volker Tresp. 2022. Analysis of the Attention in Tabular Language Models. In NeurIPS 2022 First Table Representation Workshop.
- Korini and Bizer (2023) Keti Korini and Christian Bizer. 2023. Column Type Annotation using ChatGPT. CoRR abs/2306.00745 (2023).
- Korini et al. (2022) Keti Korini, Ralph Peeters, and Christian Bizer. 2022. SOTAB: The WDC Schema.org Table Annotation Benchmark. In Proceedings of the Semantic Web Challenge on Tabular Data to Knowledge Graph Matching, SemTab 2021, co-located with the 21st International Semantic Web Conference, ISWC 2022, Virtual conference, October 23-27, 2022 (CEUR Workshop Proceedings).
- Li et al. (2020) Yuliang Li, Jinfeng Li, Yoshihiko Suhara, AnHai Doan, and Wang-Chiew Tan. 2020. Deep Entity Matching with Pre-Trained Language Models. Proc. VLDB Endow. (2020), 50–60.
- Liu et al. (2022) Qian Liu, Bei Chen, Jiaqi Guo, Morteza Ziyadi, Zeqi Lin, Weizhu Chen, and Jian-Guang Lou. 2022. TAPEX: Table Pre-training via Learning a Neural SQL Executor. In The Tenth International Conference on Learning Representations, ICLR 2022, Virtual Event, April 25-29, 2022. OpenReview.net.
- Liu et al. (2019) Yinhan Liu, Myle Ott, Naman Goyal, Jingfei Du, Mandar Joshi, Danqi Chen, Omer Levy, Mike Lewis, Luke Zettlemoyer, and Veselin Stoyanov. 2019. RoBERTa: A Robustly Optimized BERT Pretraining Approach. CoRR abs/1907.11692 (2019).
- Mikolov et al. (2013) Tomás Mikolov, Ilya Sutskever, Kai Chen, Gregory S. Corrado, and Jeffrey Dean. 2013. Distributed Representations of Words and Phrases and their Compositionality. In Advances in Neural Information Processing Systems 26: 27th Annual Conference on Neural Information Processing Systems 2013. Proceedings of a meeting held December 5-8, 2013, Lake Tahoe, Nevada, United States. 3111–3119.
- Narayan et al. (2022) Avanika Narayan, Ines Chami, Laurel J. Orr, and Christopher Ré. 2022. Can Foundation Models Wrangle Your Data? Proc. VLDB Endow. 16, 4 (2022), 738–746.
- Nargesian et al. (2018) Fatemeh Nargesian, Erkang Zhu, Ken Q. Pu, and Renée J. Miller. 2018. Table Union Search on Open Data. Proc. VLDB Endow. 11, 7 (2018), 813–825.
- Papenbrock and Naumann (2016) Thorsten Papenbrock and Felix Naumann. 2016. A Hybrid Approach to Functional Dependency Discovery. In Proceedings of the 2016 International Conference on Management of Data, SIGMOD Conference 2016, San Francisco, CA, USA, June 26 - July 01, 2016. ACM, 821–833.
- Pasupat and Liang (2015) Panupong Pasupat and Percy Liang. 2015. Compositional Semantic Parsing on Semi-Structured Tables. In Proceedings of the 53rd Annual Meeting of the Association for Computational Linguistics and the 7th International Joint Conference on Natural Language Processing of the Asian Federation of Natural Language Processing, ACL 2015, July 26-31, 2015, Beijing, China, Volume 1: Long Papers. The Association for Computer Linguistics, 1470–1480.
- Radford et al. (2018) Alec Radford, Karthik Narasimhan, Tim Salimans, Ilya Sutskever, et al. 2018. Improving language understanding by generative pre-training. (2018).
- Raffel et al. (2020) Colin Raffel, Noam Shazeer, Adam Roberts, Katherine Lee, Sharan Narang, Michael Matena, Yanqi Zhou, Wei Li, and Peter J. Liu. 2020. Exploring the Limits of Transfer Learning with a Unified Text-to-Text Transformer. J. Mach. Learn. Res. 21 (2020), 140:1–140:67.
- Ribeiro et al. (2020) Marco Túlio Ribeiro, Tongshuang Wu, Carlos Guestrin, and Sameer Singh. 2020. Beyond Accuracy: Behavioral Testing of NLP Models with CheckList. In Proceedings of the 58th Annual Meeting of the Association for Computational Linguistics, ACL 2020, Online, July 5-10, 2020. 4902–4912.
- Srinivas et al. (2023) Kavitha Srinivas, Julian Dolby, Ibrahim Abdelaziz, Oktie Hassanzadeh, Harsha Kokel, Aamod Khatiwada, Tejaswini Pedapati, Subhajit Chaudhury, and Horst Samulowitz. 2023. LakeBench: Benchmarks for Data Discovery over Data Lakes. CoRR abs/2307.04217 (2023).
- Suhara et al. (2022) Yoshihiko Suhara, Jinfeng Li, Yuliang Li, Dan Zhang, Çagatay Demiralp, Chen Chen, and Wang-Chiew Tan. 2022. Annotating Columns with Pre-trained Language Models. In SIGMOD ’22: International Conference on Management of Data, Philadelphia, PA, USA, June 12 - 17, 2022. 1493–1503.
- Sui et al. (2023) Yuan Sui, Mengyu Zhou, Mingjie Zhou, Shi Han, and Dongmei Zhang. 2023. Evaluating and Enhancing Structural Understanding Capabilities of Large Language Models on Tables via Input Designs. CoRR abs/2305.13062 (2023).
- Tang et al. (2021) Nan Tang, Ju Fan, Fangyi Li, Jianhong Tu, Xiaoyong Du, Guoliang Li, Samuel Madden, and Mourad Ouzzani. 2021. RPT: Relational Pre-trained Transformer Is Almost All You Need towards Democratizing Data Preparation. Proc. VLDB Endow. 14, 8 (2021), 1254–1261.
- Wang et al. (2019) Alex Wang, Amanpreet Singh, Julian Michael, Felix Hill, Omer Levy, and Samuel R. Bowman. 2019. GLUE: A Multi-Task Benchmark and Analysis Platform for Natural Language Understanding. In 7th International Conference on Learning Representations, ICLR 2019, New Orleans, LA, USA, May 6-9, 2019. OpenReview.net.
- Wang et al. (2021) Zhiruo Wang, Haoyu Dong, Ran Jia, Jia Li, Zhiyi Fu, Shi Han, and Dongmei Zhang. 2021. TUTA: Tree-based Transformers for Generally Structured Table Pre-training. In KDD ’21: The 27th ACM SIGKDD Conference on Knowledge Discovery and Data Mining, Virtual Event, Singapore, August 14-18, 2021. ACM, 1780–1790.
- Wang et al. (2022) Zhiruo Wang, Zhengbao Jiang, Eric Nyberg, and Graham Neubig. 2022. Table Retrieval May Not Necessitate Table-specific Model Design. CoRR abs/2205.09843 (2022).
- Wendlandt et al. (2018) Laura Wendlandt, Jonathan K. Kummerfeld, and Rada Mihalcea. 2018. Factors Influencing the Surprising Instability of Word Embeddings. In Proceedings of the 2018 Conference of the North American Chapter of the Association for Computational Linguistics: Human Language Technologies, NAACL-HLT 2018, New Orleans, Louisiana, USA, June 1-6, 2018, Volume 1 (Long Papers). Association for Computational Linguistics, 2092–2102.
- Wolf et al. (2020) Thomas Wolf, Lysandre Debut, Victor Sanh, Julien Chaumond, Clement Delangue, Anthony Moi, Pierric Cistac, Tim Rault, Rémi Louf, Morgan Funtowicz, Joe Davison, Sam Shleifer, Patrick von Platen, Clara Ma, Yacine Jernite, Julien Plu, Canwen Xu, Teven Le Scao, Sylvain Gugger, Mariama Drame, Quentin Lhoest, and Alexander M. Rush. 2020. Transformers: State-of-the-Art Natural Language Processing. In Proceedings of the 2020 Conference on Empirical Methods in Natural Language Processing: System Demonstrations, EMNLP 2020 - Demos, Online, November 16-20, 2020. Association for Computational Linguistics, 38–45.
- Yakout et al. (2012) Mohamed Yakout, Kris Ganjam, Kaushik Chakrabarti, and Surajit Chaudhuri. 2012. InfoGather: entity augmentation and attribute discovery by holistic matching with web tables. In Proceedings of the ACM SIGMOD International Conference on Management of Data, SIGMOD 2012, Scottsdale, AZ, USA, May 20-24, 2012, K. Selçuk Candan, Yi Chen, Richard T. Snodgrass, Luis Gravano, and Ariel Fuxman (Eds.). ACM, 97–108.
- Yin et al. (2020a) Pengcheng Yin, Graham Neubig, Wen-tau Yih, and Sebastian Riedel. 2020a. TaBERT Configuration. https://github.com/facebookresearch/TaBERT/blob/74aa4a88783825e71b71d1d0fdbc6b338047eea9/table_bert/vertical/config.py#L23. [Online; accessed October 12, 2023].
- Yin et al. (2020b) Pengcheng Yin, Graham Neubig, Wen-tau Yih, and Sebastian Riedel. 2020b. TaBERT: Pretraining for Joint Understanding of Textual and Tabular Data. In Proceedings of the 58th Annual Meeting of the Association for Computational Linguistics, ACL 2020, Online, July 5-10, 2020. Association for Computational Linguistics, 8413–8426.
- Yu et al. (2018a) Tao Yu, Rui Zhang, Kai Yang, Michihiro Yasunaga, Dongxu Wang, Zifan Li, James Ma, Irene Li, Qingning Yao, Shanelle Roman, Zilin Zhang, and Dragomir R. Radev. 2018a. Spider: A Large-Scale Human-Labeled Dataset for Complex and Cross-Domain Semantic Parsing and Text-to-SQL Task. In Proceedings of the 2018 Conference on Empirical Methods in Natural Language Processing, Brussels, Belgium, October 31 - November 4, 2018. Association for Computational Linguistics, 3911–3921.
- Yu et al. (2018b) Tao Yu, Rui Zhang, Kai Yang, Michihiro Yasunaga, Dongxu Wang, Zifan Li, James Ma, Irene Li, Qingning Yao, Shanelle Roman, Zilin Zhang, and Dragomir R. Radev. 2018b. Spider Data Release. https://yale-lily.github.io/spider. [Online; accessed October 12, 2023].
- Zhang et al. (2020) Dan Zhang, Yoshihiko Suhara, Jinfeng Li, Madelon Hulsebos, Çagatay Demiralp, and Wang-Chiew Tan. 2020. Sato: Contextual Semantic Type Detection in Tables. Proc. VLDB Endow. 13, 11 (2020), 1835–1848.
- Zhang et al. (2010) Meihui Zhang, Marios Hadjieleftheriou, Beng Chin Ooi, Cecilia M. Procopiuc, and Divesh Srivastava. 2010. On Multi-Column Foreign Key Discovery. Proc. VLDB Endow. 3, 1 (2010), 805–814.
- Zhang et al. (2023) Tianping Zhang, Shaowen Wang, Shuicheng Yan, Jian Li, and Qian Liu. 2023. Generative Table Pre-training Empowers Models for Tabular Prediction. CoRR abs/2305.09696 (2023).
- Zhao et al. (2023) Yilun Zhao, Chen Zhao, Linyong Nan, Zhenting Qi, Wenlin Zhang, Xiangru Tang, Boyu Mi, and Dragomir Radev. 2023. RobuT: A Systematic Study of Table QA Robustness Against Human-Annotated Adversarial Perturbations. In Proceedings of the 61st Annual Meeting of the Association for Computational Linguistics (Volume 1: Long Papers), ACL 2023, Toronto, Canada, July 9-14, 2023. Association for Computational Linguistics, 6064–6081.
- Zhong et al. (2017) Victor Zhong, Caiming Xiong, and Richard Socher. 2017. Seq2SQL: Generating Structured Queries from Natural Language using Reinforcement Learning. CoRR abs/1709.00103 (2017).
- Zhu et al. (2019) Erkang Zhu, Dong Deng, Fatemeh Nargesian, and Renée J. Miller. 2019. JOSIE: Overlap Set Similarity Search for Finding Joinable Tables in Data Lakes. In Proceedings of the 2019 International Conference on Management of Data, SIGMOD Conference 2019, Amsterdam, The Netherlands, June 30 - July 5, 2019. ACM, 847–864.
- Zhu et al. (2016) Erkang Zhu, Fatemeh Nargesian, Ken Q. Pu, and Renée J. Miller. 2016. LSH Ensemble: Internet-Scale Domain Search. Proc. VLDB Endow. 9, 12 (2016), 1185–1196.