Optimal Cooperation in Evolutionary Games with Inequality and Diverse Populations
Abstract
Cooperation is a fundamental aspect of human society, and extensive research has been devoted to understanding its emergence. However, exploring evolutionary games in asymmetric interaction scenarios has been relatively limited. This study aims to investigate asymmetric evolutionary games within communities characterized by multiple sources of inequality, encompassing unequal benefits and costs. The population comprises strong and weak communities, with the former consistently gaining greater cooperative benefits than the latter, thereby highlighting inherent inequality. The asymmetric cost manifests in labor allocation when cooperators from distinct communities interact. Our findings underscore the indispensable role played by the interplay between population composition and unequal factors. In well-mixed populations, cooperation peaks when weak players bear a larger share of costs, especially when strong communities are moderately proportioned. Contrarily, in structured populations, an optimal effect arises from the interplay between the population composition and unequal benefit even when the cost is evenly divided. With a moderate proportion of strong communities, weak defectors create barriers that shield cooperation clusters from exploitation by strong defectors. By manipulating cost division, we uncover a remarkable bi-optimal phenomenon, demonstrating that a greater cost-sharing commitment from strong or weak cooperators can trigger the highest level of cooperation.
I Introduction
Cooperative behavior manifests as a widespread phenomenon in both natural and human societies [1, 2, 3]. Despite its ubiquity, a fundamental question arises: why do individuals incur costs to help unrelated individuals [4, 5]? Game theory, whether applied in evolutionary or social sciences contexts, has played a pivotal role in uncovering fundamental mechanisms of cooperation, as well as exploring various adaptations and nuances that arise from them [6, 7, 8]. Typical examples include direct and indirect reciprocity, network reciprocity, group selection, and kin selection [9].
To understand the persistence of cooperation, evolutionary game theory has generally extended from basic symmetric interaction to asymmetric scenarios [10, 11]. Among the crucial symmetric subclasses in evolutionary game theory is the two-player two-strategy game, where players simultaneously choose between being a cooperator or a defector [12]. In this setup, a cooperator receives a reward, denoted as , if it encounters another cooperator but gets a sucker’s payoff, denoted as , when it encounters a defector. On the other hand, a defector receives temptation, represented by , when it faces a cooperator, and punishment, denoted as , when it encounters another defector. The high-profile games in biological are the prisoner’s dilemma game (), where the ranking satisfies , and the snowdrift game (), where the ranking satisfies [13]. These two symmetric games also fall under the category of social dilemmas [14, 15], wherein mutual cooperation yields the highest collective payoff compared to other configurations. Based on these two symmetric games, many studies have extended the scope to an asymmetric scenario [16, 17, 18]. Here, we aim to expand the basic models of and and explore how cooperation evolves when communities with unequals are considered in structured and unstructured populations.
Inequality or asymmetry is actually ubiquitous. Even among the members of the same species, there are variations in sex, strength, intellect, wealth, environment, and history of interactions that may cause differences in ability and behavior, with considerable consequences for ecology and evolution [19, 20]. Examples include human hunt-gather game [21, 22] and power (horizontal) inequality [23, 24]. Asymmetry can arise from inherent diversity among individuals or power struggles that lead to further disparities in various aspects of life. The dictator game serves as a notable paradigm for studying power asymmetry [25], where a dictator unilaterally determines the distribution of resources, leaving the recipient with no choice but to accept. Although humans are willing to pursue equal distributions of resources [26], societies have varying degrees of economic inequality. Therefore, it is urgently necessary to understand the influence of unequals in shaping human cooperation.
The effect of asymmetry on cooperation has been explored through two classical assumptions: ecological and genotypic setups [16]. Ecological asymmetry arises from the differences in the location or environment of the participants, while genotypic asymmetry stems from variations in the characteristics or attributes of the individuals themselves. Furthermore, the ability of human behavior to shape the environment has been recognized in evolutionary games with environmental feedback, revealing the impact of such feedback and the rate of ecological changes on the strength of social dilemmas [27]. The structure of social interactions, whether unidirectional or bidirectional, also plays a pivotal role in shaping the evolution of cooperation [28]. Another model commonly used to study unequals in cooperation is the linear public goods game. In this game, incorporating individuals with slightly unequal endowments can potentially promote the evolution of cooperation, especially when the game is played repeatedly [29]. Additionally, the study of sub-population games offers an opportunity to explore cooperative behavior in the presence of asymmetry [30, 31]. These findings highlight how asymmetries provide valuable insights into shaping cooperative behavior.
Although quintessential, it is difficult to predict the intricate impact of unequals on cooperation across multiple dimensions. Here we develop a general multiple-game model to explore how different kinds of unequals affect cooperation. Our research expands upon the foundational models of and by incorporating populations with strong and weak tags, allowing interactions between individuals from distinct communities. The strength of asymmetry between strong and weak players is affected by their relative costs and benefits. To quantify this disparity, we introduce the concept of inequality degree, differentiating strong players, who gain more from cooperation, from weak players, who gain relatively modest benefits. The concept of cost division is used to identify labor allocation between strong and weak cooperators. Given the evidence that human players update their strategies via social learning [32], we here employ the social learning rule in the strategy updating stage. Building on this, we explore the interplay between asymmetries (including unequal benefit and cost division) and population composition in structured and unstructured populations. Our study uncovers that, in a square lattice, the optimal level of cooperation emerges at intermediate proportions of strong players, even when the cost is evenly divided. Meanwhile, weak defectors guard cooperation clusters against exploitation by strong defectors. As for unequal cost division, cooperation is maximized in well-mixed populations when weak players bear a larger share of the costs. However, in a square lattice with intermediate proportions of strong players, achieving maximum cooperation entails either weak or strong players bearing a larger share of costs. We therefore shed light on the intricate dynamics of cooperation in asymmetric interactions, highlighting the role of inequalities and population composition in shaping human cooperation.
II Materials and methods
II.1 Games in communities with unequals
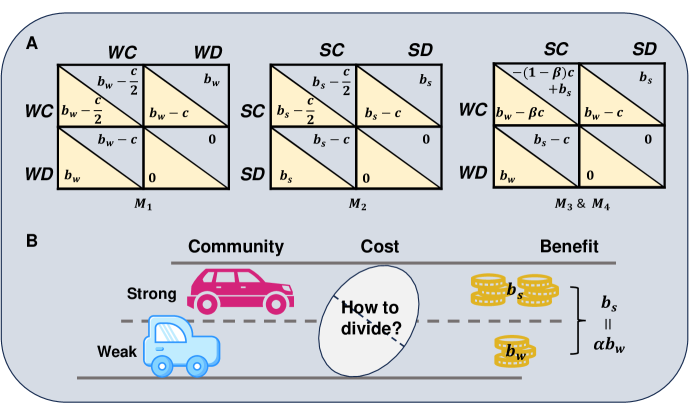
Our study incorporates tags or labels into the basic and , leading to an extension game. In the game, each player has two options in the strategy set , where represents cooperation and represents defection. Cooperation provides a benefit to both the cooperator and the opposing individual, but also begets a cost if the opponent defects, and a cost if the opponent cooperates. In terms of the payoff matrix elements, this corresponds to for playing mutual cooperation, for defection against cooperation, for cooperation against defection, and for mutual defection:
| (1) |
The parameter stands for the benefit and in our case helps to differentiate between two types of players and, consequently, games (see the sketch in Fig. 1). Specifically, denotes benefit for weak players and denotes benefit for strong players. The parameter is a factor of and ; , where is inequality degree. By setting , we ensure that strong players consistently receive a larger benefit compared to weak players’ benefit . When cooperators within the same community encounter each other, they share the cost evenly and engage in either game or based on their community tag (see Fig. 1 A). Here, the parameter determines whether player payoffs fall within the domain of the prisoner’s dilemma or snowdrift game. Specifically, if , we have the , and if , we encounter the . On the other hand, when interacting players come from different communities, they participate in an asymmetric game. Specifically, the weak and strong players follow games and , respectively (see the third column of Fig. 1 A). An interesting question arises spontaneously in this scenario: how should the cost be divided between the two cooperators? We denote the proportion of cost shared by the weak cooperator as , where signifies an even cost division. As a result, regardless of the community to which one’s opponent belongs, a specific game related to the community tag, namely or , will always be played. However, when , either weak or strong players participate in multiple (or multichannel) games. Then, the core idea can be illustrated by the sketch in Fig. 1 B, highlighting the existence of two kinds of unequals: i) inequality in the benefits from cooperation, and ii) inequality in the division of the cost. In addition, without a specific declaration, the cost is fixed as throughout the paper.
II.2 Population setup
This study explores two main population structures: a well-mixed population and a square lattice with periodic boundaries. Individuals are represented as vertices, and edges represent their interactions. Specifically, if there is a link between individual and , we denote it as , and if there is no link, we set . The population is denoted as , where represents the total number of individuals. In a well-mixed population, every individual is connected to each other, i.e., , allowing interactions between any two individuals. We firstly consider an infinitely large well-mixed population, where . To simplify notation, we use and to denote the proportions of weak and strong communities in the population, respectively. Let represent the frequency of cooperation in the weak community, which takes values in the range , and represents the frequency of cooperation in the strong community, also ranging from 0 to 1. Consequently, the total frequency of cooperation can be expressed as .
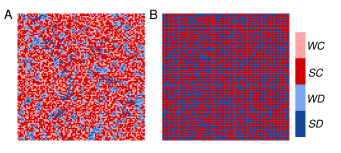
In addition, We extend our model to a square lattice of size with periodic boundaries and conduct simulations based on the Monte Carlo method. Unlike the well-mixed population, this network exhibits local interactions where individuals only interact with their neighboring nodes. In both the well-mixed population and the square lattice, there are four types of players: weak cooperators (), weak defectors (), strong cooperators (), and strong defectors ().
II.3 Evolutionary dynamics in well-mixed population
In a well-mixed population, each player has the same opportunity to interact with others. Therefore, according to the payoff matrices, the expected payoff of , , , and are respectively given by
| (2) |
We utilize the pairwise comparison with a social learning rule to model the strategy updating stage, where social learning leads to preferential copying of successful strategies in the spread of strategy [12, 33, 32]. During this stage, a focal player is randomly selected and evaluates its strategy by comparing its payoff with that of another randomly chosen individual in the population. Then, the focal player decides whether to imitate the strategy of the model player, with the probability determined by the Fermi function:
| (3) |
where and represent two different strategies. While the parameter represents selection intensity, adding some noise to the equation in order to allow for a possibility to act irrationally and imitate a worse performing neighbor[12, 34, 35]. Since it has been well studied, we fix (a strong selection scenario) throughout this paper. In the population with different communities, a focal player selects (or ) as a reference model player for comparison with a probability of (or ). Then, the probability that decreases by one is
| (4) | ||||
Note that the type of player will not change in the strategy imitation stage. Therefore, if a imitates the strategy of , it will result in increase by one. In the same way, if a focal player selects and as reference model players for comparison, the probability that increases by one is
| (5) | ||||
Subsequently, the dynamics of weak cooperation can be represented by
| (6) |
Similarly, we can get the dynamics of strong cooperation:
| (7) | ||||
As solving and analytically is intractable, we resort to numerical solutions. The feasible solution is determined through numerical iteration of the above system of equations, initialized with . Note that these solutions are independent of the initial values.
II.4 Agent-based simulation in square lattice
We have implemented a Monte Carlo simulation to calculate the cooperation rate in a steady state. Denote or as the cooperation or defection strategy adopted by player . In each time step, randomly selected players play a game with their four nearest neighbors (von Neumann neighborhood) and accumulate a payoff .
| (8) |
where and represent the neighbor sets belonging to the same community and different community as player , respectively. Next, a randomly selected player in ’s neighbor set calculates the payoff similarly. At last, player imitates the strategy of with a probability given by the Fermi function.
We initialize simulations on a lattice of size , with each player having an equal probability to start off by as a cooperator or defector. The proportion of strong players is in initial simulation runs, and incrementally increases in each subsequent run until it reaches . The location of weak and strong players on a lattice is determined randomly. In each simulation run, we observe the cooperation frequency as a function of parameters , and , and the ratio of weak-to-strong players in the total population over the course of 100,000 time steps, of which the last 5000 steps are considered as a steady state. In each time step, players are selected once on average to play a game and update their actions.
III Results
III.1 Well-mixed population
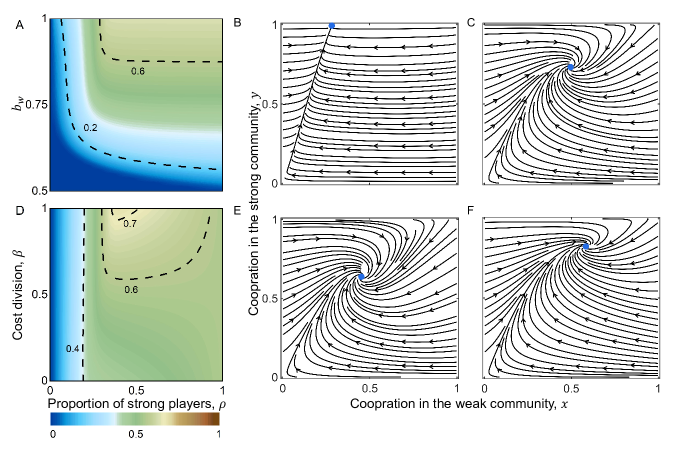
Cooperation levels in well-mixed populations are influenced by the participation of a strong community. Pure strong communities result in the highest cooperation (Fig.2 A). We observe that cooperation is promoted by increasing the value of , since the dilemma strength is weakened [36]. Fig. 2 B showcases that when the strong community constitutes a small fraction (), weak cooperation is vulnerable to exploitation by weak defectors, leading to a lower cooperation level. Meanwhile, strong cooperation dominates the strong community and supports the evolution of weak cooperation. As increases (see Fig. 2 C), although strong defection emerges, strong cooperation continues to influence cooperation in the weak community positively. To examine the specific effect of each type of player in communities, we consider four additional cases (see Fig. S1 in Supplementary Material). In the first case, involving the population with , , and , we observe that the presence of effectively promotes cooperation in the weak community (see Fig. S2, top line). Conversely, weak cooperation fails to emerge in a population with , , and (see Fig. S2, bottom line). Turning attention to situations where strong community exists initially, and introducing or into the population, we find that either or has no significant effect on the evolution of strong cooperators (see Fig. S3 in Supplementary Material).
We then explore steady cooperation by considering the cost division between weak and strong cooperators (see Fig.2, bottom line). In this scenario, weak and strong players engage in two different games, except for . When is small (the left of the contour line 0.4), the value of has no significant influence on cooperation. However, when becomes larger, cooperation is promoted by , indicating that weak cooperators bearing a greater share of the cost benefits collective cooperation. Additionally, there exists an optimal value of for a given that triggers the highest collective cooperation (contour lines 0.6 and 0.7). This phenomenon is indiscoverable in populations without different communities. Phase portraits in Fig.2 E and F further illustrate that the steady frequency of cooperation is independent of initial values.
III.2 Square lattice
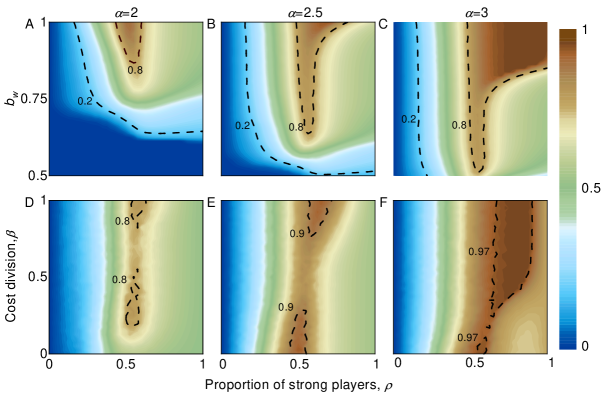
Cooperation is higher in communities than in pure populations with intermediate inequality degrees (see top line of Fig. 3). This is not surprising when comparing communities with pure populations of weak players, as the presented values of place the social dilemma in in the environment where only defection can survive [35]. However, it seems counter-intuitive when comparing communities to pure populations of strong players. There, cooperation survives and even thrives at low enough values of parameter . Even so, cooperation further increases with an influx of weak players and it is at highest when the proportion of weak and strong players is at intermediate levels. This phenomenon is particularly significant at the intermediate value of inequality degree . When becomes even larger, cooperation in mixed communities is no longer higher than in pure populations of strong players (see the upper right corner of Fig. 3C). Time series analysis reveals pretty straightforward evolutionary dynamics (see Fig. S4 in Supplementary Material), with strong and weak cooperation as the most dominant strategies in high cooperation scenarios (see Fig. S4C and F), followed by weak and strong defection. Turning attention to the cost division between weak and strong cooperators, the bottom line of Fig.3 demonstrates that an equal sharing of costs is not the optimal option for triggering collective cooperation when the proportion of the strong community is at an intermediate level. As the contour lines reveal, an unequal cost division plays a pivotal role in stimulating cooperation.
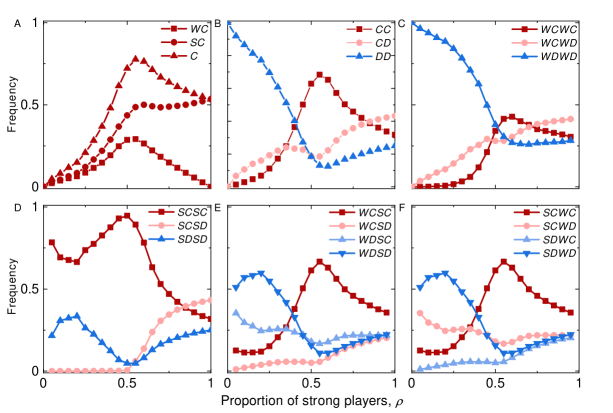
We, therefore, turn to the analysis of pairwise interactions between players (Fig. 4). Total cooperation peaks when the proportion of strong and weak players is at intermediate level (Fig. 4A), and decreases when the proportion of strong players is increased beyond that. However, the cooperativeness of strong players remains mostly flat after the peak at intermediate density, while the cooperativeness of weak players diminishes together with their density, implying that they are overtaken by defectors. Indeed, the frequency of pairwise interactions between defectors increases with the proportion of strong players going beyond intermediate level (Fig. 4B), while pairwise interactions between cooperators and defectors become the most abundant at high densities of strong players (Fig. 4B-D). Looking at the interspecific pairwise interactions further untangles the propensity for cooperation at intermediate densities of players, as more than half of all interactions are between strong and weak cooperators (Fig. 4E, F). Next in the abundance are interactions between weak defectors and strong cooperators, weak and strong defectors, and finally weak cooperators and strong defectors.
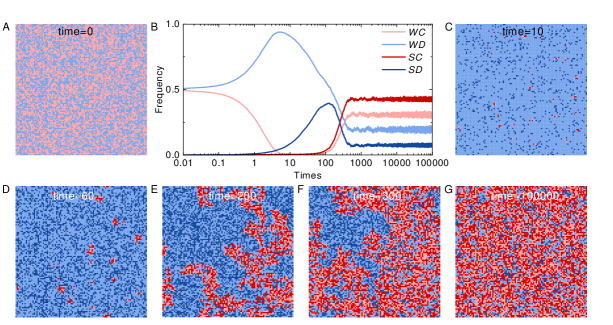
In order to explain the optimal effect triggered by community with unequal from an individual level, we scrutinize the snapshots in steady state given by Fig. 5. Steady-state snapshots limn the clearer picture; mixed populations enable weak defectors to insulate strong defectors from cooperative majority of players, hence protecting them from the standard dynamics of in pure populations (Fig. 5). This isolation strip decreases after cooperation peaks, which sufficiently explains the observed phenomenon. So far, we have been focused on the environments with constrained population dynamics, i.e. the densities of weak and strong players have been kept fixed. However, to test for the robustness of the results, we modified our model to include ecological processes. Specifically, we allowed for species type to change via ecological drift, i.e. a small, fixed probability at the beginning of each round for weak players to change to strong players and vice versa, and initialized the model with pure population of weak players (see Fig. 6). Initially, the game unfolds with significantly reduced cooperation (Fig.6A-C). However, when strong cooperators emerge through mutation, cooperation resists the invasion of defection and spreads in the network (Fig.6D-F). Simultaneously, strong defection emerges through mutation and the invasion of weak cooperators. In the end, cooperation accounts for a larger proportion than defection (Fig.6G), which is consistent with the results obtained in the scenario without mutations. Furthermore, we conduct sensitivity analysis by considering two scenarios: one with a pure strong community initially and the other with a mixed community of weak and strong initially. Remarkably, both scenarios reach identical results (see Fig. S5 in Supplementary Material).
IV Conclusion and Discussion
We study the joint effect of population composition, unequal benefits, and unequal cost division on the evolution of human cooperation. This study delved into evolutionary games within communities characterized by unequal conditions, utilizing both structured and unstructured populations. The population consists of strong and weak players, where the former consistently gains a larger benefit from cooperation compared to the latter, indicating an inequality degree. When cooperators and defectors are assigned to strong and weak players, four types of players emerge, i.e., strong cooperators, strong defectors, weak cooperators, and weak defectors. Furthermore, we also direct our attention towards unequal cost division, which mirrors labor division. In scenarios where costs are evenly distributed between weak and strong cooperators, each type of player plays a distinct game. However, if the cost division is uneven, both types participate in multiple games. To calculate cooperation in steady states, we employ mean-field theory for well-mixed populations and Monte Carlo simulations for structured populations.
In well-mixed populations, if the cost is evenly distributed between strong and weak cooperators, increasing participation from the strong community results in higher levels of cooperation. The population reaches the maximum cooperation level in a pure strong community. By analyzing four three-strategy models, we examine the distinct role of each type of player and discover the cooperation-promoting effect of strong cooperators. In contrast, by varying the cost division, we uncover an optimal effect triggered by inequality: there exists an optimal proportion of strong players with a specific cost division that triggers the highest collective cooperation. Specifically, when weak cooperators share more costs, it proves beneficial for collective cooperation. If taking networks into consideration, the above findings are further reinforced. Compared to a pure community with weak dilemma strength, a moderate proportion of strong players within a structured population triggers the highest level of collective cooperation. This can be attributed to the distribution of players within the network, where mixed communities insulate strong defectors from the cooperative majority of players, shielding them from the standard dynamics of the found in pure populations. This discovery is finally supported by a scenario involving ecological drift. Furthermore, different from findings in the well-mixed population, we observe a bi-optimal effect triggered by cost division. Either strong cooperators sharing more or weak cooperators sharing more can stimulate the highest collective cooperation, alongside a moderate proportion of strong players.
Previous studies on asymmetric evolutionary games have provided valuable insights into the emergence of cooperation [16, 31]. McAvoy and Hauert developed universal rules for studying cooperation in asymmetric evolutionary games, primarily focusing on weak selection scenarios [16]. Du et al. explored the impact of asymmetric costs on cooperative behavior in the snowdrift game on scale-free networks, revealing high cooperator density and stable cooperative behavior [37]. Hauert et al. introduced environmental feedback between an individual’s strategy and the environment, leading to rich eco-evolutionary dynamics [27]. Although these models have provided intriguing insights into the evolution of cooperation, our study advances the understanding of asymmetric evolutionary games in three key aspects:
First, dilemma strength [36], a term that measures the strength of social dilemmas, influences cooperation dynamics monotonously. Generally, cooperation diminishes as dilemma strength increases [36]. However, by considering communities with strong (corresponding to ) and weak (corresponding to ) dilemma strengths, cooperation evolves to a higher level in the mixed condition than that in a pure community with a weaker dilemma strength. That is, incorporating a weak community into a strong community promotes cooperation significantly, surpassing the level achieved in pure strong communities.
Second, asymmetry is a pervasive phenomenon found in various aspects of nature, such as location, power inequality, and species. When asymmetric communities share a cost, our study addresses how this cost should be divided to maximize cooperation. We reveal that evenly distributing the cost may not necessarily lead to enhanced collective cooperation. In fact, allocating a higher cost to weak cooperators in a well-mixed population promotes higher levels of collective cooperation. This cost division reinforces the existing asymmetry. In a structured population with moderate mixing levels, either weak or strong cooperators bearing a greater burden, can stimulate the evolution of cooperation. Although Du et al. have explored the division of the cost, they mainly concentrated on the network structure [37], rather than the game itself. We here bridge this gap.
Third, in addition to investigating the inequality of costs and benefits in cooperation, we also examine the impact of population composition, specifically the proportion of weak and strong players. It is widely recognized that even in developed countries, a significant portion of the total wealth is concentrated in the hands of a small percentage of the population, with approximately owning of the wealth. Therefore, studying the composition of communities with varying proportions of weak and strong players holds practical significance. Although there may be a gap between empirical data and theoretical analysis, our study uncovers meaningful effects of population composition on shaping collective cooperation. Exploring population composition is crucial, as demonstrated by other pertinent instances such as individuals exhibiting zealous or stubborn behavior [33, 38]. Cardillo and Masuda unveiled a critical mass effect in evolutionary games, which is induced by the increasing of zealots [33]. Furthermore, drawing inspiration from evolutionary games with environmental feedback [27, 39, 40], we introduce ecological drift to explore the transition between weak and strong player identities. Remarkably, our results consistently demonstrate that cooperation reaches higher levels in mixed communities than in pure communities, underscoring the importance of considering population composition in understanding the evolution of cooperation.
There are several intriguing avenues for future exploration. Extending the analysis to -player collective games would provide meaningful insights into the optimal allocation of costs between communities [29, 41]. Additionally, considering time scales or time delays, which capture the fast and slow effects between strategy updating and identity tag updating, can lead to more realistic analyses [42]. Experimental investigations involving structured and unstructured populations would further validate and enrich our understanding of asymmetric interactions [43, 44]. We believe that these findings will continue to be useful for explaining and manipulating the evolution of cooperation in scenarios with unequals in real life.
Ethics. This work did not require ethical approval from a human subject or animal welfare committee.
Data accessibility. This article has no additional data. The simulation code supporting this study has been uploaded to the following public repository: https://github.com/Steven-Shen91/Asymmetric-games.
Authors’ contributions. H.G.: Conceptualization, formal analysis, investigation, methodology, visualization, writing-original draft, writing-review and editing; C.S.: formal analysis, investigation, writing-original draft, writing-review and editing; R.Z.: investigation, resources, visualization; Z.W.: project administration, supervision, writing-original draft, writing-review and editing; J.X.: conceptualization, supervision, writing-original draft, writing-review and editing.
Conflict of interest declaration. We declare we have no competing interests.
Funding. This research was supported by the National Science Fund for Distinguished Young Scholars (No. 62025602), the National Science Fund for Excellent Young Scholars (No. 62222606), the National Natural Science Foundation of China (Nos. 11931015, U1803263, 81961138010 and 62076238), Fok Ying-Tong Education Foundation, China (No. 171105), Technological Innovation Team of Shaanxi Province (No. 2020TD-013), Fundamental Research Funds for the Central Universities (No. D5000211001), the Tencent Foundation and XPLORER PRIZE, JSPS Postdoctoral Fellowship Program for Foreign Researchers (grant no. P21374).
References
- Brown [2001] S. P. Brown, Collective action in an rna virus, Journal of Evolutionary Biology 14, 821 (2001).
- Andrews et al. [2018] T. M. Andrews, A. W. Delton, and R. Kline, High-risk high-reward investments to mitigate climate change, Nature Climate Change 8, 890 (2018).
- Wang et al. [2020] Z. Wang, M. Jusup, H. Guo, L. Shi, S. Geček, M. Anand, M. Perc, C. T. Bauch, J. Kurths, S. Boccaletti, et al., Communicating sentiment and outlook reverses inaction against collective risks, Proceedings of the National Academy of Sciences 117, 17650 (2020).
- Schmid et al. [2021] L. Schmid, K. Chatterjee, C. Hilbe, and M. A. Nowak, A unified framework of direct and indirect reciprocity, Nature Human Behaviour 5, 1292 (2021).
- Roberts [2008] G. Roberts, Evolution of direct and indirect reciprocity, Proceedings of the Royal Society B: Biological Sciences 275, 173 (2008).
- Tripp et al. [2022] E. A. Tripp, F. Fu, and S. D. Pauls, Evolutionary kuramoto dynamics, Proceedings of the Royal Society B 289, 20220999 (2022).
- Dong et al. [2019] Y. Dong, T. Sasaki, and B. Zhang, The competitive advantage of institutional reward, Proceedings of the Royal Society B 286, 20190001 (2019).
- Mathew and Boyd [2009] S. Mathew and R. Boyd, When does optional participation allow the evolution of cooperation?, Proceedings of the Royal Society B: Biological Sciences 276, 1167 (2009).
- Nowak [2006] M. A. Nowak, Five rules for the evolution of cooperation, science 314, 1560 (2006).
- Smith [1974] J. M. Smith, The theory of games and the evolution of animal conflicts, Journal of theoretical biology 47, 209 (1974).
- Gaunersdorfer et al. [1991] A. Gaunersdorfer, J. Hofbauer, and K. Sigmund, On the dynamics of asymmetric games, Theoretical Population Biology 39, 345 (1991).
- Szabó and Fath [2007] G. Szabó and G. Fath, Evolutionary games on graphs, Physics reports 446, 97 (2007).
- Doebeli and Hauert [2005] M. Doebeli and C. Hauert, Models of cooperation based on the prisoner’s dilemma and the snowdrift game, Ecology letters 8, 748 (2005).
- Dawes [1980] R. M. Dawes, Social dilemmas, Annual review of psychology 31, 169 (1980).
- Macy and Flache [2002] M. W. Macy and A. Flache, Learning dynamics in social dilemmas, Proceedings of the National Academy of Sciences 99, 7229 (2002).
- McAvoy and Hauert [2015] A. McAvoy and C. Hauert, Asymmetric evolutionary games, PLoS computational biology 11, e1004349 (2015).
- Gao et al. [2022] L. Gao, Y. Li, Z. Wang, and R.-W. Wang, Asymmetric strategy setup solve the prisoner’s dilemma of the evolution of mutualism, Applied Mathematics and Computation 412, 126590 (2022).
- Guo et al. [2023a] Z.-X. Guo, J.-Z. He, Q.-M. Li, L. Shi, and R.-W. Wang, Asymmetric interaction and diverse forms in public goods production in volunteer dilemma game, Chaos, Solitons & Fractals 166, 112928 (2023a).
- Wolf and Weissing [2012] M. Wolf and F. J. Weissing, Animal personalities: consequences for ecology and evolution, Trends in ecology & evolution 27, 452 (2012).
- Dall et al. [2012] S. R. Dall, A. M. Bell, D. I. Bolnick, and F. L. Ratnieks, An evolutionary ecology of individual differences, Ecology letters 15, 1189 (2012).
- Smith et al. [2010] E. A. Smith, K. Hill, F. W. Marlowe, D. Nolin, P. Wiessner, M. Gurven, S. Bowles, M. Borgerhoff Mulder, T. Hertz, and A. Bell, Wealth transmission and inequality among hunter-gatherers, Current Anthropology 51, 19 (2010).
- Apicella et al. [2012] C. L. Apicella, F. W. Marlowe, J. H. Fowler, and N. A. Christakis, Social networks and cooperation in hunter-gatherers, Nature 481, 497 (2012).
- Boix [2010] C. Boix, Origins and persistence of economic inequality, Annual Review of Political Science 13, 489 (2010).
- Canelas and Gisselquist [2018] C. Canelas and R. M. Gisselquist, Horizontal inequality as an outcome, Oxford Development Studies 46, 305 (2018).
- Engel [2011] C. Engel, Dictator games: a meta study, Experimental Economics 14, 583 (2011).
- Dawes et al. [2007] C. T. Dawes, J. H. Fowler, T. Johnson, R. McElreath, and O. Smirnov, Egalitarian motives in humans, nature 446, 794 (2007).
- Hauert et al. [2019] C. Hauert, C. Saade, and A. McAvoy, Asymmetric evolutionary games with environmental feedback, Journal of theoretical biology 462, 347 (2019).
- Su et al. [2022] Q. Su, B. Allen, and J. B. Plotkin, Evolution of cooperation with asymmetric social interactions, Proceedings of the National Academy of Sciences 119, e2113468118 (2022).
- Hauser et al. [2019] O. P. Hauser, C. Hilbe, K. Chatterjee, and M. A. Nowak, Social dilemmas among unequals, Nature 572, 524 (2019).
- Szolnoki and Perc [2017] A. Szolnoki and M. Perc, Evolutionary dynamics of cooperation in neutral populations, New Journal of Physics 20, 013031 (2017).
- Guo et al. [2020] H. Guo, X. Li, K. Hu, X. Dai, D. Jia, S. Boccaletti, M. Perc, and Z. Wang, The dynamics of cooperation in asymmetric sub-populations, New Journal of Physics 22, 083015 (2020).
- Sigmund et al. [2010] K. Sigmund, H. De Silva, A. Traulsen, and C. Hauert, Social learning promotes institutions for governing the commons, Nature 466, 861 (2010).
- Cardillo and Masuda [2020] A. Cardillo and N. Masuda, Critical mass effect in evolutionary games triggered by zealots, Physical Review Research 2, 023305 (2020).
- Adami et al. [2016] C. Adami, J. Schossau, and A. Hintze, Evolutionary game theory using agent-based methods, Physics of life reviews 19, 1 (2016).
- Szabó et al. [2005] G. Szabó, J. Vukov, and A. Szolnoki, Phase diagrams for an evolutionary prisoner’s dilemma game on two-dimensional lattices, Physical Review E 72, 047107 (2005).
- Wang et al. [2015] Z. Wang, S. Kokubo, M. Jusup, and J. Tanimoto, Universal scaling for the dilemma strength in evolutionary games, Physics of life reviews 14, 1 (2015).
- Du et al. [2009] W.-B. Du, X.-B. Cao, M.-B. Hu, and W.-X. Wang, Asymmetric cost in snowdrift game on scale-free networks, Europhysics Letters 87, 60004 (2009).
- Guo et al. [2023b] H. Guo, C. Shen, S. Hu, J. Xing, P. Tao, Y. Shi, and Z. Wang, Facilitating cooperation in human-agent hybrid populations through autonomous agents, arXiv preprint arXiv:2307.01123 (2023b).
- Guo et al. [2023c] H. Guo, Z. Song, M. Perc, X. Li, and Z. Wang, Third-party intervention of cooperation in multilayer networks, IEEE Transactions on Systems, Man, and Cybernetics: Systems , 1 (2023c).
- Tilman et al. [2020] A. R. Tilman, J. B. Plotkin, and E. Akçay, Evolutionary games with environmental feedbacks, Nature communications 11, 915 (2020).
- Santos and Pacheco [2011] F. C. Santos and J. M. Pacheco, Risk of collective failure provides an escape from the tragedy of the commons, Proceedings of the National Academy of Sciences 108, 10421 (2011).
- Rong et al. [2013] Z. Rong, Z.-X. Wu, and G. Chen, Coevolution of strategy-selection time scale and cooperation in spatial prisoner’s dilemma game, Europhysics Letters 102, 68005 (2013).
- Li et al. [2018] X. Li, M. Jusup, Z. Wang, H. Li, L. Shi, B. Podobnik, H. E. Stanley, S. Havlin, and S. Boccaletti, Punishment diminishes the benefits of network reciprocity in social dilemma experiments, Proceedings of the National Academy of Sciences 115, 30 (2018).
- Nishi et al. [2015] A. Nishi, H. Shirado, D. G. Rand, and N. A. Christakis, Inequality and visibility of wealth in experimental social networks, Nature 526, 426 (2015).