1]\orgdivDepartment of Physics, \orgnameIndian Institute of Technology Patna, \orgaddress \cityPatna, \postcode801106, \stateBihar, \countryIndia
2]\orgdivDepartment of Physics, SEAS, \orgnameBennett University, \orgaddress\streetGreater Noida, \cityUttar Pradesh, \postcode201310, \countryIndia
Slepton searches in the trilinear RPV SUSY scenarios at the HL-LHC and HE-LHC
Abstract
In this work we have studied a multi-lepton final state arising from sneutrino and left-handed slepton production at the high luminosity and high energy LHC in the context of R-parity violating supersymmetry when only the lepton number violating and/or couplings are non-zero. We have taken into account both pair production and associated production of the three generations of left-handed sleptons and sneutrinos, which are assumed to be mass degenerate. The lightest supersymmetric particle is assumed to be bino and it decays via the R-parity violating couplings into light leptons and neutrinos. Our final state has a large lepton multiplicity, . We perform both cut-based and machine learning based analyses for comparison. We present our results in the bino-slepton/sneutrino mass plane in terms of exclusion and discovery reach at the LHC. Following our analysis, the slepton mass can be discovered upto 1.54 TeV and excluded upto 1.87 TeV at the high luminosity LHC while these ranges go upto 2.46 TeV and 3.06 TeV respectively at the high energy LHC.
1 Introduction
The LHC collaborations have meticulously looked for the signal of beyond Standard Model (BSM) physics using Run-I and Run-II data and will do the same with ongoing Run-III operation. Supersymmetry [1, 2, 3, 4] is still the most popular and promising BSM scenario that solves various shortcomings of the standard model (SM) - e.g., the gauge hierarchy problem [5, 6], observed dark matter (DM) relic density of the universe [7], muon (g-2) anomaly [8] etc. As there are still no hints of new physics signal from the LHC Run-I and Run-II data, the lower bound on strongly interacting colored sparticle masses have reached up to (2-2.5) TeV [9, 10]. On the other hand, the bounds on the electroweak (EW) sector SUSY particles are much weaker [9, 10]. The R-parity conserving (RPC) minimal supersymmetric standard model (MSSM) [1, 2, 3, 4, 11] provides a stable weakly interacting massive particle (WIMP) which can be a natural DM candidate [12, 13, 14, 15] and the most popular choice is the lightest neutralino () in the form of lightest SUSY particle (LSP). In the RPC scenarios with light EW sectors there are a large number of phenomenological analyses which have addressed the implication of LHC results along with muon (g-2) anomaly and observed DM relic density data [16, 17, 18, 19, 20, 21, 22, 23, 24, 25, 26].
The RPC MSSM is more extensively studied in literature due to the DM candidate in the form of the LSP and for that, we need to incorporate the R-parity conservation by hand. If R-parity violating (RPV) terms are allowed, the superpotential looks like [27, 28, 29]
| (1) |
where the first three terms are the lepton number violating terms and the last term violates the baryon number. Here is the up-type Higgs supermultiplet and () refers to the left-handed lepton doublet (right-handed singlet) supermultiplet. Similarly, () corresponds to the up-type left (right)-handed doublet (singlet) quark supermultiplet. represents the right-handed down-type quark supermultiplet. In this work we only consider the non-zero couplings111These couplings contribute to light neutrino masses and mixings at one loop level [30, 28] and to muon (g-2) [31, 32]. which have distinctive collider signatures compared to RPC scenarios. In the RPC scenario, the stable LSP leads to a large amount of missing energy in the final states while the LSP decays to multilepton final states for scenarios. Depending on the choices of LSP and non-zero RPV couplings, one obtains various novel final states [33, 34, 35, 36, 37, 38]. For different choices of couplings, the LHC collaborations have already derived limits on chargino and slepton masses [39] using LHC Run-II data and it will be interesting to study the sensitivity of the EW sparticle searches at the 14 TeV high luminosity LHC (HL-LHC) and the proposed high energy (27 TeV) upgrade of the LHC (HE-LHC). It may be noted that the SUSY parameter space containing one or more lighter EW sparticles like charginos, sneutrinos, smuons or neutralinos are very much consistent with the recent measurement of muon magnetic moment at Fermilab [40, 8, 41]. The additional contributions from SUSY mainly come from the chargino-sneutrino loop and smuon-neutralino loop and there could be even some additional contribution in the RPV scenarios depending on the couplings. A few phenomenological analyses with RPC and RPV scenarios in the context of muon (g-2) anomaly may be seen in Refs. [42, 43, 17, 23, 44, 45, 46, 47, 48, 49, 50, 51, 52, 32, 53].
In a recent work [54] the search prospect of gaugino sector at the HL-LHC and HE-LHC with is presented using the direct and production for scenarios with non-zero couplings222For electroweakino searches in the context of couplings at the HL-LHC please refer to [55].. In this work we extend the similar analysis using the direct production of mass degenerate L-type sleptons of all three generations. First we look for the results using traditional cut-and-count based analysis and then look for the improvement of sensitivity using a machine learning (ML) algorithm. For the ML analysis we will adopt the boosted decision tree (BDT) [56, 57] algorithm.
In Sec. 2 we discuss the model framework along with the possibility of different final states arising from distinct choice of RPV couplings. In Sec. 3, we first present the projected exclusion limits in the slepton-LSP mass plane using a traditional cut-and-count analysis followed by a ML based algorithm at the HL-LHC. We extend this multilepton analysis for the HE-LHC also. We conclude our results in Sec. 4.
2 Model Definition
The pair production cross-sections for L-type charged slepton is roughly times larger than the R-type charged slepton pair production [58, 59, 60, 61, 62, 63]. In the context of RPC slepton searches, the most popular simplified models consist of both L and R-type charged slepton of the first two generations. On the other hand, the sneutrino pair productions or charged slepton-sneutrino productions contribute to the multilepton final states in the RPV SUSY scenarios with nonzero couplings. In this work, we consider a simplified model where all three generations L-type charged sleptons and sneutrinos are mass degenerate (R-type sleptons are assumed to be lying beyond the reach of the LHC) and the sleptons are produced via and channels, where The corresponding Feynman diagrams for these productions are shown in Fig. 1.
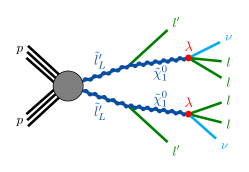
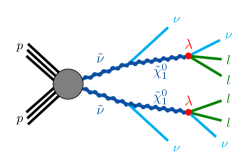
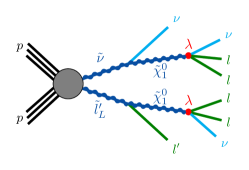
Here the sleptons decay to lepton and bino type LSP () and via the couplings the LSP decays into , where . Thus one obtains maximally enriched leptonic final states in scenarios with non-zero and/or couplings where the LSP pair in the final state always gives rise to () + topology333For example decays to and with 50% branching ratios each for single non-zero values of coupling. Depending upon the production modes ( and ) one or two more leptons may arise in the final state. In this work, we will focus on non-zero () scenarios and consider the final states consisting of at least four leptons , where . It may be noted that 9 non-zero couplings lead to different charged lepton configurations and the LSP pair in the final states leads to three more different scenarios where the leptonic () branching ratios get reduced and the collider limits or sensitivity become weaker 444Before concluding our results we will also briefly comments on the sensitivity in such scenarios.. For more details on the LSP decay modes and charged lepton configurations for various scenarios see Sec. 2 of Ref. [54].
3 Collider analysis
As discussed in the previous section, we consider a simplified model with L-type mass degenerate charged sleptons and sneutrinos (all three generations) and look for the projection reach at the HL-LHC and HE-LHC using a final state with at least 4 leptons (). For this final state, dominant SM backgrounds are , and and we also compute sub-dominant processes like , , h production via , , , . All these SM backgrounds and the SUSY signals have been generated using MadGraph5-aMC@NLO [64] and Pythia-6.4 [65] at the leading order (LO) parton level respectively. The cross-sections for the SM backgrounds are taken from Table 11 and Table 13 of Ref. [54]. The NLO+NLL level cross-sections for SUSY signals have been calculated using Resummino-3.1.1 [58, 62, 59, 60, 61, 63]. For fast detector simulation we have used DELPHES 3 (version-3.5.0) platform [66]. Jets reconstructions have been done using anti- algorithm [67] algorithm with jet radius , and . Leptons are reconstructed with and cuts from electron (muon) candidates after isolation. The track and calorimeter isolation, tagging efficiency, generation level cuts, jet matching, etc. are done in a similar way as prescribed in Sec.3 of Ref.[54].
3.1 Prospect at the HL-LHC: cut-based vs. ML analysis
In this section, we present the prospect of slepton pair productions at the high luminosity LHC (HL-LHC) with final state at the center of mass energy TeV and fb-1. First, we will present the conventional cut-and-count analysis and then we will look for the improvement using a boosted decision tree (BDT) based machine learning algorithm.
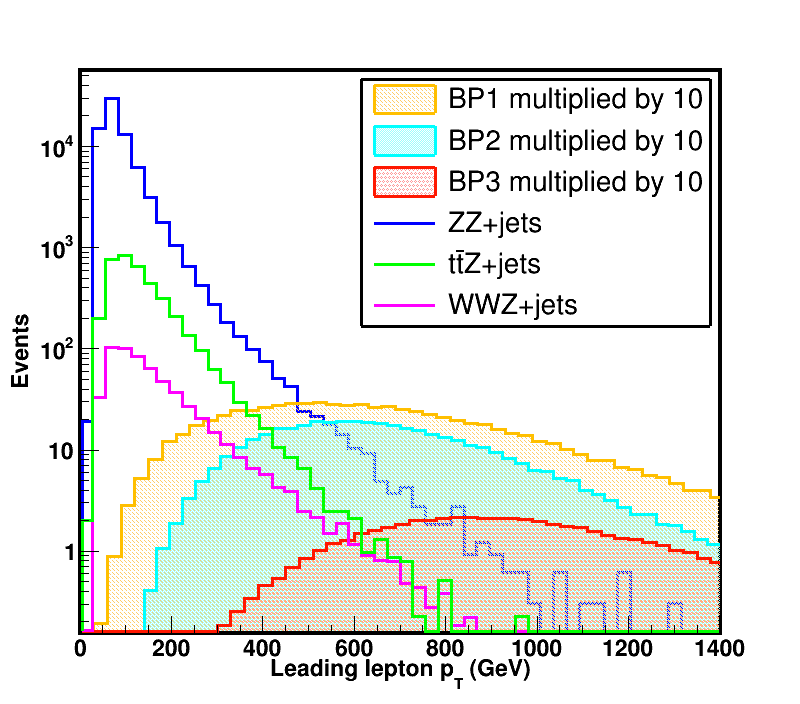
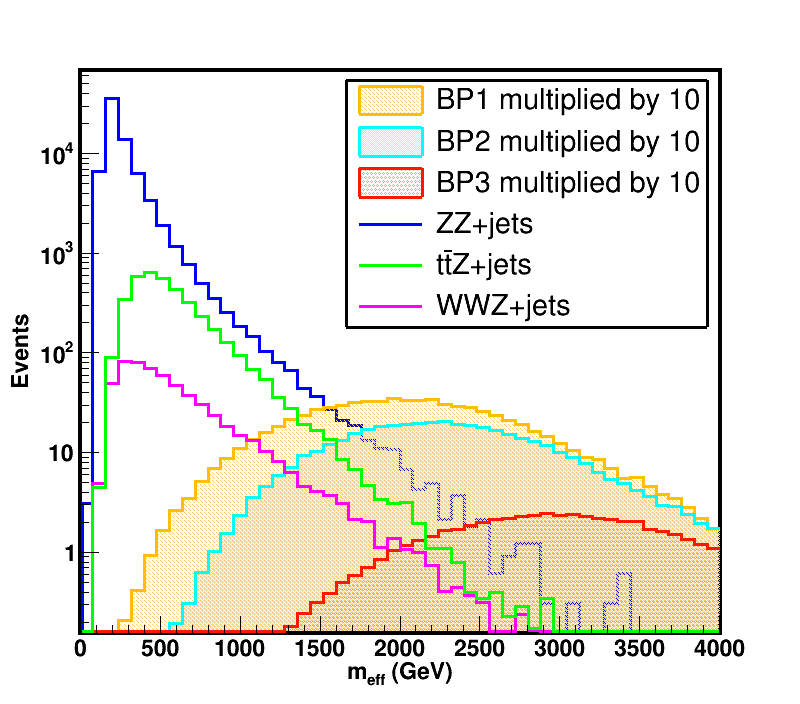
The ATLAS collaboration has already excluded the slepton mass up to 1.2 TeV using RUN-II LHC data [39] for non-zero () couplings. Following the ATLAS analysis [39] and similar to our previous work [54], we optimize the effective mass () variable for cut-based analysis to maximize the signal significance and define the signal regions. To demonstrate the results we consider three signal benchmark points: - BP1: GeV, GeV; BP2: GeV, GeV; BP3: GeV, GeV. The mass difference between sleptons and the LSP is large, intermediate, and small for BP1, BP2, and BP3 respectively. In Fig. 2, we depict the distribution of leading lepton transverse momentum () and effective mass ()555The effective mass is defined as . for the three benchmark points along with the three main SM backgrounds (, , ). The yellow, cyan, and red filled regions correspond to BP1, BP2, and BP3 respectively, while the blue, green, and magenta colored lines illustrate the , and background respectively. Fig. 2 suggests that the typical cuts like GeV and a large will reduce the backgrounds significantly without affecting the signal events too much. Following cut optimization we observe that the 4 + + veto666The event with same flavor opposite sign leptons pair with invariant mass range GeV are excluded. + veto cut along with large provides the maximum signal significance. We define the two signal region as : SR-A with GeV and SR-B with GeV.
| Signal Region | |||||
| + | SR-A | SR-B | |||
| 100 GeV | Z veto | b veto | ( GeV) | ( GeV) | |
| BP1 (1300,250) | 74.45 | 65.28 | 60.87 | 59.16 | 49.10 |
| BP2 (1450,800) | 42.20 | 40.99 | 38.01 | 37.80 | 34.01 |
| BP3 (1800,1750) | 5.86 | 5.56 | 5.20 | 5.19 | 5.10 |
| Total | |||||
| background | 22124.17 | 382.82 | 221.92 | 20.19 | 3.498 |
| Signal Significance ( , Sys. Unc. =5%) | BP1 | 6.64 (6.07) | 6.77 (6.36) | ||
| BP2 | 4.96 (4.64) | 5.55 (5.31) | |||
| BP3 | 1.03 (0.998) | 1.74 (1.72) | |||
In Table 1, we have summarized the production cross-section of the signal benchmark points, the corresponding yields of signal events, and the total background yield after the selection cuts. The signal significance without systematic uncertainty () and with 5% uncertainty () are also presented in the last three rows. To estimate the signal significance we have used the relation where S, B and correspond to the signal yield, background yield and systematic uncertainty respectively. Due to the large cut, the SR-B signal regions are more effective than SR-A in the parameter space where slepton masses are relatively higher. The signal significance corresponding to BP1, BP2 and BP3 for SR-B signal region are 6.77 (6.35), 5.55 (5.31), 1.74 (1.72) respectively for = 0% (5%). The effect of including 5% uncertainty is not significant and it is observed that the signal significance reduces by 1-6%. We illustrate the projected discovery () and exclusion (2) reach at the HL-LHC using cut-based methods in mass plane in Fig. 4. The light-blue filled region denotes the projection and the blue dotted line corresponds to the projected 5 discovery reach. The projected exclusion (discovery) curve reaches up to 1.75 (1.49) TeV on slepton masses.
Next, we perform a ML-based analysis for the improvement of signal significance using an Extreme Gradient Boosted decision tree algorithm through XGBoost machine learning toolkit [68]. A set of 18 ‘features’ (kinematic variables) are constructed to perform our analysis which are transverse momenta of leading and subleading lepton ( and ), between first four leading leptons777 is defined as (6 variables), the difference in azimuthal angle between first four leading leptons and (4 variables), number of b-tagged (), non-b-tagged jets (), missing transverse energy (), effective mass (), number of SFOS pair () and number of reconstructed (). We have considered () events for SUSY signal and SM backgrounds. In this process, 80% of the data set is considered for training and the rest for testing using multi:softprob objective function to achieve the multiclass classification. We choose the hyperparameters as follows: number of trees = 500, maximum depth = 10, and learning rate = 0.03 for optimal outcome. Finally, we obtain the predicted probability score of different classes for every event and applying a threshold on this score we estimate the maximum significance.
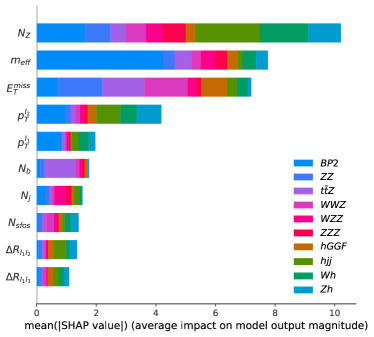
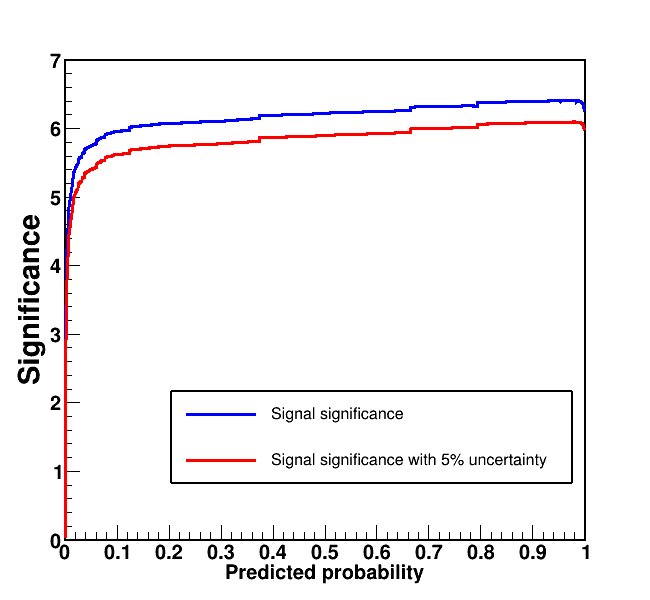
To find out the effectiveness of each feature and their ranking we have estimated the Shapley values using SHAP (SHapley Additive exPlanation) [69, 70] toolkit. We plot the mean of absolute values of the top 10 kinematic variables in Fig. 3 (left panel) for a particular signal benchmark point, BP2 ( GeV, GeV) and SM backgrounds. The top three important variables are , and . We also depict the effect of probability scores on the signal significance for BP2 with 0 (blue line) and 5 (red line) systematic uncertainty in the right panel of Fig. 3. It is evident that the signal significance saturates around probability score 0.9-0.96.
The signal yields, the total background yields, the signal significances for the benchmark points, and the gain in significance from cut-based analysis are demonstrated in Table 2 for probability score values 0.90 and 0.96 . The numbers in the brackets are the results corresponding to significance and gain with 5% systematic uncertainty. Around 15-38% gain in signal significance is achieved by implementing ML algorithms as compared to the cut-based method.
| Benchmark Points | Probability Score | Signal | Total | Signal | Gain in |
| Yield | Background Yield | Significance | from | ||
| (Sys Unc. = ) | Cut-based | ||||
| BP1 | 0.90 | 72.66 | 3.61 | 8.32 (7.62) | 23% (20%) |
| 0.96 | 71.70 | 1.98 | 8.35 (7.68) | 23% (21%) | |
| BP2 | 0.90 | 41.82 | 1.17 | 6.38 (6.06) | 15% (14%) |
| 0.96 | 41.66 | 0.87 | 6.39 (6.07) | 15% (14%) | |
| BP3 | 0.90 | 5.86 | 0.95 | 2.25 (2.23) | 29% (30%) |
| 0.96 | 5.85 | 0.10 | 2.40 (2.38) | 38% (38%) |
Finally, we estimate the projected discovery () and exclusion () reach in plane at HL-LHC using ML-based methods. To compare the results with cut-and-count analysis we present the and projection in Fig. 4 using the violet dotted line and violet-colored filled region respectively. The and curves extend up to 1.54 TeV and 1.87 TeV for left-handed degenerate slepton masses (all three generations). This provides us an enhancement of approximately 120 GeV improvement in the projected exclusion limits using XGBoost compared to the cut-based method.
3.2 Prospect at the HE-LHC: cut-based vs. ML analysis
We further extend our analysis for High Energy LHC ( TeV, ) for direct slepton pair production with final state. Similar to Sec. 2, we implement the cut-and-count method along with ML-based algorithm for further improvement. To showcase our results and compare the two methods we have chosen three signal benchmark points as : BP1 ( GeV, GeV), BP4 ( GeV, GeV) and BP5 ( GeV, GeV).
| Signal Region | |||||
| + 150 GeV | Z veto | b veto | SR-C ( GeV) | SR-D ( GeV) | |
| BP1 (1300,250) | 1165.63 | 1032.68 | 937.85 | 806.16 | 524.44 |
| BP4 (2000,1000) | 110.79 | 109.13 | 98.76 | 97.40 | 87.34 |
| BP5 (2750,2500) | 10.24 | 10.14 | 9.20 | 9.19 | 9.09 |
| Total | |||||
| background | 26640.55 | 708.36 | 307.57 | 23.76 | 5.86 |
| Signal Significance ( , Sys. Unc.=5%) | BP1 | 27.98 (15.96) | 22.77 (14.93) | ||
| BP4 | 8.85 (7.75) | 9.04 (8.14) | |||
| BP5 | 1.60 (1.54) | 2.35 (2.31) | |||
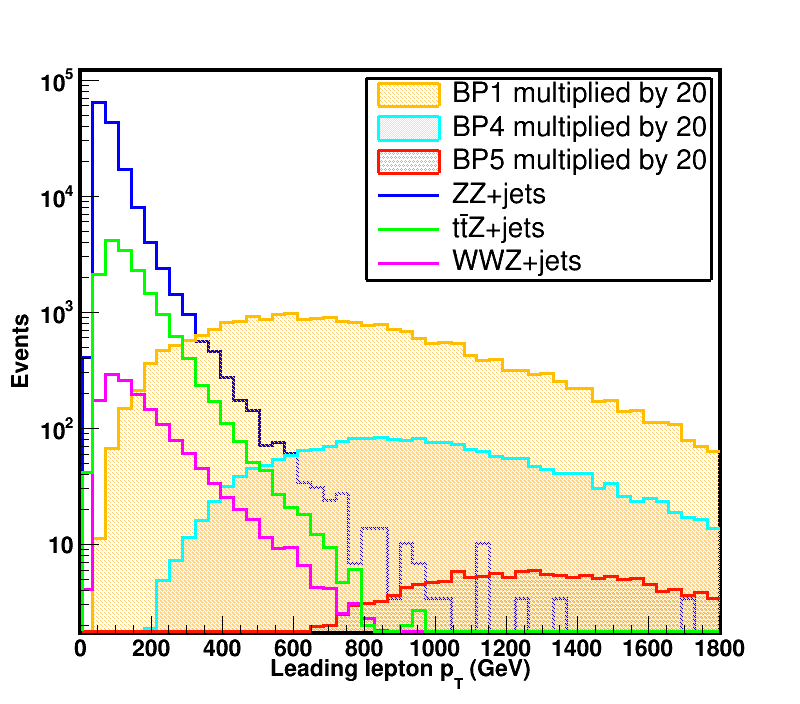
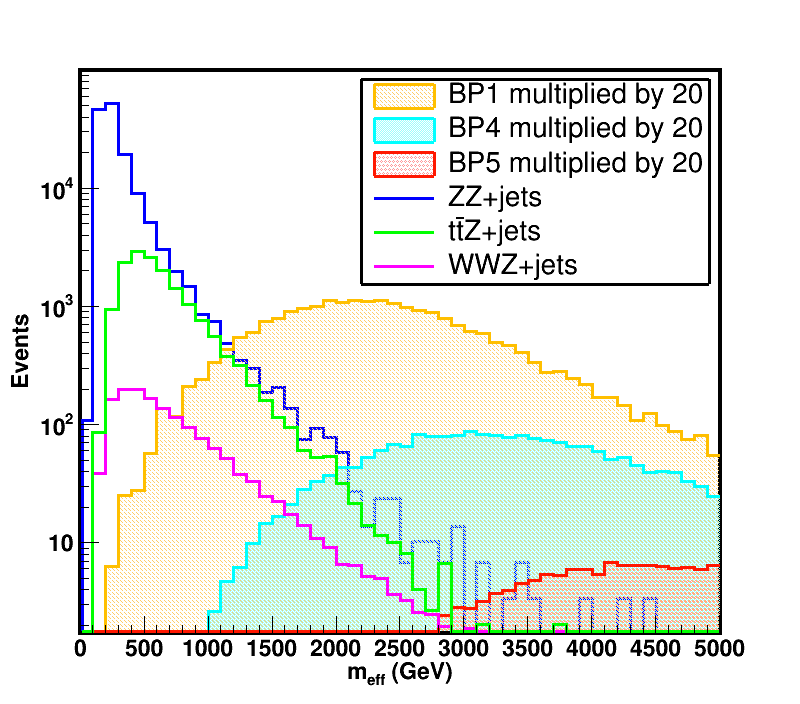
Fig. 5 depicts the distributions for transverse momenta of leading lepton () and effective mass () corresponding to these benchmark points and three dominant SM backgrounds channels; , and , respectively. We have used similar color conventions for SM backgrounds as in Fig. 2 and BP1, BP4 and BP5 are portrayed by yellow, cyan, and red regions respectively. Similar to 14 TeV analysis, it is evident that a large cut on and will effectively discard SM backgrounds while merely affecting the signals. We obtain that a cut-set consisting of veto + GeV + veto along with strong cut provides the maximal signal significance. We define two signal regions, SR-C with GeV and SR-D with GeV. The cut flow table for selected benchmark points and the total SM backgrounds are presented in the Table. 3 along with signal significance without and with systematic uncertainty. The signal significance for () for BP1, BP4 and BP5 are 22.77 (14.93), 9.04 (8.14), 2.35 (2.31) for SR-D.
The projected discovery () and exclusion () reach at the HE-LHC using cut-and-count based method are presented in Fig. 7 in the slepton-LSP mass plane. The light-green shaded region denotes reach and reach is denoted by the dotted green line. The current limit obtained from ATLAS collaboration from Run-II data is marked with red color. We have observed that slepton masses can be excluded up to 2.86 (2.82) TeV with the choice of (2.81) TeV with C.L.. The projection reaches up to 2.32 TeV for at the HE-LHC with cut-based analysis.
| Benchmark Points | Probability Score | Signal | Total | Signal | Gain in |
| Background Yield | Significance | from | |||
| (Sys Unc. = ) | Cut-based | ||||
| BP1 | 0.90 | 1098.85 | 10.73 | 32.98 (16.98) | 18% (6%) |
| 0.96 | 1080.31 | 4.18 | 32.80 (17.02) | 17% (6%) | |
| BP4 | 0.90 | 107.68 | 1.23 | 10.31 (9.14) | 14% (12%) |
| 0.96 | 107.40 | 0.48 | 10.34 (9.18) | 14% (12%) | |
| BP5 | 0.90 | 9.92 | 0.21 | 3.11 (3.07) | 32% (33%) |
| 0.96 | 9.90 | 0.18 | 3.12 (3.08) | 33% (33%) |
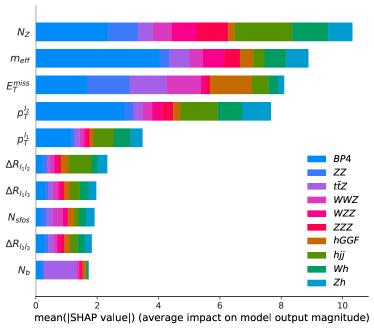
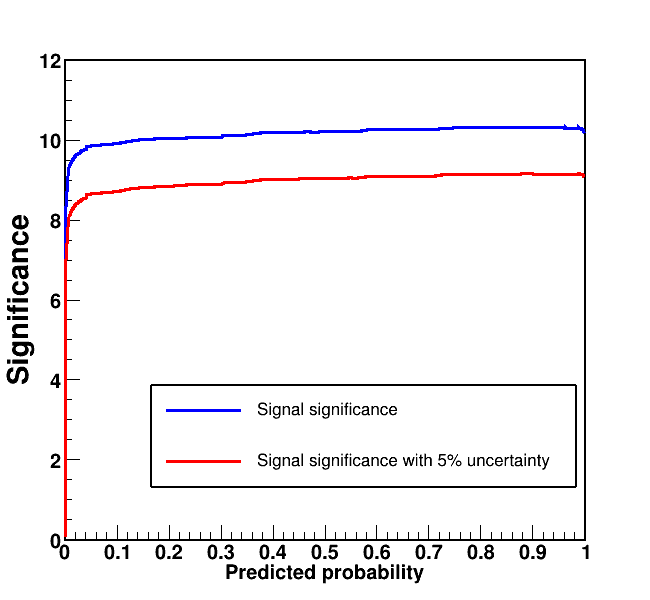
We proceed with a similar ML analysis as in Sec.2 to ascertain how much the sensitivity can be improved upon. We choose the same set of features and hyperparameter selection as discussed earlier. Similar to HL-LHC analysis, we obtain a similar Shapley feature importance plot which is presented in Fig. 6. On the right panel of Fig. 6 we present the variation of signal significance for the HE-LHC as a function of probability score. Next, we estimate the signal yields, total background yield, and signal significance for different values of probability score and systematic uncertainty for the three benchmark points. We show these results in the Table 4. In the last column, we present the gain in . An improvement of 14% to 33% is observed in the XGBoost results compared to the conventional cut-based method. The numbers in the parentheses represent the results corresponding to 5% systematic uncertainty. The improvement of signal significance is also echoed in the exclusion plot illustrated in the slepton-LSP mass plane (Fig. 7). The brown dotted line corresponds to the projections at the HE-LHC using ML based algorithm and it reaches up to 2.46 TeV. The green dotted line (corresponding to cut-based ) indicates that the reach is enhanced by 140 GeV in the ML-based analysis. We also observe that the projected exclusion curve (displayed via brown solid regions) reaches up to 3.06 TeV resulting an improvement of 200 GeV as compared to the cut-based method (green region).
3.3 Comparision among different scenarios
| HL-LHC | HE-LHC | ||||||||
| Benchmark | Signal Significance | Benchmark | Signal Significance | ||||||
| points | S-I | S-II | S-III | S-IV | points | S-I | S-II | S-III | S-IV |
| BP1 | 8.35 | 6.69 | 4.84 | 3.52 | BP1 | 32.98 | 26.64 | 18.86 | 13.50 |
| BP2 | 6.39 | 5.25 | 3.86 | 2.83 | BP4 | 10.31 | 8.46 | 6.26 | 4.59 |
| BP3 | 2.40 | 1.91 | 1.32 | 0.93 | BP5 | 3.11 | 2.51 | 1.76 | 1.18 |
| [GeV] | Exclusion limit on [GeV] | [GeV] | Exclusion limit on [GeV] | ||||||
| 800 | 1850 | 1800 | 1670 | 1575 | 1000 | 3020 | 2880 | 2620 | 2500 |
In this work, we have focused on the RPV SUSY scenarios with non-zero values of and/or which provide maximum leptonic () branching ratios of the LSP decay and thus leads to the most stringent limits on the slepton masses. Before concluding we comment on the collider limits in other scenarios associated with the remaining seven non-zero couplings from () final state. The scenarios with non-zero and/or , for which we already obtained the limits in Sec. 2 and Sec. 3.2 are denoted as S-I.
-
•
Scenario-II: S-II represents the models with single non zero couplings where and . The LSP pair in the final state decays to , , and final states with 25%, 50%, and 25% branching ratios respectively.
-
•
Scenario-III: S-III defines the model with non-zero value of coupling where we get final state with 100% branching ratio from the LSP pair.
-
•
Scenario-IV: S-IV corresponds to the non-zero values of with where the LSP pair decays to , and final states with 25%, 50% and 25% branching ratios respectively.
-
•
Among these four scenarios, the () channel provides the best limit in S-I models. On the other hand, one expects the weakest limit in S-IV model which is mostly tau enriched. Discovery and exclusion reach in other two models (S-III and S-IV) or models with any arbitrary combination of non-zero lie between S-I and S-IV. This pattern is observed in the Table 5 where we present the signal significance obtained from ML-based analysis at the HL-LHC and HE-LHC for the above mentioned four models.
-
•
In Table 5, we also show the variation of projected 2 limits on slepton mass for a fixed choice of LSP mass. We observe that the limits are weaker by 275 (520) GeV at the Hl-LHC and HE-LHC in the extreme tau enriched model i.e., S-IV compared to S-I.
4 Conclusion
Supersymmetric signals have been searched extensively at the LHC. The R-parity conserving framework has typically been more widely studied compared to its R-parity violating counterpart. The large number of final states non-zero R-parity violating couplings can open up a need to be studied to ascertain the full extent of impact the LHC data has or is going to have on the relevant parameter space. Sleptons are of particular importance in the context of any SUSY scenarios since they affect the contribution of the model to some very crucial observables, such as light neutrino mass and mixing, lepton magnetic moment, and lepton number or lepton flavor violating decay rates. Non-zero couplings also contribute to these observables. In this work, therefore, we have explored a scenario where the sleptons and sneutrinos are produced through usual RPC couplings and subsequently decay into leptons and neutrinos through RPV decay of the bino LSP. In order to understand the maximum impact LHC can have on the parameter space we consider the production of all three generations of sneutrinos and left-handed sleptons which have larger cross-sections compared to their right-handed counterpart. We have performed a detailed cut-based collider analysis alongside using a machine learning algorithm for comparison. Since we are interested in electron and muon-enriched final states, we have only considered non-zero and couplings. Our final state has rich lepton multiplicity, 4 (). We observe that this final state can probe slepton and sneutrino masses most efficiently. In our analysis, we have assumed the left-handed sleptons and sneutrinos to be mass degenerate for simplicity. We explore both the high luminosity and high energy options of the LHC and present our results in terms of exclusion region ( statistical significance) and discovery reach ( statistical significance) in the LSP - slepton/sneutrino mass plane. Our study reveals that the discovery regions reach up to 1.49 TeV and 1.54 TeV while the exclusion regions reach up to 1.75 TeV and 1.87 TeV at HL-LHC for cut-based and ML algorithm respectively. Similarly at HE-LHC, we have shown that the projected discovery regions reach up to 2.32 TeV and 2.46 TeV while projected exclusion limits are 2.86 TeV and 3.06 TeV for cut-based and ML algorithm respectively. We obtain overall better improvement in the case of HE-LHC with ML algorithm. Understandably, the presence of other non-zero couplings can give rise to -leptons in the final states and as a result reduces the signal efficiency. We have compared the different possible scenarios with different non-zero couplings. We observed that in the worst case scenario when only the are non-zero, the signal significance drops by a factor of 2.22.6 at HL-LHC and HE-LHC.
Data availability statement: No data associated in the manuscript.
References
- \bibcommenthead
- Drees et al. [2004] Drees, M., Godbole, R., Roy, P.: Theory and Phenomenology of Sparticles: An Account of Four-dimensional N=1 Supersymmetry in High Energy Physics, (2004)
- Haber and Stephenson Haskins [2018] Haber, H.E., Stephenson Haskins, L.: Supersymmetric Theory and Models. In: Theoretical Advanced Study Institute in Elementary Particle Physics: Anticipating the Next Discoveries in Particle Physics, pp. 355–499 (2018). https://doi.org/10.1142/9789813233348_0006
- Martin [1998] Martin, S.P.: A Supersymmetry primer. Adv. Ser. Direct. High Energy Phys. 18, 1–98 (1998) https://doi.org/10.1142/9789812839657_0001 arXiv:hep-ph/9709356
- Nilles [1984] Nilles, H.P.: Supersymmetry, Supergravity and Particle Physics. Phys. Rept. 110, 1–162 (1984) https://doi.org/10.1016/0370-1573(84)90008-5
- Susskind [1984] Susskind, L.: The gauge hierarchy problem, technicolor, supersymmetry, and all that. Physics Reports 104(2), 181–193 (1984) https://doi.org/10.1016/0370-1573(84)90208-4
- Gildener [1976] Gildener, E.: Gauge-symmetry hierarchies. Phys. Rev. D 14, 1667–1672 (1976) https://doi.org/10.1103/PhysRevD.14.1667
- Aghanim et al. [2020] Aghanim, N., et al.: Planck 2018 results. VI. Cosmological parameters. Astron. Astrophys. 641, 6 (2020) https://doi.org/10.1051/0004-6361/201833910 arXiv:1807.06209 [astro-ph.CO]. [Erratum: Astron.Astrophys. 652, C4 (2021)]
- Abi et al. [2021] Abi, B., et al.: Measurement of the Positive Muon Anomalous Magnetic Moment to 0.46 ppm. Phys. Rev. Lett. 126(14), 141801 (2021) https://doi.org/10.1103/PhysRevLett.126.141801 arXiv:2104.03281 [hep-ex]
- [9] Cms susy public result. https://cms-results.web.cern.ch/cms-results/public-results/preliminary-results/SUS/index.html
- [10] Atlas susy public result. https://twiki.cern.ch/twiki/bin/view/AtlasPublic/SupersymmetryPublicResults
- Vempati [2012] Vempati, S.K.: Introduction to MSSM (2012) arXiv:1201.0334 [hep-ph]
- Bertone et al. [2005] Bertone, G., Hooper, D., Silk, J.: Particle dark matter: Evidence, candidates and constraints. Phys. Rept. 405, 279–390 (2005) https://doi.org/10.1016/j.physrep.2004.08.031 arXiv:hep-ph/0404175
- Baer and Tata [2009] Baer, H., Tata, X.: In: Datta, A., Mukhopadhyaya, B., Raychaudhuri, A., Gupta, A.K., Khetrapal, C.L., Padmanabhan, T., Vijayan, M. (eds.) Dark matter and the LHC, pp. 179–203 (2009). https://doi.org/10.1007/978-81-8489-295-6_12
- Roszkowski [2004] Roszkowski, L.: Particle dark matter: A Theorist’s perspective. Pramana 62, 389–401 (2004) https://doi.org/10.1007/BF02705097 arXiv:hep-ph/0404052
- Jungman et al. [1996] Jungman, G., Kamionkowski, M., Griest, K.: Supersymmetric dark matter. Phys. Rept. 267, 195–373 (1996) https://doi.org/10.1016/0370-1573(95)00058-5 arXiv:hep-ph/9506380
- Barman et al. [2023] Barman, R.K., Bélanger, G., Bhattacherjee, B., Godbole, R.M., Sengupta, R.: Is Light Neutralino Thermal Dark Matter in the Phenomenological Minimal Supersymmetric Standard Model Ruled Out? Phys. Rev. Lett. 131(1), 011802 (2023) https://doi.org/10.1103/PhysRevLett.131.011802 arXiv:2207.06238 [hep-ph]
- He et al. [2023] He, Y., Jia, X., Meng, L., Yue, Y., Zhang, D.: Impact of recent measurement of , LHC search for supersymmetry, and LZ experiment on Minimal Supersymmetric Standard Model (2023) arXiv:2303.02360 [hep-ph]
- Chakraborti et al. [2017] Chakraborti, M., Chattopadhyay, U., Poddar, S.: How light a higgsino or a wino dark matter can become in a compressed scenario of MSSM. JHEP 09, 064 (2017) https://doi.org/%****␣paper_v1.bbl␣Line␣300␣****10.1007/JHEP09(2017)064 arXiv:1702.03954 [hep-ph]
- Chowdhury et al. [2017] Chowdhury, D., Patel, K.M., Tata, X., Vempati, S.K.: Indirect Searches of the Degenerate MSSM. Phys. Rev. D 95(7), 075025 (2017) https://doi.org/10.1103/PhysRevD.95.075025 arXiv:1612.06471 [hep-ph]
- Bhattacharyya et al. [2011] Bhattacharyya, N., Choudhury, A., Datta, A.: Low mass neutralino dark matter in mSUGRA and more general models in the light of LHC data. Phys. Rev. D 84, 095006 (2011) https://doi.org/10.1103/PhysRevD.84.095006 arXiv:1107.1997 [hep-ph]
- Choudhury and Datta [2012] Choudhury, A., Datta, A.: Many faces of low mass neutralino dark matter in the unconstrained MSSM, LHC data and new signals. JHEP 06, 006 (2012) https://doi.org/10.1007/JHEP06(2012)006 arXiv:1203.4106 [hep-ph]
- Choudhury and Datta [2013] Choudhury, A., Datta, A.: Neutralino dark matter confronted by the LHC constraints on Electroweak SUSY signals. JHEP 09, 119 (2013) https://doi.org/10.1007/JHEP09(2013)119 arXiv:1305.0928 [hep-ph]
- Chakraborti et al. [2021] Chakraborti, M., Roszkowski, L., Trojanowski, S.: GUT-constrained supersymmetry and dark matter in light of the new determination. JHEP 05, 252 (2021) https://doi.org/10.1007/JHEP05(2021)252 arXiv:2104.04458 [hep-ph]
- Choudhury and Mondal [2016] Choudhury, A., Mondal, S.: Revisiting the Exclusion Limits from Direct Chargino-Neutralino Production at the LHC. Phys. Rev. D 94(5), 055024 (2016) https://doi.org/10.1103/PhysRevD.94.055024 arXiv:1603.05502 [hep-ph]
- Dutta et al. [2016] Dutta, J., Konar, P., Mondal, S., Mukhopadhyaya, B., Rai, S.K.: A Revisit to a Compressed Supersymmetric Spectrum with 125 GeV Higgs. JHEP 01, 051 (2016) https://doi.org/10.1007/JHEP01(2016)051 arXiv:1511.09284 [hep-ph]
- Dutta et al. [2017] Dutta, J., Konar, P., Mondal, S., Mukhopadhyaya, B., Rai, S.K.: Search for a compressed supersymmetric spectrum with a light Gravitino. JHEP 09, 026 (2017) https://doi.org/10.1007/JHEP09(2017)026 arXiv:1704.04617 [hep-ph]
- Dreiner [2010] Dreiner, H.K.: An Introduction to explicit R-parity violation. Adv. Ser. Direct. High Energy Phys. 21, 565–583 (2010) https://doi.org/10.1142/9789814307505_0017 arXiv:hep-ph/9707435
- Barbier et al. [2005] Barbier, R., et al.: R-parity violating supersymmetry. Phys. Rept. 420, 1–202 (2005) https://doi.org/10.1016/j.physrep.2005.08.006 arXiv:hep-ph/0406039
- Banks et al. [1995] Banks, T., Grossman, Y., Nardi, E., Nir, Y.: Supersymmetry without R-parity and without lepton number. Phys. Rev. D 52, 5319–5325 (1995) https://doi.org/10.1103/PhysRevD.52.5319 arXiv:hep-ph/9505248
- Grossman and Rakshit [2004] Grossman, Y., Rakshit, S.: Neutrino masses in R-parity violating supersymmetric models. Phys. Rev. D 69, 093002 (2004) https://doi.org/10.1103/PhysRevD.69.093002 arXiv:hep-ph/0311310
- Kim et al. [2001] Kim, J.E., Kyae, B., Lee, H.M.: Effective supersymmetric theory and (g-2)(muon with R-parity violation. Phys. Lett. B 520, 298–306 (2001) https://doi.org/10.1016/S0370-2693(01)01134-0 arXiv:hep-ph/0103054
- Chakraborty and Chakraborty [2016] Chakraborty, A., Chakraborty, S.: Probing at the LHC in the paradigm of -parity violating MSSM. Phys. Rev. D 93(7), 075035 (2016) https://doi.org/10.1103/PhysRevD.93.075035 arXiv:1511.08874 [hep-ph]
- Dreiner et al. [2023] Dreiner, H.K., Koay, Y.S., Köhler, D., Lozano, V.M., Montejo Berlingen, J., Nangia, S., Strobbe, N.: The ABC of RPV: classification of R-parity violating signatures at the LHC for small couplings. JHEP 07, 215 (2023) https://doi.org/10.1007/JHEP07(2023)215 arXiv:2306.07317 [hep-ph]
- Mitsou [2015] Mitsou, V.A.: R-parity violating supersymmetry and neutrino physics: experimental signatures. PoS PLANCK2015, 085 (2015) https://doi.org/10.22323/1.258.0085 arXiv:1510.02660 [hep-ph]
- Bardhan et al. [2017] Bardhan, D., Chakraborty, A., Choudhury, D., Ghosh, D.K., Maity, M.: Search for bottom squarks in the baryon-number violating MSSM. Phys. Rev. D 96(3), 035024 (2017) https://doi.org/%****␣paper_v1.bbl␣Line␣600␣****10.1103/PhysRevD.96.035024 arXiv:1611.03846 [hep-ph]
- Bhattacherjee and Chakraborty [2014] Bhattacherjee, B., Chakraborty, A.: Study of the baryonic R-parity violating MSSM using the jet substructure technique at the 14 TeV LHC. Phys. Rev. D 89(11), 115016 (2014) https://doi.org/10.1103/PhysRevD.89.115016 arXiv:1311.5785 [hep-ph]
- Bhattacherjee et al. [2013] Bhattacherjee, B., Evans, J.L., Ibe, M., Matsumoto, S., Yanagida, T.T.: Natural supersymmetry’s last hope: R-parity violation via UDD operators. Phys. Rev. D 87(11), 115002 (2013) https://doi.org/10.1103/PhysRevD.87.115002 arXiv:1301.2336 [hep-ph]
- Dercks et al. [2019] Dercks, D., De Vries, J., Dreiner, H.K., Wang, Z.S.: R-parity Violation and Light Neutralinos at CODEX-b, FASER, and MATHUSLA. Phys. Rev. D 99(5), 055039 (2019) https://doi.org/10.1103/PhysRevD.99.055039 arXiv:1810.03617 [hep-ph]
- Aad et al. [2021] Aad, G., et al.: Search for supersymmetry in events with four or more charged leptons in 139 fb-1 of = 13 TeV pp collisions with the ATLAS detector. JHEP 07, 167 (2021) https://doi.org/%****␣paper_v1.bbl␣Line␣675␣****10.1007/JHEP07(2021)167 arXiv:2103.11684 [hep-ex]
- Bennett et al. [2006] Bennett, G.W., et al.: Final Report of the Muon E821 Anomalous Magnetic Moment Measurement at BNL. Phys. Rev. D 73, 072003 (2006) https://doi.org/10.1103/PhysRevD.73.072003 arXiv:hep-ex/0602035
- Aguillard et al. [2023] Aguillard, D.P., et al.: Measurement of the Positive Muon Anomalous Magnetic Moment to 0.20 ppm (2023) arXiv:2308.06230 [hep-ex]
- Chakraborti et al. [2022] Chakraborti, M., Iwamoto, S., Kim, J.S., Masełek, R., Sakurai, K.: Supersymmetric explanation of the muon g – 2 anomaly with and without stable neutralino. JHEP 08, 124 (2022) https://doi.org/10.1007/JHEP08(2022)124 arXiv:2202.12928 [hep-ph]
- Choudhury et al. [2023] Choudhury, A., Mitra, S., Mondal, A., Mondal, S.: Bilinear R-parity violating supersymmetry under the light of neutrino oscillation, higgs and flavor data (2023) arXiv:2305.15211 [hep-ph]
- Chakraborti et al. [2015] Chakraborti, M., Chattopadhyay, U., Choudhury, A., Datta, A., Poddar, S.: Reduced LHC constraints for higgsino-like heavier electroweakinos. JHEP 11, 050 (2015) https://doi.org/10.1007/JHEP11(2015)050 arXiv:1507.01395 [hep-ph]
- Chakraborti et al. [2014] Chakraborti, M., Chattopadhyay, U., Choudhury, A., Datta, A., Poddar, S.: The Electroweak Sector of the pMSSM in the Light of LHC - 8 TeV and Other Data. JHEP 07, 019 (2014) https://doi.org/10.1007/JHEP07(2014)019 arXiv:1404.4841 [hep-ph]
- Baer et al. [2021] Baer, H., Barger, V., Serce, H.: Anomalous muon magnetic moment, supersymmetry, naturalness, LHC search limits and the landscape. Phys. Lett. B 820, 136480 (2021) https://doi.org/10.1016/j.physletb.2021.136480 arXiv:2104.07597 [hep-ph]
- Endo et al. [2021] Endo, M., Hamaguchi, K., Iwamoto, S., Kitahara, T.: Supersymmetric interpretation of the muon g – 2 anomaly. JHEP 07, 075 (2021) https://doi.org/10.1007/JHEP07(2021)075 arXiv:2104.03217 [hep-ph]
- Choudhury et al. [2017] Choudhury, A., Rao, S., Roszkowski, L.: Impact of LHC data on muon solutions in a vectorlike extension of the constrained MSSM. Phys. Rev. D 96(7), 075046 (2017) https://doi.org/10.1103/PhysRevD.96.075046 arXiv:1708.05675 [hep-ph]
- Kowalska et al. [2015] Kowalska, K., Roszkowski, L., Sessolo, E.M., Williams, A.J.: GUT-inspired SUSY and the muon g 2 anomaly: prospects for LHC 14 TeV. JHEP 06, 020 (2015) https://doi.org/10.1007/JHEP06(2015)020 arXiv:1503.08219 [hep-ph]
- Hundi [2011] Hundi, R.S.: Constraints from neutrino masses and muon (g-2) in the bilinear R-parity violating supersymmetric model. Phys. Rev. D 83, 115019 (2011) https://doi.org/10.1103/PhysRevD.83.115019 arXiv:1101.2810 [hep-ph]
- Altmannshofer et al. [2020] Altmannshofer, W., Dev, P.S.B., Soni, A., Sui, Y.: Addressing R, R, muon and ANITA anomalies in a minimal -parity violating supersymmetric framework. Phys. Rev. D 102(1), 015031 (2020) https://doi.org/10.1103/PhysRevD.102.015031 arXiv:2002.12910 [hep-ph]
- Zheng and Zhang [2021] Zheng, M.-D., Zhang, H.-H.: Studying the anomalies and in -parity violating MSSM framework with the inverse seesaw mechanism. Phys. Rev. D 104(11), 115023 (2021) https://doi.org/10.1103/PhysRevD.104.115023 arXiv:2105.06954 [hep-ph]
- Zheng et al. [2022] Zheng, M.-D., Chen, F.-Z., Zhang, H.-H.: Explaining anomalies of B-physics, muon and W mass in R-parity violating MSSM with seesaw mechanism. Eur. Phys. J. C 82(10), 895 (2022) https://doi.org/10.1140/epjc/s10052-022-10822-y arXiv:2207.07636 [hep-ph]
- Choudhury et al. [2023] Choudhury, A., Mondal, A., Mondal, S., Sarkar, S.: Improving sensitivity of trilinear RPV SUSY searches using machine learning at the LHC (2023) arXiv:2308.02697 [hep-ph]
- Barman et al. [2021] Barman, R.K., Bhattacherjee, B., Chakraborty, I., Choudhury, A., Khan, N.: Electroweakino searches at the HL-LHC in the baryon number violating MSSM. Phys. Rev. D 103(1), 015003 (2021) https://doi.org/10.1103/PhysRevD.103.015003 arXiv:2003.10920 [hep-ph]
- Cornell et al. [2022] Cornell, A.S., Doorsamy, W., Fuks, B., Harmsen, G., Mason, L.: Boosted decision trees in the era of new physics: a smuon analysis case study. JHEP 04, 015 (2022) https://doi.org/10.1007/JHEP04(2022)015 arXiv:2109.11815 [hep-ph]
- Coadou [2022] Coadou, Y.: Boosted decision trees (2022) https://doi.org/10.1142/9789811234033_0002 arXiv:2206.09645 [physics.data-an]
- Fuks et al. [2014] Fuks, B., Klasen, M., Lamprea, D.R., Rothering, M.: Revisiting slepton pair production at the Large Hadron Collider. JHEP 01, 168 (2014) https://doi.org/10.1007/JHEP01(2014)168 arXiv:1310.2621 [hep-ph]
- Fiaschi and Klasen [2018] Fiaschi, J., Klasen, M.: Slepton pair production at the LHC in NLO+NLL with resummation-improved parton densities. JHEP 03, 094 (2018) https://doi.org/10.1007/JHEP03(2018)094 arXiv:1801.10357 [hep-ph]
- Fiaschi et al. [2023] Fiaschi, J., Fuks, B., Klasen, M., Neuwirth, A.: Electroweak superpartner production at 13.6 Tev with Resummino. Eur. Phys. J. C 83(8), 707 (2023) https://doi.org/10.1140/epjc/s10052-023-11888-y arXiv:2304.11915 [hep-ph]
- Bozzi et al. [2007] Bozzi, G., Fuks, B., Klasen, M.: Threshold Resummation for Slepton-Pair Production at Hadron Colliders. Nucl. Phys. B 777, 157–181 (2007) https://doi.org/10.1016/j.nuclphysb.2007.03.052 arXiv:hep-ph/0701202
- Fuks et al. [2013] Fuks, B., Klasen, M., Lamprea, D.R., Rothering, M.: Precision predictions for electroweak superpartner production at hadron colliders with Resummino. Eur. Phys. J. C 73, 2480 (2013) https://doi.org/10.1140/epjc/s10052-013-2480-0 arXiv:1304.0790 [hep-ph]
- Beenakker et al. [1999] Beenakker, W., Klasen, M., Kramer, M., Plehn, T., Spira, M., Zerwas, P.M.: The Production of charginos / neutralinos and sleptons at hadron colliders. Phys. Rev. Lett. 83, 3780–3783 (1999) https://doi.org/10.1103/PhysRevLett.100.029901 arXiv:hep-ph/9906298. [Erratum: Phys.Rev.Lett. 100, 029901 (2008)]
- Alwall et al. [2014] Alwall, J., Frederix, R., Frixione, S., Hirschi, V., Maltoni, F., Mattelaer, O., Shao, H.-S., Stelzer, T., Torrielli, P., Zaro, M.: The automated computation of tree-level and next-to-leading order differential cross sections, and their matching to parton shower simulations. JHEP 07, 079 (2014) https://doi.org/10.1007/JHEP07(2014)079 arXiv:1405.0301 [hep-ph]
- Sjostrand et al. [2006] Sjostrand, T., Mrenna, S., Skands, P.Z.: PYTHIA 6.4 Physics and Manual. JHEP 05, 026 (2006) https://doi.org/10.1088/1126-6708/2006/05/026 arXiv:hep-ph/0603175
- de Favereau et al. [2014] Favereau, J., Delaere, C., Demin, P., Giammanco, A., Lemaître, V., Mertens, A., Selvaggi, M.: DELPHES 3, A modular framework for fast simulation of a generic collider experiment. JHEP 02, 057 (2014) https://doi.org/10.1007/JHEP02(2014)057 arXiv:1307.6346 [hep-ex]
- Cacciari et al. [2008] Cacciari, M., Salam, G.P., Soyez, G.: The anti- jet clustering algorithm. JHEP 04, 063 (2008) https://doi.org/10.1088/1126-6708/2008/04/063 arXiv:0802.1189 [hep-ph]
- Chen and Guestrin [2016] Chen, T., Guestrin, C.: XGBoost: A Scalable Tree Boosting System (2016) https://doi.org/10.1145/2939672.2939785 arXiv:1603.02754 [cs.LG]
- Lundberg and Lee [2017] Lundberg, S.M., Lee, S.: A unified approach to interpreting model predictions. CoRR abs/1705.07874 (2017) 1705.07874
- Shapley [1953] Shapley, L.S.: In: Kuhn, H.W., Tucker, A.W. (eds.) 17. A Value for n-Person Games, pp. 307–318. Princeton University Press, Princeton (1953). https://doi.org/10.1515/9781400881970-018 . https://doi.org/10.1515/9781400881970-018