Impact of filaments on galaxy cluster properties in The Three Hundred simulation
Abstract
Galaxy clusters and their filamentary outskirts reveal useful laboratories to test cosmological models and investigate Universe composition and evolution. Their environment, in particular the filaments of the Cosmic Web to which they are connected, plays an important role in shaping the properties of galaxy clusters. In this project, we analyse the gas filamentary structures present in 324 regions of The Three Hundred hydrodynamical simulation extracted with the DisPerSE filament finder. We estimate the number of gas filaments globally connected to several galaxy clusters, i.e. the connectivity k, with a mass range of at redshift . We study the positive correlation between the connectivity and mass of galaxy clusters. Moreover, we explore the impact of filaments on the dynamical state of clusters, quantified by the degree of relaxation parameter .
1 Introduction
Clusters of galaxies, the largest gravitationally bound systems in the Universe, reside at the nodes of the Cosmic Web Bond:1996 and are connected by a multitude of filamentary structures. In the outskirts of the clusters, matter and galaxies are funneled towards the centre through filaments. A comprehensive knowledge of the filaments connected to galaxy clusters is essential to understand the influence of the environment on galaxy cluster properties and evolution. One way to quantify the filamentary skeleton around the cluster is through the so-called connectivity Codis:2018 , defined as the number of filaments globally connected to the galaxy cluster, estimated at a specific aperture. This project aims to investigate the impact of filaments on the main galaxy cluster properties, in particular in this work we focus on their masses and dynamical state.
2 The Three Hundred project
In this work, we analyse the multiple zoom-in regions of The Three Hundred hydrodynamical simulation Cui:2018 . The Three Hundred project111https://the300-project.org aims to model 324 regions whose volumes have cubic side lengths of , centered on massive galaxy clusters, with a mass . The Three Hundred regions are re-simulated with higher resolution from the 324 most massive galaxy clusters at of the Dark Matter-only MDPL2 MultiDark Klypin:2016 simulation. The cosmological parameters used in the MDPL2 and The Three Hundred simulations are those measured by the Planck mission Planck Collaboration:2016 . The regions have been re-simulated with different baryonic models: Gadget-MUSIC Sembolini:2013 , Gadget-X Rasia:2015 , which is used in this work, and more recently Gizmo-Simba Cui:2022 . For each region, 128 snapshots are available from redshift to . The simulated regions were analysed using the AHF halo finder Knollmann:2011 which self-consistently includes both gas and stars in the halo finding process. The halo finder extracts haloes and estimates their properties, such as the radius 222The subscript indicates the overdensity, i.e. value of the ratio between the density of the cluster at that radius and the critical density of the Universe at the cluster’s redshift. , mass and density profile.
3 Methods
3.1 Cosmic Web extraction
The gas particle distribution of The Three Hundred regions are analysed with DisPerSE Sousbie:2011 , a topological structure finder, designed to extract the structures of the Cosmic Web.
The finder identifies topologically significant features in the input density field, which is obtained through a Delaunay tesselation in the case of a 2D or 3D discrete distribution. The noise introduced by the finite sampling of the distribution is quantified and reduced with the persistence and topological simplification theories. The persistence parameter, which quantifies the robustness of a topological pair, is defined as the difference of the values of the critical points in the pair and is used to filter low significant filaments. As an output, DisPerSE provides the positions of the extreme points found in the distribution: maxima, minima, saddle points and bifurcation points, where a filament splits in two. The filaments are given as a set of segments connecting a maximum and a saddle point.
For our analysis, we first binned the gas particle distribution of each region at redshift in a three-dimensional grid of per side, and within each region we give a pixel resolution of . Then, to avoid sharp variations from one pixel to another, we applied a Gaussian smoothing with a of 4 pixels. Finally we applied an absolute persistence cut of , to focus on significant filaments connecting clusters and haloes.
The node distribution extracted from DisPerSE was compared with the AHF halo catalogue of each region, to match the DisPerSE maximum points to the simulated haloes and clusters. To avoid a possible low-resolution contamination near the borders, we consider only the haloes inside a sphere of radius from the centre of each region. The final data set includes haloes and clusters with a mass range from .
The gas skeleton extracted from The Three Hundred simulated regions is a good tracer of the overall matter distribution and accretion to galaxy clusters. In particular, throughout the 324 simulated regions there is a good spatial agreement between the gas filaments and both the Dark Matter and mock galaxy filaments, both from 3D and 2D extractions Kuchner:2020 ; Kuchner:2021 .
3.2 Connectivity measurements
For each halo we estimated the connectivity , which is defined in Codis:2018 as the number of filaments globally connected to a cluster. Different definitions are used in literature to estimate this parameter. In this work, we compute the connectivity as the number of filaments crossing a specific spherical surface at a radius from the centre of the halo. In particular, we estimate the connectivity at and at , defined respectively as and . With this definition, we are taking into consideration also the filaments that are coming from substructures and bifurcation points that lie within the sphere, which contribute to the cluster’s properties and therefore also to its connectivity.
4 Results
In this work we investigate if the number of filaments connected to a cluster, quantified by the connectivity, is correlated with the main properties of the cluster itself, mainly its mass and dynamical state.
4.1 Connectivity and galaxy cluster mass
The number of filaments connected to a cluster is expected to correlate with the mass of the cluster itself, as many studies show Aragon-Calvo:2010 ; Sarron:2019 ; Darragh Ford:2019 ; Malavasi:2020 . The expected trend is for the connectivity to increase with the mass of the cluster.
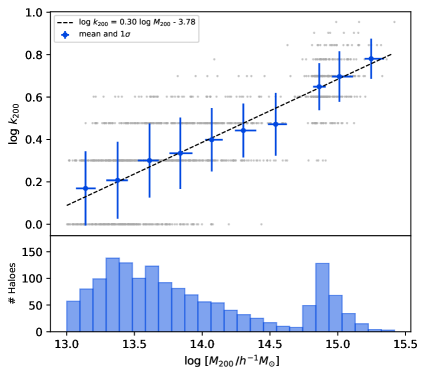
Taking the advantage to investigate a cluster’s sample with the largest mass range, we analyse the connectivity of a set of haloes and clusters extracted from The Three Hundred simulation at redshift . Figure 1 shows the values of the connectivity as a function of the clusters mass . We measured the mean and the standard deviation for each mass bin, chosen by taking into account the overall mass distribution in The Three Hundred simulation at , shown in the bottom panel of the figure. We performed a linear fitting, whose parameters are shown in Table 1, as the following: .
| A | 0.298 0.016 |
|---|---|
| B | -3.78 0.23 |
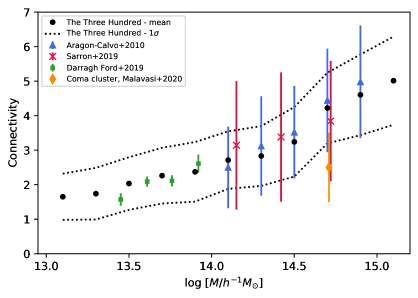
We compare our estimates of the connectivity to similar measurements from literature studies, as shown in Figure 2. We compare our sample both to simulated, as Aragon-Calvo:2010 , and observed data, such as Sarron:2019 ; Darragh Ford:2019 ; Malavasi:2020 . The trend of the connectivity with the mass is well in agreement, within the errors, with the ones from literature, despite the differences presented in Table 2, and over a larger mass range. More specifically, the connectivity is estimated at a fixed aperture in Aragon-Calvo:2010 ; Sarron:2019 , while the connectivity from our work and Darragh Ford:2019 ; Malavasi:2020 is estimated at an overdensity radius. Other differences can arise from the Cosmic Web component chosen to extract the filamentary skeletons, such as gas, Dark Matter or galaxies particles and from the different filament finder used in the analyses. We refer to Aragon-Calvo:2010 ; Sarron:2019 ; Darragh Ford:2019 ; Malavasi:2020 for a more detailed description of the datasets used.
| Data | M | CW extraction | ||
|---|---|---|---|---|
| The300 | Hydro simulation | 3D gas particles | ||
| AC+10 Aragon-Calvo:2010 | DM simulation | 3 Mpc | 3D DM particles | |
| S+19 Sarron:2019 | Observations | 1.5 Mpc | 2D galaxies | |
| DF+19 Darragh Ford:2019 | Observations | 1.5 | 2D galaxies | |
| M+20 Malavasi:2020 | Observations (Coma Cl.) | 3D z-slice galaxies |
4.2 Connectivity and galaxy cluster dynamical state
In this subsection we investigate the correlation between the connectivity and the dynamical state of The Three Hundred clusters. We quantify the dynamical state with the degree of relaxation , as defined by Haggar:2020 :
where is the sub-halo mass fraction, is the centre-of-mass offset and is the virial ratio. The threshold values for these parameters were chosen following Cui:2017 . A cluster is considered as dynamically relaxed when .
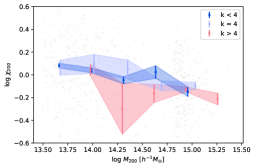
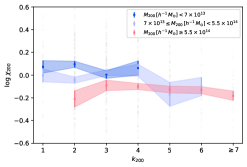
To study the effect of connectivity on the dynamical state of clusters, independently on their masses, we divide the data set in three different connectivity and mass sub-samples. Respectively, we consider weakly connected (), medium connected () and highly connected () clusters along with low mass (), medium () and massive () clusters.
In the left and right panels of Figure 3 we display the degree of relaxation as a function of the mass and connectivity, respectively, for three connectivity and mass bins. At a fixed mass, the left panel of Figure 3 shows that there is no evident correlation between connectivity and the degree of relaxation, as the three sub-samples overlap. On the other hand, at fixed connectivity, the right panel of the figure shows a slight correlation between the mass and , indicating that less massive haloes are on average more dynamically relaxed.
This result is in disagreement with that found by Gouin:2021 , where at fixed mass, weakly connected clusters are on average more relaxed than highly connected clusters. These differences may depend on the different data set and Cosmic Web extraction analysed in their work, to which we refer the reader for more details.
5 Conclusions
In this work we analysed the gas filamentary structures connected to The Three Hundred hydrodynamical simulation clusters and their impact on galaxy cluster properties. We extracted the gas skeletons at with the DisPerSE filament finder in the 324 regions of the simulation and we estimated the connectivity of haloes and clusters.
The main conclusions of this work can be summarized in the following:
-
1.
The connectivity is correlated with the mass of haloes and clusters, with more massive clusters being on average more connected. This result is compatible with previous results from literature, both from simulations and observations;
-
2.
We do not find a correlation between the connectivity and the dynamical state of clusters, quantified in terms of the degree of relaxation .
References
- (1) Bond J. R. et al., Nature 380, 603 (1996)
- (2) Codis S. et al., Monthly Notices of the Royal Astronomical Society 479, 973 (2018)
- (3) Cui W. et al., Monthly Notices of the Royal Astronomical Society 480, 2898 (2018)
- (4) Klypin A. et al., Monthly Notices of the Royal Astronomical Society 457, 4340 (2016)
- (5) Planck Collaboration et al., Astronomy and Astrophysics 594, A13 (2016)
- (6) Sembolini F. et al., Monthly Notices of the Royal Astronomical Society 429, 323 (2013)
- (7) Rasia E. et al., The Astrophysical Journal 813, L17 (2015)
- (8) Cui W. et al., Monthly Notices of the Royal Astronomical Society 514, 977 (2022)
- (9) Knollmann S. R. et al., Astrophysics Source Code Library (2011)
- (10) Sousbie T., Monthly Notices of the Royal Astronomical Society 414, 350 (2011)
- (11) Kuchner U. et al., Monthly Notices of the Royal Astronomical Society 494, 5473 (2020)
- (12) Kuchner U. et al., Monthly Notices of the Royal Astronomical Society 503, 2065 (2021)
- (13) AragÃn-Calvo M. A. et al., Monthly Notices of the Royal Astronomical Society 408, 2163 (2010)
- (14) Sarron F. et al., Astronomy and Astrophysics 632, A49 (2019)
- (15) Darragh Ford E. et al., Monthly Notices of the Royal Astronomical Society 489, 5695 (2019)
- (16) Malavasi N. et al., Astronomy and Astrophysics 634, A30 (2020)
- (17) Haggar R. et al., Monthly Notices of the Royal Astronomical Society 492, 6074 (2020)
- (18) Cui W. et al., Monthly Notices of the Royal Astronomical Society 464, 2502 (2017)
- (19) Gouin C. et al., Astronomy and Astrophysics 651, A56 (2021)