\ul
IMITATE: Clinical Prior Guided Hierarchical Vision-Language Pre-training
Abstract
In the field of medical Vision-Language Pre-training (VLP), significant efforts have been devoted to deriving text and image features from both clinical reports and associated medical images. However, most existing methods may have overlooked the opportunity in leveraging the inherent hierarchical structure of clinical reports, which are generally split into ‘findings’ for descriptive content and ‘impressions’ for conclusive observation. Instead of utilizing this rich, structured format, current medical VLP approaches often simplify the report into either a unified entity or fragmented tokens. In this work, we propose a novel clinical prior guided VLP framework named IMITATE to learn the structure information from medical reports with hierarchical vision-language alignment. The framework derives multi-level visual features from the chest X-ray (CXR) images and separately aligns these features with the descriptive and the conclusive text encoded in the hierarchical medical report. Furthermore, a new clinical-informed contrastive loss is introduced for cross-modal learning, which accounts for clinical prior knowledge in formulating sample correlations in contrastive learning. The proposed model, IMITATE, outperforms baseline VLP methods across six different datasets, spanning five medical imaging downstream tasks. Comprehensive experimental results highlight the advantages of integrating the hierarchical structure of medical reports for vision-language alignment.
Index Terms:
Self-supervised Learning, Vision-Language Pre-training, Chest X-ray Image AnalysisI Introduction
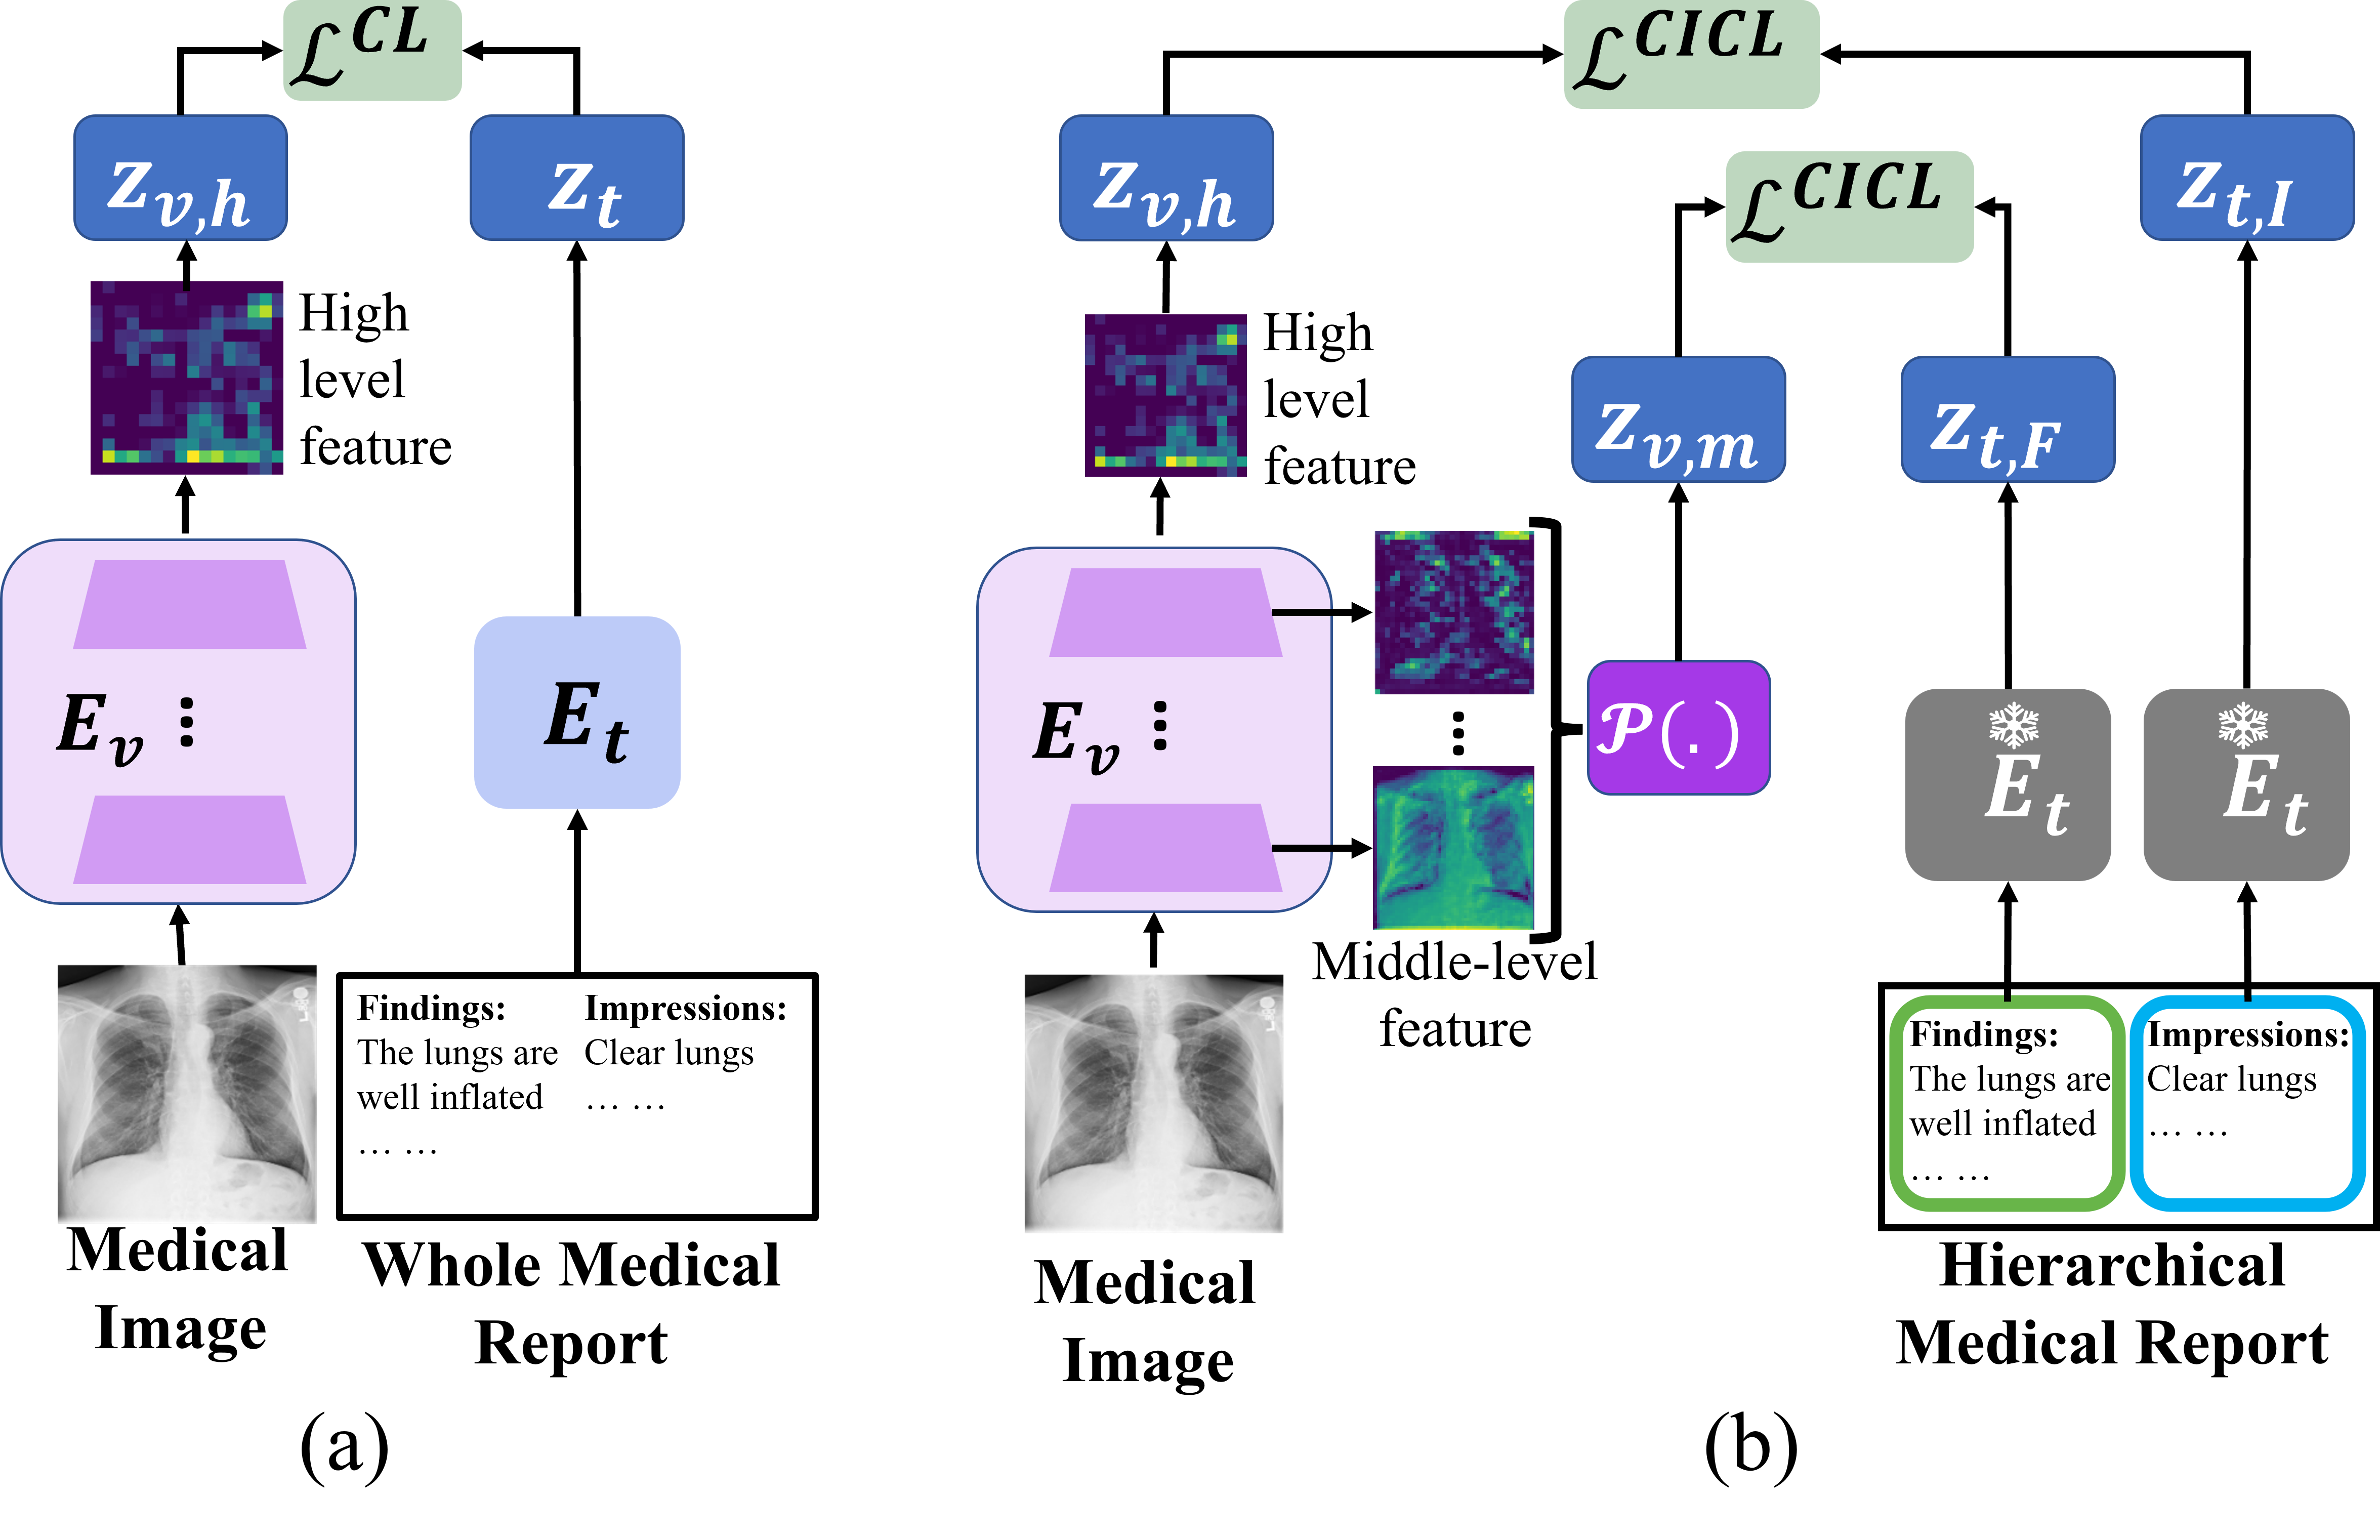
Self-supervised learning has made significant progress in representation learning from a single modality such as image or text [5, 6, 7, 8, 9]. To link the representations between different modalities, vision-language pre-training (VLP) has been introduced to align the vision and language content typically in large datasets [2, 10]. In the medical domain, as a frontline triaging and diagnosis tool, chest x-ray (CXR) scans are often accompanied by text reports as the result of the standard clinical procedure, providing a rich source of paired image-text data for VLP. The challenge in medical VLP arises from the structure of CXR text reports, which consist of two parts, ‘Findings’ and ‘Impressions’. The ‘Findings’ section describes the image content, e.g. ‘the lungs are well inflated’, whereas the ‘Impressions’ section concludes the report, e.g. ‘clear lungs’. Conventional VLP methods align high-level visual features with the entire medical report, without distinguishing between the descriptive and conclusive sections in the report [2, 1, 3, 4].
To better utilise the hierarchical information in the medical report, we propose a novel clinical prior guided VLP framework, IMITATE, that aims to perform VLP via hIerachical MultI-level conTrAsTive lEarning. As depicted in Fig. 1, our framework aligns different levels of visual features separately with the descriptive and conclusive parts of the medical report. We hypothesize that low-level visual features embody more descriptive properties of images corresponding to the descriptive part of the report, while high-level visual features contain more semantic information corresponding to the conclusive part of the report. Apart from aligning between visual and textual features, we also align between visual features of different views to enhance the model’s invariance to view variation. To perform the alignment, current VLP approaches perform one-to-one alignment between each image-text pair [2, 11], while ignoring the clinical similarity across different pairs. This can be problematic especially in the medical domain, because different patients may share similar symptoms, which makes their imaging scans or medical reports similar. We need to be cautious in defining the contrastive loss for different patients. To address this issue, we introduce a new alignment loss function named Clinical-Informed Contrastive Loss (CICL). This function integrates clinical correlations among patients into the alignment loss mechanism. Unlike traditional approaches that use a binary affinity matrix as the target [2, 1, 4], CICL constructs the affinity matrix based on the similarity among different image-report pairs.
We compare the proposed method with the state-of-the-art (SOTA) VLP approaches and evaluate them on a variety of downstream tasks, including supervised medical image classification, semantic segmentation, object detection and zero-shot image classification. We show that our method significantly outperforms the SOTA methods on six public CXR datasets.
Overall, the contributions of this work are three-fold:
-
1.
We address the alignment challenge in medical VLP via the hierarchical alignment between multi-level visual features from medical images and the descriptive and conclusive textual features from medical reports.
-
2.
We propose a new clinical-informed contrastive loss for visual-textual alignment, which incorporates the similarity among different patients into the alignment.
-
3.
We achieve SOTA results across 6 datasets encompassing 5 distinct medical image tasks. Notably, IMITATE stands out by attaining superior performance on RSNA segmentation even with just 1% of data for fine-tuning. This accomplishment surpasses the performance of other baseline methods that require 100% data for fine-tuning.

II Related Work
II-A General vision-Language Pre-training
Joint training of Vision and Language Models In an effort to overcome the limitations of single-modality learning and better utilize the relationship between image and text data, VLP has been introduced [12, 13, 14], which learns and aligns representations from visual and textual input. Recent methods such as CLIP [2], ALIGN [15], Florence [16], LiT [17] and ALBEF [18] have shown significant progress in improving the representation learning for natural images and languages, although they require substantial training data and computational resources [2, 19, 20]. Alternative methods have been proposed to reduce the training cost or data need in VLP. For instance, BeiT3 [21] employs masked inputs and multi-modal data reconstruction to avoid the comparison of image-text pairs. A-FLIP [22] utilizes partially masked images as input to decrease the computational cost. SLIP [23] introduces an additional image contrastive branch to improve CLIP [2].
The utilization of multi-level text in VLP can be found in PyramidCLIP [24]. However, PyramidCLIP does not fully embody self-supervised learning, as it employs an additional object detector to extract regional visual features during the VLP stage. This detector is trained on annotated data complete with bounding box labels. Also, PyramidCLIP uses randomly cropped images to align with the text, which, according to [25], can be inappropriate for medical imaging where anatomical correspondence is important when matching between the image and text.
Frozen Language Model in VLP VLP requires tremendous computational resources which can be prohibitively expensive. To address this issue, [26, 27] freeze the language model for VLP and achieve competitive results on the visual question answering task. Furthermore, a recent work of [28] freezes both the language and vision models and designs an additional trainable block to align visual and language embeddings. These methods demonstrate the potential of using a frozen language model in VLP. In this paper, we investigate the frozen language model in medical VLP.
II-B Medical Vision-Language Pre-training
Research in medical VLP is limited due to the complexity of the medical reports and the scarcity of large-scale medical image-text datasets. ConVIRT [1] pioneered VLP within the CXR domain, leveraging a bidirectional contrastive loss to align image-text pairs. GLoRIA [3] proposed a global-local VLP technique that seeks alignment between image regions and individual text tokens, fostering enhanced representation learning. MGCA [4] adopted a crafted prototype-level alignment strategy to align semantic relationships between CXR images and their associated reports. Notably, these methodologies [3, 4] attempt to align comprehensive medical reports to high-level visual features, while fragmenting the report into word-level tokens for local alignment. However, this token-level alignment might compromise the medical context, potentially leading to misalignments. For instance, within the ‘Impressions’ section, terms like ‘compatible’ or ‘acute’ lack direct visual correlates, rendering local alignment potentially ambiguous.
While MedKLIP [29] and KAD [30] utilize domain-specific knowledge from external datasets to enhance textual information extraction, one might argue about their dependence on these external resources for vision-language alignment. Furthermore, Med-UniC [31], which integrates multi-lingual medical data for VLP, aims to analyze and mitigate language biases originating from different communities in the realm of medical VLP. MRM [32] shifts from the alignment task to a reconstruction task that uses masked visual and textual tokens.
These studies enhance the performance of medical VLP in various ways; however, they do not account for a clear distinction between the descriptive and conclusive segments within a medical report. Moreover, the potential similarity inherent in medical data is overlooked during the execution of vision-language alignment, which in turn adversely affects the cross-modal representation learning.
III Method
III-A Overview
Our framework overview is illustrated in Fig. 2. It is composed of a ResNet50 [33] vision encoder, denoted by , followed by a hierarchical aggregation block ; and a BioClinicalBERT [34] text encoder denoted by (as described in Sec. III-C). During the training stage, only and are trained, while is frozen to prevent disturbance from the language side and also minimize the training expense. The proposed framework aims to both optimize the vision-to-vision (V-V) branch between visual features of different views and the vision-to-language (V-L) branch between visual and textual features.
Given a set of image-report pairs , where denote the paired image and text, each report includes two parts: ‘Findings’ and ‘Impressions’, such that can be split into and . Therefore, each image-report pair can be further represented by . For simplicity, unless needed, we omit the subscript in later text.
III-B Semantic Difference in Hierarchical Medical Report
| INDICATION: Patient Name with cough / acute process? |
| FINDINGS: Single frontal view of the chest provided. |
| The cardiomediastinal silhouette is normal. |
| … … |
| No free air below the right hemidiaphragm is seen. |
| IMPRESSIONS: No acute intrathoracic process. |
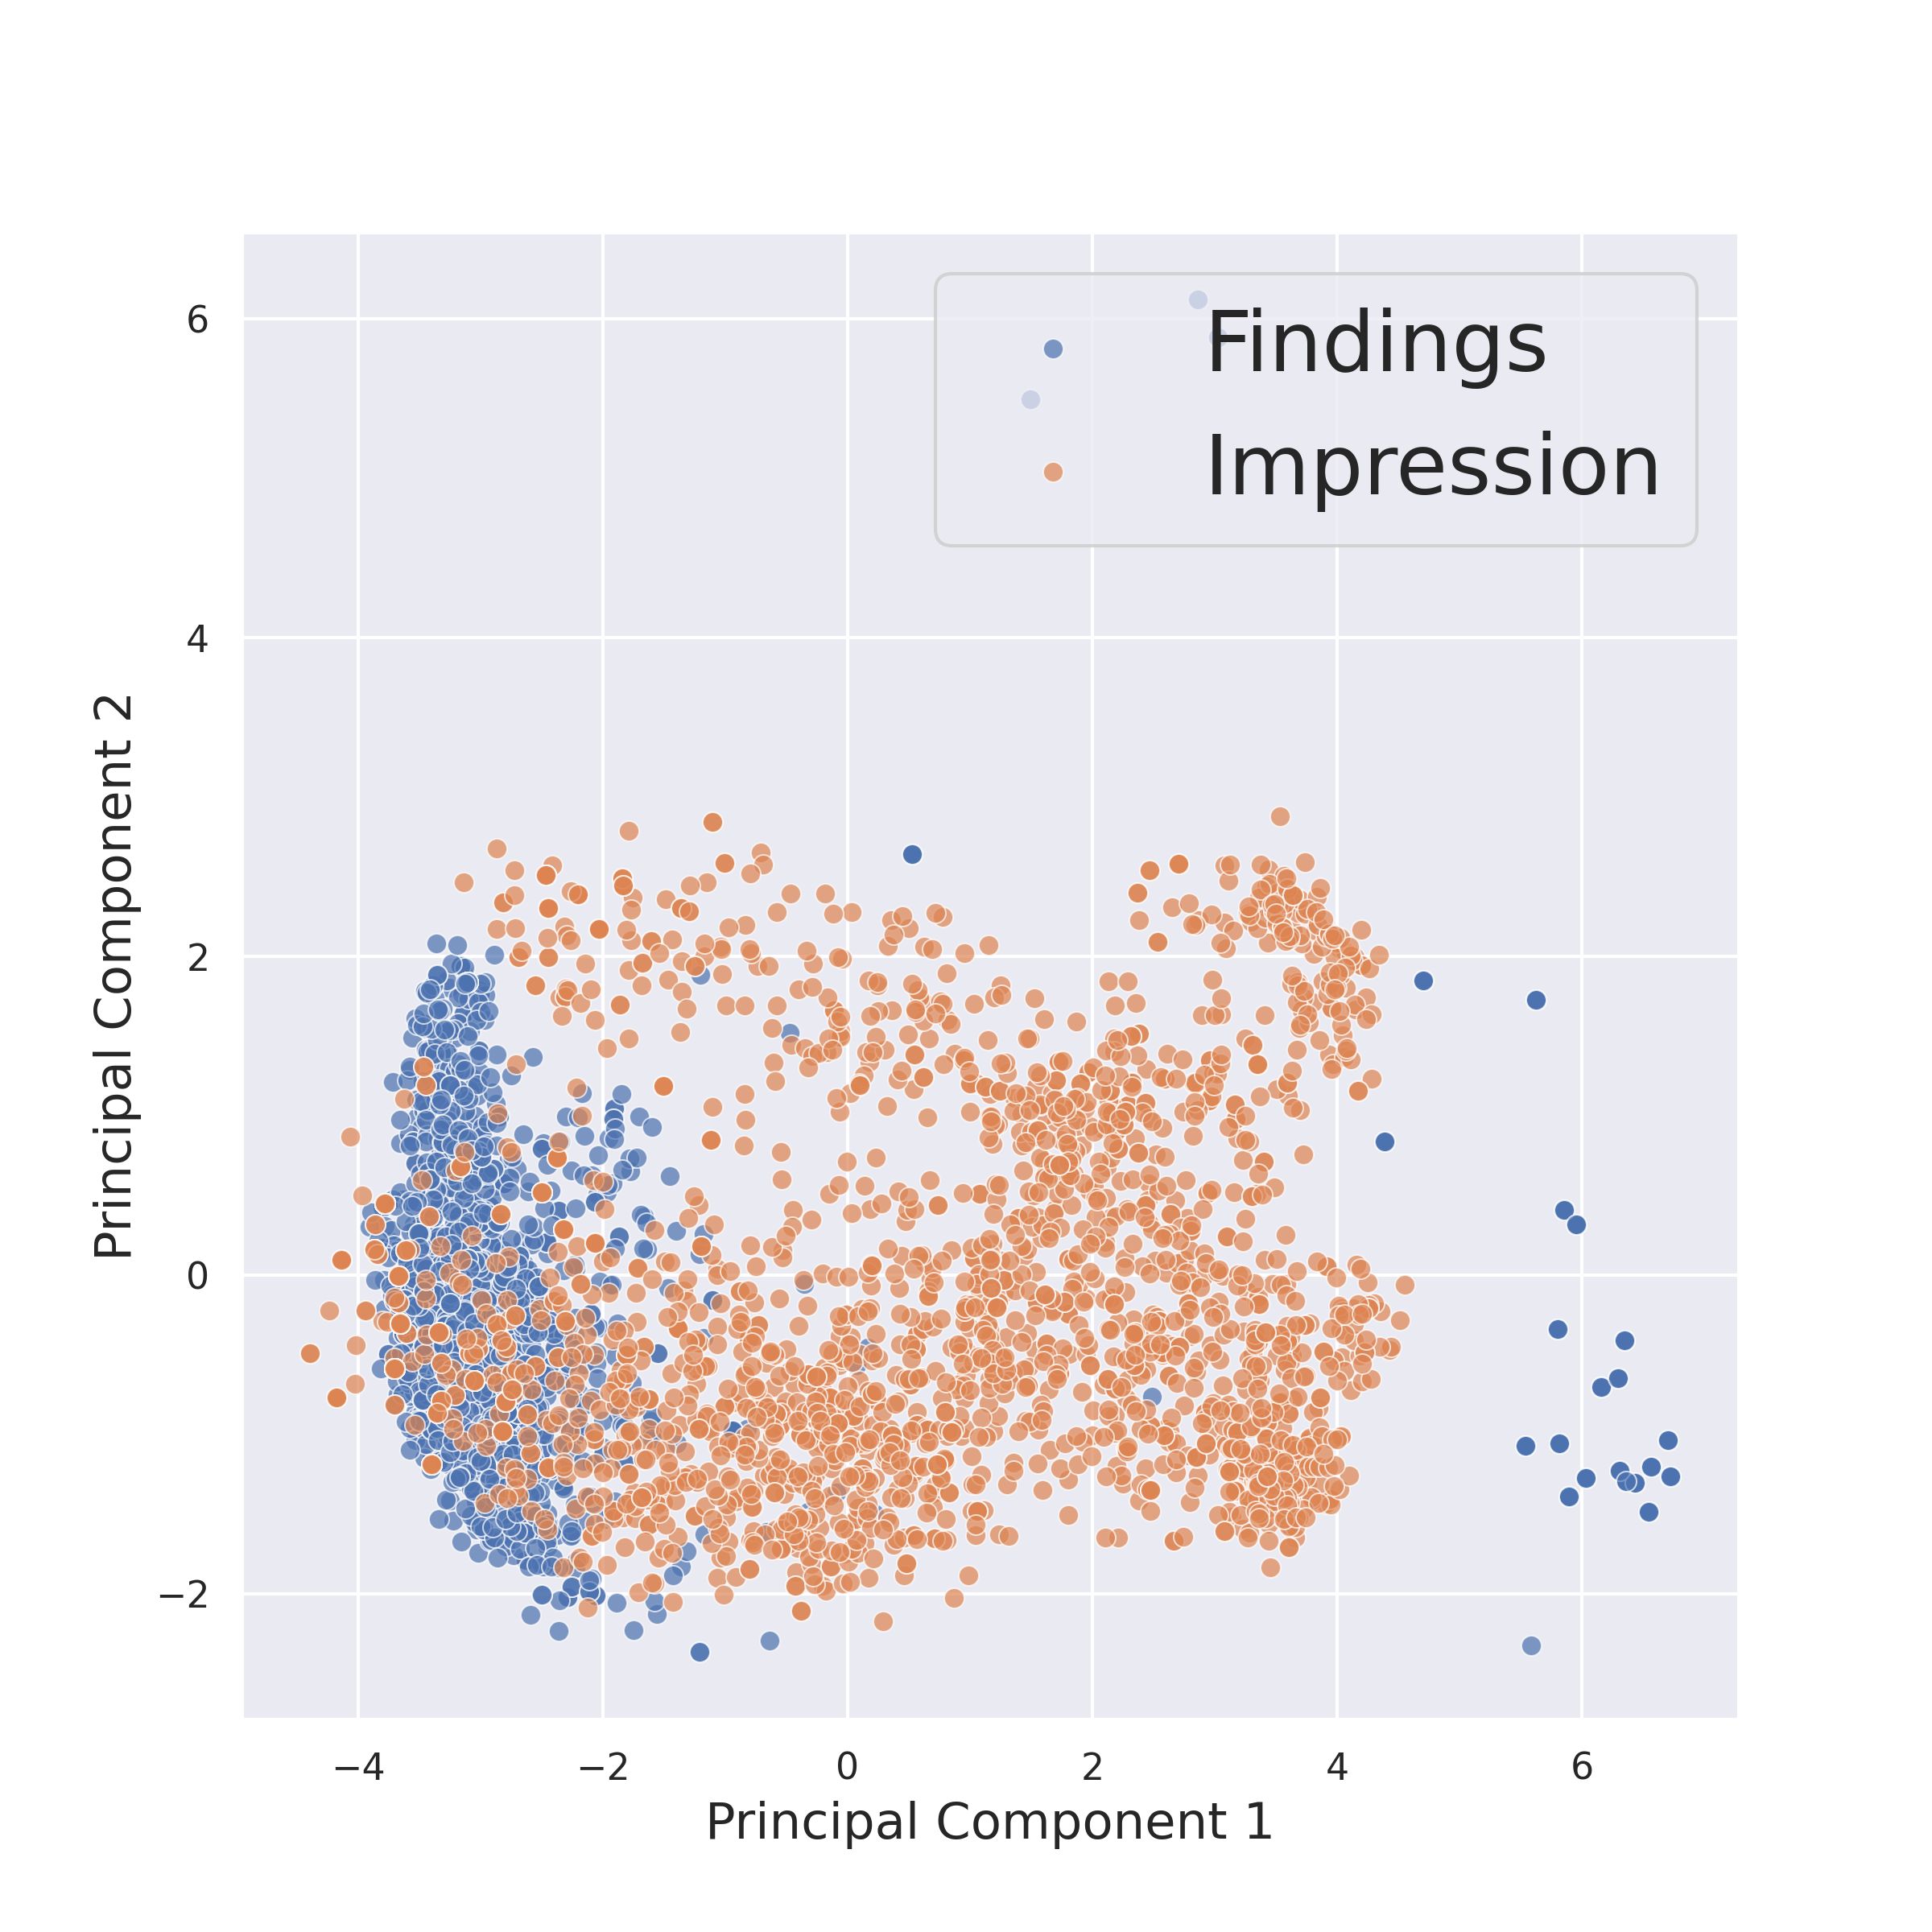
As illustrated in Tab. I, the ‘Findings’ section presents descriptive content, while the ‘Impressions’ section provides a conclusive remark. To graphically observe the semantic distinctions between the two sections, we randomly sample 2,000 medical reports from the MIMIC-CXR dataset [35] and extract the text embedding of the ‘Findings’ and ‘Impressions’ sections following [4] using a pre-trained text encoder. Fig. 3 visualizes the text embeddings using the first two components after applying the principal component analysis (PCA) [36]. As depicted in Fig. 3, the text embeddings corresponding to the ’Findings’ and ’Impressions’ sections demonstrate discernible differences, thereby signaling divergent semantic content between these two sections. Although subtle overlap is observed, this can be attributed to the fact that both sections originate from the same medical report. In light of this, aligning images with entire medical reports runs the risk of introducing misalignment errors. To address this challenge, we devise a sophisticated hierarchical alignment strategy that both mitigates the issue of misalignment and more effectively capitalizes on the inherent hierarchical structure of medical reports.
III-C Hierarchical Vision-Language Alignment
To align visual features separately to the ‘Findings’ and ‘Impressions’ of a medical report, we extract multi-level features from the medical image and develop the hierarchical alignment scheme, which includes the hierarchical feature aggregation and intermediate channel dropping mechanism to make the learning more effective and efficient.
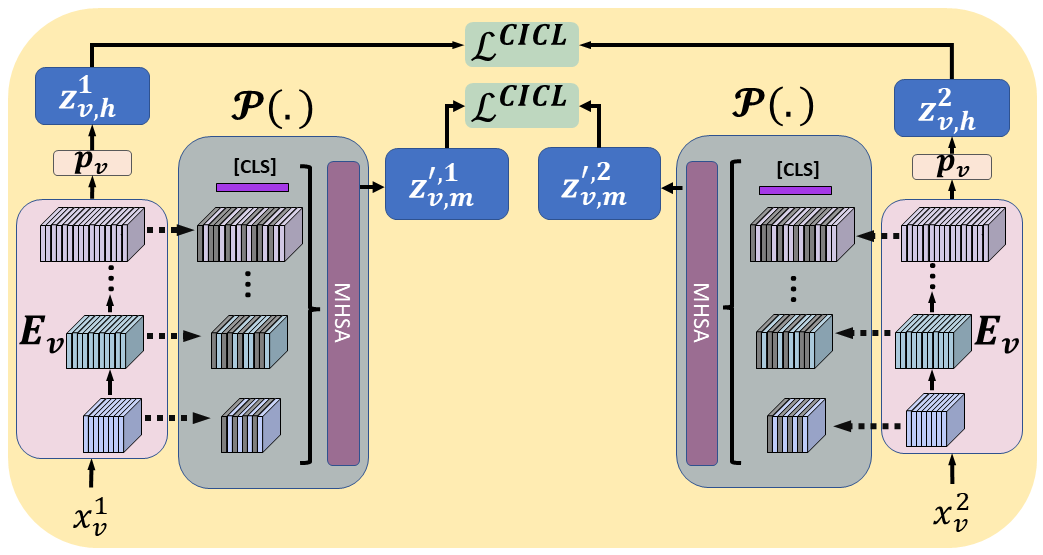
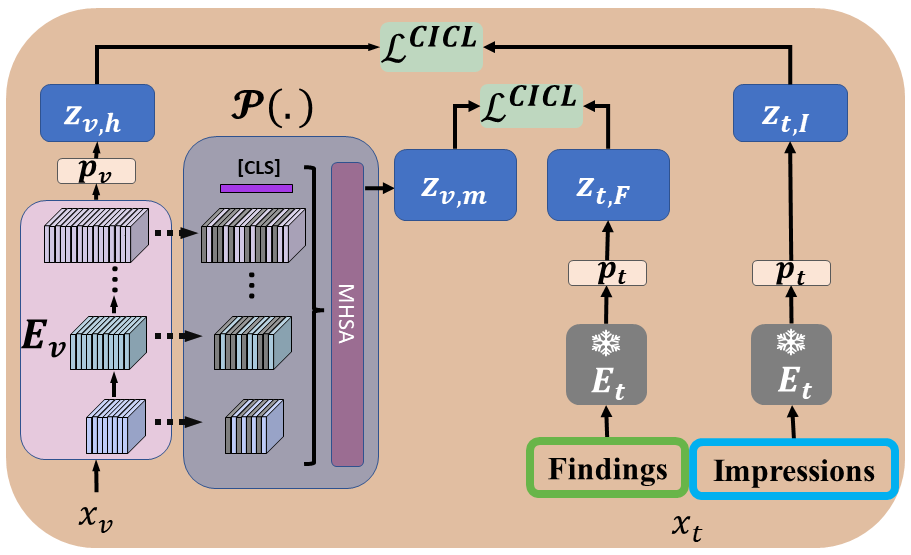
Hierarchical feature aggregation As illustrated in Fig.2, the hierarchical feature aggregation mechanism, , employs multi-head attention (MHSA) [37], positional embedding [37], and a [CLS] token to aggregate diverse feature levels. This architecture is meticulously devised to enhance the understanding of the distinct sections, ‘Findings’ and ‘Impression’, in medical reports. The ‘Findings’ section predominantly reflects low-level image features, e.g., intensity, texture and size, while the ‘Impression’ encapsulates image semantics, e.g., disease and symptom manifestations [35, 38].
In the proposed method, multi-level visual features, extracted from the output of each ResBlock [33] in the vision encoder, are designated as middle-level features, aligning with the detailed nature of the ‘Findings’ section. In contrast, the terminal output from the vision encoder, denoted as , is treated as the high-level visual feature , aligning with the summarization text in the ‘Impressions’ section.
We use to denote the size of visual features from different levels, where and represent the height and width of the feature map, and denotes the number of channels. To standardize the shape of these features, we pool and flatten all feature maps to a size of . Then, we treat these pooled and flattened features as a sequence, which has a shape of . is also the number of tokens of a sequence. To aggregate the sequence visual features, we concatenate a [CLS] token and a positional embedding to the features following [39]. The multi-level features have channel sizes of 256, 512, 1024 and 2048 from the shallower to the deeper blocks, respectively. We introduce an intermediate feature channel dropping scheme to squeeze the numbers of feature channels for them, detailed in the next subsection. Afterward, we concatenate all flattened feature maps with the positional embedding and the [CLS] token. They are embedded using MHSA similar to that in a transformer [37]. To aggregate the sequence, only the [CLS] token embedding from the MHSA output layer is utilized for later alignment.
Intermediate feature channel dropping If the multi-level (middle-level) features are used directly for subsequent alignment via MHSA, there might be a significant increase in computational cost. This is because the computational complexity is for MHSA [37]. Here, represents the total length of the visual feature sequence from all ResBlocks[33]. To alleviate this issue, We propose to randomly drop the feature channels of these middle-level features. The drop ratio is set to for the shallowest level and for the other levels.
Above we have the multi-level visual features ready through the hierarchical feature aggregation module. Below we introduce how to get the high-level visual features, as well as the descriptive and conclusive textual features. We organize the alignment in two branches, i.e., V-L and V-V branches.
V-L branch In the V-L branch, as depicted in Fig. 2c, given the ‘Findings’ and ‘Impressions’ sections of the text report, the text encoder is utilized to extract text embedding correspondingly. Given the medical image, the last layer output of the vision encoder is considered as the high-level visual feature , and the features from intermediate layers of are aggregated and projected to the multi-level visual feature using the above mentioned hierarchical aggregation block . Hence, one image-report pair is embedded to , where the subscripts and denote visual and textual respectively.
V-V branch In the V-V branch, as illustrated in Fig. 2b, we augment each medical image into two different views, and , to promote the learning of invariant image features. The augmentation is implemented following the methods in [3, 4].
Then, the two augmented images are embedded to via .
Finally, each image-report pair is embedded into . Next, we perform hierarchical alignment between these visual and textual features.
Hierarchical feature alignment After obtaining all visual and textual features, we perform the hierarchical alignment by using the clinical-informed contrastive loss (CICL), which includes three parts:
-
•
In the V-L branch, we minimize the CICL between and , and to align the high-level visual feature from the image and the conclusive textual feature from the report.
-
•
In the V-L branch, we minimize the CICL between and , and to align the multi-level visual feature from the image and the descriptive textual feature from the report.
-
•
In the V-V branch, we minimize the CICL between and , and to align the visual features across multiple views.
III-D Clinical-Informed Contrastive loss
Contrastive loss is the most commonly used optimization strategy for VLP [2, 1, 3]. Given the visual and textual features, and , the contrastive loss is defined as below:
| (1) |
where denotes the size of a mini-batch, denote the sample index in the mini-batch. Two trainable non-linear projectors and are utilized to map the visual embedding and the text embedding into the same latent space for the alignment. In our case, we use the to represent visual or textual embedded features:
The similarity of two components is computed as,
| (2) |
where , representing visual or text projectors.
In contrastive learning, sample and sample denote two patients. Although they are two different patients, they may present similar symptoms and in this case, it implies the textual descriptions of their reports will exhibit higher similarity, so as are their CXR images. Conventional approaches [1, 23, 3, 4] do not consider this factor in the alignment and assume that two different patients have dissimilar visual and textual features. Our idea is to leverage the clinical information in the medical report to adaptively adjust the contrastive loss. To do so, we first compute an empirical report correlation matrix :
| (3) |
where denotes the element of the latent code or . is the averaged vector. To avoid ill-defined empirical correlation matrix and centralize the correlation coefficients, we smooth as
| (4) |
where denotes a regularization coefficient, empirically set to 0.2. This hyperparameter is extensive ablated in Sec. IV-D3 and Fig. 4.
The key component of consists of approximating the smoothed text correlation based on the similarity of visual and textual components. We introduce the clinical-informed contrastive loss as
III-E Total Loss
As mentioned in Sec. III-C, is applied different terms in the V-V and V-L branches, leading to the final loss function,
IV Experiments and Analysis
IV-A Vision-Language Pre-training Configuration
Dataset Our method, IMITATE, is pre-trained on the MIMIC-CXR dataset [38, 40]. The preprocessing of this dataset adheres to practice described in [1, 3, 4], including image resizing, pixel value normalization, and text tokenization. To refine the dataset further, lateral views and reports comprising fewer than three tokens were excluded, resulting in a pre-training dataset with image-text pairings for MIMIC-CXR [40].
Implementation The original CXR images from the MIMIC-CXR dataset [40] are resized to and randomly cropped to , following the procedure in [1, 3, 4]. All images are normalized to the range . For data augmentation during pre-training, we apply horizontal flip, random rotation in the range , and auto contrast using the PyTorch vision library111https://pytorch.org/vision/stable/transforms.htmls. We employ BioClinicalBERT [34] to derive text embeddings from medical reports. To conduct a fair comparison with existing methods [1, 3, 4, 30, 29], we utilize the same ResNet50 [33] backbone as our vision encoder. Adhering to practices outlined in [4, 3], the proposed model is pre-trained for 50 epochs. This training utilizes an early stopping strategy and is conducted on 16 A100-40GB GPUs parallel, each handling a batch size of 128. For optimization, we employ the AdamW optimizer, configuring a learning rate of and a weight decay of . Throughout this phase, a combination of a linear warm-up and a cosine annealing scheduler is employed [41].
IV-B Downstream Tasks
We evaluate our framework on five downstream tasks:
Medical Image Linear Classification This task is executed on the CheXpert [42], RSNA [43], and COVIDx [44] datasets. In line with prior research [3, 1, 4], we restrict updates to the parameters of a randomly initialized linear layer designated for classification, keeping the pre-trained vision backbone frozen. Our evaluation metrics comprise the AUC scores (AUC) for CheXpert and RSNA, and accuracy (ACC) for COVIDx, as endorsed by [3, 4].
We freeze our visual backbone and perform fine-tuning only on the final linear layer for 50 epochs with early stopping. The learning rate of 5e-4 is maintained, and a default batch size of 8 is used. Our approach also involves utilizing the AdamW optimizer to manage the learning rate schedule, incorporating a value of 0.9, a value of 0.999, and a weight decay rate of 1e-6.
Medical Image Fine-tuned Classification Following [29, 30], we employ the ChestX-ray14 dataset for our experiments, as originally presented in [45]. This dataset encompasses 112,120 frontal-view X-ray images, obtained from a cohort of 30,805 patients. These images were curated between the years 1992 and 2015 by the National Institutes of Health and were annotated for 14 prevalent diseases. To maintain a consistent evaluation criterion with earlier methods, we utilize the official test set partition as outlined in [29, 30, 45].
During the fine-tuning process, we update all model parameters, including both the backbone structures and the linear classifier. All images are resized to resolution and undergo data augmentation as suggested in [30]. For the optimization, we employ the AdamW optimizer with a learning rate of and a batch size of 64. The number of epochs is set as 50.
Medical Image Semantic Segmentation This task is performed on the RSNA [43] and the SIIM [46] datasets, following the data preprocessing in [4, 3]. Similar to [3, 4], the U-Net [47] fine-tuning settings are adopted for segmentation. All pre-trained models are considered as frozen encoders and only the decoders of U-Net are updated during the fine-tuning. The segmentation performance is evaluated using Dice scores following [3, 4, 29].
Following the preprocessing steps outlined in [3, 4], to generate the segmentation mask for pneumonia regions, we resize all images and masks to , applying the same data augmentation techniques as in [4]. For fine-tuning, we use the AdamW [48] optimizer with a learning rate of and weight decay of , and optimize the segmentation model using a combination with a coefficient set to 10 [4]. We fine-tune the segmentation task for 50 epochs and early stop if the loss does not decrease on the validation set for 10 steps. We use a batch size of 16 for RSNA segmentation and 8 for SIIM segmentation.
Medical Image Object Detection We conduct pneumonia detection on the RSNA dataset [43] and foreign objects detection on the Object-CXR dataset [49], adhering to the preprocessing standards outlined by [4]. Consistent with [4], we employ the YOLOv3 [50] for the detection framework. Within this architecture, our pre-trained vision encoder acts as the backbone, and during fine-tuning, only the detection head is optimized. Evaluation metrics for the detection task are based on the Mean Average Precision (mAP) with IOU thresholds spanning from 0.4 to 0.75.
According to [4], we normalize all pixel intensity of images in RSNA Pneumonia [43] to range [0,1] and do not apply data augmentation during the fine-tuning stage for fair comparison. For all data fractions, the batch size is 16. We choose AdamW [48] as the optimizer with learning rate set to and weight decay of . The detection model is trained for 50 epochs and early stopping is applied when the validation loss does not decrease for 10 steps. Other details follow [4].
Medical Image Zero-shot Image Classification Following [29, 30], we execute this task utilizing RSNA and SIIM datasets [45]. To fairly compare with previous methods, we adopt the official test set split from [29, 30]. To alleviate potential biases stemming from human-crafted prompts, our positive prompts are structured as ’disease’ and negative prompts as ’No disease’. The original image undergoes a two-step process. Firstly, it is resized to dimensions of and then center cropped to . Subsequently, all pixel values are normalized within the range of , following [29, 30]. The resulting resized image is then passed through an image encoder to generate an image embedding . Concurrently, the prompts are inputted into a text encoder to obtain a text embeddings. To evaluate the classification, we measure the cosine similarity between the image and text embeddings for each prompt associated with a specific class. Our results are reported as the macro average of AUC, F1, and ACC scores across the spectrum of all diseases.
All data split information and train/valid/test set details are in Tab. II. For all downstream tasks, except zero-shot classification, we train with of the training set.
| Task | Dataset | Split | Train | Valid | Test |
| Linear Classification | CheXpert [42] | [42] | 186,027 | 5,000 | 202 |
| RSNA [43] | [4, 43] | 16,010 | 5,337 | 5,337 | |
| COVIDx [44] | [4, 44] | 23988 | 5998 | 400 | |
| Semantic Segmentation | RSNA [43] | [3, 4] | 16,010 | 5,337 | 5,337 |
| SIIM [46] | [3, 4] | 8,433 | 1,807 | 1,807 | |
| Object Detection | RSNA [43] | [3, 4] | 16,010 | 5,337 | 5,337 |
| Object-CXR [49] | [4] | 6,400 | 1,600 | 1,000 | |
| Fine-grained Classification | ChestX-ray14 [45] | [30] | 77,872 | 8,652 | 25,596 |
| Zero-shot Classification | RSNA [43] | [29] | / | / | 5,337 |
| SIIM [46] | [29] | / | / | 1,807 |
IV-C Results
In this section, we evaluate the performance of our method on five downstream tasks regarding medical images, in comparison to 8 SOTA medical VLP methods.
IV-C1 Medical Image Linear Classification
To assess the quality of the visual representation derived from IMITATE, we employ linear classification as described in [51, 52, 4]. Our evaluations span three CXR image datasets: CheXpert [42], RSNA [43], and COVIDx [53]. The results, depicted in Tab. III, showcase the results achieved in the supervised image linear classification task [3, 4]. Evidently, IMITATE consistently eclipses competing methodologies across all three datasets and their respective data fractions. It is worth noting that despite MedKLIP [29] incorporating extra annotated data with disease-level annotations during its VLP stage, IMITATE continually outperforms MedKLIP [29] in all datasets and experimental settings. This underscores the potency of IMITATE in enhancing disease prediction.
| CheXpert (AUC) | RSNA (AUC) | COVIDx (ACC) | |||||||
| Method | 1% | 10% | 100% | 1% | 10% | 100% | 1% | 10% | 100% |
| Random Init | 56.1 | 62.6 | 65.7 | 58.9 | 69.4 | 74.1 | 50.5 | 60.3 | 70.0 |
| ImageNet Init | 74.4 | 79.7 | 81.4 | 74.9 | 74.5 | 76.3 | 64.8 | 78.8 | 86.3 |
| ConVIRT [1] | 85.9 | 86.8 | 87.3 | 77.4 | 80.1 | 81.3 | 72.5 | 82.5 | 92.0 |
| GLoRIA [3] | 86.6 | 87.8 | 88.1 | 86.1 | 88.0 | 88.6 | 67.3 | 77.8 | 89.0 |
| GLoRIA-MIMIC [3] | 87.1 | 88.7 | 88.0 | 87.0 | 89.4 | 90.2 | 66.5 | 80.5 | 88.8 |
| MGCA [4] | 87.6 | 88.0 | 88.2 | 88.6 | 89.1 | 89.9 | 72.0 | 83.5 | 90.5 |
| MRM [32] | 88.5 | 88.5 | 88.7 | 91.3 | 92.7 | 93.3 | 66.9 | 79.3 | 90.8 |
| MedKLIP⋆ [54] | 86.2 | 86.5 | 87.7 | 87.3 | 88.0 | 89.3 | 74.5 | 85.2 | 90.3 |
| IMITATE | 89.1 | 89.5 | 89.7 | 91.7 | 92.9 | 93.5 | 76.8 | 87.6 | 93.1 |
IV-C2 Medical Image Fine-tuned Classification
In a comprehensive evaluation of various medical VLP methods on the ChestX-ray14 dataset [45], we evaluate the performance of our proposed approach, IMITATE, in fine-grained classification tasks and present the results in Tab. IV. The assessment metrics included AUC scores for 14 individual diseases and a macro-averaged mean AUC.
IMITATE consistently excels across all evaluated subsets of training data, specifically 1%, 10%, and 100%. This superior performance is perhaps due to its innovative VLP strategy: hierarchical alignment with different sections of medical reports. This feature allows IMITATE to learn multi-level knowledge during pre-training, thereby considerably enhancing its effectiveness in fine-grained classification tasks. Notably, even when compared with methods like MedKLIP [29] and KAD [30], which use additional annotated data for pre-training, IMITATE maintains a significant lead in both the mean and disease-specific AUC scores.
As the fraction of training data increases, all methods generally improve. However, IMITATE consistently ranks highest, emphasizing its potential for more accurate disease diagnosis.
|
Training data fraction |
Method |
Mean |
Atelectasis |
Cardiomegaly |
Effusion |
Infiltration |
Mass |
Nodule |
Pneumonia |
Pneumothorax |
Consolidation |
Edema |
Emphysema |
Fibrosis |
Pleural Thicken |
Hernia |
| Random | 58.1 | 55.7 | 57.7 | 63.6 | 61.6 | 55.0 | 60.2 | 57.1 | 58.2 | 60.8 | 63.3 | 53.4 | 63.7 | 56.8 | 46.0 | |
| ImageNet | 63.5 | 66.2 | 64.2 | 72.1 | 57.0 | 59.0 | 58.5 | 60.0 | 62.6 | 62.4 | 66.8 | 61.5 | 70.7 | 63.1 | 64.5 | |
| ConVIRT | 64.9 | 66.0 | 78.2 | 78.9 | 61.1 | 59.6 | 65.5 | 60.8 | 68.8 | 65.7 | 60.7 | 65.8 | 68.0 | 62.7 | 46.6 | |
| GLoRIA | 59.7 | 59.7 | 56.7 | 74.1 | 64.6 | 55.9 | 55.7 | 61.1 | 60.7 | 66.5 | 66.9 | 55.0 | 55.8 | 59.2 | 43.6 | |
| BioViL | 57.9 | 55.5 | 56.4 | 72.2 | 65.0 | 56.7 | 54.6 | 62.6 | 56.0 | 65.7 | 68.1 | 51.6 | 51.3 | 59.2 | 36.0 | |
| MedKLIP⋆ | 60.9 | 65.5 | 59.0 | 74.5 | 64.3 | 55.0 | 61.1 | 60.9 | 59.9 | 65.9 | 68.2 | 53.5 | 64.8 | 59.3 | 40.0 | |
| KAD⋆ | 78.7 | 77.0 | 88.2 | 82.9 | 69.2 | 75.1 | 69.7 | 73.5 | 86.1 | 72.7 | 81.3 | 89.3 | 74.3 | 69.2 | 93.8 | |
| IMITATE | 80.2 | 79.6 | 89.5 | 83.2 | 70.5 | 77.4 | 71.9 | 74.8 | 87.6 | 73.7 | 82.4 | 90.5 | 75.8 | 71.3 | 94.6 | |
| Random | 69.1 | 68.2 | 76.6 | 74.6 | 67.4 | 62.3 | 58.0 | 63.6 | 72.8 | 67.8 | 78.0 | 64.7 | 71.5 | 65.3 | 77.1 | |
| ImageNet | 72.6 | 70.9 | 79.8 | 76.9 | 68.4 | 69.3 | 65.6 | 63.0 | 79.3 | 67.1 | 76.7 | 74.9 | 72.9 | 71.1 | 81.0 | |
| ConVIRT | 77.1 | 74.0 | 84.3 | 81.1 | 69.3 | 74.8 | 70.0 | 67.1 | 82.8 | 70.1 | 81.4 | 87.1 | 76.7 | 71.9 | 89.3 | |
| GLoRIA | 74.3 | 72.1 | 80.8 | 80.0 | 68.7 | 73.3 | 67.5 | 65.8 | 77.9 | 67.6 | 79.7 | 79.9 | 78.7 | 69.3 | 78.7 | |
| BioViL | 72.7 | 70.3 | 78.5 | 79.0 | 66.6 | 71.8 | 67.1 | 66.5 | 76.7 | 68.4 | 79.9 | 76.1 | 74.8 | 65.3 | 76.3 | |
| MedKLIP⋆ | 74.8 | 72.9 | 80.2 | 79.3 | 69.8 | 71.9 | 68.1 | 66.6 | 79.6 | 69.6 | 81.1 | 79.5 | 75.6 | 71.3 | 81.9 | |
| KAD⋆ | 80.7 | 77.6 | 88.9 | 83.3 | 71.8 | 78.3 | 71.9 | 73.7 | 87.2 | 75.0 | 83.3 | 90.3 | 80.7 | 72.3 | 95.3 | |
| IMITATE | 82.2 | 78.8 | 90.3 | 84.6 | 73.2 | 80.6 | 73.8 | 75.3 | 88.8 | 76.7 | 84.3 | 91.5 | 82.6 | 73.9 | 97.4 | |
| Random | 79.0 | 75.0 | 87.9 | 81.5 | 69.1 | 79.8 | 72.6 | 70.3 | 82.6 | 73.1 | 83.9 | 83.5 | 80.7 | 75.4 | 90.3 | |
| ImageNet | 80.4 | 76.3 | 86.7 | 82.3 | 69.3 | 82.3 | 76.3 | 71.9 | 84.0 | 73.7 | 84.2 | 89.3 | 81.9 | 77.0 | 89.9 | |
| ConVIRT | 80.8 | 77.1 | 86.7 | 82.5 | 70.3 | 81.8 | 76.1 | 72.2 | 85.7 | 74.7 | 85.4 | 90.1 | 80.9 | 77.1 | 90.9 | |
| GLoRIA | 80.0 | 76.0 | 85.5 | 81.8 | 70.0 | 81.4 | 74.9 | 71.5 | 82.8 | 73.9 | 83.2 | 88.7 | 81.3 | 76.7 | 92.1 | |
| BioViL | 80.0 | 76.5 | 87.1 | 82.4 | 69.7 | 81.9 | 75.2 | 71.0 | 84.5 | 74.2 | 84.2 | 87.1 | 82.1 | 75.9 | 88.8 | |
| MedKLIP⋆ | 80.1 | 76.4 | 84.9 | 82.3 | 69.7 | 82.0 | 74.7 | 71.2 | 83.9 | 75.1 | 84.8 | 87.9 | 81.7 | 77.7 | 89.2 | |
| KAD⋆ | 82.5 | 78.5 | 89.7 | 84.0 | 71.3 | 83.6 | 77.1 | 74.0 | 87.4 | 75.3 | 86.0 | 91.6 | 82.9 | 77.8 | 96.1 | |
| IMITATE | 83.9 | 80.9 | 91.1 | 85.3 | 72.5 | 83.9 | 78.5 | 76.8 | 88.7 | 76.2 | 88.6 | 92.4 | 83.4 | 78.9 | 98.2 |
IV-C3 Semantic Segmentation and Object Detection
As demonstrated in Tab. V, IMITATE consistently exhibits superior performance compared to all SOTA methods across various data fractions in all four tasks. Remarkably, IMITATE achieves a Dice score of 70.5% on RSNA segmentation with only 1% data fine-tuning, surpassing the performance of all other SOTA methods fine-tuned on 100% data except for MedKLIP [29]. Moreover, when fine-tuning with just 1% of data, IMITATE achieves a 3.9% mAP on the Object-CXR dataset. In contrast,other methods struggle to even touch a 1% mAP under the same data fraction.
The remarkable enhancements achieved by IMITATE across diverse downstream tasks underscore the advantages of leveraging hierarchical alignment with structured medical reports during pre-training. This approach yields more informed and general medical representations that are better suited for a wide range of downstream applications beyond high-level tasks.
| Semantic Segmentation (Dice) | Object Detection (mAP) | |||||||||||
| SIIM | RSNA | RSNA | Object CXR | |||||||||
| Method | 1% | 10% | 100% | 1% | 10% | 100% | 1% | 10% | 100% | 1% | 10% | 100% |
| Random | 9.0 | 28.6 | 54.3 | 6.9 | 10.6 | 18.5 | 1.0 | 4.0 | 8.9 | - | 0.5 | 4.4 |
| ImageNet | 10.2 | 35.5 | 63.5 | 34.8 | 39.9 | 64.0 | 3.6 | 8.0 | 15.7 | - | 2.9 | 8.3 |
| ConVIRT[1] | 25.0 | 43.2 | 59.9 | 55.0 | 67.4 | 67.5 | 8.2 | 15.6 | 17.9 | - | 8.6 | 15.9 |
| GLoRIA[3] | 35.8 | 46.9 | 63.4 | 59.3 | 67.5 | 67.8 | 9.8 | 14.8 | 18.8 | - | 10.6 | 15.6 |
| GLoRIA-MIMIC [3] | 37.4 | 57.1 | 64.0 | 60.3 | 68.7 | 68.3 | 11.6 | 16.1 | 24.8 | - | 8.90 | 16.6 |
| MGCA [4] | 49.7 | 59.3 | 64.2 | 63.0 | 68.3 | 69.8 | 12.9 | 16.8 | 24.9 | - | 12.1 | 19.2 |
| MedKLIP⋆ [54] | 50.2 | 60.8 | 63.9 | 66.2 | 69.4 | 71.9 | 8.9 | 16.3 | 24.5 | - | 7.1 | 11.6 |
| IMITATE | 53.9 | 61.7 | 64.5 | 70.5 | 71.4 | 73.8 | 15.3 | 19.7 | 26.4 | 3.9 | 12.7 | 20.3 |
IV-C4 Zero-shot Image Classification
In order to assess the efficacy of VLP in establishing connections between vision and language, we conduct zero-shot classification experiments on RSNA and SIIM datasets [43, 46]. The results for both datasets are presented in Tab. VI. IMITATE surpasses other SOTA methods in three average metrics and performs well on both datasets. This outcome underscores the efficacy of IMITATE in the vision-language task.
| Dataset | RSNA | SIIM | ||||
| Methods | AUC(%) | F1(%) | ACC(%) | AUC(%) | F1(%) | ACC(%) |
| ConVIRT [1] | 80.4 | 58.4 | 76.1 | 64.3 | 43.3 | 57.0 |
| GLoRIA [3] | 71.5 | 49.0 | 71.3 | 53.4 | 38.2 | 40.5 |
| BioViL [55] | 82.8 | 58.3 | 76.7 | 70.8 | 48.6 | 69.1 |
| CheXzero⋆ [56] | 85.8 | 62.1 | 79.4 | 68.8 | 47.0 | 54.7 |
| MedKLIP⋆ [29] | 86.9 | 63.4 | 80.0 | 89.2 | 68.3 | 84.3 |
| IMITATE | 87.5 | 64.6 | 81.3 | 89.9 | 69.1 | 85.2 |
IV-D Ablation Studies
IV-D1 Improvement of Hierarchical Alignment
We first investigate the effect of hierarchical alignment on pre-training. We conduct pre-training with various loss combinations. As indicated in Tab. VII, only aligning high-level features in V-V or V-L branch leads to poor performance, while IMITATE consistently improves results across all four datasets. Additionally, we observe that hierarchical alignment in the V-L branch produces better outcomes than hierarchical alignment in the V-V branch. This suggests that hierarchical alignment is more advantageous to vision-language than vision-vision contrasting. Combining all losses yields consistently superior results, indicating that joint hierarchical vision-vision and vision-language alignments are beneficial for VLP.
| CheXpert | SIIM | RSNA | ChestXray-14 | |
| AUC(%) | Dice(%) | mAP(%) | AUC(%) | |
| 1% | 1% | 1% | 1% | |
| VVH | 87.5 | 32.1 | 7.6 | 64.5 |
| VVH,VLH | 88.4 | 35.4 | 8.5 | 67.2 |
| VVH,VLH,VVM | 88.7 | 37.3 | 12.1 | 73.4 |
| VVH,VLH,VLM | 88.8 | 38.2 | 12.6 | 74.6 |
| IMITATE | 89.1 | 53.9 | 15.3 | 80.2 |
IV-D2 Alignment with different Parts of Medical Reports
After showing the importance of hierarchical vision-language alignment, we experiment with structured reports to study the effect of report hierarchy on hierarchical alignment. The results of IMITATE aligned with different parts of reports during pre-training are presented in Tab. VIII. Notably, pre-training IMITATE with hierarchical medical reports yields the highest performance across four tasks. This outcome underscores the efficacy of aligning with various report segments based on their inherent structure.
On the contrary, the lowest performance is observed when aligning the reversed target, implying the alignment of high-level visual features with the ‘Findings’ section and middle-level features with the ‘Impressions’ section. In contrast, aligning solely with the ‘Impression’ section and concatenating ‘Findings’ and ‘Impressions’ as the vision-language alignment target do not show any significant improvements due to the ambiguity arising from the absence of the medical reports hierarchy. This is likely due to the ambiguity stemming from the absence of the hierarchical structure in medical reports.
| CheXpert | SIIM | RSNA | ChestXray-14 | |
| AUC(%) | Dice(%) | mAP(%) | AUC(%) | |
| 1% | 1% | 1% | 1% | |
| Imp | 87.5 | 33.6 | 12.2 | 77.5 |
| Find&Imp | 88.2 | 35.4 | 13.4 | 78.4 |
| reversed | 83.4 | 29.8 | 12.7 | 67.6 |
| IMITATE | 89.1 | 53.9 | 15.3 | 80.2 |
IV-D3 Impact of Clinical-Informed Contrastive Loss
In this section, we investigate the impact of and different smooth kernels with on the effectiveness of IMITATE. The outcomes are presented in Tab. IX.
Clinical-Informed Contrastive Loss We observe a significant reduction of performance when using instead of in contrastive learning. This indicates that the clinical prior is a crucial component when using .
Smooth Kernel Furthermore, we evaluate the results for various smooth kernels in Eq. (4) and find that the smoothed Exponential kernel outperforms the others, as shown in Tab. IX. The Gaussian and Laplacian kernels convert negative correlation coefficients to positive values, which can disrupt prior knowledge. The Sigmoid kernel preserves the coefficient range in but may lead to strong penalization during pre-training, resulting in substandard performance. Gaussian, Laplacian, and Sigmoid kernels all exhibited poorer results than the smoothed Exponential kernel (Eq. (4)), which shrinks the coefficient range but does not convert negative values to positive ones, thereby preserving most prior knowledge and leading to superior performance.
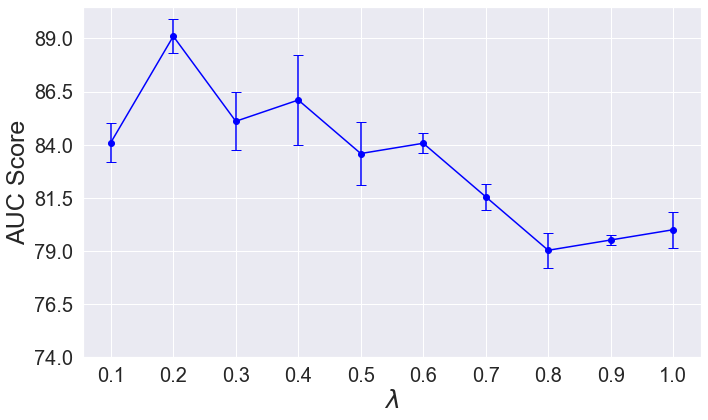
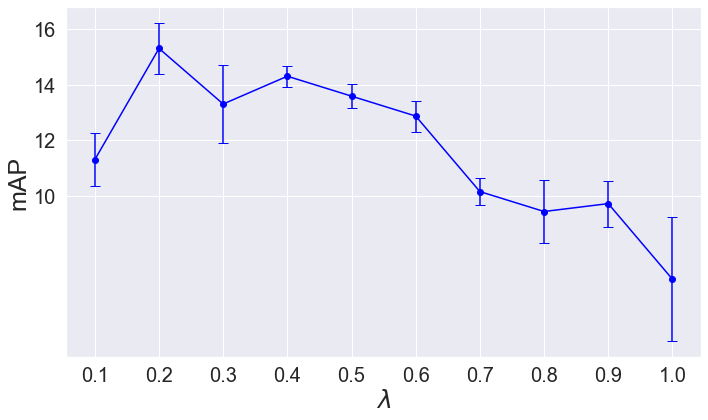
Hyperparameter Sensitivities Analysis We evaluate the sensitivity of pre-training to different values of on various downstream tasks. As shown in Fig. 4, all pre-trained models with outperform the best baseline on three downstream tasks, while led to worse performance. It is crucial to note that excessive values of can lead to bias due to the lack of control over the prior knowledge. Therefore, our framework’s performance is stable for various downstream tasks when the strength of is constrained to a small range. This finding suggests that the strength of clinical prior knowledge should be controlled within a certain range since the reports’ correlation should only be considered as a weak constraint.

| CheXpert | SIIM | RSNA | ChestXray-14 | |
| AUC(%) | Dice(%) | mAP(%) | AUC(%) | |
| 1% | 1% | 1% | 1% | |
| w/o | 87.9 | 26.8 | 11.5 | 78.6 |
| Gaussian | 86.5 | 32.1 | 10.7 | 75.1 |
| Laplacian | 87.1 | 31.7 | 11.4 | 75.7 |
| Sigmoid | 85.7 | 30.2 | 10.9 | 75.2 |
| IMITATE | 89.1 | 53.9 | 15.3 | 80.2 |
IMITATE compared with unfrozen variants Tab. III,IV,V present the performance of all downstream tasks when using IMITATE pre-trained with a frozen language model. In this section, we sequentially unfreeze the last six layers of the language model to evaluate the effectiveness of the trainable language model on downstream tasks for four datasets. The outcomes are reported in Tab. X. We observed that the performance did not improve as we increased the number of unfrozen layers, while the training cost increased. This suggests that the trainable language model could be ablated to reduce training costs significantly. Furthermore, using a frozen language model can alleviate perturbations to visual feature learning from language embeddings.
| Trainable | CheXpert | SIIM | RSNA | ChestXray-14 | |
| Parameters (M) | AUC(%) | Dice(%) | mAP(%) | AUC(%) | |
| 1% | 1% | 1% | 1% | ||
| 59.1 | 87.2 | 45.3 | 13.7 | 78.7 | |
| 66.1 | 87.8 | 50.5 | 14.6 | 77.9 | |
| 73.2 | 88.5 | 47.4 | 14.8 | 78.4 | |
| 80.3 | 88.2 | 50.9 | 15.1 | 79.6 | |
| 87.4 | 88.8 | 45.7 | 14.2 | 78.1 | |
| 94.4 | 88.4 | 37.5 | 14.3 | 78.5 | |
| IMITATE | 51.9 | 89.1 | 53.9 | 15.3 | 80.2 |
IV-E Visualizing Qualitative Results
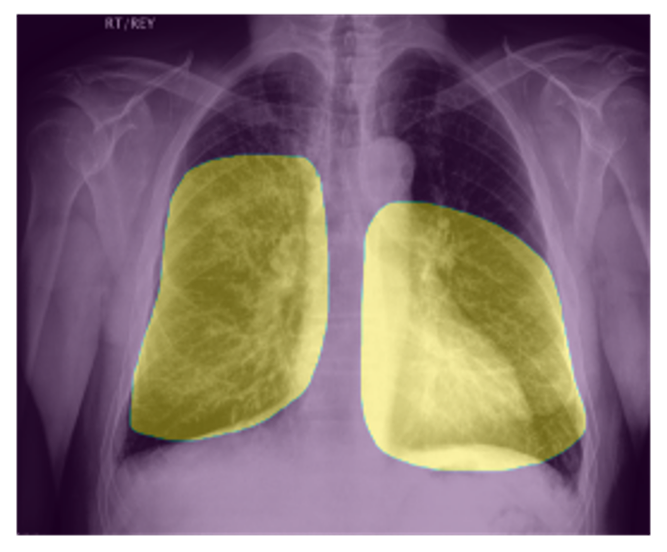
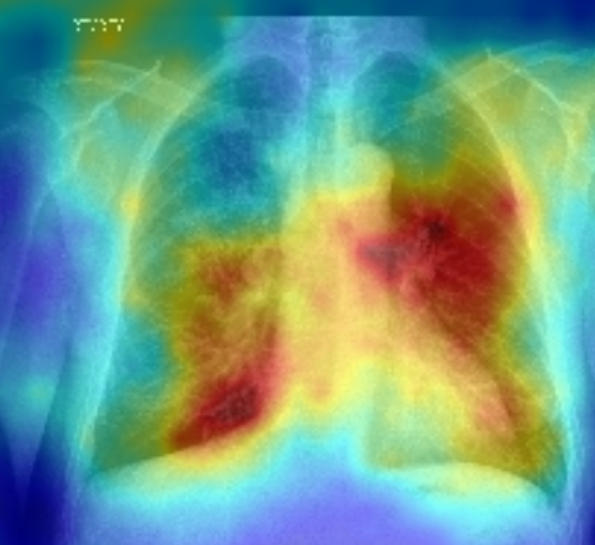
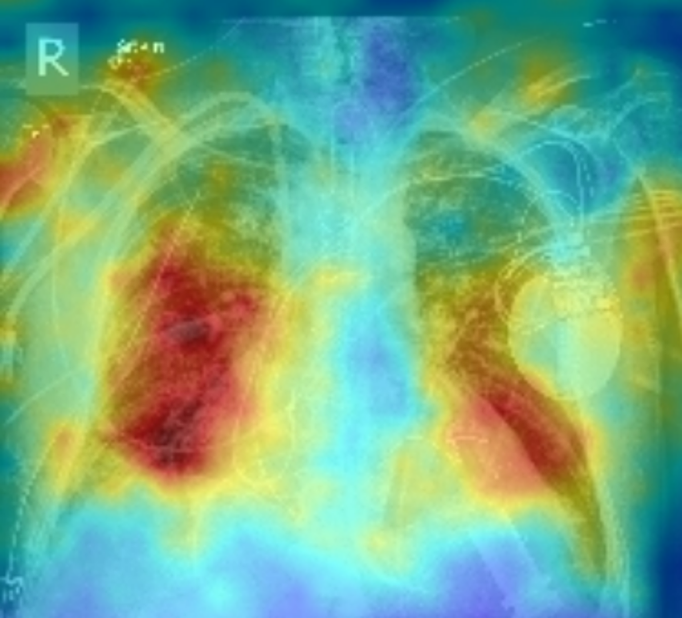
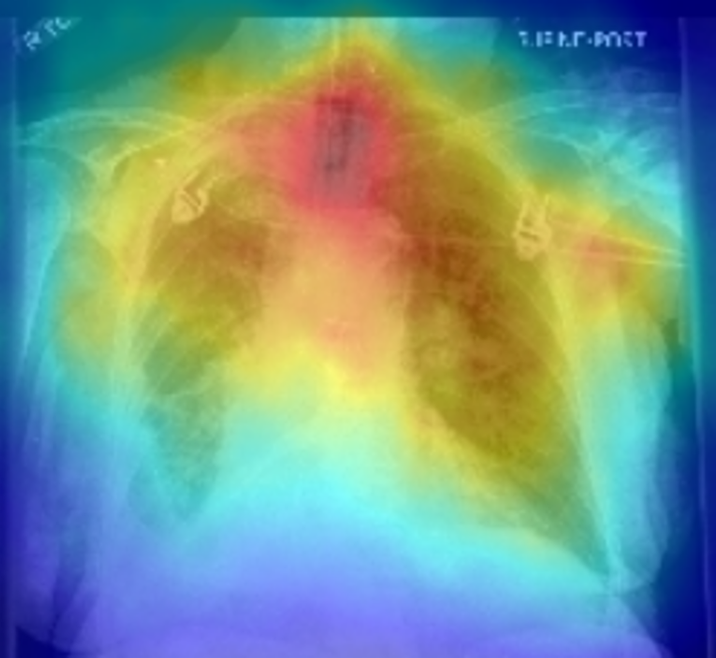
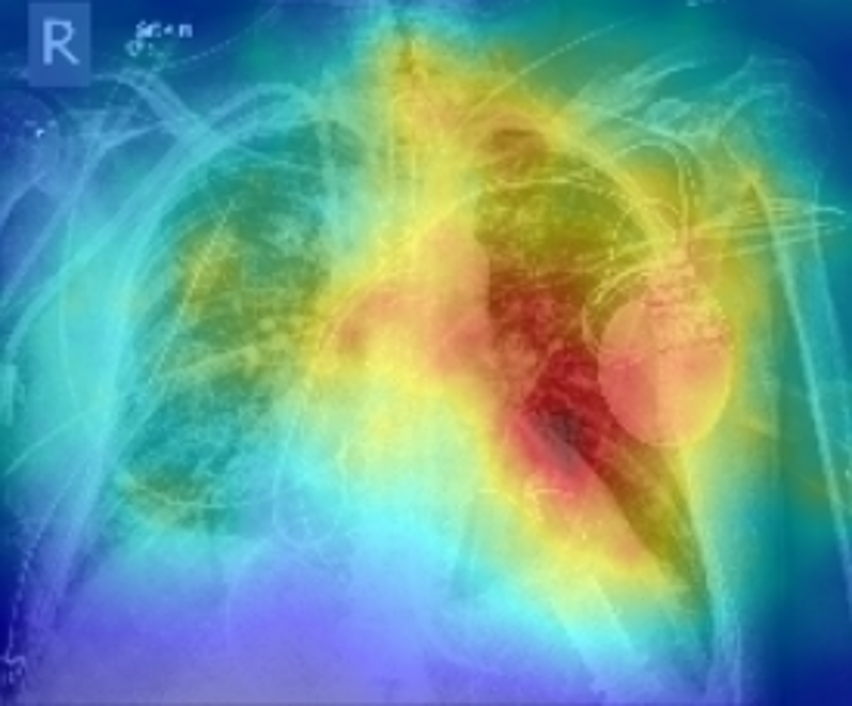
To delve deeper into the learned visual knowledge from IMITATE, we utilized Grad-CAM [57] to produce saliency maps for CXR images derived from the model in its pre-trained state. We select two CXR images showcasing two prevalent diseases, Edema and Lung Opacity. Notably, each of these images comes with ground truth annotation pinpointing the region of concern, as documented in [58]. As evident from Fig. 5, IMITATE boasts an impressive capability to accurately delineate the clinical regions of concern in the CXR images, outperforming its counterpart MGCA [4]. This is particularly noteworthy considering that IMITATE achieves this precision without relying on any external prompts or the need for additional model fine-tuning.

V Conclusion and Discussion
This study introduces a novel VLP framework that imitates the human understanding of paired image-text in a hierarchical manner. This framework, named IMITATE, aligns CXR images and hierarchical medical reports at multiple levels. IMITATE utilizes hierarchical alignment and different parts of medical reports to enhance image representation by incorporating hierarchical information from medical report structures. Notably, this operation requires no additional data or manual pre-processing. Moreover, we propose Clinical-Informed Contrastive Loss, which explicitly integrates clinical prior knowledge through smoothed medical report correlation.
To best of our knowledge, IMITATE is the first framework to align hierarchical information from structured medical reports to multi-level visual features in medical images. Furthermore, we incorporate the clinical similarity into the contrastive loss. These contributions address a critical limitation in existing VLP approaches that ignore clinical similarity among patients. Furthermore, hierarchical alignment and provide more reasonable learning targets for the visual modality, resulting in significant improvements in the performances of all downstream tasks with a 50% reduction in trainable parameters compared to other SOTA methods. We believe that this framework will benefit the medical domain, as hierarchical medical report generation is a standard procedure without extra cost. Additionally, it will inspire the general VLP domain, as hierarchical information commonly exists worldwide, such as title and content, caption, and description, among others.
References
- [1] Y. Zhang, H. Jiang, Y. Miura, C. D. Manning, and C. P. Langlotz, “Contrastive learning of medical visual representations from paired images and text,” arXiv preprint arXiv:2010.00747, 2020.
- [2] A. Radford et al., “Learning transferable visual models from natural language supervision,” in International Conference on Machine Learning. PMLR, 2021, pp. 8748–8763.
- [3] S.-C. Huang, L. Shen, M. P. Lungren, and S. Yeung, “Gloria: A multimodal global-local representation learning framework for label-efficient medical image recognition,” in Proceedings of the IEEE/CVF International Conference on Computer Vision, 2021, pp. 3942–3951.
- [4] F. Wang, Y. Zhou, S. Wang, V. Vardhanabhuti, and L. Yu, “Multi-granularity cross-modal alignment for generalized medical visual representation learning,” arXiv preprint arXiv:2210.06044, 2022.
- [5] A. Esteva et al., “Deep learning-enabled medical computer vision,” NPJ digital medicine, vol. 4, no. 1, pp. 1–9, 2021.
- [6] J. Chai, H. Zeng, A. Li, and E. W. Ngai, “Deep learning in computer vision: A critical review of emerging techniques and application scenarios,” Machine Learning with Applications, vol. 6, p. 100134, 2021.
- [7] J. Devlin, M.-W. Chang, K. Lee, and K. Toutanova, “Bert: Pre-training of deep bidirectional transformers for language understanding,” arXiv preprint arXiv:1810.04805, 2018.
- [8] C. Liu et al., “M-flag: Medical vision-language pre-training with frozen language models and latent space geometry optimization,” arXiv preprint arXiv:2307.08347, 2023.
- [9] C. Liu, Z. Wan, S. Cheng, M. Zhang, and R. Arcucci, “Etp: Learning transferable ecg representations via ecg-text pre-training,” arXiv preprint arXiv:2309.07145, 2023.
- [10] Y. Chen, C. Liu, W. Huang, S. Cheng, R. Arcucci, and Z. Xiong, “Generative text-guided 3d vision-language pretraining for unified medical image segmentation,” arXiv preprint arXiv:2306.04811, 2023.
- [11] J. Lee et al., “Uniclip: Unified framework for contrastive language-image pre-training,” arXiv preprint arXiv:2209.13430, 2022.
- [12] M. Z. Hossain, F. Sohel, M. F. Shiratuddin, and H. Laga, “A comprehensive survey of deep learning for image captioning,” ACM Computing Surveys (CsUR), vol. 51, no. 6, pp. 1–36, 2019.
- [13] T. Baltrušaitis, C. Ahuja, and L.-P. Morency, “Multimodal machine learning: A survey and taxonomy,” IEEE transactions on pattern analysis and machine intelligence, vol. 41, no. 2, pp. 423–443, 2018.
- [14] J. Lu, D. Batra, D. Parikh, and S. Lee, “Vilbert: Pretraining task-agnostic visiolinguistic representations for vision-and-language tasks,” Advances in neural information processing systems, vol. 32, 2019.
- [15] C. Jia et al., “Scaling up visual and vision-language representation learning with noisy text supervision,” in International Conference on Machine Learning. PMLR, 2021, pp. 4904–4916.
- [16] L. Yuan et al., “Florence: A new foundation model for computer vision,” arXiv preprint arXiv:2111.11432, 2021.
- [17] X. Zhai et al., “Lit: Zero-shot transfer with locked-image text tuning,” in Proceedings of the IEEE/CVF Conference on Computer Vision and Pattern Recognition, 2022, pp. 18 123–18 133.
- [18] J. Li, R. Selvaraju, A. Gotmare, S. Joty, C. Xiong, and S. C. H. Hoi, “Align before fuse: Vision and language representation learning with momentum distillation,” Advances in neural information processing systems, vol. 34, pp. 9694–9705, 2021.
- [19] C. Schuhmann et al., “Laion-400m: Open dataset of clip-filtered 400 million image-text pairs,” arXiv preprint arXiv:2111.02114, 2021.
- [20] ——, “Laion-5b: An open large-scale dataset for training next generation image-text models,” arXiv preprint arXiv:2210.08402, 2022.
- [21] W. Wang et al., “Image as a foreign language: Beit pretraining for all vision and vision-language tasks,” arXiv preprint arXiv:2208.10442, 2022.
- [22] H. Xue et al., “Stare at what you see: Masked image modeling without reconstruction,” arXiv preprint arXiv:2211.08887, 2022.
- [23] N. Mu, A. Kirillov, D. Wagner, and S. Xie, “Slip: Self-supervision meets language-image pre-training,” in European Conference on Computer Vision. Springer, 2022, pp. 529–544.
- [24] Y. Gao, J. Liu, Z. Xu, J. Zhang, K. Li, and C. Shen, “Pyramidclip: Hierarchical feature alignment for vision-language model pretraining,” arXiv preprint arXiv:2204.14095, 2022.
- [25] R. van der Sluijs, N. Bhaskhar, D. Rubin, C. Langlotz, and A. Chaudhari, “Exploring image augmentations for siamese representation learning with chest x-rays,” arXiv preprint arXiv:2301.12636, 2023.
- [26] A. Taleb, C. Lippert, T. Klein, and M. Nabi, “Multimodal self-supervised learning for medical image analysis,” in International Conference on Information Processing in Medical Imaging. Springer, 2021, pp. 661–673.
- [27] A. Yang, A. Miech, J. Sivic, I. Laptev, and C. Schmid, “Zero-shot video question answering via frozen bidirectional language models,” arXiv preprint arXiv:2206.08155, 2022.
- [28] J. Li, D. Li, S. Savarese, and S. Hoi, “Blip-2: Bootstrapping language-image pre-training with frozen image encoders and large language models,” arXiv preprint arXiv:2301.12597, 2023.
- [29] C. Wu, X. Zhang, Y. Zhang, Y. Wang, and W. Xie, “Medklip: Medical knowledge enhanced language-image pre-training,” medRxiv, pp. 2023–01, 2023.
- [30] X. Zhang, C. Wu, Y. Zhang, W. Xie, and Y. Wang, “Knowledge-enhanced visual-language pre-training on chest radiology images,” Nature Communications, vol. 14, no. 1, p. 4542, 2023.
- [31] Z. Wan et al., “Med-unic: Unifying cross-lingual medical vision-language pre-training by diminishing bias,” arXiv preprint arXiv:2305.19894, 2023.
- [32] H.-Y. Zhou, C. Lian, L. Wang, and Y. Yu, “Advancing radiograph representation learning with masked record modeling,” in The Eleventh International Conference on Learning Representations, 2023.
- [33] K. He, X. Zhang, S. Ren, and J. Sun, “Deep residual learning for image recognition,” in Proceedings of the IEEE conference on computer vision and pattern recognition, 2016, pp. 770–778.
- [34] E. Alsentzer et al., “Publicly available clinical bert embeddings,” arXiv preprint arXiv:1904.03323, 2019.
- [35] A. E. Johnson et al., “Mimic-iii, a freely accessible critical care database,” Scientific data, vol. 3, no. 1, pp. 1–9, 2016.
- [36] S. Wold, K. Esbensen, and P. Geladi, “Principal component analysis,” Chemometrics and intelligent laboratory systems, vol. 2, no. 1-3, pp. 37–52, 1987.
- [37] A. Vaswani et al., “Attention is all you need,” Advances in neural information processing systems, vol. 30, 2017.
- [38] A. E. Johnson et al., “Mimic-cxr, a de-identified publicly available database of chest radiographs with free-text reports,” Scientific data, vol. 6, no. 1, pp. 1–8, 2019.
- [39] A. Dosovitskiy et al., “An image is worth 16x16 words: Transformers for image recognition at scale,” arXiv preprint arXiv:2010.11929, 2020.
- [40] A. E. Johnson et al., “Mimic-cxr-jpg, a large publicly available database of labeled chest radiographs,” arXiv preprint arXiv:1901.07042, 2019.
- [41] I. Loshchilov and F. Hutter, “Sgdr: Stochastic gradient descent with warm restarts,” arXiv preprint arXiv:1608.03983, 2016.
- [42] J. Irvin et al., “Chexpert: A large chest radiograph dataset with uncertainty labels and expert comparison,” in Proceedings of the AAAI conference on artificial intelligence, vol. 33, 2019, pp. 590–597.
- [43] G. Shih et al., “Augmenting the national institutes of health chest radiograph dataset with expert annotations of possible pneumonia,” Radiology: Artificial Intelligence, vol. 1, no. 1, p. e180041, 2019.
- [44] L. Wang, Z. Q. Lin, and A. Wong, “Covid-net: A tailored deep convolutional neural network design for detection of covid-19 cases from chest x-ray images,” Scientific reports, vol. 10, no. 1, pp. 1–12, 2020.
- [45] X. Wang, Y. Peng, L. Lu, Z. Lu, M. Bagheri, and R. M. Summers, “Chestx-ray8: Hospital-scale chest x-ray database and benchmarks on weakly-supervised classification and localization of common thorax diseases,” in Proceedings of the IEEE conference on computer vision and pattern recognition, 2017, pp. 2097–2106.
- [46] C. Steven G. Langer, PhD and M. George Shih, MD, “Siim-acr pneumothorax segmentation,” 2019.
- [47] O. Ronneberger, P. Fischer, and T. Brox, “U-net: Convolutional networks for biomedical image segmentation,” in Medical Image Computing and Computer-Assisted Intervention–MICCAI 2015: 18th International Conference, Munich, Germany, October 5-9, 2015, Proceedings, Part III 18. Springer, 2015, pp. 234–241.
- [48] D. P. Kingma and J. Ba, “Adam: A method for stochastic optimization,” arXiv preprint arXiv:1412.6980, 2014.
- [49] J. Healthcare, “Object-cxr-automatic detection of foreign objects on chest x-rays,” 2020.
- [50] J. Redmon and A. Farhadi, “Yolov3: An incremental improvement,” arXiv preprint arXiv:1804.02767, 2018.
- [51] K. He, X. Chen, S. Xie, Y. Li, P. Dollár, and R. Girshick, “Masked autoencoders are scalable vision learners,” in Proceedings of the IEEE/CVF Conference on Computer Vision and Pattern Recognition, 2022, pp. 16 000–16 009.
- [52] G. Alain and Y. Bengio, “Understanding intermediate layers using linear classifier probes,” arXiv preprint arXiv:1610.01644, 2016.
- [53] L. Wang, Z. Q. Lin, and A. Wong, “Covid-net: A tailored deep convolutional neural network design for detection of covid-19 cases from chest x-ray images,” Scientific reports, vol. 10, no. 1, pp. 1–12, 2020.
- [54] C. Wu, X. Zhang, Y. Zhang, Y. Wang, and W. Xie, “Medklip: Medical knowledge enhanced language-image pre-training,” medRxiv, pp. 2023–01, 2023.
- [55] B. Boecking et al., “Making the most of text semantics to improve biomedical vision–language processing,” in European conference on computer vision. Springer, 2022, pp. 1–21.
- [56] E. Tiu, E. Talius, P. Patel, C. P. Langlotz, A. Y. Ng, and P. Rajpurkar, “Expert-level detection of pathologies from unannotated chest x-ray images via self-supervised learning,” Nature Biomedical Engineering, pp. 1–8, 2022.
- [57] R. R. Selvaraju, M. Cogswell, A. Das, R. Vedantam, D. Parikh, and D. Batra, “Grad-cam: Visual explanations from deep networks via gradient-based localization,” in Proceedings of the IEEE international conference on computer vision, 2017, pp. 618–626.
- [58] A. Saporta et al., “Benchmarking saliency methods for chest x-ray interpretation,” Nature Machine Intelligence, vol. 4, no. 10, pp. 867–878, 2022.