Jain and Tripathy \righttitleSubsurface Flows in Active Regions with Peculiar Magnetic Configurations \jnlPage16 \jnlDoiYr2024 \doival10.1017/xxxxx \aopheadtitleProceedings IAU Symposium
Subsurface Flows in Active Regions with Peculiar Magnetic Configurations
Abstract
We present analysis of the evolution of subsurface flows in and around active regions with peculiar magnetic configurations and compare their characteristics with the normal active regions. We also study the zonal and meridional components of subsurface flows separately in different polarity regions separately to better understand their role in flux migration. We use the techniques of local correlation tracking and ring diagrams for computing surface and subsurface flows, respectively. Our study manifests an evidence that the meridional component of the flows near anti-Hale active regions is predominantly equatorward which disagrees with the poleward flow pattern seen in pro-Hale active regions. We also find clockwise or anti-clockwise flows surrounding the anti-Joy active regions depending on their locations in the Southern or Northern hemispheres, respectively.
keywords:
Solar physics, Helioseismology, Solar interior, Solar oscillations, Solar activity, Solar convection zone, Solar active region velocity fields, Solar rotation, Solar meridional circulation1 Introduction
Plasma motion in the convection zone plays a crucial role in the evolution of solar magnetic activity. In particular, the meridional component of the horizontal flow is responsible for redistributing angular momentum and transporting magnetic flux to the poles. It is an important ingredient in the flux-transport dynamo models for determining the duration of the solar cycle, the polar field strength, and the onset time of next solar cycle. Therefore, precise flow measurements are crucial for the better understanding of solar dynamo (Dikpati et al., 2010). Moreover, last two solar minima with extended and exceptionally low magnetic activity have raised new challenges to our understanding of interior dynamics and the magnetic field generation (Jain et al., 2022). Studies suggest that the flows beneath active regions are typically larger than the quiet regions (e.g., Haber et al., 2004; Jain et al., 2015) and in some cases the morphology of the active regions alter flow directions (Komm et al., 2011; González Hernández et al., 2013; Jain et al., 2012, 2017).
The emergence of active regions in each solar cycle is primarily governed by three laws; (i) Spörer’s law postulates the latitude of emerging sunspots that decreases with time as the solar cycle goes forward from mid-latitudes toward the equator (Carrington, 1858), (ii) Hale’s law governs the direction of the polarities in the regions of strong magnetic fields of the Sun (Hale & Nicholson, 1925). At any given time, the ordering of positive or negative polarities within the active regions with respect to the direction of rotation is same in one hemisphere, but it reverses in the other hemisphere. With the onset of a new solar cycle, the polarities flip in both hemispheres, and (iii) Joy’s law defines the latitudinal dependence of the tilt of the bipolar active regions where leading polarity stays closer to the Equator (Hale et al., 1919). While most active regions follow these rules, there are some exceptions and the decay of such regions is believed to have adverse effect on the magnetic flux transportation to the poles and ultimately on the strength of the polar fields. In this paper, we study flows in and around these peculiar active regions.
2 Analysis and Results
High-resolution Dopplergrams from Helioseimic and Magnetic Imager (HMI) onboard Solar Dynamics Observatoty (SDO) at a cadence of 45s are utilized to measure subsurface flows. The Dopplergrams are constructed using observations taken in the 6173.3 Å absorption line in the photosphere with pixel size of 0.5 arcsec. Since HMI Dopplergrams have some known biases, we first correct them for the systematics, e.g., the observer motion and the east-west trends in Doppler velocities. We studied subsurface flows in about 180 active regions consisting of normal and peculiar configurations, here we present the detailed analyses for two active regions with unusual configurations.
2.1 Subsurface flows around anti-Hale NOAA active region 11429
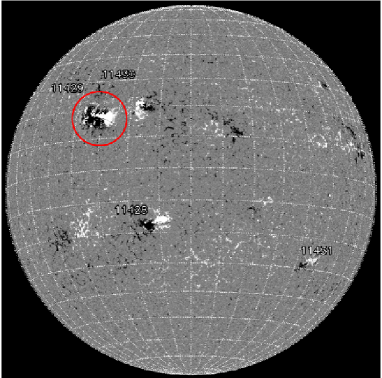
NOAA 11429 was significantly large and magnetically strong active region with sunspot area greater than 1000 micro-Hemi and violated the Hale polarity law during its entire front-disk passage. It appeared on the East limb in Northern hemisphere on 2012-03-03 and crossed the West limb on 2012-03-15. In addition, it had a complex magnetic configuration, , and produced several energetic events, including X5.4-class flare. We studied flows in NOAA 11429 and compared with those in two more regions present at the same time but with Hale-law configuration, i.e., ARs 11430 in the close proximity of NOAA 11429 in the same hemisphere and 11428 in the opposite hemisphere (see Figure 1). This allows us to investigate the similarities as well as differences in flow patterns of active regions possessing different characteristics.
For studying the subsurface flows, we use the local helioseismology technique of ring diagrams (RD; Hill, 1988). In this method, high-degree waves propagating in localized regions over the solar surface are used to obtain an average velocity vector for that region. Here, all three regions are tracked for 1396 minutes (i.e., 1862 HMI Dopplergrams) at the Synodgrass tracking rate and remapped, where each active region is centered on a 13∘ 13∘ tile. A 3-D FFT is applied in both spatial and temporal directions to obtain the power spectrum which is fitted to a Lorentzian profile to obtain various mode parameters, including fitted velocities. These velocities are inverted using the regularized least-square method to obtain the depth dependence in both zonal and meridional components. In order to remove large scale flows, such as meridional circulation and rotation residuals, and the contributions from projection effects as discussed by Jain et al. (2013), we subtract ensemble flow averages of five quiet areas exactly at the same heliographic location in a nearby Carrington rotation for each of the individual analyzed region (Tripathy et al., 2009).
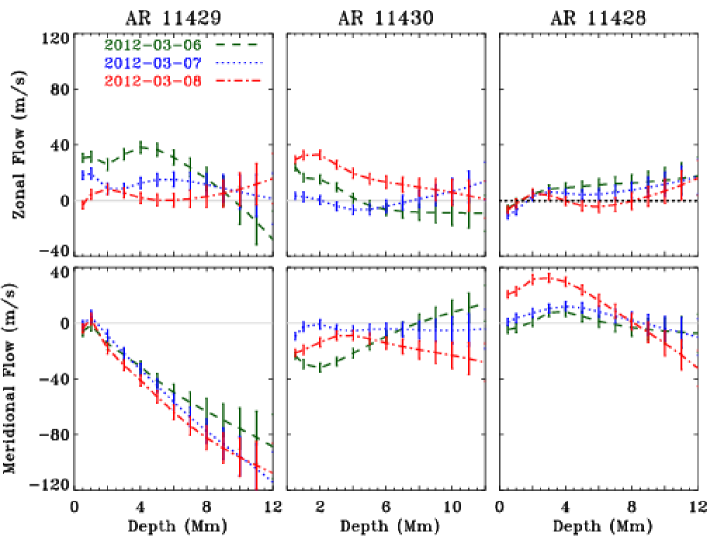
We display, in Figure 2, the zonal and meridional components of the flow vector for three consecutive days from March 6 – 8. Since AR 11429 is magnetically stronger than other two active regions, the magnitudes of these components are also higher. The most significant difference can be seen in the meridional components where these are predominantly negative (equatorward) in AR 11429 and do not change its direction with time. This component dominates the north-south direction of the horizontal flows. It should be noted that AR 11429 was in the Northern hemisphere and in ideal scenario, it should have positive meridional flow vector.
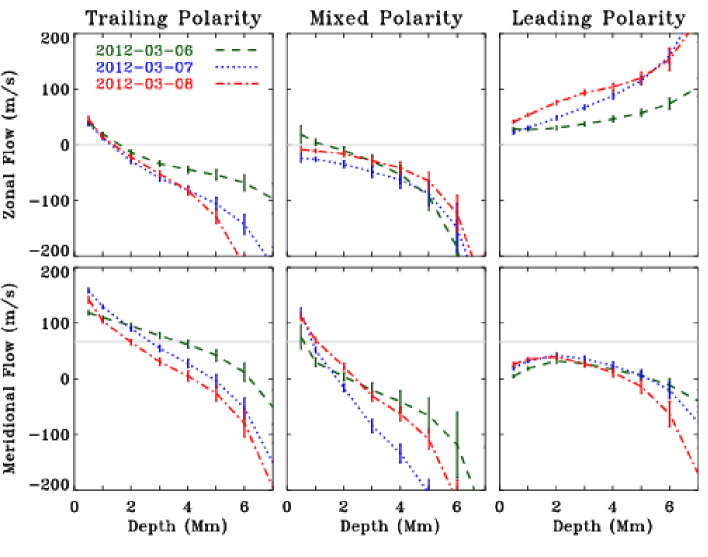
We further investigate the flow patterns in three major sub-regions within AR 11429, i.e., leading-polarity, mixed-polarity, and trailing-polarity regions. Here we used tiles of 8o 8o to minimize the effect of the nearby regions. Figure 3 displays the depth variations in zonal and meridional components for all regions. There are several interesting features to note in these plots: (i) there is significant variation in the velocity components in sub-regions as compared to flows shown in Figure 2 where the active region is considered as a whole, (ii) the zonal flows in the leading polarity region are prograde while these become retrograde with depth in other two regions, (iii) the meridional component of the leading polarity region is equatorward at all depth while it is poleward near the surface but becomes equatorward with increasing depth. The horizontal flows are typically poleward in both hemispheres, however this characteristic changes in the case of anti-Hale active regions. Our study shows that the anti-Hale active region violates the normal flow pattern: the meridional flows in and around anti-Hale active region become predominantly equatorward that dominates the overall direction of the horizontal flows. These equatorward flows may have severe consequences on the transport of magnetic flux to the pole (Jiang et al., 2015). It is argued that if several big regions of similar characteristics emerge during the solar cycle, these may affect the strength of magnetic flux at poles and finally the next cycle.
We also explore photospheric flows calculated using the Local Correlation Technique (LCT; Ravindra et al., 2008). In this work, the object image is separated by 4.5 min interval from the reference image. The corresponding zonal and meridional velocities are the averages over the entire period, i.e., 1396 minutes. We find that zonal flows in and around anti-Hale active region 11429 are higher than those in two active regions. However, there are significant differences between the meridional flow patterns in the Northern and Southern hemispheres. Flows around two nearby active regions in the Northern hemisphere, i.e., anti-Hale NOAA 11429 and pro-Hale NOAA 11430, are strongly equatorward which is opposite to the normal flow pattern (poleward). Contrary to this, we do not find any unusual flow patterns in AR 11428. These flow measurements are consistent with those obtained with the local helioseismic technique of ring diagrams, as discussed in the previous subsection. Although the spatial scales used in both LCT and RD methods are different, we find a strong positive correlation between the flows obtained from two methods near the surface which is in agreement with previous studies (e.g., Jain et al., 2016).
2.2 Subsurface flows around anti-Joy NOAA active region 11949
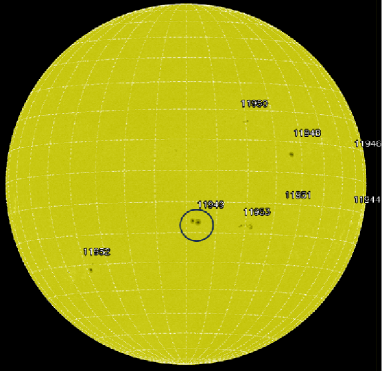
We selected a relatively isolated active region, i.e., NOAA 11949, that emerged in the Southern hemisphere around mid-January 2014. Its leading polarity is farther away from the equator than the trailing one. This configuration persisted for the entire disk passage from 2014-01-08 to 2014-01-19 (see Figure 4). We studied the subsurface flows for five days, i.e., from 2014-01-12 to 2014-01-16, as the active region crosses the central meridian.
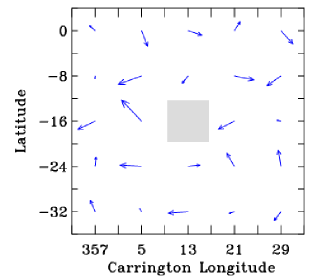
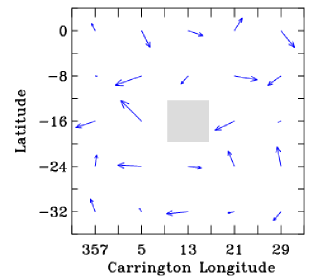
To study the flows around this active region, we divided the surrounding area into 25 patches and followed the analysis as described for the anti-Hale active region. We applied ring-diagram analysis to 24 patches of 8∘ 8∘ surrounding the active region and obtained the horizontal subsurface flows for all five consecutive days. Figure 5 displays temporal averages of the flows surrounding NOAA 11949 for two depths, 2.0 1.24 Mm and 7.0 2.83 Mm, below the solar surface. Since the subsurface properties are known to change in the presence of strong magnetic fields, here we concentrate on the flows around anti-Joy active region and their influence on the nearby areas. We obtain a curly clockwise pattern in these flows that we believe to be resulted from the anti-Joy configuration of NOAA 11949. Similar results were reported by González Hernández et al. (2013) in a case study of anti-Joy NOAA active region 11073 but counter-clockwise flows in the surrounding areas. We believe that the opposite flow directions in these two active regions are due to their locations in opposite hemispheres, which may be responsible for driving the leading polarity away from the solar equator. Although these two case studies exhibit similar results, a statistical study comprising a large number of anti-Joy active regions in both hemispheres will provide a clear picture of the influence of anti-Joy regions on the subsurface dynamics or vice versa.
3 Summary
In general, the horizontal velocity in active regions are larger than the quiet regions. Zonal flows in anti-Hale active region do not show any significant difference from those of pro-Hale regions. However, we find that the leading polarity region within an anti-Hale active region rotates faster than the trailing polarity region. This is opposite to the pro-Hale active regions. Our study provides evidence for meridional flows around anti-Hale active regions to be predominantly equatorward (11 out of 14 anti-Hale active regions). However, a thorough study with a larger database is required to understand the zonal and meridional flows in anti-Hale active regions. These equatorward flows may have severe consequences on the transport of magnetic flux to the pole that may affect the strength of polar flux and finally the next solar cycle. We also find curly flows in the surrounding areas of anti-Joy active region, which might be responsible for driving the leading polarity away from the solar equator. We suggest that the morphology of active regions plays an important role in the subsurface flow characteristics.
The data used here are courtesy of NASA/SDO and the HMI Science Team. This work was supported by NASA grants 80NSSC19K0261, 80NSSC20K0194, 80NSSC21K0735, and 80NSSC23K0404 to the National Solar Observatory and the NASA Cooperative Agreement 80NSSC22M0162 to Stanford University for the COFFIES Drive Science Center.
References
- Carrington (1858) Carrington, R. C. 1858, MNRAS, 19, 1
- Dikpati et al. (2010) Dikpati, M., Gilman, P. A., de Toma, G., & Ulrich, R. K. 2010, GRL, 37, L14107
- González Hernández et al. (2013) González Hernández, I., Komm, R., van Driel-Gesztelyi, L., et al. 2013, JPCS, 440, 012050
- Haber et al. (2004) Haber, D. A., Hindman, B. W., Toomre, J., & Thompson, M. J. 2004, Sol Phys, 220, 371
- Hale et al. (1919) Hale, G. E., Ellerman, F., Nicholson, S. B., & Joy, A. H. 1919, ApJ, 49, 153
- Hale & Nicholson (1925) Hale, G. E., & Nicholson, S. B. 1925, ApJ, 62, 270
- Hill (1988) Hill, F. 1988, ApJ, 333, 996
- Jain et al. (2022) Jain, K., Jain, N., Tripathy, S. C., & Dikpati, M. 2022, ApJL, 924, L20
- Jain et al. (2012) Jain, K., Komm, R. W., González Hernández, I., Tripathy, S. C., & Hill, F. 2012, Sol Phys, 279, 349
- Jain et al. (2013) Jain, K., Tripathy, S. C., Basu, S., et al. 2013, in Fifty Years of Seismology of the Sun and Stars, ed. K. Jain, S. C. Tripathy, F. Hill, J. W. Leibacher, & A. A. Pevtsov, Vol. CS-478 (San Francisco: Astron. Soc. Pacific), 193
- Jain et al. (2015) Jain, K., Tripathy, S. C., & Hill, F. 2015, ApJ, 808, 60
- Jain et al. (2017) Jain, K., Tripathy, S. C., & Hill, F. 2017, ApJ, 849, 94
- Jain et al. (2016) Jain, K., Tripathy, S. C., Ravindra, B., Komm, R., & Hill, F. 2016, ApJ, 816, 5
- Jiang et al. (2015) Jiang, J., Cameron, R. H., & Schüssler, M. 2015, ApJL, 808, L28
- Komm et al. (2011) Komm, R., Howe, R., Hill, F., & Jain, K. 2011, in IAU Symposium 273 - Physics of Sun and Star Spots, ed. D. P. Choudhary & K. G. Strassmeier, Vol. 273, (Cambridge: University Press), 148
- Ravindra et al. (2008) Ravindra, B., Longcope, D. W., & Abbett, W. P. 2008, ApJ, 677, 751
- Tripathy et al. (2009) Tripathy, S. C., Antia, H. M., Jain, K., & Hill, F. 2009, in Solar-Stellar Dynamos as Revealed by Helio- and Asteroseismology: GONG 2008/SOHO 21, ed. M. Dikpati, T. Arentoft, I. González Hernández, C. Lindsey, & F. Hill, Vol. CS-416 (San Francisco: Astron. Soc. Pacific), 139