Methods
Attosecond control of solid-state high harmonic generation using -3 fields
Abstract
Controlling the electron dynamics in matter by individual oscillations of light fields has recently led to the development of attosecond metrology. One of the phenomena resulting from the nonlinear response of materials in the strong-field interaction regime is coherent emission of high energy photons. High harmonic spectra carry the fingerprints of sub-cycle electronic motion and the energy structure of the studied system. Here we show that tailoring the waveform of the driving light by using a coherent combination with its third harmonic frequency allows to control the electron tunneling time within each half-cycle of the fundamental wave with attosecond precision. We introduce an experimental scheme in which we simultaneously monitor the modulation of amplitude and emission delays of high harmonic radiation and the excited electron population generated in crystalline silicon as a function of the relative phase between the -3 fields. The results reveal unambiguously the connection between the dynamics of electron tunneling and high harmonic generation processes in solids.
Main text
High harmonic spectroscopy has recently become an indispensable tool for investigation of light driven coherent electron dynamics in atoms [1, 2, 3] and solid-state systems [4, 5]. In a material illuminated by a nonresonant light wave with high field amplitude, the regime of electron excitation differs from classical optics in which the time-dependent potential generated in a material by the applied field can be considered as a small perturbation to the system. When the field amplitude of light increases such that the probability of electron tunnelling to the excited state per half period of the driving wave becomes larger than the perturbative transition probability, the light-matter interaction takes place in the nonperturbative strong-field regime [6], which represents the cornerstone of attosecond physics. This regime is characterized by the dimensionless Keldysh parameter [7], where is the band gap energy, is the reduced effective mass of an electron-hole pair, and are the electric field amplitude and frequency of the driving wave and is electron charge.
One of the phenomena resulting from the coherent nonlinear electron dynamics in the strong-field regime is high harmonic generation (HHG) [8, 9]. When this process occurs in solids, the photons with energies corresponding to higher order multiples of the incident photon energy are generated as a consequence of coherent nonlinear interband polarization and intraband electron dynamics [10]. The interband HHG can be understood in the framework of a three-step semi-classical model adopted from atomic physics [9]. The electron first tunnels to the conduction band in a narrow time window close to each maximum of the electric field of the driving wave. Subsequently, the coherent electron-hole wavepacket is accelerated by the laser field in the crystal and may eventually recombine while emitting high energy photon. The amplitude, phase and polarization of the emitted high harmonic radiation are tightly linked to the electric field waveform of the driving pulse and to the band structure of the material. It has been shown that HHG can be controlled by changing the polarization of the driving wave with respect to high symmetry axes of the crystal [12, 13, 11], the carrier-envelope phase of ultrashort pulses [14, 15, 16], by a coherent combination of phase controlled -2 fields [17, 21, 18, 19, 20, 22, 23, 24] or by sub-cycle control of electron excitation with respect to the THz driving field [25].
Although high harmonic spectroscopy in condensed matter has become a widely used technique, there are only few experiments clearly separating the individual processes contributing to the emission of the coherent high energy photons [25, 16]. Up to now it was also not possible to measure the phase shifts of the emitted harmonic radiation induced by tailoring the driving waveform. The principle of coherent two-color optical control has initially been developed to steer electron currents in semiconductors via quantum path interference by the -2 field superposition [27, 26]. Since then, the two-color coherent control has been demonstrated in many physical systems, including the control of quantum wave function of electrons in atoms [28], electron photoemission from metals [29, 30] or HHG in atoms and solids [17, 18, 19, 20, 21, 22, 23].
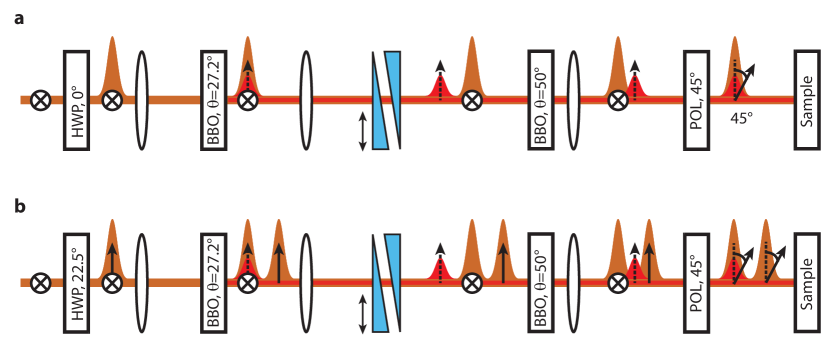
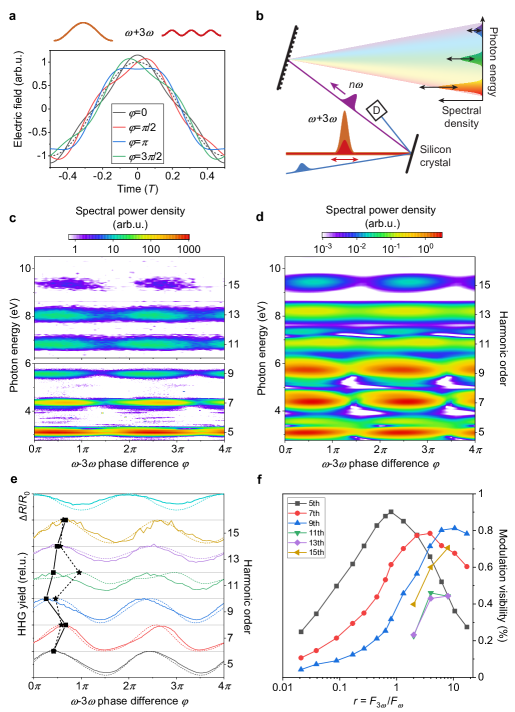
In this report we demonstrate a scheme allowing to control the electron tunneling time within each half-cycle of the driving wave with attosecond precision using coherent superposition of an ultrashort infrared pulse with its third harmonic frequency. By controlling the mutual phase between the -3 fields, the driving waveform changes (see Fig. 1a) leading to modulation of the amplitude and attosecond emission delays of high harmonic radiation generated in a silicon crystal. To clearly separate the HHG process from electron tunneling excitation we simultaneously monitor the excited electron density as a function of the -3 phase by measuring the transient reflectivity of the sample after the interaction with -3 fields. We observe that even a small admixture of light at the third harmonic frequency to the fundamental pulse (the ratio between light intensities ) is sufficient to reach high modulation visibility of both the high harmonic generation yield and the excited electron population.
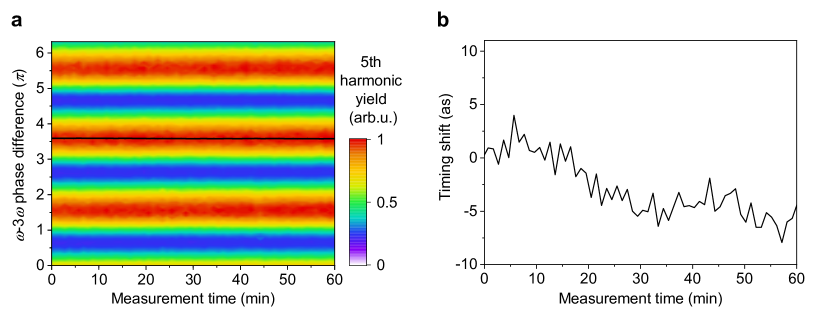
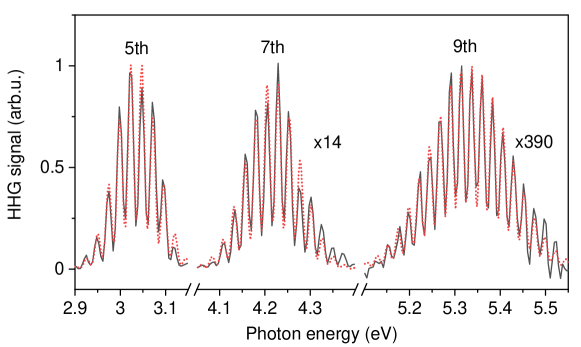
In our experiments we use the fundamental pulses in the mid-infrared spectral region with the photon energy of 0.62 eV (wavelength of 2000 nm) and the full-width at half maximum duration of 35 fs. The third harmonic pulse (1.86 eV, 667 nm) is generated in a BBO crystal using type I phase-matching. Both pulses propagate collinearly and are overlapped in space and time at the surface of a silicon crystal (see the layout of the experimental setup in Fig. 1b, detailed description of the setup can be found in Methods and in Extended data figure 1). Both the and 3 pulses have the same orientation of linear polarization along [100] crystallographic direction of silicon. The generated harmonic radiation is collected in the reflection geometry to avoid propagation effects in the sample. Due to the strong absorption of light at photon energies above the direct band gap (3.4 eV), the collected harmonic radiation is generated in a surface layer of the sample with the thickness of only 5-100 nm depending on the photon energy. The relative phase difference between the and 3 fields is controlled by a pair of fused silica wedges with a precision of 3 mrad corresponding to the time shift of the two waves by 3 as. The long-term timing jitter of the setup is characterized to be 2.8 as (RMS, see Methods and Extended data figure 2 for details). We choose the combination of the fundamental frequency with its third harmonics instead of more commonly used -2 combination because it allows to control the time window of electron tunneling within each half-cycle of the fundamental wave with better precision thanks to the shorter period of the third harmonic field. Additionally, the -3 combination does not break the time symmetry of the waveform. As a consequence, only the odd order harmonic frequencies are observed in the high harmonic spectra generated in centrosymmetric materials. Simultaneously with the modulation of high harmonic yield we monitor the excited carrier population which is left in the sample after the interaction with -3 pulses using transient reflectivity of an ultraviolet probe pulse (3.62 eV, blue beam in Fig. 1b, details in Methods and Extended data figure 3) incident on the sample with the delay time of 0.5 ps after the -3 pulse combination. This allows us to clearly separate the modulation of the integrated tunneling rate from the modulation of high harmonic emission probability.
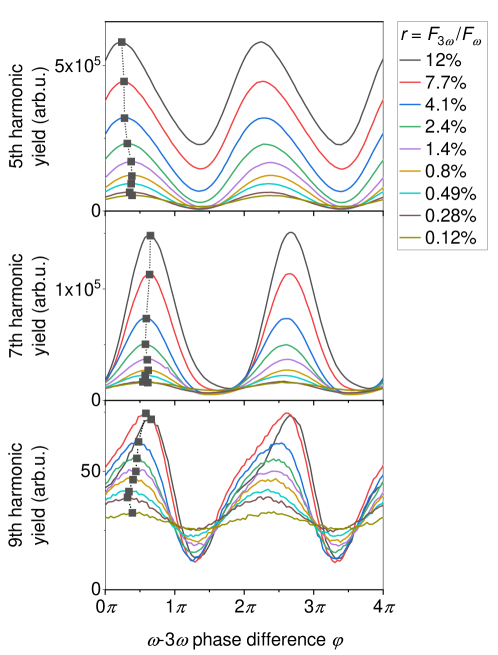
Coherent control of HHG in silicon by the two-color -3 field is experimentally demonstrated in Fig. 1c, where we plot the measured HHG spectra in the spectral region 2.8-10.5 eV as a function of the relative phase shift between the fundamental (peak electric field in silicon 1.61 0.1 GV/m) and the third harmonic fields with the ratio between the peak field amplitudes . The results are compared to numerical calculations using time dependent density functional theory (TDDFT, details are described in Methods) shown in Fig. 1d obtained with the fundamental electric field amplitude of 1.6 GV/m and the field ratio of . We observe a clear modulation of the spectra both in the experimental and numerical data. The oscillations of individual harmonic orders obtained by integrating the power emitted in the spectral window of 0.1 eV around each harmonic peak are shown in Fig. 1e both for the experimental data (solid curves) and the numerical calculations (dashed curves). The data are normalized and vertically translated for clarity. The HHG modulation is compared to the modulation of the transient reflectivity of the sample shown as a solid curve in the uppermost panel of Fig. 1e. Here the dashed curve corresponds to the normalized population of electrons excited to the conduction band resulting from the TDDFT calculations (see Methods for details). These data are used to obtain absolute calibration of the mutual phase between the -3 fields as the highest excited electron population is expected for , for which the maxima of both waveforms overlap (see Fig. 1a). We observe a good quantitative agreement between the experiment and numerical calculations both for the phase shifts of the oscillation maxima of individual harmonic orders, which are marked by squares (experimental data) and stars (theory), and for the depth of modulation of the high harmonic yield.
The phase of maximum generation yield differs for each harmonics as a consequence of the dispersion of the propagating electron and hole in higher energy bands of silicon, which tailors the interference between different quantum paths contributing to the interband emission of high energy photons. Remarkably, the maximum of the harmonic generation yield is reached for the -3 mutual phase , which is shifted from the phase corresponding to the highest population of excited carriers. This observation suggests that the dominant mechanism of HHG driven by mid-infrared light in silicon is the interband polarization [31] in contrast to the case of HHG in wide band gap materials excited by near-infrared light, where the intraband current was found to be dominating [16]. The phase of HHG modulation maxima is only weakly dependent on the ratio between the amplitudes of electric field of the 3 and pulses (see Extended data figure 4). The modulation visibilities defined as , where and are the minimum and maximum HHG yields at a particular harmonic frequency, are plotted in Fig. 1f as functions of . The visibilities reach high values even for very weak third harmonic field only of about 1% of the fundamental field, which induces almost imperceptible changes of the combined waveform. However, due to the strong nonlinearity of the HHG process, this weak waveform modulation translates to a strong modulation of the HHG signal.
To qualitatively understand the observed phenomena we recall the semi-classical model of HHG in atoms, in which we assume instantaneous electron tunneling and classical propagation of a single electron in free space between the tunneling and recombination events. In the adiabatic approximation, the time-dependent potential generated by the oscillating electric field changes slow enough to allow the quantum system to follow it. The instantaneous tunneling rate of an electron to the conduction band can be approximated using a Zener-like tunnelling formula [32]:
| (1) |
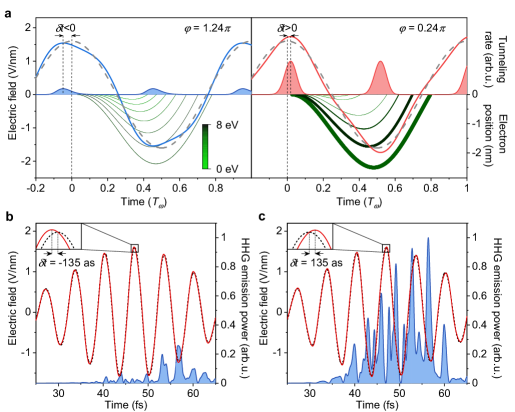
Here is the time dependent electric field in the material and is reduced Planck’s constant. In Fig. 2a we plot the time evolution of the coherent superposition of the fundamental and third harmonic fields with the amplitudes =1.6 V/nm and =0.16 V/nm (ratio =10%) for two values of the relative phase difference (blue curve) and (red curve) corresponding to weak and strong emission of high harmonic radiation, respectively. The instantaneous tunneling rate describing the probability of electron transition to the conduction band per unit time calculated using equation (1) with parameters 3.4 eV (1st direct band gap of silicon) and 0.45 (reduced mass corresponding to the lowest electron and hole bands in point) is shown as blue and red shaded areas. The classical trajectories of the electrons calculated by solving the equation of motion with the effective mass of the electron =0.2 (effective mass of light electron band in -point) emitted in different times within one half-cycle of the fundamental wave are shown as curves in the lower section of Fig. 2a. The color scale corresponds to the total energy of the recombining electron and hole (we assume light holes with =0.2 with trajectories ) while the line thickness is proportional to the tunneling probability of the electron corresponding to the particular trajectory. There are two important effects which may contribute to the modulation of the HHG yield. The first effect is a large difference between the maxima of the instantaneous tunneling rates, which are related to the modulation of the electric field amplitude of the combined -3 waveform. The second effect contributing to the HHG modulation is the time shift of the maximum of the tunneling window. The time shift has important implications for the probability of the electron-hole recombination. When the HHG is driven by a single frequency field, only the electrons generated during the second half of each tunneling window can recombine and emit photons while the ones created in the first half of the tunneling window propagate in the laser field away from the original position. The time shift of the tunneling window to later times with respect to the fundamental wave thus increases the number of recombining electrons contributing to high harmonic emission while the shift to earlier times leads to the opposite effect. This model suggests that the maximum of the high harmonic yield is reached for different value of than the maximum of the excited carrier population, which agrees with our experimental observations shown in Fig. 1e.
While this model captures most of the features observed in the experiments, it cannot describe the complex electron dynamics in silicon involving the intraband currents and interband transitions between multiple bands. To get a deeper insight into the coherent highly nonlinear response of silicon we analyse the nonlinear current obtained from TDDFT simulations. By applying high pass Fourier filter to the calculated total time-dependent current with a cut-off frequency of 4 (only 5th and higher harmonics are taken into account) we obtain the instantaneous current oscillating at high harmonic frequencies. The radiation emitted by an accelerating charge is proportional to the time derivative of the current, which gives us the time profile of the radiated instantaneous high harmonic power. In Figs. 2b,c we plot the combined -3 waveforms with the field ratio of =5% for two different values of the phase difference =1.5 (red curve in Fig. 2b) and =0.5 (red curve in Fig. 2c) along with the calculated instantaneous power of the emitted high harmonic radiation at photon energies above 2.8 eV (blue shaded areas). The field of the fundamental pulse is shown for comparison as dashed curves in Fig. 2b,c. The time shifts of the maxima of the waveforms in these two cases of as (see the inset of Fig. 2b) and as (see the inset of Fig. 2c), respectively, lead to dramatic changes of the emission probability even with a very weak perturbation of the fundamental waveform by the third harmonic field. We observe that the maxima and minima of the HHG yield correspond to approximately the same values of excited electron populations, emphasizing the role of the time shift of the electron tunneling window which is evidenced to be the dominant mechanism causing the modulation of HHG in silicon.
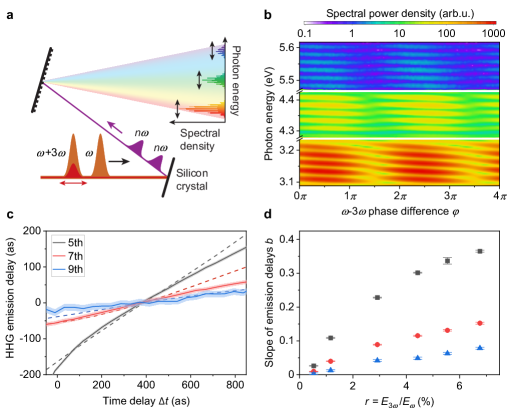
When the time of electron excitation shifts with respect to the fundamental wave, not only the amplitude but also the phase of the generated harmonic radiation is expected to shift. To measure the phase delays of the emitted high harmonic radiation we apply spectral interferometry by using a signal and reference high harmonic fields [33, 34]. The reference field is generated by an infrared pulse phase-locked to the -3 combination, which arrives to the sample before the two-color waveform (layout of the experimental setup is shown in Fig. 3a, the details of the experimental setup are described in Methods and Extended data figure 5). The time separation of the signal and reference fields of about 170 fs leads to spectral interference in the harmonic spectra, example of which is shown in Fig. 3b for 5th to 9th harmonic frequencies. By monitoring the shifts of the spectral interference fringes we measure the relative shifts of the emission phase of harmonic radiation as a function of the mutual phase between the -3 fields. We note that a real carrier population is generated in the sample during the HHG by the reference pulse. While this can induce dephasing of carriers during coherent HHG driven by -3 pulses which would decrease the amplitude of the generated harmonics, it is not expected to influence the phase of the emitted photons. In Fig. 3c we show the measured high harmonic emission delays (field ratio =5.5%) compared to the delays obtained from the numerical TDDFT simulations (=5%) in the time window around the maxima of the harmonic emission shown in Fig. 3b. We observe that close to the maximum of the emission yield, the emission delay scales approximately linearly with the time delay between the two-color fields with different slopes for individual harmonic frequencies. The emission delays of high harmonic photons relative to the fundamental wave thus depend on the photon energy and cannot be understood only by considering the time shift of the electron tunneling time. In contrast, the emission phase is determined by the combination of the tunneling time and the quantum mechanical phase acquired by the electron-hole wavepacket during its coherent dynamics between tunneling and recombination, where multiple bands are involved in the high harmonic generation process [35, 31]. The measured slopes of the emission delays of 5th to 9th harmonics obtained by fitting the data shown in Fig. 3c by a linear function are plotted in Fig. 3d as a function of the -3 field ratio .
The observed smaller delays of higher order harmonics can be qualitatively understood in the framework of the semi-classical electron dynamics shown in Fig. 2a. The electrons propagating along trajectories corresponding to the highest recombination energy are generated in a short time window within one half-cycle of the fundamental wave. The recombination time of these high energy electrons practically does not shift with the relative phase . However, the electrons with lower recombination energies are generated in two distinct time windows corresponding to short and long trajectories. Photons within the intermediate energy range are thus emitted in two distinct times within each half-cycle of the field (dark green curves in Fig. 2a) with different amplitudes and emission phases. The change of the relative phase shift between the -3 field leads to strong changes of the recombination probability of particular trajectories, which in turn causes the delay oscillating between the values corresponding to the short and long trajectories. The larger delays observed in the case of the 5th harmonic frequency can be also influenced by the fact that its photon energy is slightly below the direct band gap of undriven silicon. The intraband current thus in this case may play more important role than for the higher harmonics, where the dominance of the interband generation has been confirmed by recent experiments [31].
The combination of coherent two-color control and phase-resolved detection scheme with attosecond resolution introduced here brings opportunities for gaining a deeper understanding of HHG in solids. In particular we study the relation between the tunneling time, which is controlled within each half-cycle of the driving wave by adding a weak perturbation at the third harmonic frequency, and the amplitude and phase of the emitted high-energy photons. A direct comparison between the modulation of high harmonic emission and the modulation of the real carrier population induced by the -3 fields demonstrated here allows to separate the processes of electron excitation from the nonlinear coherent dynamics leading to HHG. Similar schemes can also be applied in other physical systems, in which the strong-field nonlinear optical interactions induce coherent sub-cycle electron dynamics [36]. Further, the -3 combination may find applications in atomic HHG for enhancement of the emission yield or for advanced gating techniques combining the coherent control with dynamic phase-matching [37].
References
- [1] Corkum, P. B. & Krausz, F. Attosecond science. Nat. Phys.. 3, 381-387 (2007).
- [2] Krausz, F. & Ivanov, M. Attosecond physics. Rev. Mod. Phys.. 81, 163-234 (2009).
- [3] Levesque, J., Zeidler, D., Marangos, J. P., Corkum, P. B. & Villeneuve, D. M. High Harmonic Generation and the Role of Atomic Orbital Wave Functions. Phys. Rev. Lett.. 98, 183903 (2007).
- [4] Ghimire, S. et al. Observation of high-order harmonic generation in a bulk crystal. Nat. Phys.. 7, 138-141 (2011).
- [5] Luu, T. T. et al. Extreme ultraviolet high-harmonic spectroscopy of solids. Nature. 521, 498-502 (2015).
- [6] Kruchinin, S. Yu., Krausz, F. & Yakovlev, V. Colloquium: Strong-field phenomena in periodic systems. Rev. Mod. Phys.. 90, 021002 (2018).
- [7] Keldysh, L. V. Ionization in the Field of a Strong Electromagnetic Wave. Soviet Physics JETP. 20 1307 (1965).
- [8] McPherson, A. et al. Studies of multiphoton production of vacuum-ultraviolet radiation in the rare gases. J. Opt. Soc. Am. B. 4, 595-601 (1987).
- [9] Corkum, P. B. Plasma perspective on strong field multiphoton ionization. Phys. Rev. Lett.. 71, 1994-1997 (1993).
- [10] Ghimire, S. & Reis, D. A. High-harmonic generation from solids. Nat. Phys.. 15, 10-16 (2019).
- [11] Klemke, N. et al. Polarization-state-resolved high-harmonic spectroscopy of solids. Nat. Commun.. 10, 1319 (2019).
- [12] You, Y. S., Reis, D. A. & Ghimire, S. Anisotropic high-harmonic generation in bulk crystals. Nat. Phys.. 13, 345-349 (2017).
- [13] Yoshikawa, N., Tamaya, T. & Tanaka, K. High-harmonic generation in graphene enhanced by elliptically polarized light excitation. Science. 356, 736-738 (2017).
- [14] You, Y. S. et al. Laser waveform control of extreme ultraviolet high harmonics from solids. Opt. Lett.. 42, 1816-1819 (2017).
- [15] Schubert, O. et al. Sub-cycle control of terahertz high-harmonic generation by dynamical Bloch oscillations. Nat. Photonics. 8, 119-123 (2014).
- [16] Garg, M. et al. Multi-petahertz electronic metrology. Nature. 538, 359–363 (2016).
- [17] Watanabe, S., Kondo, K., Nabekawa, Y., Sagisaka, A. & Kobayashi, Y. Two-Color Phase Control in Tunneling Ionization and Harmonic Generation by a Strong Laser Field and Its Third Harmonic. Phys. Rev. Lett.. 73, 2692-2695 (1994).
- [18] Vampa, G. et al. Linking high harmonics from gases and solids. Nature. 522, 462-464 (2015).
- [19] Vampa, G. et al. All-Optical Reconstruction of Crystal Band Structure. Phys. Rev. Lett.. 115, 193603 (2015).
- [20] Orenstein, G. et al. Shaping electron-hole trajectories for solid-state high harmonic generation control. Opt. Express. 27, 37835-37845 (2019).
- [21] Dudovich, N. et al. Measuring and controlling the birth of attosecond XUV pulses. Nat. Phys.. 2, 781-786 (2006).
- [22] Mitra, S. et al. Suppression of individual peaks in two-colour high harmonic generation. J. Phys. B-At. Mol. Opt. Phys.. 53, 134004 (2020).
- [23] Uzan, A. J. et al. Attosecond spectral singularities in solid-state high-harmonic generation. Nat. Photonics. 14, 183-187 (2020).
- [24] Severt, T., Troß, J., Kolliopoulos, G., Ben-Itzhak, I. & Trallero-Herrero, C. A. Enhancing high-order harmonic generation by controlling the diffusion of the electron wave packet. Optica. 8, 1113-1121 (2021).
- [25] Langer, F. et al. Lightwave-driven quasiparticle collisions on a subcycle timescale. Nature. 533, 225-229 (2016).
- [26] Haché, A. et al. Observation of Coherently Controlled Photocurrent in Unbiased, Bulk GaAs. Phys. Rev. Lett.. 78, 306-309 (1997).
- [27] Dupont, E., Corkum, P. B., Liu, H. C., Buchanan, M. & Wasilewski, Z. R. Phase-Controlled Currents in Semiconductors. Phys. Rev. Lett.. 74, 3596-3599 (1995).
- [28] Weinacht, T., Ahn, J. & Bucksbaum, P. Controlling the shape of a quantum wavefunction. Nature. 397, 233-235 (1999).
- [29] Förster, M. et al. Two-Color Coherent Control of Femtosecond Above-Threshold Photoemission from a Tungsten Nanotip. Phys. Rev. Lett.. 117, 217601 (2016).
- [30] Li, A., Pan, Y., Dienstbier, P. & Hommelhoff, P. Quantum Interference Visibility Spectroscopy in Two-Color Photoemission from Tungsten Needle Tips. Phys. Rev. Lett.. 126, 137403 (2021).
- [31] Suthar, P., Trojánek, F., Malý, P., Derrien, T. J.-Y. & Kozák, M. Role of Van Hove singularities and effective mass anisotropy in polarization-resolved high harmonic spectroscopy of silicon. Commun. Phys.. 5, 288 (2022).
- [32] Kane, E. O. Zener tunneling in semiconductors. J. Phys. Chem. Solids. 12, 181-188 (1960).
- [33] Lu, J., Cunningham, E. F., You, J. S., Reis, D. A. & Ghimire, S. Interferometry of dipole phase in high harmonics from solids. Nature Photonics. 13, 96-100 (2019).
- [34] Uchida, K. & Tanaka, K. High harmonic interferometer:For probing sub-laser-cycle electron dynamics in solids. Preprint at https://arxiv.org/abs/2304.14704 (2023).
- [35] Klemke, N. et al. Polarization-state-resolved high-harmonic spectroscopy of solids. Nat. Commun.. 10 (2019).
- [36] Dienstbier, P. et al. Tracing attosecond electron emission from a nanometric metal tip. Nature. 616, 702-706 (2023).
- [37] Thomann, I. et al. Characterizing isolated attosecond pulses from hollow-core waveguides using multi-cycle driving pulses. Opt. Express. 17, 4611-4633 (2009).
Funding:
Czech Science Foundation (project GA23-06369S), Charles University (UNCE/SCI/010, SVV-2020-260590, PRIMUS/19/SCI/05, GAUK 349921). Funded by the European Union (ERC, eWaveShaper, 101039339). Views and opinions expressed are however those of the author(s) only and do not necessarily reflect those of the European Union or the European Research Council Executive Agency. Neither the European Union nor the granting authority can be held responsible for them. T. J.-Y. D. was supported by the European Regional Development Fund, the state budget of the Czech Republic (project BIATRI: CZ.02.1.01/0.0/0.0/15 003/0000445) and the Ministry of Education, Youth and Sports of the Czech Republic through the e-INFRA CZ (ID:90140).
Contribution
MK conceived and supervised the study. A.G., M.K. and P.S. performed the experiments. A.G. and M.K. processed and interpreted the experimental data. T.J.-Y.D. performed the numerical simulations. M.K. wrote manuscript with the input from all the co-authors.
Competing interests
Authors declare that they have no competing interests.
Data availability
All data supporting the findings of this study are available from the corresponding authors upon reasonable request.
Methods
Experimental setup
The experiments demonstrating coherent two-color control of high harmonic generation in silicon are performed using pulses generated in a noncollinear optical parameteric amplifier with subsequent difference frequency generation (NOPA-DFG, setup is described in detail in [1]) and the pulses at its third harmonic frequency. The NOPA-DFG setup is pumped by solid-state femtosecond laser system Pharos SP2-6W (Light Conversion) with ytterbium-doped active medium. The NOPA-DFG output pulses have central wavelength of 2000 nm and pulse duration at the sample of 35 fs (FWHM of instantaneous power). The coherent -3 pulse combination is generated in the setup, which is shown in Extended data figure 1. The beam passes through a half wave plate to control the direction of linear polarization of the fundamental pulse. Subsequently, the beam is focused using an off-axis parabolic mirror with a focal distance of 15 cm to a BBO crystal, where the pulses at third harmonic frequency 3 are generated. We use phase-matching angle of =27.2° for direct third harmonic generation (-type phase-matching) leading to vertically polarized 3 pulse (polarization along the direction of projection of the optical axis of the BBO crystal in the plane perpendicular to the light propagation). In the first experiment, the half wave plate is adjusted such that the fundamental polarization is horizontal. The pulse thus propagates as an ordinary ray and we obtain only one replica of the fundamental pulse after the BBO. When the half wave plate is rotated to 22.5°, the polarization incident to BBO crystal has both the horizontal and vertical components with the same amplitude. As a consequence of the birefringence of the BBO crystal we obtain two orthogonally polarized pulses, which are delayed due to different group indexes of the ordinary and the extraordinary rays. After the BBO crystal, the two collinear beams at the fundamental and the third harmonic frequencies are collimated by a second off-axis parabolic mirror with focal length of 15 cm.
The relative phase between the and 3 pulses is controlled using a pair of fused silica wedges with an apex angle of =4°. One of the wedges is placed on a translation stage. The phase shift of the third harmonic field with respect to the fundamental pulse resulting from the propagation in the wedges over a distance can be expressed as , where is speed of light in vacuum and =1.4381 and =1.4561 are the refractive indexes of fused silica at frequencies and , respectively. One period of the high harmonic yield modulation corresponds to the shift of the relative - phase by 2 which gives 37 m. The calculated shift of the wedge needed to change the thickness of the material by is mm, which matches well the experimentally determined value of 0.5740.005 mm. While the refractive indexes of fused silica at frequencies and 3 differ strongly, the difference between group velocities of the two pulses in the wedges are much smaller (group indexes are =1.4673 and =1.4732) leading to a small relative shift of the pulse envelopes when changing the relative phase by several periods of the field. To compensate the total group delay which the and 3 pulses obtain between the first BBO crystal and the sample we let the beam pass through a second BBO crystal with the optical axis cut under the angle =50°. Due to the negative uniaxial birefringence of BBO, the ordinary ray at frequency propagates slower in the crystal than the extraordinary ray at 3. The beam is finally focused on the sample surface by an off-axis (90°) silver coated parabolic mirror with focal length of =35 mm. The spot sizes of the two beams on the sample are m and m. The dependence of nonperturbative HHG yield in silicon on the incident light intensity of the fundamental pulses was previously measured to be cubic [31]. When considering Gaussian profile of the fundamental beam, the harmonics are produced from the area with a radius decreased by a factor of m, which is well matched to the size of the third harmonic beam. To adjust the polarizations of all the pulses to be linear in the same direction we put a thin polarizer (Thorlabs, LPNIRA) between the final focusing parabolic mirror and the sample.
High harmonic radiation is collimated by a UV fused silica lens with focal distance of 100 mm. The spectra are detected using a grating spectrograph (Andor, Shamrock 163) with a grating containing 600 lines/mm blazed for 300 nm. The spectrometer is equipped with a cooled CCD camera (Andor iDUS 420). Prior to entering the spectrometer, the light is spectrally dispersed in the vertical direction by a pair of fused silica prisms. This allows to filter out most of the radiation at wavelengths above 500 nm before the high harmonics enter the spectrometer. Because the dispersion is applied in the vertical direction, all the harmonics are transmitted through the entrance vertical slit of the spectrometer. The harmonics 11th-15th have photon energies higher than 6 eV and are strongly absorbed in air. The modulation of the high harmonic orders is thus measured in vacuum using a vacuum ultraviolet spectrometer (EasyLight, H+P Spectroscopy) combined with a microchannel plate detector.
Due to the inline setup of the nonlinear interferometer, in which both beams propagate through the same beam paths, the drifts of the relative phase difference between the and 3 pulses are negligible and the time jitter of the two fields is only few attoseconds over the measurement time of one hour (see the measured modulation of the 5th harmonic frequency over the time period of 60 minutes shown in Extended data figure 2).
The carrier population excited in the sample by the coherent superposition of -3 fields is monitored by measuring the transient reflectivity of the sample. We use an independent probe pulse with the wavelength of 343 nm and photon energy of 3.62 eV (third harmonics of the Pharos laser output at 1030 nm), which is incident on the sample with a controlled time delay with respect to the coherent -3 pulse combination. The high photon energy of the probe is selected due its short penetration depth into silicon of only few nanometers, which prevents accumulation of the signal coming from different depths which would be modified by the fact that the phase velocities of the pulses at and 3 frequencies in silicon strongly differ. The second reason for selecting a short probe wavelength is the possibility to focus the probe beam to a smaller spot size than the and 3 beams, which allows to probe the region of the sample with approximately homogeneous spatial distribution of the excited carriers. In this experiment, the pump -3 combination propagates through an optical chopper, which modulates the beam. After being reflected from the sample, the power of the probe beam at 3.62 eV is detected by a silicon photodiode. The electronic signal is measured using a lock-in amplifier (SR830, Stanford Research Systems) at the frequency of the optical chopper. The measured transient reflectivity dynamics is shown in Extended data figure 3 as a function of the time delay between the -3 pulses which excite the carriers and the ultraviolet probe pulse. The excited carrier population is linearly proportional to the transient reflectivity change in a short time after the excitation. To observe the oscillations of the carrier population as a function of the relative phase between the -3 fields we set the time delay of the probe to 0.5 ps.
Data processing
The measured high harmonic spectra are not compensated for the absolute spectral efficiency of the detection setup. The absolute calibration is not required because we are only interested in the relative changes of the HHG yield of individual harmonic frequencies as a function of experimental parameters (mutual phase difference between -3 fields, ratio of the field amplitudes ). The generation yield at each harmonic frequency is obtained by integrating the spectral window with the width of 0.1 eV around the spectral peak of the particular harmonics.
The spectral interferometry data shown in Fig. 3b are processed by fitting the peaks of the individual harmonics in each spectrum corresponding to specific -3 phase differences using a function:
| (2) |
Here and are the central frequency and the spectral width of the particular harmonic peak. Fitting parameters are the delay between the two harmonic pulses , their relative phase shift and the coefficients , and which correspond to the amplitude of the slowly varying Gaussian envelope (), the amplitude of the spectral interference () and the constant background (). The data are fitted in two steps. First the time delay is determined from the data with the strongest spectral interference shown in Extended data figure 5. In the second step, is kept constant and the relative phase shift of harmonic fields is obtained for different values of the relative phase between the driving -3 fields. The relative emission delays shown in Fig. 3c are calculated from the relative phase shifts of the individual harmonic peaks as , where is the central frequency of the particular harmonics.
Numerical calculations using time dependent density functional theory
(TDDFT)
Ground state preparation
Silicon (100) crystal is prepared using a primitive cell made of two silicon atoms along with non-orthogonal periodic boundary conditions as implemented in Octopus [2]. Inter-atomic distance is chosen equal to the experimental value ( angstroms) [3] The inter-atomic potential is described using the method of norm-conserving ab-initio pseudo-potentials [4]. The real-space is meshed regularly using a step of angstroms, and the momentum space is meshed uniformly using a grid of , repeated 4 times centered at points X and L.
Time-dependent simulations and control of convergence
The time-evolved Kohn-Sham (KS) states are prepared by solving the KS equation expressed in the velocity gauge and in Hartree atomic units:
| (3) | |||
Here the vector potential describing the laser pulse is introduced using the dipolar approximation in the minimal coupling formulation. In Eq. (3), is the pure imaginary number, is the reduced Planck constant, is the electron mass at rest, is the real-space gradient operator, is the elementary charge of the electron and is the light velocity. In the Coulomb gauge, the vector potential in the dipolar approximation is related to the electric field via the relation
| (4) |
In Eq. (3), represents the potential of the atomic lattice. Note that the non-local term originating from the pseudo-potential is not detailed for simplicity. denotes the Hartree potential, corrected by the exchange-correlation potential noted . The incident wavelengths is normalized to the band-gap energy obtained using the TB09 functional. Orientation of the linearly-polarized electric field is set along the direction of the cubic crystal. From the time-evolved Kohn-Sham orbitals , the time-dependent electrical current is computed as indicated in Ref. [7].
The electric field of laser pulses at frequencies and 3, respectively, which is used in the numerical simulations can be written as:
| (5) |
where:
| (6) |
Here the correction of the FWHM for envelope can be expressed as:
| (7) |
=35 fs is the experimental pulse duration and is Heaviside function of argument . Note that 4th-power sinus is commonly employed to decrease the spurious oscillations originating from the Fourier transformation upon computation of high-harmonic spectrum [8, 31].
Normalization of pulse frequency to band gap energy
Density functional theory gives for most of the materials systematically lower values of the band gap compared the experimental values. For the HHG process, an important parameter is the ratio between the driving photon energy and the minimum band gap. As shown in [31], the driving frequency can be normalized to the reduced band-gap provided by DFT [6] to fulfill the relation . In the calculations, the wavelengths of =2237 nm and =745.66 nm are used instead of the experimental values 2000 nm and 666.67 nm, respectively. The time axis in the calculation results is normalized back to obtain harmonic spectra with frequencies corresponding to experimental data.
Calculation of harmonic spectra
Harmonic spectra are calculated using Larmor’s formula and Fourier transform of the total current obtained by the TDDFT simulations. The Fourier transform is applied to a temporal window that decays in at the end of pulse to avoid generating spurious oscillations in the spectra as a consequence of no dephasing present in the TDDFT calculations (similarly to Ref. [31]).
Calculation of the excited electron density
The number of electrons excited from the valence band to the conduction bands is computed using the method described in Ref. [9]. Note that transient values of electron density are subjected to gauge dependencies [10]. Therefore, reported values of quantity of excited electrons are captured after the laser pulse, i.e., in absence of fields, a situation where gauge is not problematic [10, 11].
References
- [1] Kozák, M., Peterka, P., Dostál, J., Trojánek, F. & Malý, P. Generation of few-cycle laser pulses at 2 m with passively stabilized carrier-envelope phase characterized by f-3f interferometry. Opt. Laser Technol.. 144 107394 (2021).
- [2] Tancogne-Dejean, N. et al. Octopus, a computational framework for exploring light-driven phenomena and quantum dynamics in extended and finite systems. J. Chem. Phys.. 152 124119 (2020).
- [3] Okada, Y. & Tokumaru, Y. Precise determination of lattice parameter and thermal expansion coefficient of silicon between 300 and 1500 K. Journal Of Applied Physics. 56, 314-320 (1984).
- [4] Troullier, N. & Martins, J. L. Efficient pseudopotentials for plane-wave calculations. Phys. Rev. B. 43, 1993-2006 (1991).
- [5] Tran, F. & Blaha, P. Accurate Band Gaps of Semiconductors and Insulators with a Semilocal Exchange-Correlation Potential. Phys. Rev. Lett.. 102, 226401 (2009).
- [6] Lherbier, A. et al. Band widths and gaps from the Tran-Blaha functional: Comparison with many-body perturbation theory. Phys. Rev. B. 87 075121 (2013).
- [7] Wachter, G. et al. Ab Initio Simulation of Electrical Currents Induced by Ultrafast Laser Excitation of Dielectric Materials. Physical Review Letters. 113, 087401 (2014).
- [8] Sato, S. A., Hirori, H., Sanari, Y., Kanemitsu, Y. & Rubio, A. High-order harmonic generation in graphene: Nonlinear coupling of intraband and interband transitions. Phys. Rev. B. 103, L041408 (2021).
- [9] Derrien, T. J.-Y. et al. Photoionization and transient Wannier-Stark ladder in silicon: First principle simulations versus Keldysh theory. Phys. Rev. B. 104 L241201 (2021).
- [10] Ernotte, G., Hammond, T.J. & Taucer, M. A gauge-invariant formulation of interband and intraband currents in solids. Phys. Rev. B. 98 235202 (2018).
- [11] Otobe, T. et al. First-principles electron dynamics simulation for optical breakdown of dielectrics under an intense laser field. Phys. Rev. B. 77 165104 (2008).