Temperature-Dependent Collective Excitations in a Three-Dimensional Dirac System ZrTe5
Abstract
Zirconium pentatelluride (ZrTe5), a system with a Dirac linear band across the Fermi level and anomalous transport features, has attracted considerable research interest for it is predicted to be located at the boundary between strong and weak topological insulators separated by a topological semimetal phase. However, the experimental verification of the topological phase transition and the topological ground state in ZrTe5 is full of controversies, mostly due to the difficulty of precisely capturing the small gap evolution with single-particle band structure measurements. Alternatively, the collective excitations of electric charges, known as plasmons, in Dirac systems exhibiting unique behavior, can well reflect the topological nature of the band structure. Here, using reflective high-resolution electron energy loss spectroscopy (HREELS), we investigate the temperature-dependent collective excitations of ZrTe5, and discover that the plasmon energy in ZrTe5 is proportional to the power of the carrier density , which is a unique feature of plasmons in three-dimensional Dirac systems or hyperbolic topological insulators. Based on this conclusion, the origin of the resistivity anomaly of ZrTe5 can be attributed to the temperature-dependent chemical potential shift in extrinsic Dirac semimetals.
Introduction.—Topological semimetals and insulators have attracted extensive attention due to their potential to achieve various novel quantum states [1, 2]. In principle, just as their names suggest, topological semimetals are characterized by linear semimetallic bulk band crossings [3], while topological insulators have parabolic bulk bands with insulating gaps [4, 5]. Typically, these two kinds of band features can be well distinguished by single-particle imaging techniques such as scanning tunneling spectroscopy (STS) and angle-resolved photoemission spectroscopy (ARPES) [6, 7]. From a theoretical perspective, topologically distinct insulating phases, e.g., strong and weak topological insulators, are separated by a topological semimetal phase [8]. The transition between these phases is defined as a topological phase transition [9]. Searching for the topological phase transition in a real material system is one of the most appealing topics in the fast-developing field of topological physics [10].
ZrTe5 is such a system that is theoretically predicted to be at the boundary of a strong and weak topological insulator phase transition [11], but experimentally the verification of the topological phase transition is still controversial. On one hand, the anomalies of resistivity [12, 13, 14], thermopower [12, 15], and Hall coefficient [12, 16] in ZrTe5 seem to imply a temperature-induced topological phase transition [17]. However, on the other hand, there is currently no consensus on the experimental band gap measurements. For example, ARPES measurements [18, 19, 20, 21, 22] report inconsistent gap values ranging from 0 to 100 meV at low temperatures due to the difference in the data processing methods to deal with the in-band broadening. And STS experiments face challenges in distinguishing the V-shaped semimetal state [19, 20] from a band gap [23, 24], owing to the zero density of states at the Fermi level in a Dirac semimetal phase.
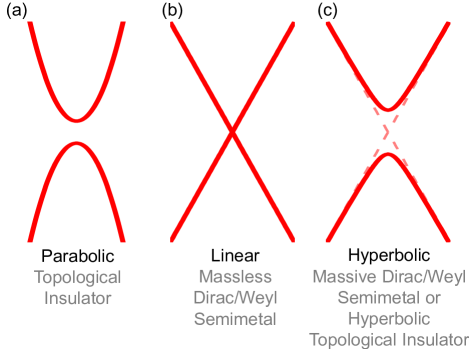
In topological systems, the bulk bands can manifest in three different shapes (illustrated in Fig. 1): a parabolic band with a gap (conventional topological insulator [5, 4]), a gapless linear band (Dirac or Weyl semimetal [25]), or a hyperbolic band (massive Dirac semimetal [26] or hyperbolic topological insulator). The hyperbolic band emerges after continuously introducing a gap to a gapless linear band, and the asymptotes of the hyperbolic curve trace back to the original linear band. In principle, a strict linear band with a gap is theoretically implausible. Therefore, even if the small gap size could be precisely measured, it is still hard to determine if ZrTe5 is a conventional parabolic topological insulator, a massive Dirac semimetal, or a hyperbolic topological insulator. The ground topological state of ZrTe5 and the existence of its topological phase transition are still elusive.
In this context, attempting to determine the topological ground state of ZrTe5 from the perspective of gap size has to deal with various complexities. Alternatively, investigating topological properties from the perspective of collective excitations has emerged as a potential approach, bypassing the controversies of direct single-particle gap measurements, as collective excitations can uniquely reflect the features of topological band structures [25, 27]. For example, a previous theoretical work suggests that Dirac plasmons, which are collective excitations of linear Dirac electrons, have a unique carrier density-dependent plasmon feature that is completely different from that of the topological insulator with parabolic bulk electrons [28]. The advantage of this approach is that it allows for a qualitative assessment of the topological ground state solely based on the shape of the energy band near the Fermi level obtained from the plasmon behavior, without requiring precise measurements of the gap size.
In this study, we employ reflective high-resolution electron energy loss spectroscopy (HREELS) to investigate the temperature-dependent collective excitations of ZrTe5 to determine its topological ground state. We observe the existence of plasmon-phonon coupling (PPC) in ZrTe5 and extract the temperature-dependent plasmon energy via a phenomenological model. We discover that the plasmon energy in ZrTe5 exhibits a distinct behavior, proportional to (where is the carrier density), which is a characteristic feature of plasmons in three-dimensional (3D) Dirac systems with linear or hyperbolic Dirac bands 111The possibility of a hyperbolic Dirac band with non-zero mass cannot be excluded, which will be discussed in the SM [32].. This rules out the possibility that ZrTe5 is a conventional topological insulator with parabolic bulk bands. Besides, we discuss the potentiality of it being a topological insulator with hyperbolic bulk bands. Based on these findings, we attribute the origin of the resistivity anomaly in ZrTe5 to an extrinsic-intrinsic crossover of the Dirac electron behavior, without necessitating the additional assumption of a topological phase transition.
Method.—The single crystals of ZrTe5 were grown using the chemical vapor transport (CVT) method. ZrTe5 single crystals were cleaved in an ultra-high vacuum and the crystallographic orientations were checked by low-energy electron diffraction. Then the collective excitations were measured in an HREELS system with a reflected scattering geometry [30]. The incident electron beam energy eV and the incident angle were used with a typical energy resolution of 2 meV. The data were collected with the sample temperature varying from 35 to 300 K at point () in the surface Brillouin zone. The band structure of was calculated by the first-principles density functional theory (DFT) as implemented in the Quantum ESPRESSO package [31]. The plasmons were obtained from the calculations of the dielectric functions as well as the energy-loss functions within the random phase approximation. The details about the experimental methods, sample characterizations, and plasmon calculations are described in the Supplemental Material (SM) [32].
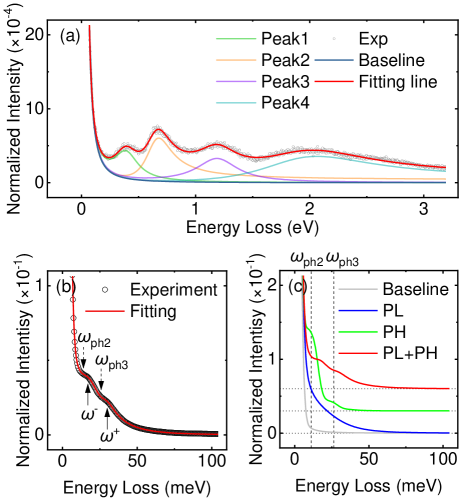
Plasmon-phonon coupling.—Figure 2 displays the energy distribution curves (EDCs) of the HREELS spectra in the high loss energy region (< 3 eV) and low loss energy region (< 100 meV), respectively. In the high energy region, four excitations around 0.4, 0.6, 1.2, and 1.9 eV were observed [Fig. 2(a)]. With the analysis of the calculated density of states and the dielectric functions (see details in the SM [32]), the three excitations around 0.4, 0.6, and 1.2 eV are assigned to interband transitions, and the excitation around 2.0 eV is identified as an interband plasmon. The temperature dependence of these excitations was not found to be related to the Dirac electrons. Instead, they are demonstrated to be originating from thermally induced lattice expansion (see details in the SM [32]). Therefore, the focus of this work is on the results in the low energy (< 100 meV) region.
Figure 2(b) shows the low energy HREELS results in ZrTe5 at room temperature (300 K). Two subtle features at 16 and 28 meV are detected. Previous works [33, 17, 34] reported the existence of three IR-active phonons with energies of about 5, 11, and 23 meV and a plasmon with an energy of about 30 meV. If these excitations are independent of each other, they should have appeared as peaks centered at the phonon or plasmon energies in HREELS spectra. However, the two characteristic peaks in ZrTe5 are inconsistent with the energies of the independent phonons and the plasmon in previous IR measurements [33, 17, 34]. This inconsistency is caused by the PPC via a macroscopic electric field [35], which has been well-studied in graphene [36, 37, 38] and doped semiconductors [39, 40, 41, 42, 43]. In an HREELS spectrum, the PPC is typically observed as split plasmon signals marked by , where a plasmon contributes an envelope and a phonon creates a dip on this envelope [35, 36, 37, 38].
The measured HREELS spectra were fitted to demonstrate the splitting mechanism induced by the PPC. In the fitting process, we first consider the dielectric function described by the Drude-Lorentz model, which can describe the PPC via a macroscopic electric field, and subsequently simulate the HREELS spectra from the dielectric function using a well-established numerical method [44]. The dielectric function is expressed as follows:
The first term on the right-hand side is the high-frequency dielectric constant. The second term is the Drude term describing plasmons, and the third term is the Lorentz term describing the IR-active phonon modes, where , , Q, , and represent the plasmon frequency, the carrier damping, the phonon strength, the phonon frequency, and the phonon damping, respectively. The fitting line [the red line in Fig. 2b)] agrees well with the EDCs measured by HREELS, and the fitting results are given as the screened plasmon energy meV, the phonon energies meV, meV, and meV (see other parameters in the SM [32]). The energies of phonons and the plasmon obtained from this fitting show little discrepancy to the IR experimental results, and meanwhile the fitting successfully reproduces the splitting features marked by [Fig. 2(b)].
In order to establish an intuitive understanding of the splitting features induced by the PPC, we also performed fittings with only a plasmon considered or only three phonons considered. As shown in Fig. 2(c), the gray line represents the background from the elastic scattering without sample information. Case 1: Considering the Drude component from an independent plasmon only, the spectral weight is added in the EDC as a swelling centered at the energy meV (the blue line), which is so close to the zero loss peak that it cannot manifest as a distinguishable peak. Case 2: When considering only three Lorentz components from phonons (the green line), each phonon contributes a peak (or a shoulder) in the EDC, except for the one with the energy meV merging into the zero loss peak. In summary, when plasmons and phonons exist independently, they appear as peaks centered at their respective energies. Both of these two cases exhibit significant discrepancies compared to our experimental results. In contrast, when all the phonons and the plasmon are included, the curve shape is significantly altered, demonstrating the PPC spitting feature, as shown by the red lines in Fig. 2(b) and (c). Specifically, the Drude component (the plasmon) contributes an envelope centered at meV, and the phonons provide dips on the envelope, as if the phonons split the plasmon.
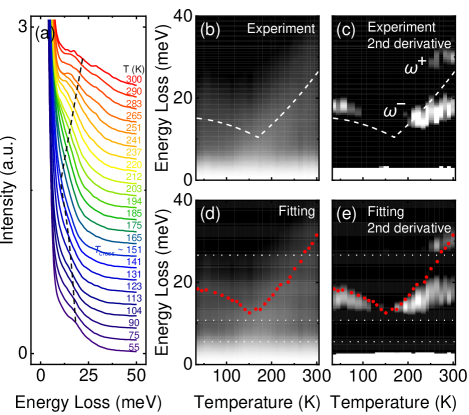
Temperature dependence of the plasmon.—Based on the above analysis, we can examine the temperature dependence of the plasmon using the method of tracking the envelope center and fitting with the Drude-Lorentz model. Figure 3 presents the temperature-dependent low-energy EDCs. Qualitatively, the central energy of the envelope contributed by the plasmon declines with the decreasing temperature, and then slightly rises below about 150 K [dashed lines in Fig. 3(a) and (b)]. The peak temperature for the plasmon energy coincides with the peak temperature for the carrier density measured in a sample grown by the CVT method [34], establishing a resistivity peak temperature K (details in the SM [32]). The color mapping of the second derivative [Fig. 3(c)] displays fine structures of the plasmon splitting. The two modes above 250 K correspond to the and in Fig. 2(a). With the plasmon energy decreasing upon cooling, the plasmon moves further away from the phonon with energy and the PPC weakens, resulting in the less discernible mode below 250 K. Additionally, the plasmon should have been split again by the phonon with energy when it approaches this phonon. The splitting mode with lower energy is so close to the zero loss peak that it merges into it and therefore cannot be resolved.
To further quantitatively determine the temperature dependence of the plasmon, the aforementioned Drude-Lorentz fitting was conducted while keeping the phonon energies unchanged (more fitting results in the SM [32]). The fitting results [Fig. 3(d) and (e)] can unambiguously reproduce all the experimental features, including the non-monotonic trend of the plasmon envelope [Fig. 3(b) and (d)] and the PPC induced-splitting [Fig. 3(c) and (e)]. The screened plasmon energy as a function of temperature is now extracted with high precision.
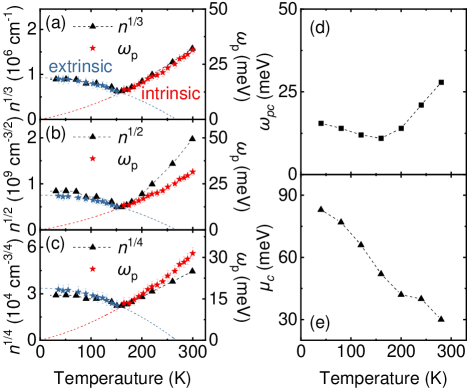
Plasmon in the 3D Dirac electron system.—The above quantitative temperature dependence can be utilized to clarify the topological properties of ZrTe5. In a 3D parabolic electron system [the case in Fig. 1(a)], the plasmon energy is proportional to the carrier density to the power of 1/2, i.e. [45]. However, in a massless Dirac electron system [the case in Fig. 1(b)], the plasmon energy follows [28], where is the dimension, yielding for and for . The comparison between the plasmon energy and the carrier density is shown in Fig. 4 (the carrier density data from Ref. [34]). The plasmon energy is almost entirely described by [Fig. 4(a)] for 3D Dirac systems instead of [Fig. 4(b)] for 3D parabolic systems or for 2D Dirac systems [Fig. 4(c)]. In massive 3D Dirac systems [the case in Fig. 1(c)], will deviate very slightly from . Our results display a very subtle trend, with the mass gradually increasing as the temperature rises (see details in the SM [32]). This provides solid evidence that the plasmon observed in ZrTe5 is a collective excitation composed of the 3D Dirac electrons. Thus the ground topological states of ZrTe5 could be either a 3D Dirac semimetal (including massless or massive) or a hyperbolic topological insulator.
Our measurements rule out the possibility that ZrTe5 is a conventional topological insulator with parabolic bulk bands. Unfortunately, it is still hard to distinguish between a massive Dirac semimetal and a hyperbolic topological insulator, the latter of which has yet to be explored either theoretically or experimentally.
The behavior that the plasmon energy and the carrier density first decrease and then increase upon warming is an inherent property of the 3D Dirac system. The extrinsic 3D Dirac system [28], where the chemical potential locates above the Dirac point at zero temperature. In an intrinsic Dirac system, where the zero-temperature chemical potential locates at the Dirac point, the carrier density and the plasmon energy monotonically increase with the temperature increasing following due to the thermal excitation and ultraviolet renormalization [28], which is called the intrinsic effect of a Dirac system. However, in an extrinsic Dirac system, the zero-temperature chemical potential, locates away from the Dirac point, offering finite carrier density and plasmon energy . As temperature increases, thermal excitations of carriers pull towards the valance band in the condition of the particle number conservation, and then the plasmon energy monotonically decreases following [28], which is called the extrinsic effect of the Dirac system. Upon reaching sufficiently high temperatures, where is brought close to the valence band, the system undergoes an extrinsic-intrinsic crossover around the cross temperature , and eventually displays intrinsic effects at high temperatures. Overall, an extrinsic Dirac system is dominated by the extrinsic and intrinsic effects below and above , respectively. This phenomenon has been previously observed in 3D Dirac systems Na3Bi and Cd3As2 [46]. Our first-principles calculations (see details in the SM [32]) of ZrTe5 have successfully reproduced the non-monotonic dependence of the plasmon energy on temperature [Fig. 4(d)], with monotonically approaching the valence band [Fig. 4(e)]. When the mobility change is minimal 222In Ref. [34], the carrier type changes from electrons to holes across 135 K, since the chemical potential shifts towards the pocket with smaller density of states as the temperature increases. This can partially affect the resistance, but has no impact on the total carrier density ., the resistivity follows in a 3D Dirac system. Therefore, the resistivity anomaly [largest resistance corresponding to the lowest at ] can be primarily attributed to the shift in chemical potential and the enhancement of thermal excitations, without the requirement of a topological phase transition [17].
In the extrinsic region, the plasmon and the chemical potential follow the relation and [28]. Here, represents the plasmon frequency at zero temperature, and is the Fermi temperature. By fitting the data in the extrinsic region, we obtained K and meV. Meanwhile, we also noticed that the linear optical conductivity is truncated at about 70 meV near zero temperature [34], which is consistent with .
Discussion.—The extrinsic-intrinsic crossover mechanism can also be applied to samples grown by the self-flux method [33, 34], resulting in a smaller and a lower . This is consistent with the smaller truncation energy in the optical conductivity (about 28 meV [34]) and the lower K [33, 34] compared to the samples grown by the CVT method. Furthermore, these differences between samples can be attributed to the influence of the Te defects [24] on the value of the chemical potential . In general, the dependence of on samples highlights the significant influence of the chemical potential in ZrTe5, thereby consolidating the self-consistency of the extrinsic-intrinsic crossover mechanism. Besides, the sensitivity to significantly impacts the temperature-dependent behavior of plasmons in topological semimetals, as evidenced by our recent research [48]. Our study provides a convincing example of investigating the topological properties by observing collective excitations, which is widely applicable to other topological materials.
After clarifying the topological ground state and the resistance anomaly, Dirac polarons could emerge as the next captivating subject in ZrTe5. A polaron mechanism is proposed to describe the gap opening in ZrTe5 [49], with experiments revealing a monotonically increasing gap [50]. Regarding the formation mechanism of the Dirac polarons, a Fermi liquid system evolves into a polaronic system when its plasmon energy falls below the optical phonon energy [51]. In our results, the plasmon splitting distinctly demonstrates that the plasmon energy descends below the optical phonon [Fig. 3(d) and (e)] during cooling with a non-negligible PPC, satisfying the condition for the formation of the Dirac polarons.
Conclusion.—We employed HREELS to study the temperature-dependent collective excitations of ZrTe5. Our results show that the plasmon energy in ZrTe5 exhibits a distinct behavior proportional to the 1/3 power of the carrier density, which is a characteristic feature of plasmons in 3D Dirac systems. This rules out the possibility that ZrTe5 is a conventional topological insulator with parabolic bulk bands. The ground topological state of ZrTe5 could be either a three-dimensional Dirac semimetal (including massless or massive) or a hyperbolic topological insulator. We attribute the origin of the resistivity anomaly in ZrTe5 to the inherent extrinsic-intrinsic crossover of the Dirac systems, where the decrease in chemical potential dominates the low-temperature extrinsic regime and thermal excitation dominates the high-temperature intrinsic regime. We also observed the PPC at all temperatures below 300 K, which may indicate the possible formation of the Dirac polarons in ZrTe5. Our study provides a convincing example of investigating the topological properties by observing collective excitations, which is widely applicable to other topological materials.
Acknowledgements.
This work was supported by the National Key R&D Program of China (No. 2021YFA1400200 and No. 2022YFA1403000), the National Natural Science Foundation of China (No. 12274446 and No. 11874404), and the Strategic Priority Research Program of Chinese Academy of Sciences (No. XDB33000000). X. Z. was partially supported by the Youth Innovation Promotion Association of Chinese Academy of Sciences. Y. S. was partially supported by the National Natural Science Foundation of China (Grants No. U2032204) and the Informatization Plan of Chinese Academy of Sciences(CAS-WX2021SF-0102).References
- Sarma et al. [2015] S. D. Sarma, M. Freedman, and C. Nayak, Majorana zero modes and topological quantum computation, npj Quantum Inf. 1, 1 (2015).
- Lutchyn et al. [2018] R. M. Lutchyn, E. P. a. M. Bakkers, L. P. Kouwenhoven, P. Krogstrup, C. M. Marcus, and Y. Oreg, Majorana zero modes in superconductor–semiconductor heterostructures, Nat. Rev. Mater. 3, 52 (2018).
- Burkov [2016] A. A. Burkov, Topological semimetals, Nat. Mater. 15, 1145 (2016).
- Hasan and Kane [2010] M. Z. Hasan and C. L. Kane, Colloquium: Topological insulators, Rev. Mod. Phys. 82, 3045 (2010).
- Xia et al. [2009] Y. Xia, D. Qian, D. Hsieh, L. Wray, A. Pal, H. Lin, A. Bansil, D. Grauer, Y. S. Hor, R. J. Cava, and M. Z. Hasan, Observation of a large-gap topological-insulator class with a single Dirac cone on the surface, Nature Phys 5, 398 (2009).
- Lv et al. [2021] B. Q. Lv, T. Qian, and H. Ding, Experimental perspective on three-dimensional topological semimetals, Rev. Mod. Phys. 93, 025002 (2021).
- Lv et al. [2019] B. Lv, T. Qian, and H. Ding, Angle-resolved photoemission spectroscopy and its application to topological materials, Nat. Rev. Phys. 1, 609 (2019).
- Murakami [2007] S. Murakami, Phase transition between the quantum spin Hall and insulator phases in 3D: Emergence of a topological gapless phase, New J. Phys. 9, 356 (2007).
- Murakami and Kuga [2008] S. Murakami and S.-i. Kuga, Universal phase diagrams for the quantum spin Hall systems, Phys. Rev. B 78, 165313 (2008).
- Castelvecchi [2017] D. Castelvecchi, The strange topology that is reshaping physics, Nature 547, 272 (2017).
- Weng et al. [2014] H. Weng, X. Dai, and Z. Fang, Transition-Metal Pentatelluride ZrTe5 and HfTe5: A Paradigm for Large-Gap Quantum Spin Hall Insulators, Phys. Rev. X 4, 011002 (2014).
- Okada et al. [1980] S. Okada, T. Sambongi, and M. Ido, Giant Resistivity Anomaly in ZrTe5, J. Phys. Soc. Jpn. 49, 839 (1980).
- Stillwell et al. [1989] E. P. Stillwell, A. C. Ehrlich, G. N. Kamm, and D. J. Gillespie, Effect of elastic tension on the electrical resistance of HfTe5 and ZrTe5, Phys. Rev. B 39, 1626 (1989).
- Jones et al. [1982] T. Jones, W. Fuller, T. Wieting, and F. Levy, Thermoelectric power of HfTe5 and ZrTe5, Solid State Commun. 42, 793 (1982).
- Rubinstein [1999] M. Rubinstein, HfTe5 and ZrTe5: Possible polaronic conductors, Phys. Rev. B 60, 1627 (1999).
- Chi et al. [2017] H. Chi, C. Zhang, G. Gu, D. E. Kharzeev, X. Dai, and Q. Li, Lifshitz transition mediated electronic transport anomaly in bulk ZrTe5, New J. Phys. 19, 015005 (2017).
- Xu et al. [2018] B. Xu, L. X. Zhao, P. Marsik, E. Sheveleva, F. Lyzwa, Y. M. Dai, G. F. Chen, X. G. Qiu, and C. Bernhard, Temperature-driven topological phase transition and intermediate Dirac semimetal phase in ZrTe5, Phys. Rev. Lett. 121, 187401 (2018).
- Li et al. [2016a] Q. Li, D. E. Kharzeev, C. Zhang, Y. Huang, I. Pletikosić, A. V. Fedorov, R. D. Zhong, J. A. Schneeloch, G. D. Gu, and T. Valla, Chiral magnetic effect in ZrTe5, Nat. Phys. 12, 550 (2016a).
- Manzoni et al. [2016] G. Manzoni, L. Gragnaniello, G. Autès, T. Kuhn, A. Sterzi, F. Cilento, M. Zacchigna, V. Enenkel, I. Vobornik, L. Barba, F. Bisti, P. Bugnon, A. Magrez, V. N. Strocov, H. Berger, O. V. Yazyev, M. Fonin, F. Parmigiani, and A. Crepaldi, Evidence for a Strong Topological Insulator Phase in ZrTe5, Phys. Rev. Lett. 117, 237601 (2016).
- Shen et al. [2017] L. Shen, M. X. Wang, S. C. Sun, J. Jiang, X. Xu, T. Zhang, Q. H. Zhang, Y. Y. Lv, S. H. Yao, Y. B. Chen, M. H. Lu, Y. F. Chen, C. Felser, B. H. Yan, Z. K. Liu, L. X. Yang, and Y. L. Chen, Spectroscopic evidence for the gapless electronic structure in bulk ZrTe5, J. Electron Spectrosc. Relat. Phenom. 219, 45 (2017).
- Zhang et al. [2017] Y. Zhang, C. Wang, L. Yu, G. Liu, A. Liang, J. Huang, S. Nie, X. Sun, Y. Zhang, B. Shen, et al., Electronic evidence of temperature-induced lifshitz transition and topological nature in ZrTe5, Nat. Comm. 8, 1 (2017).
- Zhang et al. [2021] P. Zhang, R. Noguchi, K. Kuroda, C. Lin, K. Kawaguchi, K. Yaji, A. Harasawa, M. Lippmaa, S. Nie, H. Weng, V. Kandyba, A. Giampietri, A. Barinov, Q. Li, G. D. Gu, S. Shin, and T. Kondo, Observation and control of the weak topological insulator state in ZrTe5, Nat. Commun. 12, 406 (2021).
- Li et al. [2016b] X.-B. Li, W.-K. Huang, Y.-Y. Lv, K.-W. Zhang, C.-L. Yang, B.-B. Zhang, Y. B. Chen, S.-H. Yao, J. Zhou, M.-H. Lu, L. Sheng, S.-C. Li, J.-F. Jia, Q.-K. Xue, Y.-F. Chen, and D.-Y. Xing, Experimental Observation of Topological Edge States at the Surface Step Edge of the Topological Insulator ZrTe5, Phys. Rev. Lett. 116, 176803 (2016b).
- Salzmann et al. [2020] B. Salzmann, A. Pulkkinen, B. Hildebrand, T. Jaouen, S. N. Zhang, E. Martino, Q. Li, G. Gu, H. Berger, O. V. Yazyev, A. Akrap, and C. Monney, Nature of native atomic defects in ZrTe5 and their impact on the low-energy electronic structure, Phys. Rev. Materials 4, 114201 (2020).
- Das Sarma and Hwang [2009] S. Das Sarma and E. H. Hwang, Collective Modes of the Massless Dirac Plasma, Phys. Rev. Lett. 102, 206412 (2009).
- Sachdeva et al. [2015] R. Sachdeva, A. Thakur, G. Vignale, and A. Agarwal, Plasmon modes of a massive Dirac plasma, and their superlattices, Phys. Rev. B 91, 205426 (2015).
- Stauber [2014] T. Stauber, Plasmonics in Dirac systems: From graphene to topological insulators, J. Phys. Condens. Matter 26, 123201 (2014).
- Hofmann and Das Sarma [2015] J. Hofmann and S. Das Sarma, Plasmon signature in Dirac-Weyl liquids, Phys. Rev. B 91, 241108 (2015).
- Note [1] The possibility of a hyperbolic Dirac band with non-zero mass cannot be excluded, which will be discussed in the SM [32].
- Zhu et al. [2015] X. Zhu, Y. Cao, S. Zhang, X. Jia, Q. Guo, F. Yang, L. Zhu, J. Zhang, E. W. Plummer, and J. Guo, High resolution electron energy loss spectroscopy with two-dimensional energy and momentum mapping, Rev. Sci. Instrum. 86, 083902 (2015).
- Giannozzi et al. [2009] P. Giannozzi, S. Baroni, N. Bonini, M. Calandra, R. Car, C. Cavazzoni, D. Ceresoli, G. L. Chiarotti, M. Cococcioni, I. Dabo, A. D. Corso, S. de Gironcoli, S. Fabris, G. Fratesi, R. Gebauer, U. Gerstmann, C. Gougoussis, A. Kokalj, M. Lazzeri, L. Martin-Samos, N. Marzari, F. Mauri, R. Mazzarello, S. Paolini, A. Pasquarello, L. Paulatto, C. Sbraccia, S. Scandolo, G. Sclauzero, A. P. Seitsonen, A. Smogunov, P. Umari, and R. M. Wentzcovitch, QUANTUM ESPRESSO: A modular and open-source software project for quantum simulations of materials, J. Phys. Condens. Matter 21, 395502 (2009).
- [32] See Supplemental Material at http://link.aps.org/. supplemental for details about sample preparation, experimental methods, identification of the HREELS features, fitting methods, and calculations, which includes Refs.[52, 53, 30, 31, 54, 55, 56, 57, 58, 59, 60, 61, 44, 33, 17, 34, 28, 26, 62] .
- Chen et al. [2015] R. Y. Chen, S. J. Zhang, J. A. Schneeloch, C. Zhang, Q. Li, G. D. Gu, and N. L. Wang, Optical spectroscopy study of the three-dimensional Dirac semimetal ZrTe5, Phys. Rev. B 92, 075107 (2015).
- Martino et al. [2019] E. Martino, I. Crassee, G. Eguchi, D. Santos-Cottin, R. D. Zhong, G. D. Gu, H. Berger, Z. Rukelj, M. Orlita, C. C. Homes, and A. Akrap, Two-Dimensional Conical Dispersion in ZrTe5 Evidenced by Optical Spectroscopy, Phys. Rev. Lett. 122, 217402 (2019).
- Matz and Lüth [1981] R. Matz and H. Lüth, Conduction-Band Surface Plasmons in the Electron-Energy-Loss Spectrum of GaAs(110), Phys. Rev. Lett. 46, 500 (1981).
- Liu and Willis [2010] Y. Liu and R. F. Willis, Plasmon-phonon strongly coupled mode in epitaxial graphene, Phys. Rev. B 81, 081406 (2010).
- Koch et al. [2010] R. J. Koch, T. Seyller, and J. A. Schaefer, Strong phonon-plasmon coupled modes in the graphene/silicon carbide heterosystem, Phys. Rev. B 82, 201413 (2010).
- Koch et al. [2016] R. J. Koch, S. Fryska, M. Ostler, M. Endlich, F. Speck, T. Hänsel, J. A. Schaefer, and T. Seyller, Robust Phonon-Plasmon Coupling in Quasifreestanding Graphene on Silicon Carbide, Phys. Rev. Lett. 116, 106802 (2016).
- Kaplan et al. [1967] R. Kaplan, E. D. Palik, R. F. Wallis, S. Iwasa, E. Burstein, and Y. Sawada, Infrared Absorption by Coupled Collective Cyclotron Excitation-Longitudinal-Optic Phonon Modes in InSb, Phys. Rev. Lett. 18, 159 (1967).
- McMahon and Bell [1969] T. J. McMahon and R. J. Bell, Infrared Reflectivity of Doped InSb and CdS, Phys. Rev. 182, 526 (1969).
- Olson and Lynch [1969] C. G. Olson and D. W. Lynch, Longitudinal-Optical-Phonon-Plasmon Coupling in GaAs, Phys. Rev. 177, 1231 (1969).
- Kukharskii [1973] A. A. Kukharskii, Plasmon-phonon coupling in GaAs, Solid State Commun. 13, 1761 (1973).
- Kozawa et al. [1994] T. Kozawa, T. Kachi, H. Kano, Y. Taga, M. Hashimoto, N. Koide, and K. Manabe, Raman scattering from LO phonon-plasmon coupled modes in gallium nitride, J. Appl. Phys. 75, 1098 (1994).
- Lambin et al. [1990] P. Lambin, J.-P. Vigneron, and A. Lucas, Computation of the surface electron-energy-loss spectrum in specular geometry for an arbitrary plane-stratified medium, Comput. Phys. Commun. 60, 351 (1990).
- Bohm and Pines [1953] D. Bohm and D. Pines, A Collective Description of Electron Interactions: III. Coulomb Interactions in a Degenerate Electron Gas, Phys. Rev. 92, 609 (1953).
- Jenkins et al. [2016] G. S. Jenkins, C. Lane, B. Barbiellini, A. B. Sushkov, R. L. Carey, F. Liu, J. W. Krizan, S. K. Kushwaha, Q. Gibson, T.-R. Chang, H.-T. Jeng, H. Lin, R. J. Cava, A. Bansil, and H. D. Drew, Three-dimensional Dirac cone carrier dynamics in Na3Bi and Cd3As2, Phys. Rev. B 94, 085121 (2016).
- Note [2] In Ref. [34], the carrier type changes from electrons to holes across 135 K, since the chemical potential shifts towards the pocket with smaller density of states as the temperature increases. This can partially affect the resistance, but has no impact on the total carrier density .
- Li et al. [2023] Y. Li, M. Wang, Y. Li, S. Xue, J. Li, Z. Tao, X. Han, J. Zhou, Y. Shi, J. Guo, and X. Zhu, Nodal-line plasmons in ZrSiX (X = S, Se, Te) and their temperature dependence, Phys. Rev. B 107, 155421 (2023).
- Fu et al. [2020] B. Fu, H.-W. Wang, and S.-Q. Shen, Dirac Polarons and Resistivity Anomaly in ZrTe5 and HfTe5, Phys. Rev. Lett. 125, 256601 (2020).
- Mohelsky et al. [2023] I. Mohelsky, J. Wyzula, B. A. Piot, G. D. Gu, Q. Li, A. Akrap, and M. Orlita, Temperature dependence of the energy band gap in ZrTe5 for the topological phase, Phys. Rev. B 107, L041202 (2023).
- Verdi et al. [2017] C. Verdi, F. Caruso, and F. Giustino, Origin of the crossover from polarons to fermi liquids in transition metal oxides, Nat. Comm. 8, 1 (2017).
- Raether [2006] H. Raether, Excitation of plasmons and interband transitions by electrons (Springer, 2006).
- Ibach and Mills [2013] H. Ibach and D. L. Mills, Electron energy loss spectroscopy and surface vibrations (Academic press, 2013).
- Perdew et al. [1996] J. P. Perdew, K. Burke, and M. Ernzerhof, Generalized Gradient Approximation Made Simple, Phys. Rev. Lett. 77, 3865 (1996).
- Hamann [2013] D. R. Hamann, Optimized norm-conserving Vanderbilt pseudopotentials, Phys. Rev. B 88, 085117 (2013).
- Monkhorst and Pack [1976] H. J. Monkhorst and J. D. Pack, Special points for Brillouin-zone integrations, Phys. Rev. B 13, 5188 (1976).
- Num [2006] Numerical Optimization, Springer Series in Operations Research and Financial Engineering (Springer New York, 2006).
- Wooten and Davis [1973] F. Wooten and S. P. Davis, Optical Properties of Solids, Amer. J. Phys. 41, 939 (1973).
- Colle et al. [2007] R. Colle, P. Parruccini, A. Benassi, and C. Cavazzoni, Optical Properties of Emeraldine Salt Polymers from Ab Initio Calculations: Comparison with Recent Experimental Data, J. Phys. Chem. B 111, 2800 (2007).
- Calzolari et al. [2014] A. Calzolari, A. Ruini, and A. Catellani, Transparent Conductive Oxides as Near-IR Plasmonic Materials: The Case of Al-Doped ZnO Derivatives, ACS Photonics 1, 703 (2014).
- Fjellvåg and Kjekshus [1986] H. Fjellvåg and A. Kjekshus, Structural properties of ZrTe5 and HfTe5 as seen by powder diffraction, Solid State Commun. 60, 91 (1986).
- Jiang et al. [2022] Y. Jiang, T. Zhao, L. Zhang, Q. Chen, H. Zhou, M. Ozerov, D. Smirnov, and Z. Jiang, Anomalous temperature evolution of the Dirac band in ZrTe5 across topological phase transition (2022), arXiv:2211.16711 [cond-mat] .