LeakyOhm: Secret Bits Extraction using Impedance Analysis
Abstract.
The threats of physical side-channel attacks and their countermeasures have been widely researched. Most physical side-channel attacks rely on the unavoidable influence of computation or storage on current consumption or voltage drop on a chip. Such data-dependent influence can be exploited by, for instance, power or electromagnetic analysis. In this work, we introduce a novel non-invasive physical side-channel attack, which exploits the data-dependent changes in the impedance of the chip. Our attack relies on the fact that the temporarily stored contents in registers alter the physical characteristics of the circuit, which results in changes in the die’s impedance. To sense such impedance variations, we deploy a well-known RF/microwave method called scattering parameter analysis, in which we inject sine wave signals with high frequencies into the system’s power distribution network (PDN) and measure the echo of the signals. We demonstrate that according to the content bits and physical location of a register, the reflected signal is modulated differently at various frequency points enabling the simultaneous and independent probing of individual registers. Such side-channel leakage challenges the -probing security model assumption used in masking, which is a prominent side-channel countermeasure. To validate our claims, we mount non-profiled and profiled impedance analysis attacks on hardware implementations of unprotected and high-order masked AES. We show that in the case of the profiled attack, only a single trace is required to recover the secret key. Finally, we discuss how a specific class of hiding countermeasures might be effective against impedance leakage.
1. Introduction
Physical side-channel leakages can compromise the security of cryptographic implementations on integrated circuits (ICs). Such leakages exist due to the inevitable impact of computation and storage on current consumption or voltage drop on a chip. These data-dependent fluctuations reveal themselves through various measurable quantities, such as power consumption (Kocher, 1996), electromagnetic emanation (Kocher et al., 1999), acoustic waves (Genkin et al., 2017), photon emission (Ferrigno and Hlaváč, 2008), and thermal radiation (Hutter and Schmidt, 2014). Over the last decades, these quantities have been exploited in different classes of side-channel analysis (SCA) attacks for breaking the security of various cryptographic implementations. At the same time, various countermeasures (e.g., hiding and masking) have been developed to defeat these attacks.
While current and voltage alterations have been considered the root cause of side-channel leakages, the data-dependent variation of the parameter relating current and voltage to each other via Ohm’s law, i.e., impedance, has always been ignored. The primary assumption has been that impedance is a constant parameter that is determined by the materials used in the fabrication of the PCB, chip’s die, and package. Hence, it is defined by the physical structure and size of the chip rather than the running computation on a system or stored content on a chip. For instance, adding/removing a circuit to/from a chip can cause changes in the impedance of the die. Such changes have been the basis of some hardware Trojan and tamper detection methods (on both chips (Nguyen et al., 2019, 2020; Mosavirik et al., 2023a) and PCBs (Zhu et al., 2022; Mosavirik et al., 2023b, 2022)), where the malicious circuits modify the impedance of the system and, thus, can be detected. However, the effect of the circuit state or content of memory elements inside the chip on information leakage through the die’s impedance has not been studied so far.
The contribution of impedance to side-channel leakage could be implicitly observed in a specific class of SCA attacks, namely static power analysis (Moradi, 2014). For this attack, the adversary halts the circuit and exploits the data-dependent static current consumption of transistors in steady states. It was shown that the state of flip-flops on a chip leads to static current variations, leading to successful key recovery using differential power analysis (DPA). The fluctuation in the static current is indeed caused by changes in the overall impedance of the die; however, the focus in static SCA attacks (Moradi, 2014; Moos, 2019a; Cassiers et al., 2023) has been on the measurable quantity, i.e., the static current and the role of the impedance has never been discussed.
Driven by the fact that impedance is also affected by the stored content on a chip, the following research questions arise: (1) Is it possible to measure the information leakage through the impedance directly? (2) What would be the consequence of impedance analysis for prominent side-channel countermeasures, i.e., masking?
Our Contribution. To answer the above questions, we present a novel non-invasive SCA attack based on directly characterizing the chip’s impedance. Our method relies on a known RF/microwave impedance characterization technique called scattering parameter analysis, in which we inject electrical sine waves with different frequencies into the power delivery network (PDN) of the chip and measure the echoes of the signals. We demonstrate that the reflected signals are modulated uniquely at various frequency points based on the register contents and physical location of a register on the chip. The transistor’s imperfections, asymmetric logic gates, and interconnects with various lengths contribute to impedance variations and, consequently, to the modulation of the reflected signals. We show that analyzing these echoes at different frequencies enables the adversary to profile register contents and read them out simultaneously in the attack phase. Therefore, such analyses provide a large number of virtual probes for different locations of the chip in the frequency domain during a time period, which challenges the central underlying assumption of the -probing security model for masking schemes. To validate our claims, we launch an impedance-based SCA attack on unmasked and masked AES designs implemented on a Field Programmable Gate Array (FPGA) manufactured with a 28 nm technology. As a result, we successfully break the security of the targeted implementations by recovering their keys.
Remark. The primary contribution of this work is the introduction of a new physical side-channel based on impedance analysis. A comparative experimental study between impedance analysis and other side-channels, specifically power side-channels, requires a unified setup(Del Pozo et al., 2015) and deserves a future study.
2. Technical Background
2.1. Power distribution network (PDN)
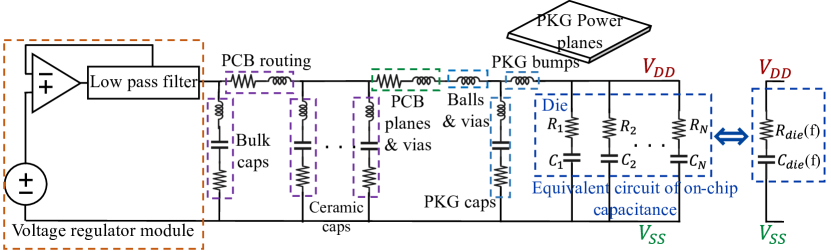
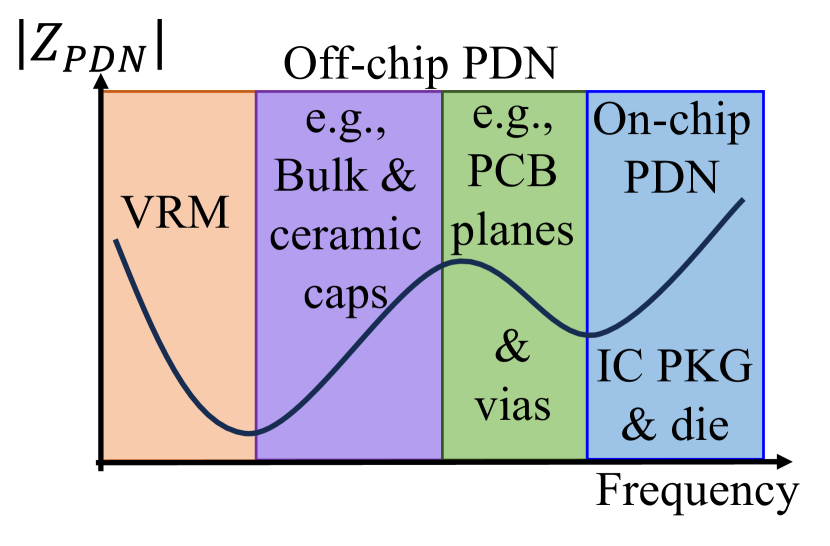
The PDN is responsible for delivering low noise and constant voltage supply to the electronic components on the PCB, from the voltage regulator module (VRM) to the power rails on the chip. Each component has a distinct contribution to the physical signature of the PDN at different frequency regimes. The system’s PDN is represented by an equivalent circuit model shown in Figure 1(a). The PDN comprises both off-chip and on-chip components, including bulk capacitors, PCB routing, ceramic capacitors, PCB planes, vias, package bumps, on-chip power planes, and transistor capacitance. The impedance contribution of these components to the overall PDN’s impedance is different at various frequency bands. The voltage regulator’s and off-chip components’ impedance dominate the PDN’s impedance at lower frequencies, while on-chip components contribute mostly to the impedance at higher frequencies, as shown in Figure 1(b). The parasitic inductance present on each capacitor is the primary cause of this impedance behavior. At high frequencies, an ideal capacitor behaves like a short circuit. However, the parasitic inductance on the capacitor’s metals results in resonance at a particular frequency, causing it to become an open circuit at very high frequencies. Smaller capacitors have less parasitic inductance and resonate at higher frequencies. As a result, as the frequency increases, all capacitors, from large to small, become open circuits and have less impact on the PDN impedance. The PDN impedance at higher frequencies is dominated by the on-chip structures due to their smaller dimensions, as shown in Figure 1(b).
The dashed blue region in Figure 1(a) shows the equivalent RC model of the on-chip capacitance. To model the wideband on-chip behavior of the circuit, multiple narrowband parallel RC circuits (N in total) are connected to and . The succeeding subsection provides further details on the origins of on-chip PDN impedance.
2.2. Sources of On-die Impedance
On-die capacitance and resistance are the dominant features of the on-chip impedance in high-frequency bands (Smith et al., 2011). The ranges of such frequency bands are determined based on the chip’s technology and size. Here, we explain the sources of on-die capacitance using the physical structure of a CMOS inverter. Figure 2 shows the cross-sectional view of an inverter, metal power grid layers, and the locations of the corresponding on-die capacitors. According to Figure 2, an inverter comprises a PMOS and an NMOS transistor. These transistors serve as switches, with the NMOS having an infinite off-resistance and a finite on-resistance. Meanwhile, the PMOS has a positively doped source, drain, and gate region in the form of an n-well. The On-die capacitance is affected by several elements, including the metal layers grid network, non-switching gate, and p-n diode junction diffusion (Smith et al., 2011). Resistance in the power net, transistor channel, transistor gate, and contacts of n-well and P-substrate contribute to (MacEachem et al., 2017).
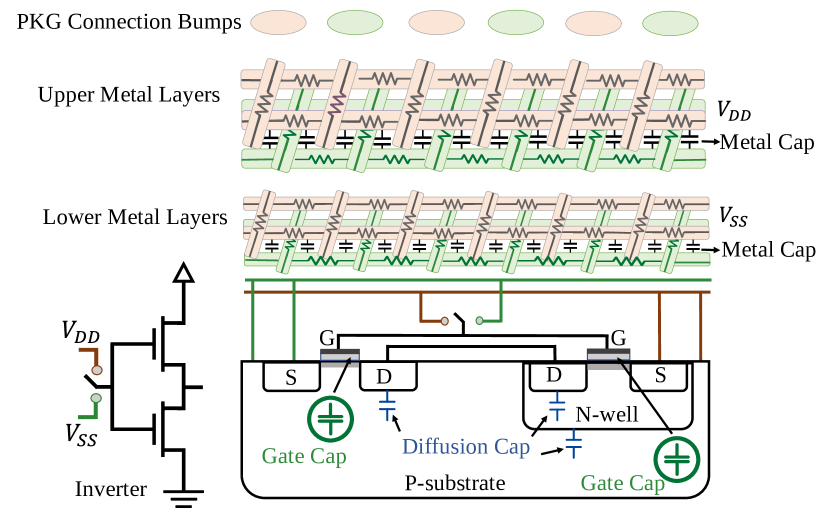
The location of each capacitance that contributes to is shown in Figure 2 using different colors. The black color represents the metal capacitance, , which pertains to the power/ground metallization grid network located on the die. The size of is affected by the density of the grid network, the width and distance of metal layers, and the permittivity of materials. Typically, is larger in upper metal layers due to denser power and ground meshes, while it is slightly smaller in lower metal layers because the power traces are less dense and thinner. The blue color corresponds to the diffusion capacitance, , which relates to the p-n diode junctions. It is essential to note that and only contribute to a small portion of the total , while the non-switching gate capacitance, , is the main contributor.
On the chip’s PDN, all non-switching and powered-on circuits contribute to . This is because when a transistor is powered on, it has a channel underneath the gate, contributing to . On the other hand, when a transistor is powered off, its channel is inactive and does not significantly contribute to on-die capacitance. Initially, when the device is not powered on, the decoupling capacitance effect of the gates is negligible. However, when the device is turned on, the channels start to form, and as a result, becomes the dominant contributor to . If the chip’s design is modified, different parts of (particularly ) would change based on the size, location, and nature of the tamper event. This modification changes the equivalent circuit of the on-chip PDN and affects the measured signatures from the chip.
2.3. Non-invasive Impedance Characterization
To characterize the impedance of the PDN in different frequencies, S (Scattering) or Z (Impedance) parameters are deployed (Bogatin, 2010; Pupalaikis, 2020). Every circuit/electronic component can be described as a one or multi-port network. S parameters directly represent the attenuation, reflection transmission ratio of the signal at each port of such network over the frequency domain to the applied electromagnetic field (Pozar, 2011). For instance, quantifies how much power is reflected from the the port 1 if the EM field is transmitted from port 1. In frequency domain analysis, waveforms are represented by sine waves. Frequency, amplitude, and phase are the three terms that can fully characterize a sine wave. Thus, we utilize both the amplitude and phase response in the frequency domain to accurately characterize the chip at each frequency point. A Vector Network Analyzer (VNA) is an instrument that measures the transmitted and/or reflected power of a signal that goes into and comes back from a component. We use a VNA to inject sine waves into the chip at every frequency point to record the chip’s PDN’s reflected response . The impedance profile can be easily derived from the reflection coefficient. Equation 1 expresses the relationship between the input impedance of the device under test (DUT) and the reflection coefficient:
| (1) |
where is the reflection coefficient, represents the reference impedance of the VNA which is , and corresponds to the impedance obtained from . We only deploy in our proposed method as the VNA can directly measure it from the chip. However, based on Equation 1, it is observable that the reflection coefficient is another representation of the impedance.
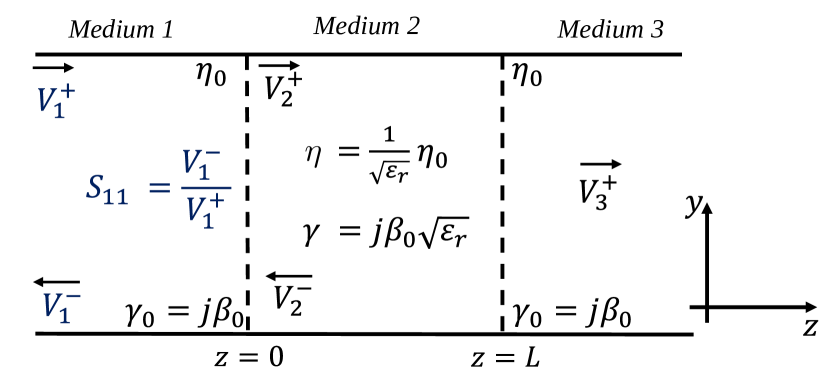
We further explain the changes that occur to the injected voltage wave by the VNA into the chip by analyzing the ideal transmission line model. This model is the backbone of more complex circuits, and understanding its theoretical foundation clarifies our methodology’s mechanism. Figure 3 shows an ideal transmission line model where there is a change in the characteristic impedance and propagation constant of medium 2 that are represented by and , respectively. For simplicity, we assume that medium 1 and medium 3 are lossless, thus giving a characteristic impedance of and a corresponding propagation constant of . We consider medium 2 a non-magnetic () medium with a relative permittivity of . Noting that and are the permittivity and permeability of the free space, respectively, and denotes the free space wave number, we can consider and rewrite the second medium’s propagation constant as . Considering , we can rewrite the characteristic impedance of medium 2 as . The VNA injects a voltage wave with the known amplitude of in medium 1, and the reflected voltage wave has an amplitude of . After is injected, multiple reflections and transmissions occur in the lines. Based on the model in Figure 3, the lines’ voltages can be written as (Pozar, 2011): , , and , where and () are forward and backward voltage waves through/from the medium ; however, we assume that there exists no backward voltage wave in medium 3, for simplicity.
is a known parameter (injected by VNA), whereas , , , and are unknown values. We apply the boundary conditions on the voltage wave components at the interfaces of the media and find all these four unknowns. We are interested in obtaining the in medium 1 which can be derived as
| (2) |
where is the length of the path that the injected wave voltage travels. From Equation 2, it can be concluded that the reflection coefficient depends on three parameters: the frequency band of interest, the relative permittivity of the sample, and the length of the wave’s traveling path. On the other hand, the dependence of on the frequency has another aspect: frequency and wavelength are inversely proportional to each other. This explains why we can detect smaller size changes in the chip’s configuration at higher frequencies. When registers with different placement and routing are exposed to the incident wave injected from the VNA, the changes occurring in Equation 2 parameters will result in a change in the profile at distinct frequencies. For example, when the placement and routing of the circuit is altered, L is changed, and this would cause the chip’s reflection response to be different for different placements and routings.
2.4. Masking and t-Probing Model
Masking is the prominent countermeasure against SCA attacks due to its sound theoretical and mathematical foundations. In masking schemes, the computation on a chip is distributed between a couple of shares (multi-party computation) and the intermediate computations dealing with the secrets (secret sharing). The number of shares defines the order of the masking and its resiliency against SCA and probing attacks. For cryptographic implementations, the key and plaintext should be represented in a shared form, and the entire computations are performed on shares. At the end of the computation, the ciphertext should be obtained by recombining the output shares. The main advantage of masking is that it can be evaluated in formal security models. For instance, in Boolean masking schemes, every random bit is represented by in such a way that . According to (Chari et al., 1999), an adversary who is limited to the th order SCA or the number of probes can be defeated by a secret sharing with shares. Moreover, it was shown that measurements of each share are adversely influenced by Gaussian noise, and thus, the number of noisy traces needed to extract grows exponentially with the number of shares (Prouff et al., 2009).
On the other hand, the -probing model, which was first introduced in the seminal work of Ishai et al. (Ishai et al., 2003) can be deployed for the security analysis of masking schemes. In this model, it is assumed that the attacker is limited to at most physical probes to observe the computation on wires of the circuit at each time period (e.g., one clock cycle). In such a case, at least shares are needed to prevent the attacker from learning any sensitive information from observations. It has been demonstrated that the two aforementioned leakage models are related by reducing the security in one model to the security of the other to unify the leakage models and so simplify the analysis of SCA countermeasures (Duc et al., 2019). In other words, placing physical probes on the wires of the target circuit is equivalent of th-order noisy SCA attack. While there have been some sophisticated SCA attacks violating this assumptions (Krachenfels et al., 2021a), for most practical SCA attacks, it is reasonable to assume that the adversary has a limited number of probes due to practical issues due to, for instance, the lack of spatial space (Specht et al., 2018; Kleindiek Nanotechnik GmbH, 2020) to accommodate several physical probes or increased noise in the case of higher-order power analysis. As a result, several constructions, security proofs, and multiple implementations have been reported.
Note that, in several countries, protection against SCA attacks is one of the criteria defined by certification bodies. Among various SCA countermeasures, masking schemes have been widely in use for more than a decade in many secure ICs, such as smartcard chips.
3. System-Level Impedance Analysis
In this section, we propose and describe a systematic approach to analyze and interpret impedance profiles as new side-channel leakage criteria for integrated circuits.
3.1. High-Level Representation
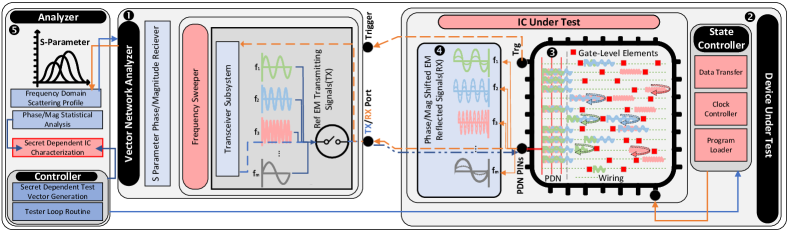
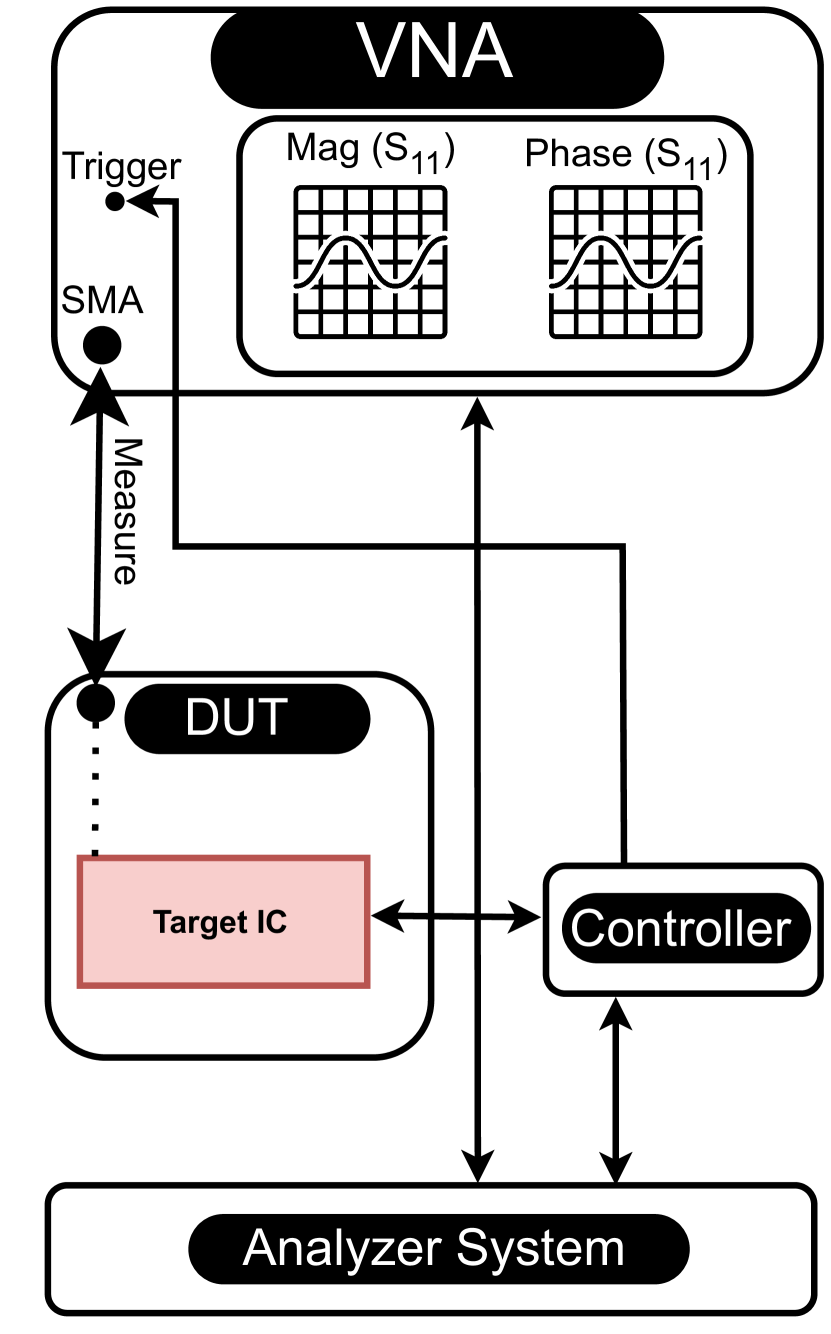
Although the nature of the back-scatter analysis is entirely non-invasive, the proposed SCA involves active measurements. Specifically, as indicated earlier, a series of test electromagnetic signals are generated in a tester device (e.g., VNA) and transmitted through the output port directly to the DUT’s PDN. Consequently, the signals are collected as input at the tester’s receiver, which can then be used to characterize the impedance of the DUT. Figure 4 depicts a high-level overview of the workflow, setup, and approach of our attack.
As indicated, in , VNA generates the test signals over a particular frequency band by employing an embedded programmable Frequency Sweeper. During the experiments, these signals are selected in the Transceiver Subsystem and are sent through the TX port of the VNA. At the same time in , DUT is equipped with a State Controller that preserves the target IC in a specific state. TX signals are received at IC’s PDN interface. As shown in , based on the frequency of the transmitted signal, each test signal propagates differently throughout the chip’s PDN, and hence, different propagation behavior of each of them yields in certain Magnitude and Phase when they are reflected back to the PDN pins ( ). Then, VNA detects and measures the reflected signal (RX) at each frequency and estimates scattering parameters (S-Parameters) as the final measurement. In , measurement data are sent to the analyzer for characterization. Analyzer performs an iterative profiling procedure to exploit the variations of reflected RX signals in both Magnitude and Phase at each selected frequency ().
3.2. Systematic Impedance Analysis
In order to apply the proposed attack as an end-to-end SCA, here we present an abstract and systematic definition of impedance analysis. Inspired by telecommunication methodologies and terminologies, we can consider a communication system to describe the workflow of our attack.
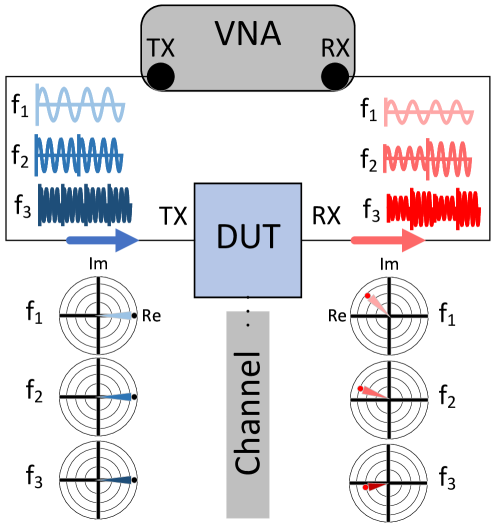
At the high-level, test signals at different frequencies, which are generated by the VNA, could be treated as data carries. The DUT is the noisy communication channel, and the received signals are the measurements that are to be analyzed and decoded. As depicted in Figure 5, a series of signals on pre-determined frequencies are transmitted with reference Magnitude and Phase of . The test signals are represented in a polar coordinate system in Figure 5. On the other hand, the received signals which are attenuated and distorted can also be represented as polar coordinate . The high-level goal here is to characterize the communication channel based on a set of received signals of . In the realm of telecommunications, the problem at hand here is categorized in the well-known sub-field of Channel Characterizations (Yin and Cheng, 2016). Although similar measurement methodologies seek to characterize the wireless channels (Čoja et al., 2017; Peng et al., 2016; Chaibi et al., 2015), we apply the same measuring methodology in the context of IC characterization to extract information. In other words, the channel characterization, in this case, yields information about the internals of the IC (specifically the contents of the registers). Hence, a systematic SCA could be accomplished by analyzing the set of with respect to the target state of the DUT during the measurements.
4. Physical-Level Analysis of Impedance Leakage
To perform SCA on the reflected signals from the chip’s die, it is vital to understand how the transmitted carrier signals are modulated based on the physical characteristics (and specifically the contents of the registers) on the chip. As described earlier, the system’s PDN (to and from the chip) can be considered a communication channel in high frequencies between a transmitter and a receiver. The VNA in our system is both the transmitter and the receiver on this channel. Therefore, the channel model is analogous to a RADAR channel model (Fens et al., 2008). In this case, the transmitted signal from the VNA at frequency can be written as follows:
| (3) |
where A is the amplitude of the transmitted signal. Considering the PDN of the chip as the entity that applies the desired information to the carrier , the amplitude and phase of are reshaped. Thus, the modulated signal , received at the VNA can be described (Trees et al., 2013):
| (4) |
where is the attenuation or fading factor, is the phase shift, is the round-trip time of the signal, and is a Gaussian noise added to the signal. In our case study, we experimentally show that the characterization of the PDN, which contains a data-dependent leakage, could be observed in the amplitude, phase, and round-trip time variations. However, since our analyzes in this paper are confined within the frequency domain data, we do not consider the round trip time as a leakage parameter.
4.1. Realization of Virtual Probes
As indicated in our approach, the transmit carrier signals are injected on a wide range of frequencies . As covered in Section 2.3, well-studied back-scattering PDN profiling confirms that even in nanometer-scale characterization, different circuit elements (i.e., inductors and capacitors) reflect (and forward) different portions of input energy in accordance with carrier frequency (Ichihashi and Kanaya, 2019) due to non-linearity in their frequency response (Billings, 2013). This frequency-dependent behavior of the elements in the microscopic scale is affected by physical and intrinsic (such as dimensions) features, which determines the resonate frequency of the elements (Quek et al., 2015). Hence, exploiting the same observation in our scenario, different input frequencies () yield capturing the response of different elements on the DUT. In accurate terms, the reflected signal at a particular frequency contains a dominant response of specific elements.
To illustrate this, Figure 6(a) shows a high-level cross-section block diagram of a simple PDN and a target IC. Here, an adversary generates using a VNA and injects the signals via the SMA interface. Based on the selected multiple Virtual Probes could be deployed to characterize the board. For instance, on-board capacitors (e.g., and ) are large elements, and their dominant response could be observed in with low-frequencies (MHz). This indicates that any modification on these elements could be observed in with those frequencies. In other words, by knowing those exact frequencies , the adversary can place a Virtual Probe on and . Sweeping to higher frequencies (GHz), the adversary will have multiple VProbes, on different elements (physical locations) on the chip to perform a powerful SCA. This capability is granted by the fact that IC-level elements are physically asymmetric and placed and routed uniquely on the die.
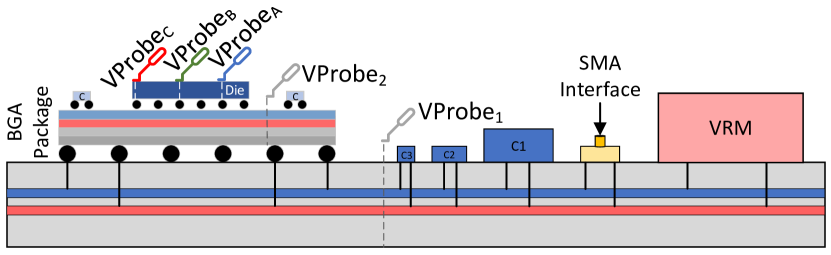
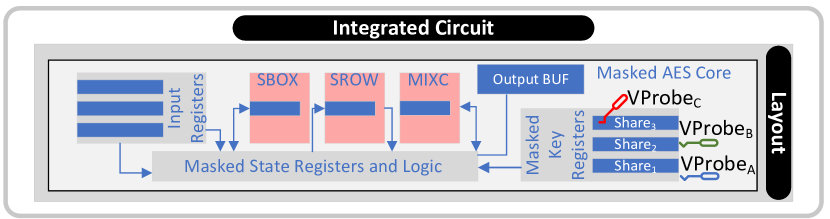
Figure 6(b) depicts the utilization of VProbes to effectively disable a Masked AES implementation on a target chip. We show that, with a proper profiling process, an attacker can precisely determine frequencies for each share of the masked key to extract all secret values simultaneously. It is also noteworthy to mention that in Figure 6(b), each target key register shows a dominant response on a specific frequency set, leading the adversary to distinguish the leakages.
4.2. Effects of Parallel Computation and Masking Schemes
Cryptography implementations in software fundamentally suffer from time-domain leakage caused by the serialized execution model. Many researchers have shown that even secured masking implementations could be easily broken by template attacks on software (Wu et al., 2022; Oswald and Mangard, 2006). In the case of masking implementations on hardware, with the assumption of parallel computing on shares, the data-dependent power leakage is experimentally shown to be reduced significantly (De Cnudde et al., 2018). The CMOS power consumption model in masking schemes assumes that expected power consumption P for a masked secret bit hold the following condition (De Cnudde et al., 2017):
| (5) |
Although decoupling effects (De Cnudde et al., 2017) and higher order attacks (Standaert et al., 2005) can exploit the aforementioned condition, considering the CMOS Hamming Weight model and as long as and computations are performed simultaneously at this constraint in Equation 5 is believed to be maintained. Compared to 1-d scalar power consumption measurements, impedance leakage is measured over set of samples of frequencies, making the leakage variable a 2-d parameter.
By applying the same condition on Impedance leakage, an ideal one-bit masking rules the following:
| (6) |
As thoroughly investigated in Section 4.1, constraints indicated in Equation 6 could not be trivially held by first order boolean masking, as the unique physical realizations, corresponding wiring and required routing for and computations yield in frequency-dependant measurements. Here in contrast to scalar power leakage model, impedance profile in Equation 6 should be satisfied for all frequency stamps to ensure the security. For instance, if impedance measurements are conducted from the bandwidth , Equation 6 should be held. In such strong constraint, one can derive , where and therefore impedance of masks values could be distinguished effectively.
5. Proposed Attack Scenarios
In this section, we will elaborate on multiple attack scenarios based on the developed scatter profile of the DUT. Ultimately, here we showcase that the proposed methodology could challenge t-probe security model. Based on our findings we exhibit that unlike power consumption side channels, impedance leakage collected from scattering profiles does not scale down exponentially (Chari et al., 1999; Ito et al., 2022) by increasing the number of shares. On the contrary, we showcase that the impedance leakages of t-share operands are leaked through distinguishable frequencies and do not cause significant additive noise to leakage measurement. In other words, although state-of-the-art masking schemes, such as Threshold Implementation (Reparaz et al., 2015) and Domain-Oriented Masking (Groß et al., 2016), are highly effective in mitigating time-domain SCA (i.e., DPA on power consumption), they will not suffice against proposed frequency-domain impedance SCA. As thoroughly described in Section 4.1, this is due to the fact that the physical characteristics of gate-level elements are scattered over a frequency bandwidth that can be captured by impedance profiling. Here, we exploit this fact to exhibit that the aforementioned characteristic is indeed data-dependent and can be used to reveal secrets.
We start off with simple case studies to verify scattering leakage is exploitable, and then we move toward realistic scenarios where sensitive data are protected by higher-order well-known masking schemes. First, we describe how adversaries can mount conventional non-profiled attacks via impedance analysis. Particularly we develop Differential Impedance Analysis (DIMA) to break unprotected cryptographic implementations. Furthermore, a non-profiled Correlation attack is also presented to illustrate conventional leakage models (i.e., Hamming Weight) are also effective in impedance analysis.
After verifying the applicability of naive non-profiling scenarios, we specifically aim to sidestep protected hardware implementations by exploiting on-die location-based profiling. As our main attack, we present Template Impedance Attack (TIMA) to extract time-constant high-order masked operations. We showcase that TIMA effectively breaks state-of-the-art masking schemes.
5.1. Threat Model
DIMA and CIMA attacks are performed in known plaintext scenarios. For TIMA, we also assume the access to profile the random shares (i.e., all key shares). Building templates for mask registers plays a crucial role in mounting a successful template attack which is usually not taken into account. For a thorough discussion, please refer to (Bronchain et al., 2021).
On the execution level, since our method aims to extract data directly from the DUT, we assume that the measurements are performed when target data remain unchanged in some registers on DUT. This consideration makes our treat model very similar to static power side-channel analysis (Moradi, 2014; Del Pozo et al., 2015; Moos et al., 2019; Moos, 2019b) and LLSI attack (Krachenfels et al., 2021a, b), where instead of performing the measurements during the secret-dependant operations, adversary snapshots at timestamps where secret-dependant data are stored in some form (i.e., in Flip-Flops) on the DUT. In this regards, TIMA does not apply any time-series multi-variant analysis on the target like the works in (Del Pozo et al., 2015; Durvaux and Standaert, 2016). and the measurements are captured on a single clock-cycle. Here, we make use of multivariate frequency analysis which exploits the frequency-dependent leakage on the same time-stamp. Hence, our threat model requires a clock-controlled environment for high-speed DUT during the measurement. However, this limitation might be resolved by iterating the measurements without clock halting. (For more discussion please see Section 7.3)
5.2. Naive Impedance Attacks
In order to showcase the exploitability of impedance side-channel leakage, we demonstrate that conventional power-side channel attacks could be easily modified to be applied to impedance measurements. Here, we describe two high-level attacks useful for unprotected cryptographic algorithms. Namely, in the following, we describe impedance-based DPA and CPA.
5.2.1. Differential Impedance Analysis
Differential Power Analysis (Kocher et al., 1999) on cryptography implementation exploits the variations of dynamic power consumption of DUT by employing hypothesis-based differential measurements of traces. For correct hypothetical secrets, the differential analysis maximizes a secret-dependant intermediate operation over time-domain measurement. We inspire the same methodology to deploy Differential Impedance Analysis (DIMA) over the frequency domain. In other words, for a correct hypothesis of a secret, the absolute difference of impedance measurements of a secret-related intermediate value should be maximized at some frequency stamp. This frequency stamp is physically related to the characteristics of the element that somehow(i.e., stores or transfers) intermediate value. The routine for DIMA is mostly similar to conventional DPA. The adversary could follow the same algorithmic process in DPA (Kocher et al., 2011). However, instead of calculating differential measurement on time stamps, the attacker performs the differential analysis on frequency stamps. Algorithm 1 illustrates a high-level description of DIMA. In Algorithm 1, represents the array of all measured traces for the attack and shows the associated input with trace . Furthermore, depicts the result value of a selected intermediate bit value in the targeted cipher where key and input of the cipher are k and i, respectively.
As indicated in Algorithm 1, the Difference Of Mean () is performed element-wise on each frequency stamp of impedance traces. Finally, we apply a simple averaging on each candidate to represent each guess key with a single score. Then an Argument Sort on frequency-normalized values are performed and target key is extracted. On the algorithmic level, the frequency indices of maximum values of indicates the frequencies at which the intermediate value’s physical deployment on the die leaks the most. Particularly, the same frequencies could be considered independently and be used as a profile to reveal this specific intermediate value’s content. We take advantage of similar behavior to put together a powerful profiling attack which will be elaborated later on.
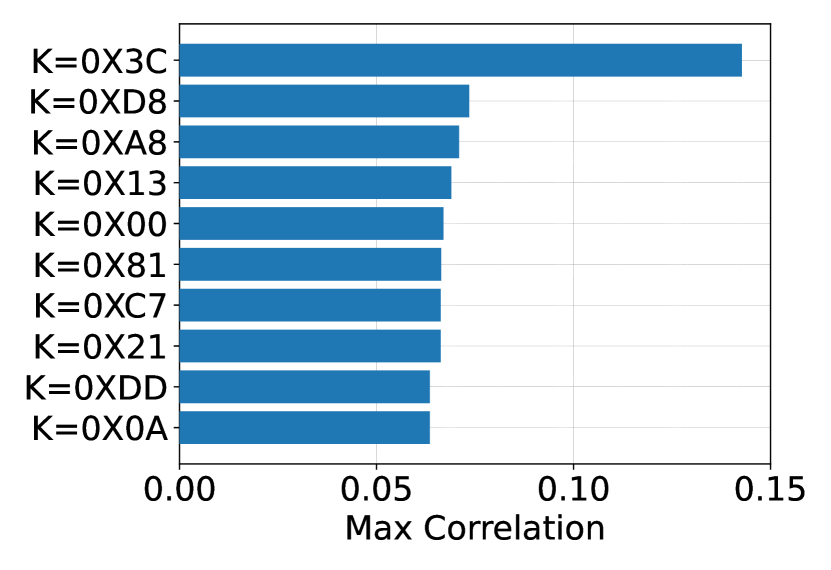
5.2.2. Correlation Impedance Attacks
As another well-established power side-channel attack, Correlation Power Analysis (CPA) (Brier et al., 2004) is also used, and they mitigate some drawbacks of DPA (Le et al., 2006). CPA uses a power consumption model on the hardware to establish a correlation between the secret-dependent operation and inputs over power measurement. For instance, a famous metric assumes that power consumption of operands on the circuits tracks a linear trend with respect to its Hamming Weight (HW). Here, the same approach is utilized for the adversary to attack an unknown secret. We use frequency-stamped impedance traces to mount a Correlation Impedance Attack (CIMA). Although different leakage models for impedance traces could be employed as a proper candidate, we use a simple HW model to develop our attack. In CIMA attacker executes Pearson Correlation (Cohen et al., 2009) over frequency-domain impedance values. Hence, target intermediate content leaks on a specific frequency stamp that is indicated by CIMA. Armed with an HW model, we launch CIMA on the first round of AES’s S-Box output to showcase a successful correlation impedance attack. It is noteworthy to mention that based on our evaluations (in Section 6.4.1), the HW model shows a near-linear leakage trend over impedance’s phase () on the target frequency stamp.
Although CIMA successfully breaks the hardware realization of a prominent cryptographic algorithm (i.e., AES) with a much less number of measurements, it is not effective against masking schemes. This is due to the fact that CIMA like other correlation attacks, strives to discover the likelihood of a single secret-dependant intermediate value, which is largely diminished by masking (De Cnudde et al., 2018). In the following, we propose an attack that builds upon frequency-spanned leakage of impedance measurements enabling us to extract masked secrets through frequency analysis in hardware implementations.
5.3. Template Impedance Attacks
Template attack proposed by Chari et.al. (Chari et al., 2003), provides a strong attack methodology where the adversary can profile a target hardware of her choosing with an arbitrary cryptographic implementation (e.g., protected) and break similar hardware using a limited number of power consumption measurements. In contrast to non-profiling methods which strive to eliminate noise by averaging over large measurement traces, template attack utilizes multi-variant characterization of points of interest (including the noise) by employing the identical target hardware, making it extremely powerful during attack phase (Chari et al., 2003). Owing to the nature of the impedance measurements, we believe a similar Template Impedance Attack (TIMA) is the most powerful attack that can be performed using impedance analysis. TIMA follows the same algorithm as a regular template attack while performing on frequency stamps. Algorithm 2 depicts the high-level flow of TIMA.
In Algorithm 2, each profile trace , is a collection of measurements associated with the impedance of the target at frequencies , where the and refers to the cipher’s key and trace index, respectively. Moreover, and are Average and Covariance calculation functions. As demonstrated, the TIMA Profile phase is performed on the DUT controlled by the adversary. As highlighted, Points Of Interest (POIs) in this attack are determined by averaging measurement values over a frequency band. Hence, frequency stamps that cause maximum difference for all the possible target are selected using the Difference in Means () metric. Moreover, we apply TopK, a localized Top-K (Arai et al., 2007) with empirically set smoothing factor to select final POIs. Note that as collected scattering measurements are complex numbers, TIMA Profile could be applied to or or even . As discussed earlier in this article, we mainly focus on profiling since it is more resilient to additive noise compared to . Nevertheless, one could deploy an iterative estimation (Rossi, 2018) or optimization (Bottou, 1998) procedure to find near-optimal parameters for leakage profiling kernel to enhance the attack success rate.
In the second phase, the attacker has limited access to the target DUT and captures a small number of measurement traces of impedance . Consequently, TIMA Attack routine is executed. As highlighted, measurements on pre-determined frequency stamps (POIs from the profiling phase) are selected first (). Then probability evaluation () of each measured attack trace is computed for each key hypothesis based on its Gaussian multi-variant distribution () extracted during TIMA Profile phase. Lastly, probabilities are accumulated for all captured traces to indicate the final candidate.
As will be explored, TIMA can be successfully applied in multiple attack scenarios and particularly on masked implementation. Specifically, we exercise a single bit TIMA on masked AES implementation (in Section 6.5) to recover all masked shares of the key, bit by bit. On the algorithmic level, the advantage of TIMA comes from the fact that every single bit on DUT contributes to a unique set of POIs over the frequency band, and consequently, forms a (fairly) distinguishable Gaussian multi-variant distribution that can be estimated with a fair amount of profiling measurements.
6. Evaluation
6.1. Experimental Setup
6.1.1. Measurement Equipment
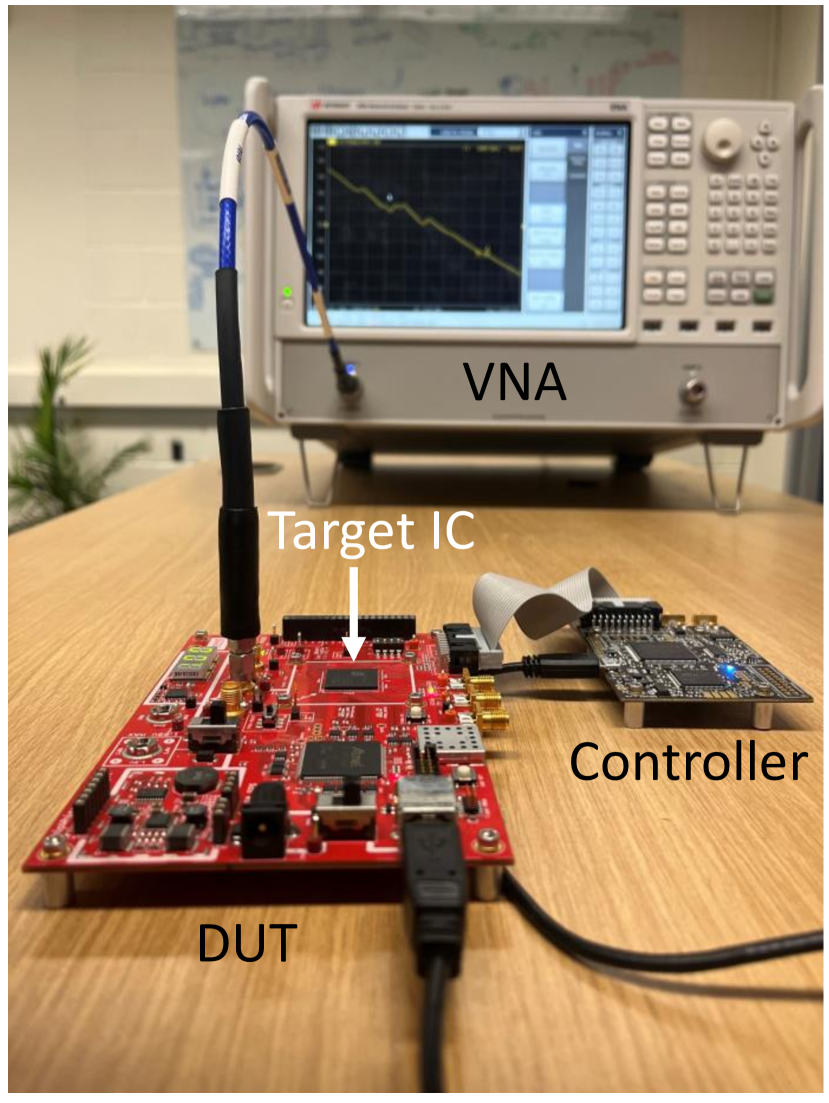
We utilized a Keysight ENA Network Analyzer E5080A(Keysight, 2023), which enables RF/microwave scattering measurements and operates on 9KHz - 6 GHz frequency bandwidth. We used Minicircuit CBL-2FT-SMNM+ characterization shielded cables (MiniCircuits, 2023) suitable for scattering measurements which are also operable in the same frequency bandwidth. The used VNA ports have internal capacitors to filter out the DC voltage on the , and therefore, no Bias Tee is needed.
6.1.2. Device Under Test
For our experiments, we used NewAE CW305 board (NAE-CW305) (NewAE, 2023a), which is equipped with an AMD/Xilinx Artix-7 FPGA (XC7A100T), built with a 28 nm technology, see Figure 7(a). CW305 board provides direct access to the FPGA’s PDN network, which was the main reason for the selection of this board. Moreover, while the FPGA contains multiple PDN domains (e.g., , , ) a 1V domain supplying the core (, , etc.), for our evaluations, power domain is our primary target PDN as it is connected the FPGA registers. Furthermore, CW305 has multiple SMA (SubMiniature version A) connectors that enable access to a shunt resistor, as well as a 20 dB low-noise amplified low-side signal suitable for power analysis. However, our experiments are carried out by the SMA port on the low side of the shunt resistor X3 port on the board, which gives us direct access to the PDN of the FPGA.
6.1.3. Analyzer and Controller Configuration
To control the state of the target FPGA chip, we have utilized a NewAE CW-Lite board (NewAE, 2023b), which provides serial communication with the DUT and could be used as an intermediate controller to transfer plaintext and receive ciphertext from the target IC. Furthermore, to conduct measurements, the CW305 board is configured to synchronize IC’s clock once the controller receives the trigger signal (e.g., CW-Lite). Specifically, for our clock controlled experiments (e.g. TIMA), target’s clock signal is generated via PLLs on CW305 and a feedback is sent to the controller at the same time. Based on the received and synchronous clock signal of the target and upon reaching to the desired time-stamp, a mask signal is sent by the controller and target’s clock signal is masked and computation is halted. During this idle status, although the PLL clock on the board is oscillating but the target clock on the IC is gated. Consequently, a trigger signal is sent to the VNA for the measurement during this period. In our experiments, PLL board clock is set to .
In order to schedule and prepare the input data for the IC and also analyze measurements and conduct our attacks, we employed Python 3.7 scripts. We used PyVisa and Scipy.Stat to communicate with the instruments and perform statistical analysis, respectively. Furthermore, hardware designs are written in Verilog, and synthesizes are carried out by Xilinx Vivado. The Analyzer System is a machine with an Intel XEON E5 2697 V3 CPU clocked at 2.6 GHz, equipped with 128 GB of DDR3 RAM, and runs an Ubuntu 20.04.6 LTS.
6.1.4. Measurement Procedure
Figure 7(b) depicts our experiment diagram. Our experiments process could be described as follows:
-
As the initial step, The desired hardware design of the Target IC (e.g., a masked AES) as a bitstream is programmed using a JTAG connection.
-
(1)
Arbitrary input data (i.e., masked plaintext, masked keys, etc.) are prepared in the Analyzer System and are sent to the Controller.
-
(2)
Using a serial interface Controller, sends the data to the Target IC and collects timing stamps (Clock triggers) from Target IC during its operation. At a desired time stamp, it triggers the VNA for the measurement.
-
(3)
VNA performs a measurement upon getting triggered and sends back the measured traces to the Analyzer System.
-
(4)
Once the execution on the Target IC is finished, output is received by the controller and is sent to Analyzer System via UART connection for verification purposes.
For the suitable profiling procedure required for our proposed attacks, we developed an iterative and automated process to capture the traces. Furthermore, note that in accordance with our threat model, our attacks require time-constant measurements as it exploits the physical characteristics of the die. Hence, synchronization and clock control are vital in our measurements, handled via Controller in our attack scenarios.
6.2. Target Implementation and Configuration
VNA Configurations and Frequency bands. On each set of experiments, based on the target implementation different frequency target band is selected. Based on our experiments, different implementations on the FPGA results in different leakage on each narrow-band frequency. This is due to the variations in physical realization of components on the target which effects the impedance profile. We indicate that different target frequency band might result in different (maybe superior) attack success rate. Our targeted bands are selected naively and experimentally. Furthermore, IF Bandwidth and Averaging factors, used for adjusting the VNA measurement quality are set experimentally in our attacks. IF Bandwidth is set to 500 Hz in our experiments to reliably filter out unwanted responses such as higher frequency spectral noise (keysight, 2023) and Averaging factor is selected to be in TIMA attack to reduce measurement noise floor.
Implementation of AES S-box. Unprotected AES targeted for CIMA and DIMA in our experiments is implemented with a fully pipelined architecture using Canright’s S-box (Canright, 2005). These attacks are carried out at the first clock-cycle (first round S-box’s output).
Implementation of Masked AES. Ultimately we deploy experiments with TIMA, targeting AES DOM implementation for FPGA (Gross et al., 2016) with 3 shares (masking order of 2). We mount two attacks on different scenarios. 1) The measurements are performed on the first round’s key-share byte registers of extended Canright’s masked S-box(Canright and Batina, 2008) which is the underlying S-box circuitry used in AES DOM. This attack targets the first byte of the key and is carried out when three key-share registers are loaded in the core before the execution of the first masked S-box (clock-cycle 1) 2) We target the full key extraction during the initialization process and once key values ( bits) are loaded into the registers. We deploy TIMA before starting AES-DOM is executed (Where signal is set at clock-cycle 0).
Complex Number Analysis. Although the impedance values (alternatively ) are complex values which are usually represented by magnitude and phase numbers, our main attacks (i.e., CIMA, DIMA, and TIMA) are only carried out on the phase () part of the measurements.
6.3. Attacking Fan-out Registers
We start off with a simple profiling analysis of a design with fan-out registers. The same methodology is used by Moradi et al. (Moradi, 2014) and similar research scenario (Moos, 2019b) to analyze the leakage of static power consumption. Here, we cascaded two 1024 sets of FDCEs ( D Flip-Flop with Clock Enable and Asynchronous Clear). In contrast with static-based power SCA (Moradi, 2014), we explicitly specified the location (Xilinx, 2023) of the register sets for the implementation phase as different locations of registers yield different results in our evaluation. In this experiment, the wiring and locations are manually specified to deploy two connected register sets on two adjacent FPGA slices.
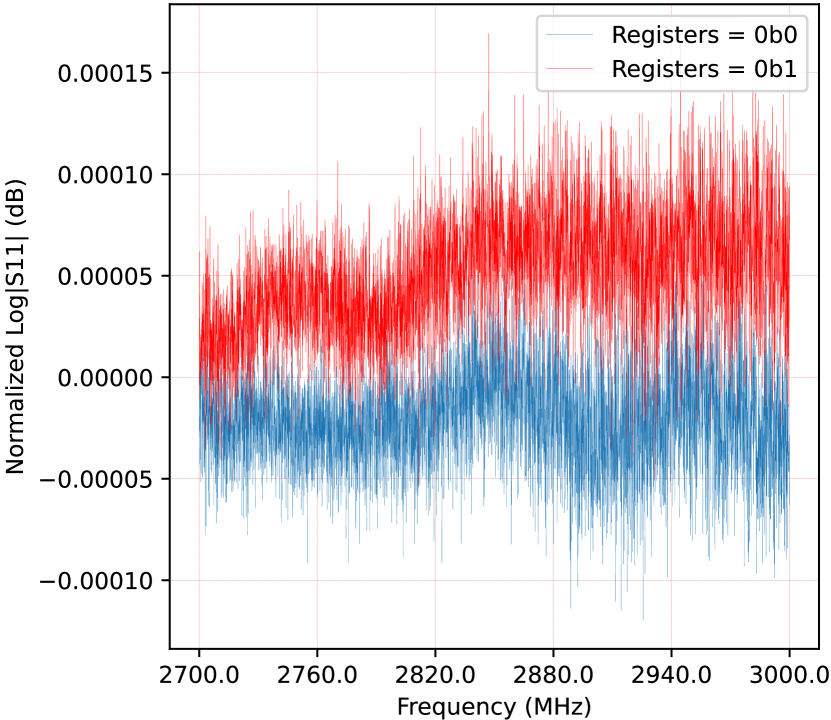
High Fan-out Binary Registers In the first experiments, we program the DUT to set all 2048 registers to either 0b0 or 0b1. This setting is done via deploying a control register on the FPGA configured by the Controller. Upon receiving the run command from the Controller, values on the registers are set. For each case, we collect the total number of 600 traces in the frequency range of , with 5000 linearly spanned frequency stamps. In other words, is set as the frequency resolution. To minimize temperature-induced drifts, we follow a normalization process where we perform a reference measurement (e.g. a FPGA register fan-out program where all registers are cleared.) after each measurement and store the difference as the final trace. Note that since our attack is a differential attack, normalized values do not affect the final outcome.
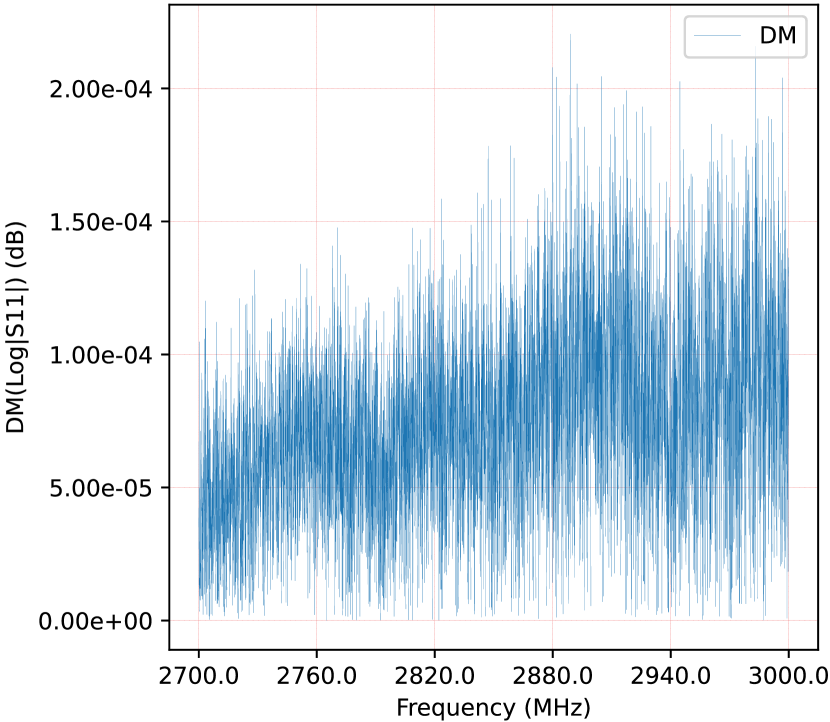
Figure 8(a) depicts average values of magnitude for each case of the experiment over the selected frequency band. The difference (DM) between the two groups is illustrated in Figure 8(b). As shown in this figure, the difference exists over the entire selected frequency band, however, at some stamps, it is larger compared to others. This indicates that at certain frequency stamps, the magnitude of the impedance differs based on the content of the registers and their corresponding wiring on specific positions on the die.
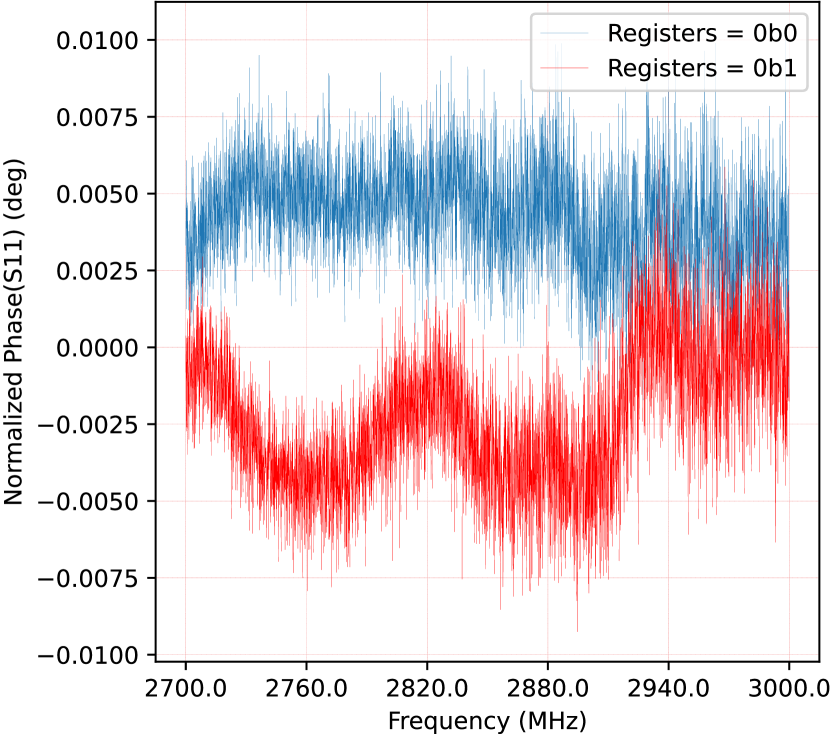
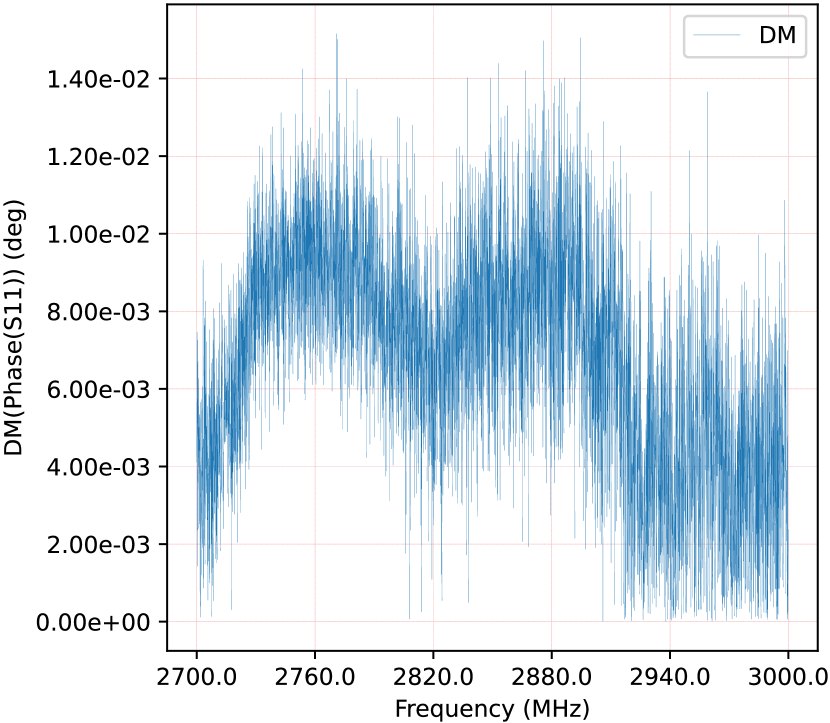
Similarly, Figure 9 details the average difference of for each group of traces. Note that and are uniquely different metrics with completely different behavior. Consequently, each case in Figure 8(a) and Figure 9(a) follow different pattern. For instance, normalized for case 0b1 is less than 0b0 traces for most of the selected frequency band, where for opposite behavior is observed. Also, the absolute difference at some frequencies is larger compared to the magnitude DM. This can be justified as often RF Phase measurements are known to be more resistant to noise compared to magnitude.
6.4. Attacking AES S-BOX
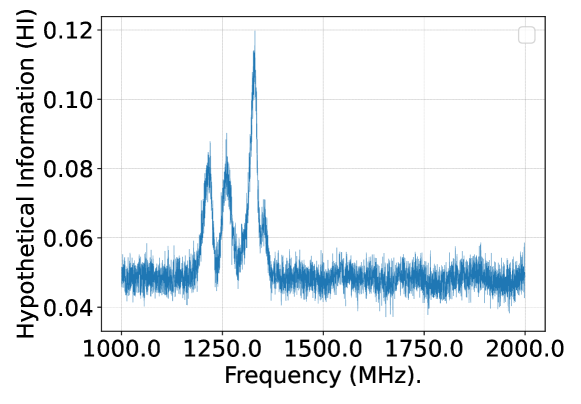
As the next step, we advance our target to attack AES S-BOX. We consider first-round S-BOX with a known plain-text scenario. In the following, we apply CIMA and DIMA attacks to an unprotected AES S-BOX implementation (derived from ProjectVault (Community, 2023)). Also, note that S-BOX’s output is considered as the target intermediate value in our attacks, and the goal is to find the first byte of the secret key value. In order to verify the leakage for our captured traces, we first demonstrate an information leakage analysis. Figure 10 shows the Hypothetical Information (HI) (Bronchain et al., 2019) of impedance leakage for the S-box target in frequency domain. It shows that the some frequency sub-bands are more exploitable compared to others.
6.4.1. CIMA
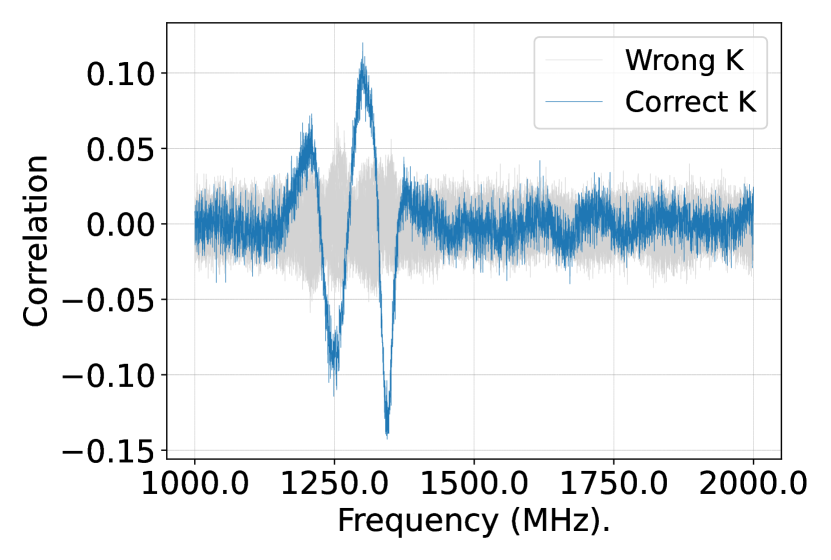
As our first attempt to break AES using impedance data, we deploy CIMA based on a conventional HW model. In this experiment, we mount our attack on 1200 measurement traces. Furthermore, we select the frequency range of , with 3000 linearly spanned stamps. Figure 11 depicts the results of CIMA in terms of correlation index.
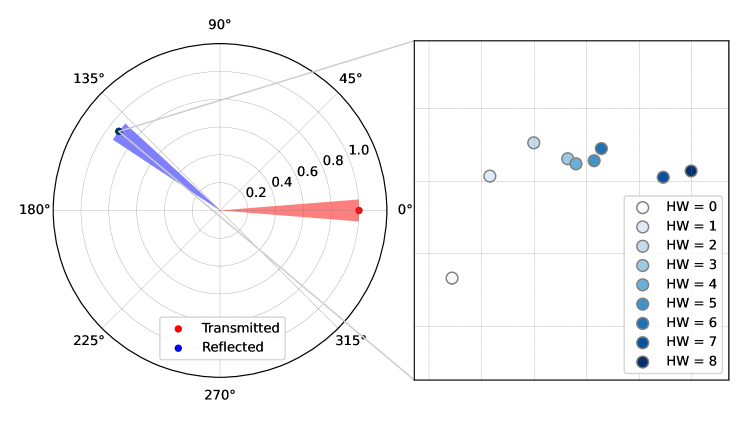
Furthermore, to verify that the chosen model in our attack successfully distinguishes on Magnitude and Phase, Figure 12 represents the polar distribution of the collected measurements with respect to the HW of the chosen intermediate value. As shown, we grouped up and averaged the traces in their corresponding HW class. The distribution of reflected signals (indicated in blue) shows that groups could be effectively distinguished.
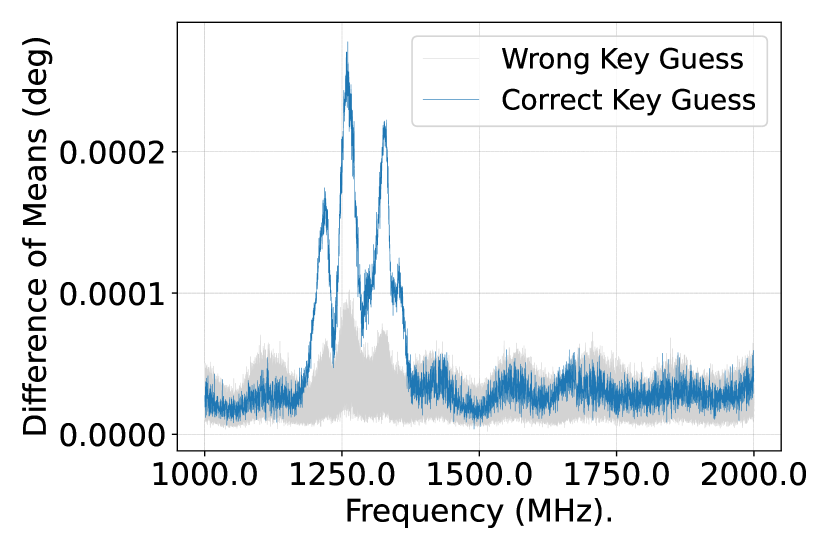
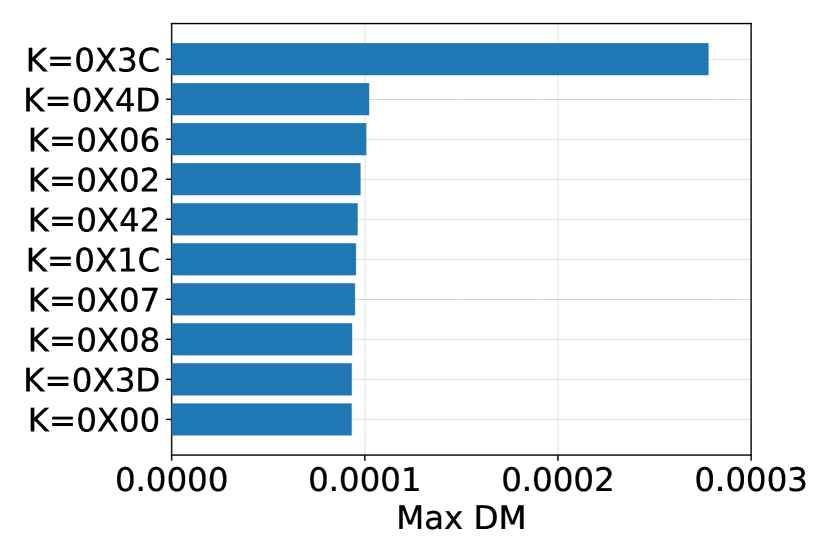
6.4.2. DIMA
Our next attack scenario is to perform impedance differential analysis (namely DIMA) on an AES S-Box. For this attack, we employ traces on the frequency band of , with 3000 frequency samples at each measurement. Figure 13 shows the final differential results for the possible key space using a multi-bit DIMA analysis.
As another analysis, we investigated and measured the leakage of each individual intermediate bit as our indicator. Figure 14 depicts the leakage for different bits of the target intermediate value. Although some bits are potentially more exploitable for the attack, it is clearly observed that each individual bit leaks in a distinguishable set of frequency samples.
6.5. Attacking DOM AES
As our ultimate experiment, we prepare an attack on a protected AES implementation. In this scenario, we target a 3-Share AES DOM hardware core. To ensure that random generator execution does not incur additional leakage, we consider an off-chip TRNG, which feeds in the masked operands into the FPGA target. As explained, we consider the attack in two scenarios.
6.5.1. Attacking Key Register Byte
Here, we perform the attack at the first clock-cycle where shares of the first key byte (as well as first input byte shares) are loaded into the target. Hence, regardless of the masked operations on the upcoming clocks, TIMA attacks the key (share) registers directly. We carry out the Profiling Stage with number of traces to template masked key registers. Specifically, we execute TIMA profiling for each bit of all key shares independently ( for each byte of the master key). It is also worth noting that shares are generated uniformly random and each trace is used to template for all target bits. More specifically, for each template target bit, we would have roughly traces where a target bit of the target share is 0b0.
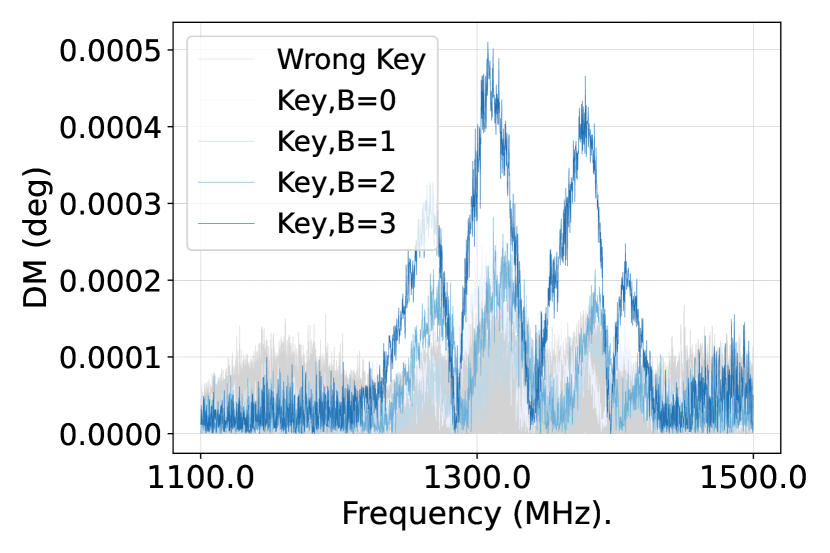
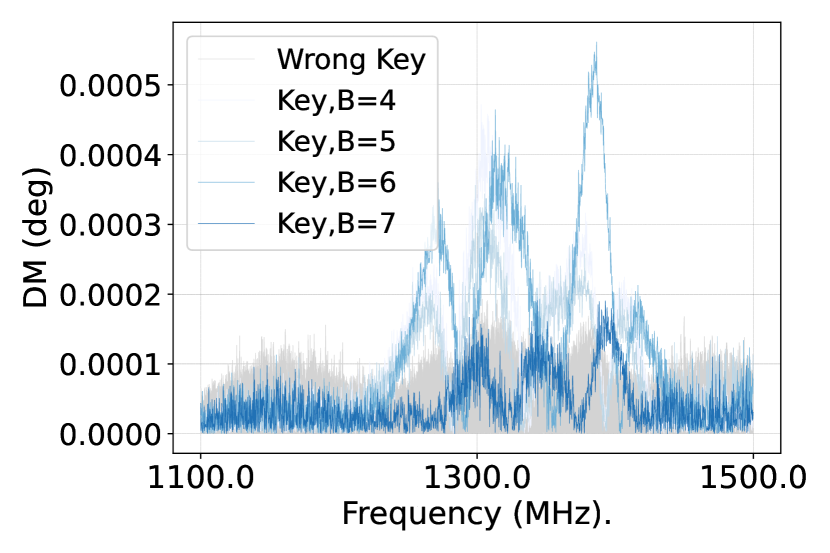
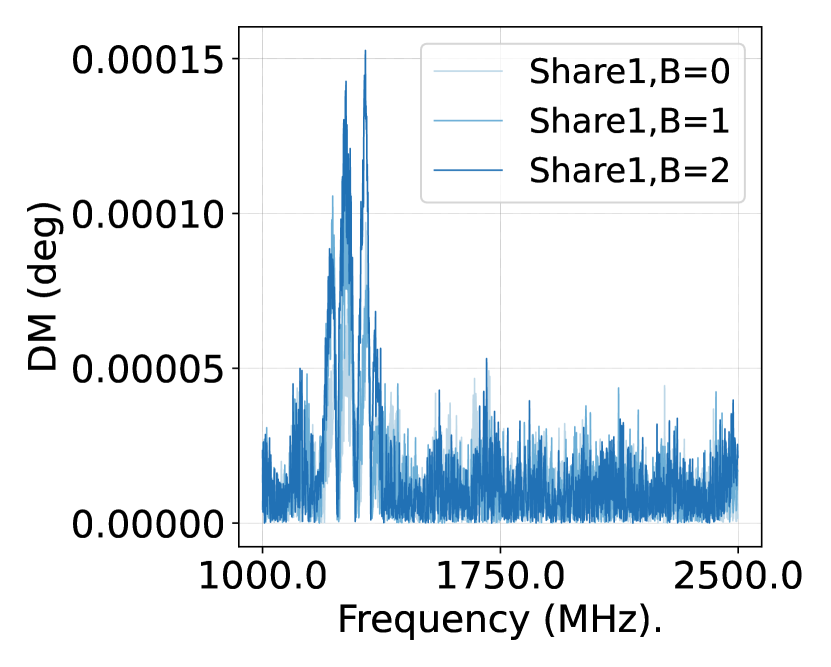
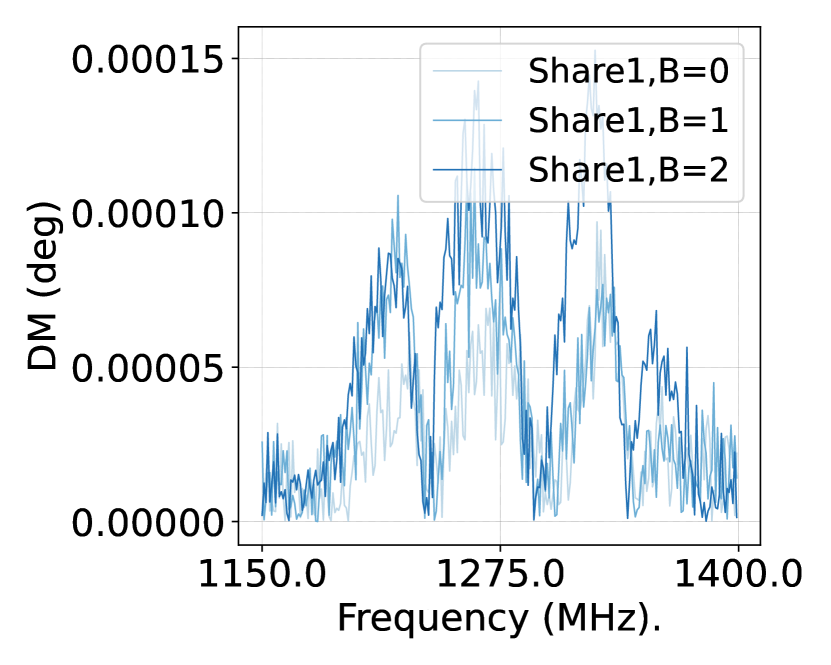
Figure 15 and Figure16 show the bit leakage model among bits on different shares and on the same share, respectively. Note that DM metric is shown here to highlight that distinguished POIs on different frequency points for each individual bit of each share enables TIMA to effectively extract the master key.
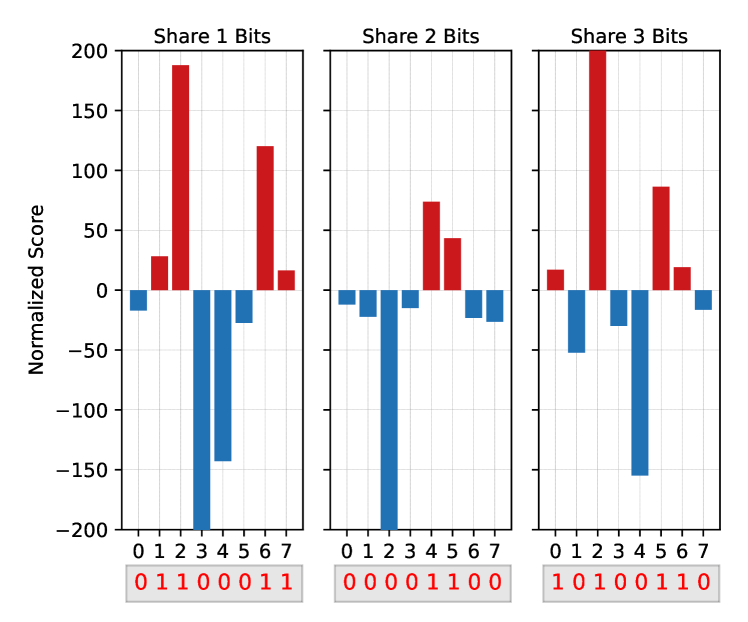
After Profiling Phase, we perform a single trace attack on the DUT with unknown shares. In order to reduce the noise we carried out VNA-enabled averaging of on the the attack trace. TIMA successfully recovers all the bits of each share individually. Figure 17 serves as an example to showcase the key extraction based on template scores of each target bit after attack stage. Combining extracted share bits could then be used to reconstruct the first byte of the master key as shown in Figure 17.
6.5.2. Analysing Full-length Key
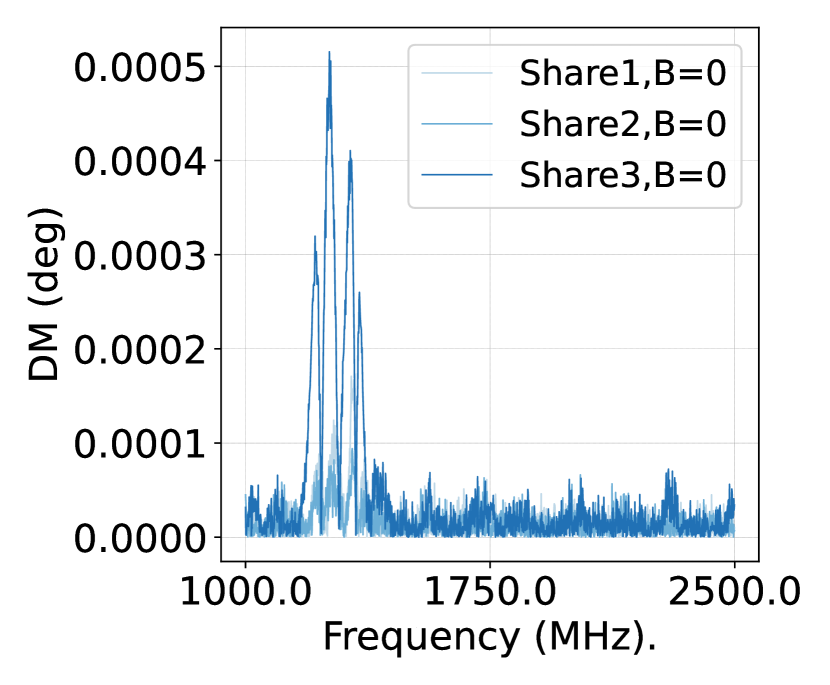
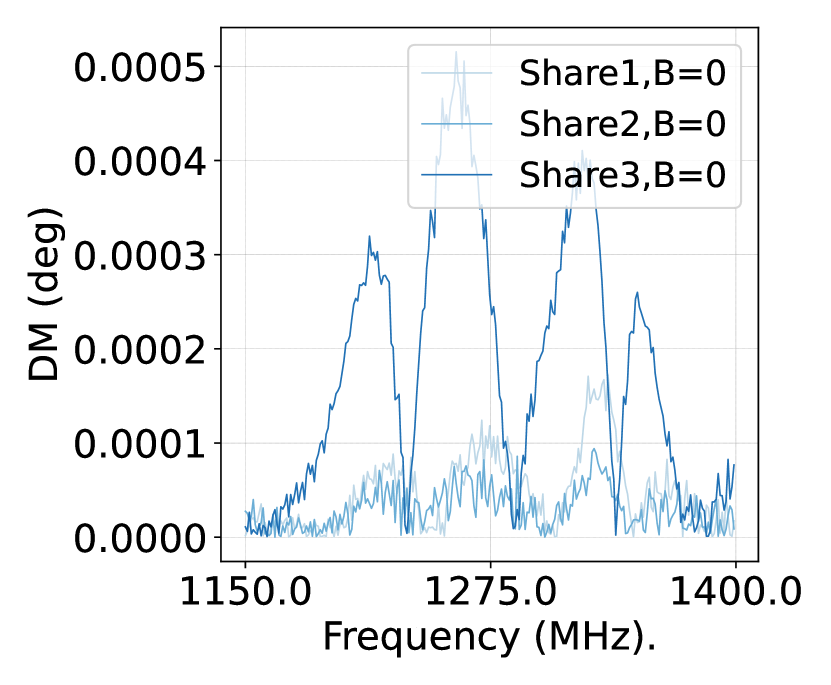
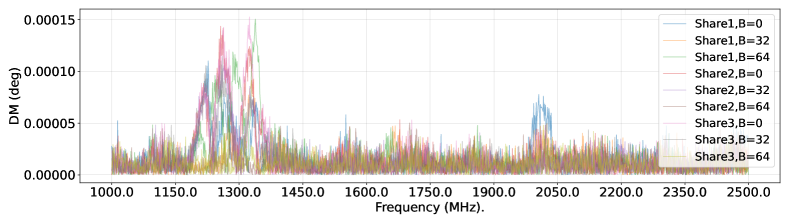
We further focus on the key registers on the FPGA at the time before the AES-DOM is initiated. As random shares are stored on FPGA registers before loaded into the AES core (i.e., DOM core), we target the time-stamp where signal is set. Note that although DOM execution is byte-wise and shares are randomize in the key registers for each byte execution, original shares are loaded from other locations (additional wires and registers) into the core. These registers are targeted in this attack. We profile TIMA on full-length keys with 50,000 traces and follow the same procedure explained in the previous attack. Figure 18 shows the DM metric over frequency domain for different bits on all three shares of the target key during TIMA Profiling Phase. Note that similar to the previous experiment, DM is plotted for the averaged trace of approximately 25,000 traces for and 25,000 traces for (). As shown, each individual bit could visually be distinguished by DM metric.
7. Discussions
7.1. Comparison with Power SCA
There has been a numerous efforts to provide fair metrics (Papagiannopoulos et al., 2023) and methodologies (Del Pozo et al., 2015; Bronchain et al., 2019; Masure et al., 2023) to compare and analyze the leakage of various power analysis attacks. It is shown that time-series multivariate leakage in dynamic power attacks could be considered to improve attack success rate (Grosso and Standaert, 2015). Impedance leakage is multivariate by nature but in contrast to dynamic leakage is time-constant. Although, dimension reduction techniques such as Principal Component Analysis (PCA) combined with leakage metrics such as Perceived Information (PI) (Standaert et al., 2009) could be used to provide fair comparison with uni-variate leakage (Del Pozo et al., 2015) ( e.g. averaged static traces), further extensive experiments and modeling are required.
Moreover, the threat model assumptions, experimental conditions, and setup highly contributes to the SNR and success rate of the attack. Impedance attack presented in this work is somehow similar to static-side channels but differs in experimental details. Moradi (Moradi, 2014) and Moos (Moos, 2019a) use climate chambers and full board clock halt (for noise reduction) to perform static SCA. Cassiers et al. (Cassiers et al., 2023) removed the need for a climate chamber in a later work, but the attack still requires a low-noise amplifier, the control of the power supply and the source clock of the target, whereas impedance analysis utilizes only clock gating with no control over power supply or environment temperature. We believe that an accurate experimental comparison among static, dynamic, and impedance SCA should be under the same threat model, conditions, and target and deserves a future study. Another interesting course of research could be the leakage analysis of time-variant impedance profiles which could introduce time-frequency multivariate impedance attacks.
7.2. Possible Countermeasures
As investigated throughout the paper, the nature of impedance leakage is directly caused by the physical placements of secret-dependant registers. Hence, a fundamental approach to resolve these leakages is real-time refreshing of the secret-dependant registers and/or routing. A series of hardware randomization solutions (Güneysu and Moradi, 2011; Mentens, 2017; Koblah et al., 2022) present methods including partial reconfiguration as Moving Target Defense, to secure FPGA against SCA. Similar methodologies (Hettwer et al., 2019), if deployed in an online manner, could be used to prevent impedance analysis. Alternatively, system level approaches to detect clock-control on the device (Dumitru et al., 2023) could also be deployed as countermeasure to those impedance attacks which are performed in clock-controlled environment.
7.3. Clock control and impedance measurements
A clock controller is deployed in our measurement setup to ensure an accurate time stamp for our measurements. However, compared to static power side-channel where static snapshots without halted clocks could lead to an increase of the noise (due to additive noise caused by dynamic power consumption) (Del Pozo et al., 2015), impedance analysis is not susceptible to time-varying measurements as long as the target intermediate values are stored (i.e., in Flip-Flops) in the circuit. This is mainly due to the unique and non-additive leakage of each individual (bit of) intermediate value through the frequency domain, which relaxes the clock control constraints in our threat model. On the other hand, as indicated by prior works (Moos, 2019b; Krachenfels et al., 2021a), in many real-world cryptographic masked hardware and software implementations (hgrosz, 2023; ANSSI-FR, 2023), masked state/key registers are not overwritten every clock-cycle and are maintained for tens of clock cycles. Consequently, it is possible for the adversary to perform an iterative measurement without clock control to capture properly time-stamped measurements.
Furthermore, we stress that if target frequencies are known by the adversary (i.e., in the case of template attack), considering the typical VNA capabilities (keysight, 2023), frequency sweep could be done up-to two orders of magnitude faster, giving the adversary the advantage to perform multiple measurements during a single MHz clock execution of DUT.
7.4. Effects of Wiring
Previous researchers have shown that long wires in FPGA implementations could potentially increase the leakage for power side-channel attacks (Giechaskiel et al., 2019; Giechaskiel and Eguro, 2016). On the other hand, very close wiring between sensitive operands could also result in coupling effects (De Cnudde et al., 2017) that leak sensitive data. Hence, hardware routing and wiring should be done exceedingly carefully when it comes to implementing protected crypto-systems. Our experiments show that long wiring of secret dependant registers increases impedance leakages as well. Specifically, the deployment of long routing on the FPGA die realizes a series of buffers and intermediate elements that contributes to target impedance which could be exploited to reveal data.
8. Conclusion
In this paper, we presented a novel non-invasive physical side-channel attack exploiting the data-dependent changes in the impedance of the chip. We demonstrated that the temporarily stored contents in registers of an IC alter the die’s impedance, which can be measured using scattering parameters commonly deployed in RF/microwave engineering. Since registers at different locations affect the impedance profile of the system at various frequency bands, the content of these registers can be probed simultaneously by identifying the frequencies of interest. To assess the threat of our discovered side-channel, we mounted several impedance analysis attacks against unprotected and protected hardware AES-128 implementations on an FPGA and showed that secret key bits could be recovered confidently. In the case of the profiled attack, only a single trace was required to recover the secret key. Our results challenged the effectiveness of masking schemes as side-channel countermeasures, and hence, we believe that the integration of specific hiding countermeasures in addition to masking is required to mitigate our attack.
Acknowledgement
This effort was sponsored in part by NSF under the grant number 2150123 and in part by Electric Power Research Institute (EPRI).
References
- (1)
- ANSSI-FR (2023) ANSSI-FR. 2023. ASCAD masked implementation of AES. https://github.com/ANSSI-FR/ASCAD. Accessed: 2023-04-26.
- Arai et al. (2007) Benjamin Arai, Gautam Das, Dimitrios Gunopulos, and Nick Koudas. 2007. Anytime measures for top-k algorithms. In Proceedings of the 33rd international conference on Very large data bases. 914–925.
- Billings (2013) Stephen A Billings. 2013. Nonlinear system identification: NARMAX methods in the time, frequency, and spatio-temporal domains. John Wiley & Sons.
- Bogatin (2010) Eric Bogatin. 2010. Signal and Power Integrity–Simplified. Pearson Education.
- Bottou (1998) Léon Bottou. 1998. Online algorithms and stochastic approxima-p tions. Online learning and neural networks (1998).
- Brier et al. (2004) Eric Brier, Christophe Clavier, and Francis Olivier. 2004. Correlation power analysis with a leakage model. In Cryptographic Hardware and Embedded Systems-CHES 2004: 6th International Workshop Cambridge, MA, USA, August 11-13, 2004. Proceedings 6. Springer, 16–29.
- Bronchain et al. (2021) Olivier Bronchain, Gaëtan Cassiers, and François-Xavier Standaert. 2021. Give me 5 minutes: Attacking ASCAD with a single side-channel trace. Cryptology ePrint Archive (2021).
- Bronchain et al. (2019) Olivier Bronchain, Julien M Hendrickx, Clément Massart, Alex Olshevsky, and François-Xavier Standaert. 2019. Leakage certification revisited: Bounding model errors in side-channel security evaluations. In Advances in Cryptology–CRYPTO 2019: 39th Annual International Cryptology Conference, Santa Barbara, CA, USA, August 18–22, 2019, Proceedings, Part I 39. Springer, 713–737.
- Canright (2005) David Canright. 2005. A very compact S-box for AES. In International Workshop on Cryptographic Hardware and Embedded Systems. Springer, 441–455.
- Canright and Batina (2008) David Canright and Lejla Batina. 2008. A very compact “perfectly masked” S-box for AES. In Applied Cryptography and Network Security: 6th International Conference, ACNS 2008, New York, NY, USA, June 3-6, 2008. Proceedings 6. Springer, 446–459.
- Cassiers et al. (2023) Gaëtan Cassiers, Loïc Masure, Charles Momin, Thorben Moos, and François-Xavier Standaert. 2023. Prime-Field Masking in Hardware and its Soundness against Low-Noise SCA Attacks. IACR Transactions on Cryptographic Hardware and Embedded Systems (2023), 482–518.
- Chaibi et al. (2015) Hasna Chaibi, Mostafa Belkasmi, and Z Mohammadi. 2015. UWB outdoor channel characterization and modeling based on measurements. In 2015 International Conference on Wireless Networks and Mobile Communications (WINCOM). IEEE, 1–5.
- Chari et al. (1999) Suresh Chari, Charanjit S Jutla, Josyula R Rao, and Pankaj Rohatgi. 1999. Towards sound approaches to counteract power-analysis attacks. In Advances in Cryptology—CRYPTO’99: 19th Annual International Cryptology Conference Santa Barbara, California, USA, August 15–19, 1999 Proceedings 19. Springer, 398–412.
- Chari et al. (2003) Suresh Chari, Josyula R Rao, and Pankaj Rohatgi. 2003. Template attacks. In Cryptographic Hardware and Embedded Systems-CHES 2002: 4th International Workshop Redwood Shores, CA, USA, August 13–15, 2002 Revised Papers 4. Springer, 13–28.
- Cohen et al. (2009) Israel Cohen, Yiteng Huang, Jingdong Chen, Jacob Benesty, Jacob Benesty, Jingdong Chen, Yiteng Huang, and Israel Cohen. 2009. Pearson correlation coefficient. Noise reduction in speech processing (2009), 1–4.
- Čoja et al. (2017) Duška Čoja, Nataša Nešković, and Aleksandar Nešković. 2017. Channel impulse response estimation using vector network analyzer. In 2017 25th Telecommunication Forum (TELFOR). IEEE, 1–4.
- Community (2023) Open Source Community. 2023. Github, Project Vault. https://github.com/ProjectVault/orp/tree/master/hardware. Accessed: 2023-04-26.
- De Cnudde et al. (2017) Thomas De Cnudde, Begül Bilgin, Benedikt Gierlichs, Ventzislav Nikov, Svetla Nikova, and Vincent Rijmen. 2017. Does coupling affect the security of masked implementations?. In Constructive Side-Channel Analysis and Secure Design: 8th International Workshop, COSADE 2017, Paris, France, April 13-14, 2017, Revised Selected Papers 8. Springer, 1–18.
- De Cnudde et al. (2018) Thomas De Cnudde, Maik Ender, and Amir Moradi. 2018. Hardware masking, revisited. IACR Transactions on Cryptographic Hardware and Embedded Systems (2018), 123–148.
- Del Pozo et al. (2015) Santos Merino Del Pozo, François-Xavier Standaert, Dina Kamel, and Amir Moradi. 2015. Side-channel attacks from static power: When should we care?. In 2015 Design, Automation & Test in Europe Conference & Exhibition (DATE). IEEE, 145–150.
- Duc et al. (2019) Alexandre Duc, Stefan Dziembowski, and Sebastian Faust. 2019. Unifying leakage models: From probing attacks to noisy leakage. Journal of Cryptology 32 (2019), 151–177.
- Dumitru et al. (2023) Robert Dumitru, Andrew Wabnitz, and Yuval Yarom. 2023. On Borrowed Time–Preventing Static Power Side-Channel Analysis. arXiv preprint arXiv:2307.09001 (2023).
- Durvaux and Standaert (2016) François Durvaux and François-Xavier Standaert. 2016. From improved leakage detection to the detection of points of interests in leakage traces. In Advances in Cryptology–EUROCRYPT 2016: 35th Annual International Conference on the Theory and Applications of Cryptographic Techniques, Vienna, Austria, May 8-12, 2016, Proceedings, Part I 35. Springer, 240–262.
- Fens et al. (2008) RAM Fens, Mayazzurra Ruggiano, and Geert Leus. 2008. Channel characterization using radar for transmission of communication signals. In 2008 European Conference on Wireless Technology. IEEE, 127–130.
- Ferrigno and Hlaváč (2008) Julie Ferrigno and M Hlaváč. 2008. When AES blinks: introducing optical side channel. IET Information Security 2, 3 (2008), 94–98.
- Genkin et al. (2017) Daniel Genkin, Adi Shamir, and Eran Tromer. 2017. Acoustic cryptanalysis. Journal of Cryptology 30 (2017), 392–443.
- Giechaskiel and Eguro (2016) Ilias Giechaskiel and Ken Eguro. 2016. Information leakage between FPGA long wires. arXiv preprint arXiv 1611 (2016).
- Giechaskiel et al. (2019) Ilias Giechaskiel, Ken Eguro, and Kasper B Rasmussen. 2019. Leakier wires: Exploiting FPGA long wires for covert-and side-channel attacks. ACM Transactions on Reconfigurable Technology and Systems (TRETS) 12, 3 (2019), 1–29.
- Groß et al. (2016) Hannes Groß, Stefan Mangard, and Thomas Korak. 2016. Domain-oriented masking: Compact masked hardware implementations with arbitrary protection order. Cryptology ePrint Archive (2016).
- Gross et al. (2016) Hannes Gross, Stefan Mangard, and Thomas Korak. 2016. Domain-Oriented Masking: Compact Masked Hardware Implementations with Arbitrary Protection Order. Cryptology ePrint Archive (2016). https://eprint.iacr.org/2016/486
- Grosso and Standaert (2015) Vincent Grosso and François-Xavier Standaert. 2015. ASCA, SASCA and DPA with enumeration: which one beats the other and when?. In Advances in Cryptology–ASIACRYPT 2015: 21st International Conference on the Theory and Application of Cryptology and Information Security, Auckland, New Zealand, November 29–December 3, 2015, Proceedings, Part II 21. Springer, 291–312.
- Güneysu and Moradi (2011) Tim Güneysu and Amir Moradi. 2011. Generic side-channel countermeasures for reconfigurable devices. In Cryptographic Hardware and Embedded Systems–CHES 2011: 13th International Workshop, Nara, Japan, September 28–October 1, 2011. Proceedings 13. Springer, 33–48.
- Hettwer et al. (2019) Benjamin Hettwer, Johannes Petersen, Stefan Gehrer, Heike Neumann, and Tim Güneysu. 2019. Securing cryptographic circuits by exploiting implementation diversity and partial reconfiguration on FPGAs. In 2019 Design, Automation & Test in Europe Conference & Exhibition (DATE). IEEE, 260–263.
- hgrosz (2023) hgrosz. 2023. Verilog Implementation of DOM AES. https://github.com/hgrosz/aes-dom. Accessed: 2023-04-26.
- Hutter and Schmidt (2014) Michael Hutter and Jörn-Marc Schmidt. 2014. The temperature side channel and heating fault attacks. In Smart Card Research and Advanced Applications: 12th International Conference, CARDIS 2013, Berlin, Germany, November 27-29, 2013. Revised Selected Papers 12. Springer, 219–235.
- Ichihashi and Kanaya (2019) Masahiro Ichihashi and Haruichi Kanaya. 2019. A simple methodology for on-chip transmission line modeling and optimization for high-speed clock distribution. Japanese Journal of Applied Physics 58, SB (2019), SBBC06.
- Ishai et al. (2003) Yuval Ishai, Amit Sahai, and David Wagner. 2003. Private circuits: Securing hardware against probing attacks. In Advances in Cryptology-CRYPTO 2003: 23rd Annual International Cryptology Conference, Santa Barbara, California, USA, August 17-21, 2003. Proceedings 23. Springer, 463–481.
- Ito et al. (2022) Akira Ito, Rei Ueno, and Naofumi Homma. 2022. On the success rate of side-channel attacks on masked implementations: Information-theoretical bounds and their practical usage. In Proceedings of the 2022 ACM SIGSAC Conference on Computer and Communications Security. 1521–1535.
- keysight (2023) keysight. 2023. E5080A ENA Documentation Manual. https://www.keysight.com/us/en/library/manuals/help-file/e5080a-ena-network-analyzer-pdf-help-for-firmware-rev-a110x-2651497. Accessed: 2023-04-26.
- Keysight (2023) Keysight. 2023. Keysight Documentations. https://www.keysight.com/us/en/product/E5080A/e5080a-ena-vector-network-analyzer.html. Accessed: 2023-04-26.
- Kleindiek Nanotechnik GmbH (2020) Kleindiek Nanotechnik GmbH. 2020. Prober Shuttle (PS8). https://www.nanotechnik.com/ps8.html
- Koblah et al. (2022) David S Koblah, Fatemeh Ganji, Domenic Forte, and Shahin Tajik. 2022. Hardware Moving Target Defenses against Physical Attacks: Design Challenges and Opportunities. In Proceedings of the 9th ACM Workshop on Moving Target Defense. 25–36.
- Kocher et al. (1999) Paul Kocher, Joshua Jaffe, and Benjamin Jun. 1999. Differential power analysis. In Advances in Cryptology—CRYPTO’99: 19th Annual International Cryptology Conference Santa Barbara, California, USA, August 15–19, 1999 Proceedings 19. Springer, 388–397.
- Kocher et al. (2011) Paul Kocher, Joshua Jaffe, Benjamin Jun, and Pankaj Rohatgi. 2011. Introduction to differential power analysis. Journal of Cryptographic Engineering 1 (2011), 5–27.
- Kocher (1996) Paul C Kocher. 1996. Timing attacks on implementations of Diffie-Hellman, RSA, DSS, and other systems. In Advances in Cryptology—CRYPTO’96: 16th Annual International Cryptology Conference Santa Barbara, California, USA August 18–22, 1996 Proceedings 16. Springer, 104–113.
- Krachenfels et al. (2021a) Thilo Krachenfels, Fatemeh Ganji, Amir Moradi, Shahin Tajik, and Jean-Pierre Seifert. 2021a. Real-world snapshots vs. theory: Questioning the t-probing security model. In 2021 IEEE Symposium on Security and Privacy (SP). IEEE, 1955–1971.
- Krachenfels et al. (2021b) Thilo Krachenfels, Tuba Kiyan, Shahin Tajik, and Jean-Pierre Seifert. 2021b. Automatic Extraction of Secrets from the Transistor Jungle using Laser-AssistedSide-Channel Attacks. In 30th USENIX Security Symposium (USENIX Security 21). 627–644.
- Le et al. (2006) Thanh-Ha Le, Jessy Clédière, Cécile Canovas, Bruno Robisson, Christine Servière, and Jean-Louis Lacoume. 2006. A proposition for correlation power analysis enhancement. In Cryptographic Hardware and Embedded Systems-CHES 2006: 8th International Workshop, Yokohama, Japan, October 10-13, 2006. Proceedings 8. Springer, 174–186.
- MacEachem et al. (2017) Leonard MacEachem, Xin Jie Wang, and Tad Kwasniewski. 2017. On-die power grid broadband model determination using a priori narrowband measurements. 2017 IEEE 60th International Midwest Symposium on Circuits and Systems (MWSCAS) (2017), 1493–1496.
- Masure et al. (2023) Loïc Masure, Gaëtan Cassiers, Julien Hendrickx, and François-Xavier Standaert. 2023. Information bounds and convergence rates for side-channel security evaluators. IACR Transactions on Cryptographic Hardware and Embedded Systems (2023), 522–569.
- Mentens (2017) Nele Mentens. 2017. Hiding side-channel leakage through hardware randomization: A comprehensive overview. In 2017 International Conference on Embedded Computer Systems: Architectures, Modeling, and Simulation. IEEE, 269–272.
- MiniCircuits (2023) MiniCircuits. 2023. MiniCircuits Datasheets. https://www.mouser.com/datasheet/2/1030/CBL_2FT_SMNM_2b-2303455.pdf. Accessed: 2023-04-26.
- Moos (2019a) Thorben Moos. 2019a. Static Power SCA of Sub-100 nm CMOS ASICs and the Insecurity of Masking Schemes in Low-Noise Environments. IACR Trans. Cryptogr. Hardw. Embed. Syst. 2019, 3 (2019), 202–232.
- Moos (2019b) Thorben Moos. 2019b. Static power SCA of sub-100 nm CMOS asics and the insecurity of masking schemes in low-noise environments. IACR Transactions on Cryptographic Hardware and Embedded Systems (2019), 202–232.
- Moos et al. (2019) Thorben Moos, Amir Moradi, and Bastian Richter. 2019. Static power side-channel analysis—An investigation of measurement factors. IEEE Transactions on Very Large Scale Integration (VLSI) Systems 28, 2 (2019), 376–389.
- Moradi (2014) Amir Moradi. 2014. Side-Channel Leakage through Static Power: Should We Care about in Practice?. In Cryptographic Hardware and Embedded Systems–CHES 2014: 16th International Workshop, Busan, South Korea, September 23-26, 2014. Proceedings 16. Springer, 562–579.
- Mosavirik et al. (2022) Tahoura Mosavirik, Fatemeh Ganji, Patrick Schaumont, and Shahin Tajik. 2022. Scatterverif: Verification of electronic boards using reflection response of power distribution network. ACM Journal on Emerging Technologies in Computing Systems (JETC) 18, 4 (2022), 1–24.
- Mosavirik et al. (2023a) Tahoura Mosavirik, Saleh Khalaj Monfared, Maryam Saadat Safa, and Shahin Tajik. 2023a. Silicon Echoes: Non-Invasive Trojan and Tamper Detection using Frequency-Selective Impedance Analysis. IACR Transactions on Cryptographic Hardware and Embedded Systems (2023), 238–261.
- Mosavirik et al. (2023b) Tahoura Mosavirik, Patrick Schaumont, and Shahin Tajik. 2023b. Impedanceverif: On-chip impedance sensing for system-level tampering detection. IACR Transactions on Cryptographic Hardware and Embedded Systems (2023), 301–325.
- NewAE (2023a) NewAE. 2023a. CW305 Artix FPGA Target. https://rtfm.newae.com/Targets/CW30520Artix20FPGA. Accessed: 2023-04-26.
- NewAE (2023b) NewAE. 2023b. NewAE Hardware Product. https://rtfm.newae.com/Capture/ChipWhisperer-Lite/. Accessed: 2023-04-26.
- Nguyen et al. (2019) Luong N Nguyen, Chia-Lin Cheng, Milos Prvulovic, and Alenka Zajić. 2019. Creating a Backscattering Side Channel to Enable Detection of Dormant Hardware Trojans. IEEE transactions on very large scale integration (VLSI) systems 27, 7 (2019), 1561–1574.
- Nguyen et al. (2020) Luong N. Nguyen, Baki Berkay Yilmaz, Milos Prvulovic, and Alenka Zajic. 2020. A Novel Golden-Chip-Free Clustering Technique Using Backscattering Side Channel for Hardware Trojan Detection. In 2020 IEEE International Symposium on Hardware Oriented Security and Trust (HOST). 1–12.
- Oswald and Mangard (2006) Elisabeth Oswald and Stefan Mangard. 2006. Template attacks on masking—resistance is futile. In Topics in Cryptology–CT-RSA 2007: The Cryptographers’ Track at the RSA Conference 2007, San Francisco, CA, USA, February 5-9, 2007. Proceedings. Springer, 243–256.
- Papagiannopoulos et al. (2023) Kostas Papagiannopoulos, Ognjen Glamočanin, Melissa Azouaoui, Dorian Ros, Francesco Regazzoni, and Mirjana Stojilović. 2023. The side-channel metrics cheat sheet. Comput. Surveys 55, 10 (2023), 1–38.
- Peng et al. (2016) Bile Peng, Sebastian Rey, and Thomas Kürner. 2016. Channel characteristics study for future indoor millimeter and submillimeter wireless communications. In 2016 10th European Conference on Antennas and Propagation (EuCAP). IEEE, 1–5.
- Pozar (2011) David M Pozar. 2011. Microwave engineering. John wiley & sons. 299 pages.
- Prouff et al. (2009) Emmanuel Prouff, Matthieu Rivain, and Régis Bevan. 2009. Statistical analysis of second order differential power analysis. IEEE Transactions on computers 58, 6 (2009), 799–811.
- Pupalaikis (2020) Peter J Pupalaikis. 2020. S-parameters for Signal Integrity. Cambridge University Press.
- Quek et al. (2015) Li Chuang Quek, Ming Dak Chai, and Heng Chuan Shu. 2015. Characterization of on die capacitance and silicon measurement correlation. In 2015 International Conference on Electronics Packaging and iMAPS All Asia Conference (ICEP-IAAC). IEEE, 739–742.
- Reparaz et al. (2015) Oscar Reparaz, Begül Bilgin, Svetla Nikova, Benedikt Gierlichs, and Ingrid Verbauwhede. 2015. Consolidating masking schemes. In Advances in Cryptology–CRYPTO 2015: 35th Annual Cryptology Conference, Santa Barbara, CA, USA, August 16-20, 2015, Proceedings, Part I 35. Springer, 764–783.
- Rossi (2018) Richard J Rossi. 2018. Mathematical statistics: an introduction to likelihood based inference. John Wiley & Sons.
- Smith and Bogatin (2017) Larry D. Smith and Eric Bogatin. 2017. Principles of Power Integrity for PDN Design–simplified: Robust and Cost Effective Design for High Speed Digital Products. Prentice Hall (2017).
- Smith et al. (2011) Larry D. Smith, Shishuang Sun, Mayra Sarmiento, Li Zhe, and Karthik Chandrasekar. 2011. On-Die Capacitance Measurements in the Frequency and Time Domains. DesignCon, Santa Clara, CA (2011).
- Specht et al. (2018) Robert Specht, Vincent Immler, Florian Unterstein, Johann Heyszl, and Georg Sig. 2018. Dividing the threshold: Multi-probe localized EM analysis on threshold implementations. In 2018 IEEE International Symposium on Hardware Oriented Security and Trust (HOST). IEEE, 33–40.
- Standaert et al. (2009) François-Xavier Standaert, Tal G Malkin, and Moti Yung. 2009. A unified framework for the analysis of side-channel key recovery attacks. In Advances in Cryptology-EUROCRYPT 2009: 28th Annual International Conference on the Theory and Applications of Cryptographic Techniques, Cologne, Germany, April 26-30, 2009. Proceedings 28. Springer, 443–461.
- Standaert et al. (2005) F-X Standaert, Eric Peeters, and J-J Quisquater. 2005. On the masking countermeasure and higher-order power analysis attacks. In International Conference on Information Technology: Coding and Computing (ITCC’05)-Volume II, Vol. 1. IEEE, 562–567.
- Trees et al. (2013) HL van Trees, KL Bell, and Z Tian. 2013. Detection estimation and modulation theory, part I: Detection, estimation, and filtering theory. A Papoulis Probability Random Variables & Stochastic Processes 8, 10 (2013), 293–303.
- Wu et al. (2022) Lichao Wu, Guilherme Perin, and Stjepan Picek. 2022. The best of two worlds: Deep learning-assisted template attack. IACR Transactions on Cryptographic Hardware and Embedded Systems (2022), 413–437.
- Xilinx (2023) Xilinx. 2023. Xilinx Constraints Guide. https://www.xilinx.com/htmldocs/xilinx14_7/cgd.pdf. Accessed: 2023-04-26.
- Yin and Cheng (2016) Xuefeng Yin and Xiang Cheng. 2016. Propagation channel characterization, parameter estimation, and modeling for wireless communications. John Wiley & Sons.
- Zhu et al. (2022) Huifeng Zhu, Haoqi Shan, Dean Sullivan, Xiaolong Guo, Yier Jin, and Xuan Zhang. 2022. PDNPulse: Sensing PCB Anomaly with the Intrinsic Power Delivery Network. (2022), 1–17.