Supplementary Information to “Stabilised Coupled Trajectory Mixed Quantum Classical Algorithm with Improved Energy Conservation: CTMQC-EDI”
Aaron Dines1, Matthew Ellis1 and Jochen Blumberger
1 Department of Physics and Astronomy and Thomas Young Centre, University College London, Gower Street, London WC1E 6BT, United Kingdom
October 2023
I Convergence
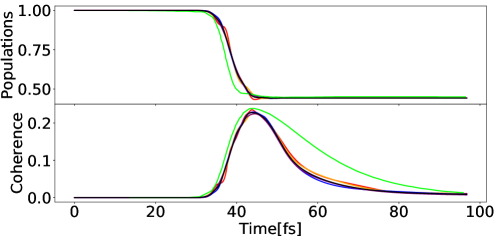
In the main text we assert that the populations and coherence were well-converged at trajectories. We demonstrate this below in Figure S1. Note that even at trajectories (red line) the qualitative behaviour is well-captured. We found the same properties applied for the Regularisation and Cut-Off methods.
Figure S1: Convergence of average population and coherence in CTMQC-EDI simulations for Tully I at [a.u]. Results from simulations with , , , and trajectories correspond to red, orange, blue, black and purple lines respectively. Exact results (green) were extracted from Ref.Gossel et al. (2018).
II Summary for All Models
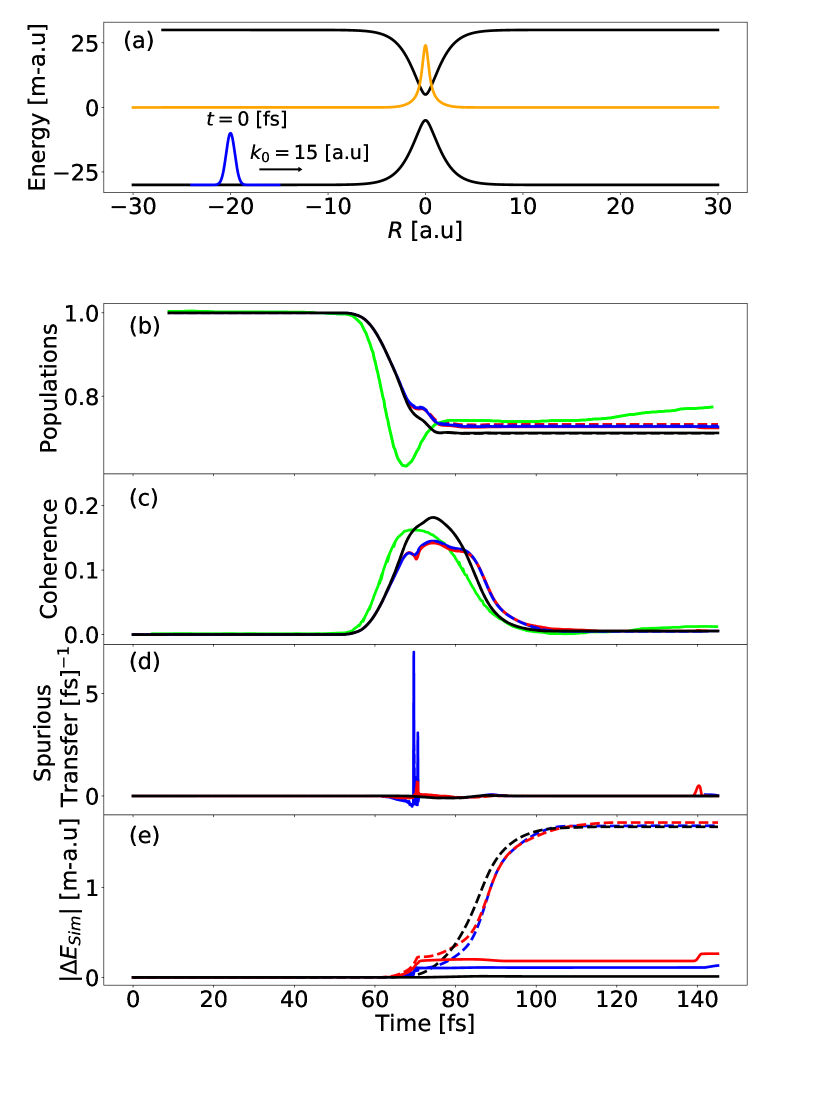
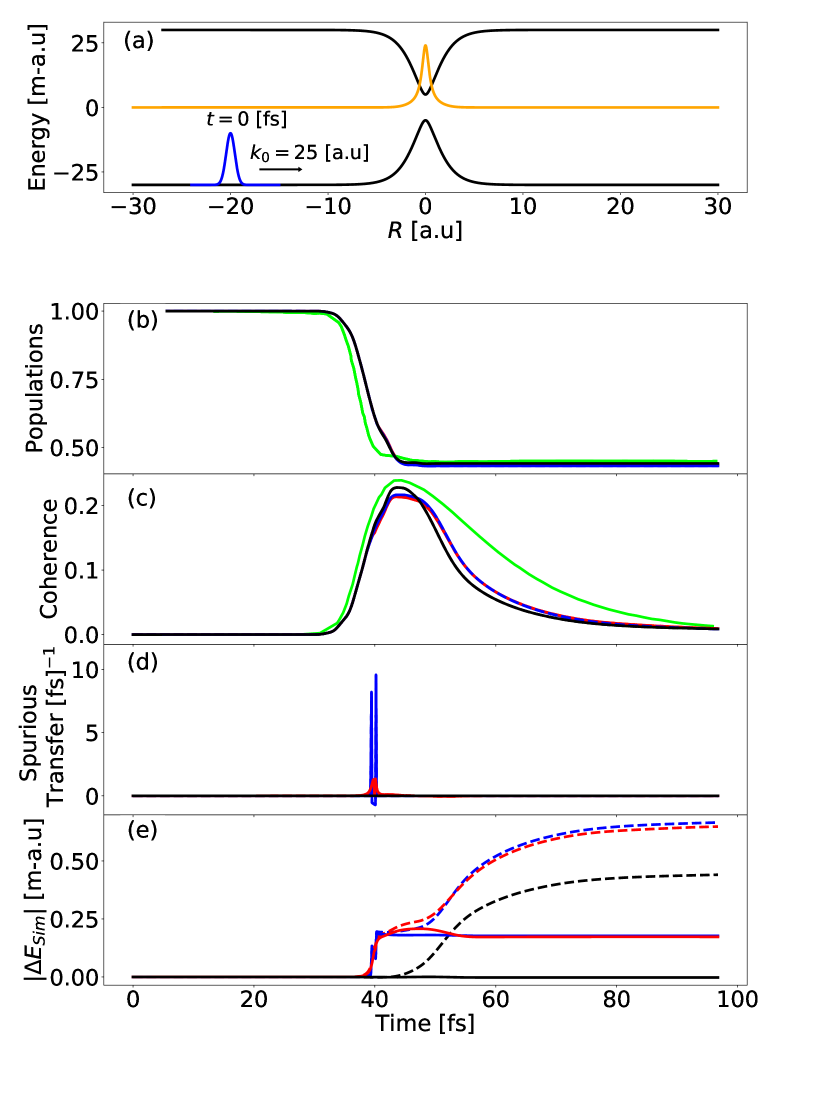
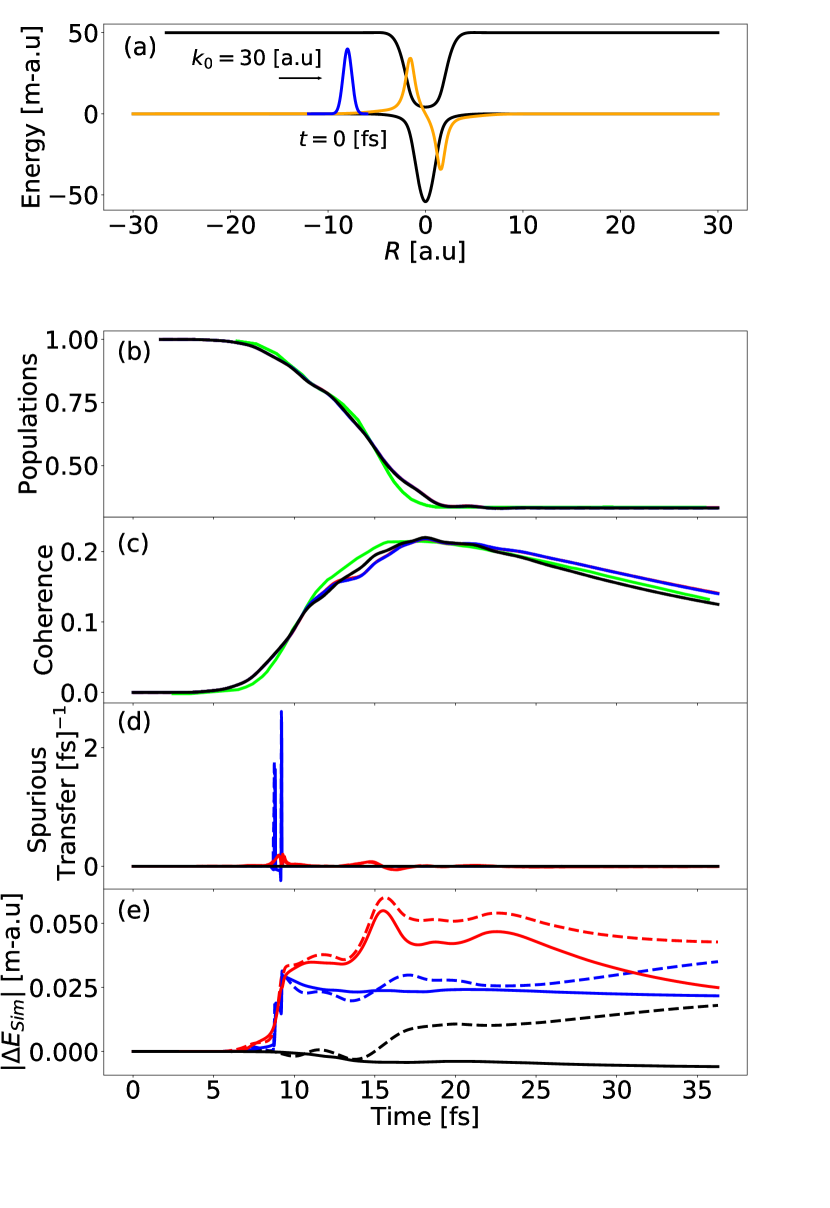
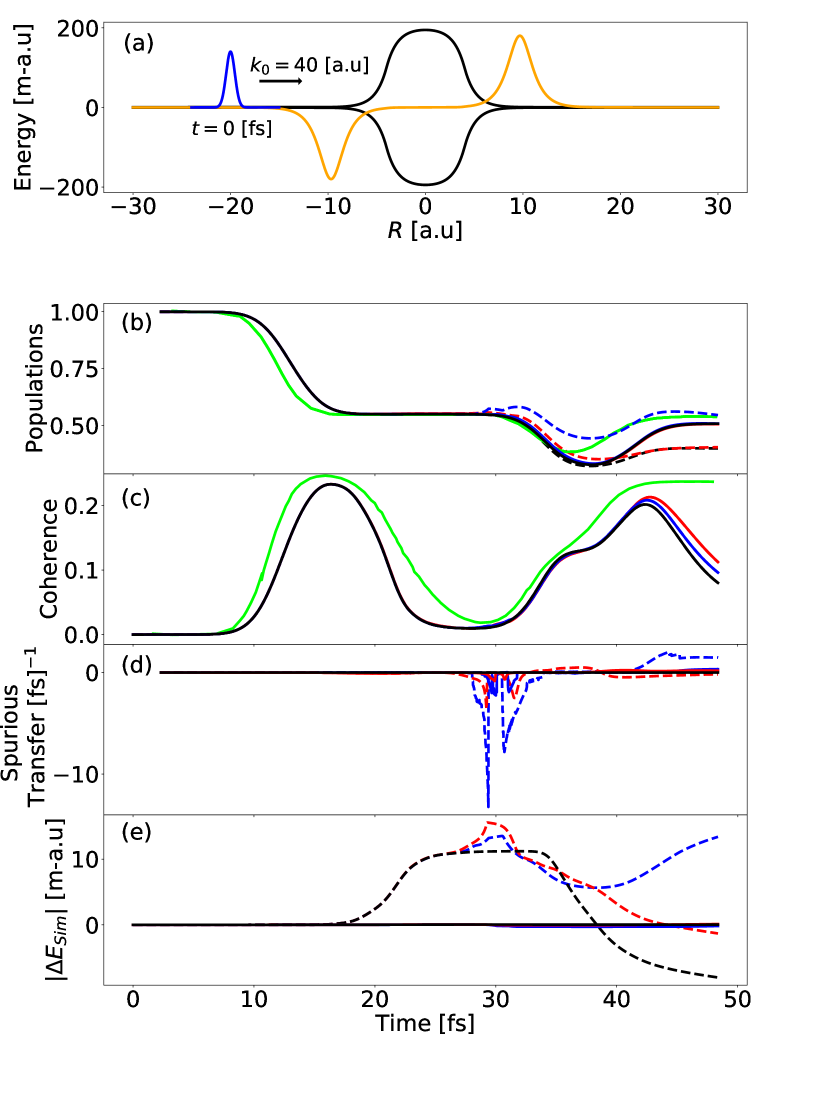
Figure S2: Summary of results for CTMQC (dashed lines) and CTMQC-E (solid lines) for Tully I for [a.u] (left) and [a.u] (right), with the centroid of the nuclear wavepacket initialised at [a.u]. The NACV in panel (a) is scaled by a factor of . Colour coding is as follows: CTMQC-EDI (black solid line), CTMQC-ER (red solid line), CTMQC-E with Cut-Off method (blue sold line), CTMQC-DI (black dashed line), CTMQC-R (red dashed line) and CTMQC with Cut-Off method (blue dashed line).
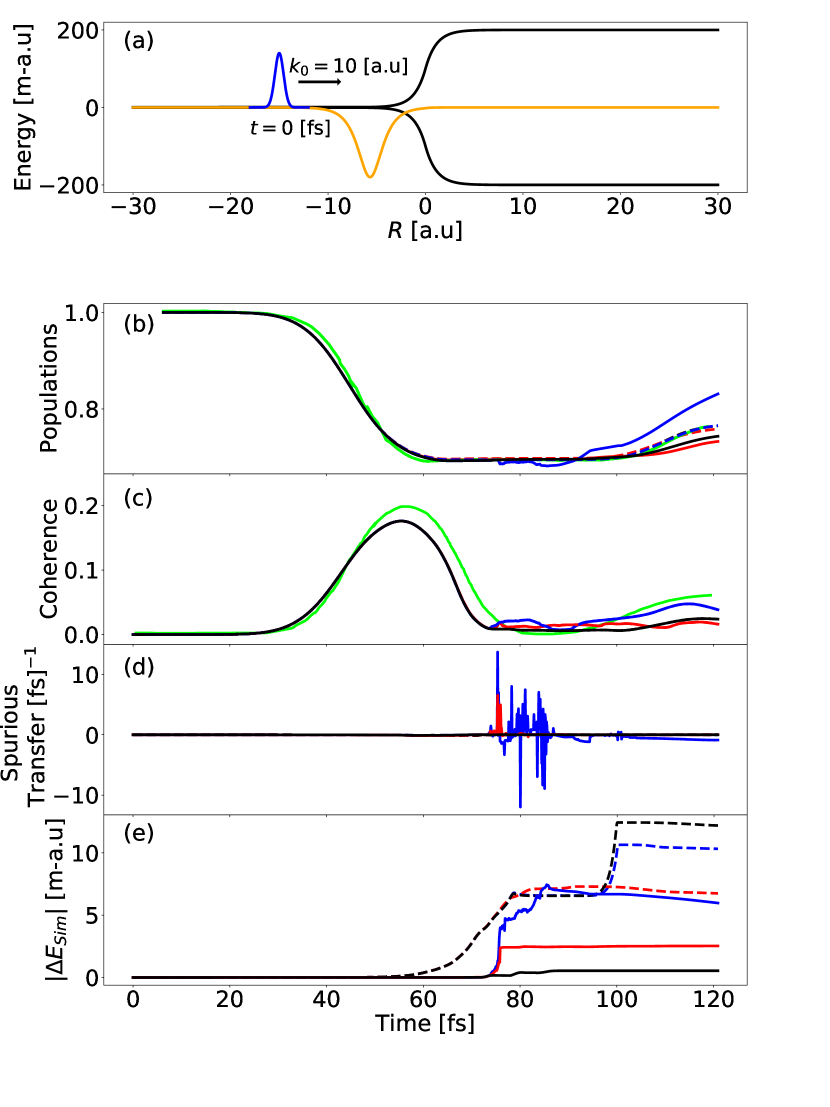
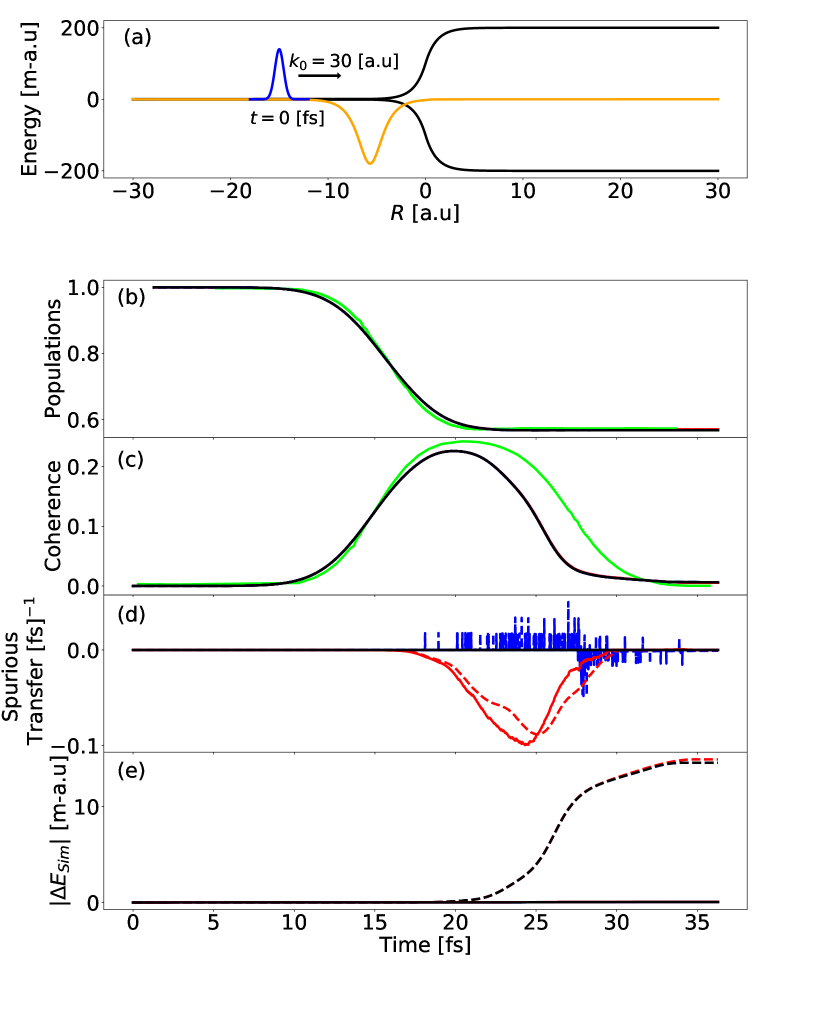
Figure S3: Summary of results for CTMQC (dashed lines) and CTMQC-E (solid lines) for Tully II for [a.u] (left) and [a.u] (right), with the centroid of the nuclear wavepacket initialised at [a.u]. The NACV in panel (a) is scaled by a factor of . Colour coding as in Figure S2.
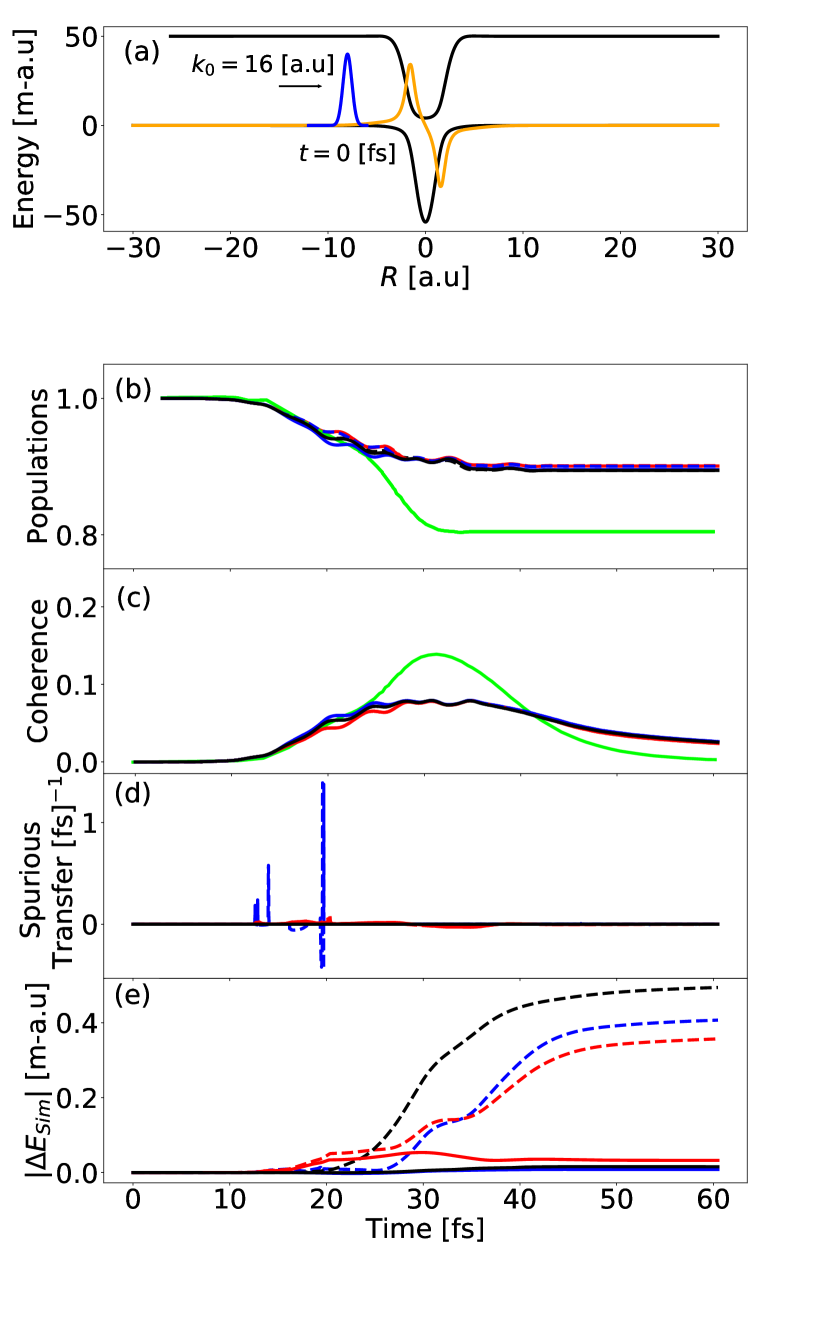
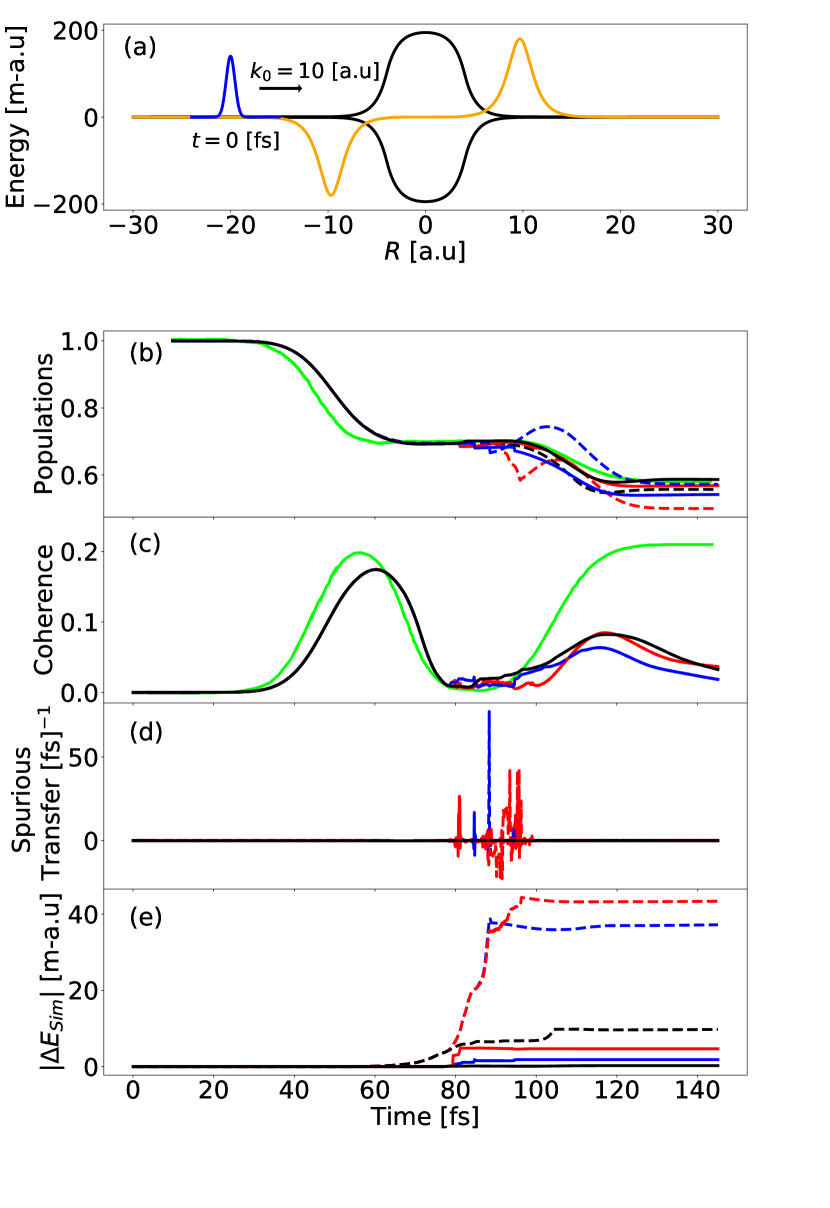
Figure S4: Summary of results for CTMQC (dashed lines) and CTMQC-E (solid lines) for Tully III for [a.u] (left) and [a.u] (right), with the centroid of the wavepacket initialised at [a.u]. The NACV in panel (a) is scaled by a factor of . Colour coding as in Figure S2.
Figure S5: Summary of results for CTMQC (dashed lines) and CTMQC-E (solid lines) for Tully IV for [a.u] (left) and [a.u] (right), with the centroid of the wavepacket initialised at [a.u]. The NACV in panel (a) is scaled by a factor of . Colour coding as in Figure S2.
References
Gossel et al. (2018)
G. H. Gossel, F. Agostini, and N. T. Maitra, J.Chem. Theory Comput.14, 4513 (2018).