Dusty Star Formation Halfway To Cosmic Noon
Halfway to the peak: Spatially resolved star formation and kinematics in a z=0.54 dusty galaxy with JWST/MIRI
Abstract
We present JWST/MIRI/MRS observations of an infrared luminous disk galaxy, FLS1, at z0.54. With a lookback time of 5 Gyr, FLS1 is chronologically at the midpoint between the peak epoch of star formation and the present day. The MRS data provide maps of the atomic fine structure lines [Ar II]6.99 µm, [Ar III]8.99 µm, [Ne II]12.81 µm, and [Ne III]15.55 µm, polycyclic aromatic hydrocarbon (PAH) features at 3.3 µm, 6.2 µm, and 11.3 µm, and the warm molecular gas indicators H2S(5) and H2S(3); all these emission features are spatially resolved. We find that the PAH emission is more extended along the Northern side of the galaxy when compared to the well-studied star-formation tracer [Ne II]. The H2 rotational lines, which are shock indicators, are strongest and most extended on the Southern side of the galaxy. [Ar II] is the second brightest fine structure line detected in FLS1 and we show that it is a useful kinematic probe which can be detected with JWST out to z3. Velocity maps of [Ar II] show a rotating disk with signs of turbulence. Our results provide an example of how spatially resolved mid-infrared spectroscopy can allow us to better understand the star formation and ISM conditions in a galaxy halfway back to the peak epoch of galaxy evolution.
1 Introduction
Galaxies have experienced significant evolution during the past 10 billion years with a steady decline in both the star formation and black hole accretion rate densities. Given the pervasive dust obscuration, the energy released by both processes is primarily emitted in the infrared (e.g., Madau & Dickinson, 2014). With the Mid-InfraRed Instrument (MIRI) on JWST, we can spatially resolve multiple spectral tracers of dust-obscured star formation beyond the local Universe to better understand the global evolution of galaxies.
The InfraRed Spectrograph (IRS) on Spitzer provided spectra that could separate star formation and active galactic nuclei (AGN) activity in galaxies out to z4 (Yan et al., 2007; Pope et al., 2008; Riechers et al., 2014), but these observations were spatially unresolved. Spitzer and Infrared Space Observatory (ISO) enabled spatially resolved measurements of the mid-infrared continuum and line emission in nearby galaxies (e.g., Le Floc’h et al., 2001; Dale et al., 2009; Díaz-Santos et al., 2010, 2011). Several mid-infrared studies suggested that star formation at high redshift was likely more spatially extended than in the local universe (e.g., Rigby et al., 2008; Menéndez-Delmestre et al., 2009). The Atacama Large Milimeter Array has since resolved the cold dust and gas in z=2-3 sub-milimeter galaxies and found that the cold dust is usually more compact than the stellar mass and the cold molecular gas (e.g., Lang et al., 2019; Calistro Rivera et al., 2018). With MIRI Medium Resolution Spectrograph (MRS), we can look at warm star-forming gas to determine how it is distributed in galaxies locally and at high redshift in order to measure any evolution since the peak epoch of star formation.
Given the sensitivity and resolution of MIRI/MRS, we now resolve polycyclic aromatic hydrocarbon (PAH) destruction and ionization as a function of radiation field harshness within individual galaxies (e.g. Lai et al., 2022; Armus et al., 2023). Spatial variations in PAH emission have even been resolved in a lensed galaxy at (Spilker et al., 2023). The high spectral resolution has also enabled kinematic studies of shocks and outflows (e.g., U et al., 2022; Goold et al., 2023; Rich et al., 2023). Lines such as [Ar II]6.99 µm are strong in nearby infrared-luminous galaxies (e.g. U et al., 2022), and have yet to be explored beyond the local Universe.
In this letter, we report on new JWST MIRI/MRS observations of FLS1111Also known as MIPS562 and WISEA J171239.73+585955.1. These observations allow us, for the first time, to measure the spatial extent of multiple atomic, molecular, and PAH emission features in a dusty star-forming galaxy at z=0.54 (Sajina et al., 2012). FLS1 is drawn from the Halfway to the Peak sample, which consists of eight massive () IR-luminous () galaxies with Spitzer IRS redshifts from z0.5-0.6. In Hubble Space Telescope (HST) F160W (rest-frame optical) imaging FLS1 appears to be a large disk galaxy with signs of extended emission (Zamojski et al., 2011). From low resolution Spitzer/IRS spectra, FLS1 shows strong star forming lines suggesting a minimal AGN contribution (Sajina et al., 2012). Our detailed analysis of FLS1 allows us to explore the resolved star forming conditions in a galaxy halfway back to the peak epoch of galaxy evolution, a time when the overall rate of star-formation in galaxies was rapidly falling.
In Section 2 we describe our observations and data reduction methods. In Section 3 we discuss the results of spectral extraction and line profile fitting. In Section 4 we examine these results and draw conclusions about the physical nature of FLS1, followed by a summary in Section 5. In this letter, we assume a cosmology of , , and , and a Kroupa (2001) IMF.
2 Observations and Data Reduction
Observations of FLS1 were collected as part of GO program 1762 using the JWST MIRI MRS integral field unit (Wright et al., 2023) with 2220 s in each of the three subbands. This program consisted of eight objects, six of which, including FLS1, are from the same field and were observed within a 13-day span in July/August 2022. We did not use a dedicated background since the target was predicted to be small enough that we could use the off source pixels for background subtraction. Uncalibrated observations of the source were reduced and assembled into spectral data cubes using the standard JWST Science Calibration Pipeline 1.9.6 (Bushouse et al., 2023) with CRDS release jwst_1100.pmap, with several customizations summarized below. A complete description of our data reduction procedure will be presented in Young et al. (in prep.).
-
1.
The dark subtraction step in stage 1 was turned off, since the standard dark was not taken with the same number of groups as our data. Calibration data with different number of groups are known to introduce additional noise, which our experiments confirmed.
-
2.
The stage 1 reduction (Detector1Pipeline) was run twice, once with parameters optimized to detect small cosmic rays and again with parameters to detect and repair larger cosmic ray “showers”.
-
3.
All six objects observed in July/August were reduced through the standard stage 2 Spec2Pipeline and stage 3 Spec3Pipeline steps to create preliminary cubes for each channel. These cubes were collapsed (averaged over the wavelength axis), and 8 detection contours were generated around each target. These contours were used for masking in the following steps.
-
4.
With the primary targets masked, the stage 1 rate files for the six objects observed in July/August were median combined on a per detector/grating setting basis to generate master backgrounds, which were subtracted from each of the rate files prior to re-running the stage 2 Spec2Pipeline reduction.
-
5.
Residual fringe corrections were made to the 2D calibrated rate files as a final step within stage 2 reduction Spec2Pipeline using the jwst.residual_fringe package.
-
6.
Prior to the stage 3 reduction Spec3Pipeline, residual background subtraction was performed on a per-slice basis using the median of non-masked pixels within each row of each slice. (the “slices” are the dispersed spectra from each section of the image slicer).
-
7.
For analyses requiring 1D spectra extracted from the cubes, the residual fringe removal code rfc1d_utils was applied to the 1D spectra.
The background removed in steps 4 and 6 includes both astrophysical and instrumental background. In many of the following analyses we compare features at different wavelengths. Unless otherwise stated, these analyses use cubes with all the wavelength slices convolved to the spatial resolution of [Ne II]12.81 µm. The angular resolution in each wavelength slice was estimated from the in-flight data presented in Argyriou et al. (2023). In addition to the MRS data, our program also took simultaneous observations with the MIRI imager at 5.6 µm, spatially offset from our primary target. In this letter, we use these parallel imaging data for the purposes of verifying astrometry.
2.1 Astrometric Corrections
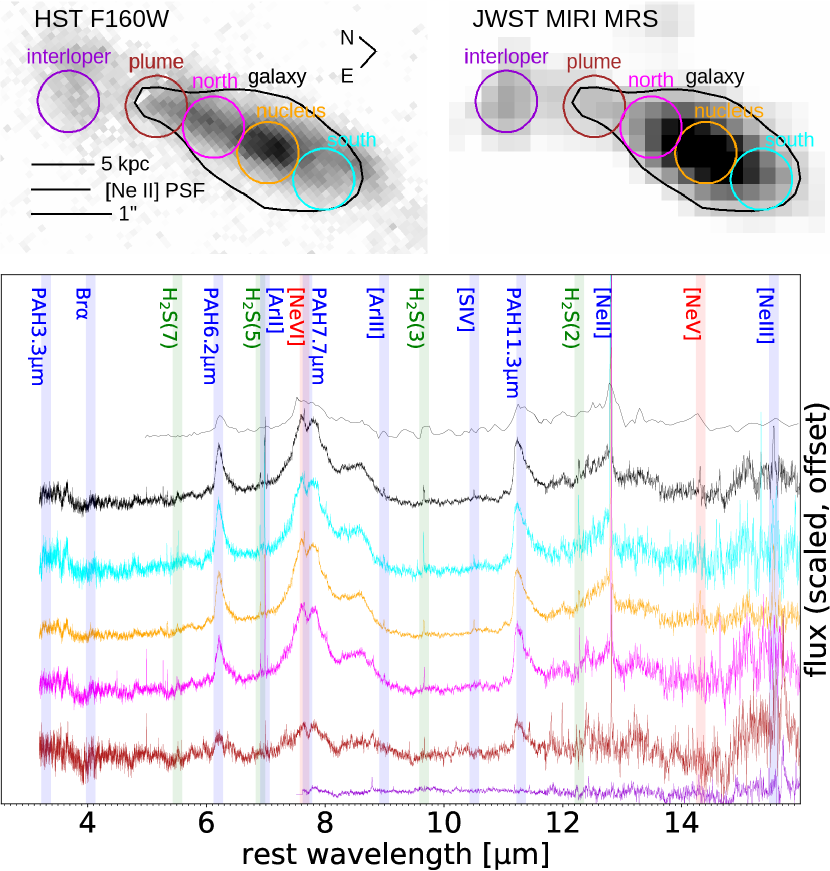
Figure 1 shows both our collapsed JWST MIRI spectral cube as well as a HST F160W (rest-frame optical) image of this galaxy. The difference in the positions of two stars in the HST image and three stars in the MIRI 5.6 µm image (not shown) to their Gaia positions show offsets of (+,-) in the HST image and (+,+) in the MIRI image. The HST astrometry was adjusted by these amounts to bring it into alignment with the MIRI data. The Gaia corrected position of the nucleus (orange circle in Figure 1) is 17:12:39.4 +58:59:54.1.
2.2 Spectral Extraction
Figure 1 shows several circular apertures which were used to extract spectra at different positions across the galaxy. Each aperture has a diameter of (4.8 kpc), the in-flight PSF FWHM of MRS at the observed wavelength of [Ne II] at z=0.54 (Argyriou et al., 2023). The [Ne II] beam was used as an aperture because it is the longest wavelength used in most of our analyses. The larger irregular black line denotes a 4 MRS detection contour from which we extracted the total galaxy spectrum. The lower panel in Figure 1 shows the extracted spectra from each of these apertures, using the same color codes. The interloper has a spectrum that is not consistent with the redshift of FLS1, so we do not consider it in this letter.
Our analysis that uses the smaller beam-sized apertures is focused on comparisons of line flux ratios, and so no aperture corrections are needed. We have also made no attempt to correct for extinction. Even in dusty galaxies, mid-IR extinction is expected to be mild and relatively flat (Stone et al., 2022), except in silicate and ice absorption bands (Draine, 2003). The spectral features discussed in this letter are mostly outside those bands, with the exception of H2S(3).
2.3 Kinematic analysis
Due to its high signal-to-noise, isolation from other atomic lines, and high spatial resolution, we use the [Ar II] line to perform a kinematic analysis. We follow the procedure described in Gonçalves et al. (2010). In summary, we fit a single Gaussian profile to each spaxel, limited to km s-1 of the center of the integrated emission, with an additional free parameter to allow an average continuum value underneath the line. The position of the peak of the Gaussian profile determines the velocity of that spaxel, while the standard deviation of the Gaussian fit is adopted as the velocity dispersion. The signal-to-noise is determined from the standard deviation of spaxels away from the galaxy, where only background noise is expected. The angular resolution in our velocity maps is (2.7 kpc at z=0.54), the spatial resolution at the observed wavelength of [Ar II].
3 Results
3.1 Line strengths and profiles
Figure 1 marks the key emission features in each extracted spectrum. The PAH 6.2, 7.7, and 11.3 m features and the atomic star-formation indicators [Ne II], [Ar II], [Ne III]15.55 µm, and [Ar III]8.99 µm are visible in all of the regions of FLS1. [Ne II] and [Ar II] are particularly bright. Higher ionization lines indicative of AGN, [Ne V]14.32 m and [Ne VI]7.65 m, are visible in the nucleus. We also see strong detections of the molecular hydrogen lines H2S(3) and H2S(5), and weaker detections of H2S(2), H2S(4), and H2S(7). For comparison, the top thin spectrum is the archival IRS spectrum for FLS1. While the broad characteristics of the spectrum and the brighter PAH bands are visible in the IRS spectrum, most of the other lines are either undetected or unresolved. We verify the mid-infrared AGN fraction from the IRS spectrum by performing the exact same analysis on the new MRS full galaxy spectrum. Following the procedure in Pope et al. (2008), we fit a simple model consisting of a star formation template, power law emission from an AGN and extinction (Draine, 2003). We find a mid-IR AGN fraction of which suggests that the AGN does not have a significant effect on the overall energetics in the mid-IR. In this letter, we focus on the spatially resolved lines tracing star formation and shocked gas, and the AGN lines will be explored in a future paper.
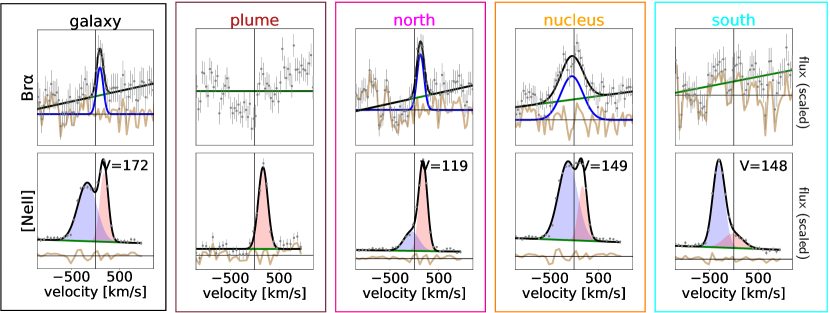
A key advantage of the MRS data is that most of our features are spectrally resolved. Figure 2 shows Gaussian line profile fits to Br and [Ne II]. Based on the in-flight performance analysis (Argyriou et al., 2023), the MRS data have a velocity resolution of 79 km/s and 144 km/s at Br and [Ne II], respectively. Based on the fit to the whole-galaxy Br, we find a redshift of 0.53850.0007, which we adopt as our systemic redshift. The galaxy and nucleus [Ne II] profiles clearly show double-peaked structure, so we fit the [Ne II] profiles with a linear continuum plus a double Gaussian model. In all cases, the velocity half separations between components were found to be less than 200 km/s. Br was detected in the north, nucleus, and galaxy regions; the line shows a single peak in kinematic alignment with the bluer [Ne II] peaks.
Similar fits were performed for [Ne II], [Ar II] and [Ar III] and the strongest molecular hydrogen features, H2S(5) and H2S(3). Table 1 lists the integrated line fluxes. The uncertainties are the standard deviations of the flux values from 1,000 Monte-Carlo realizations in which Gaussian noise corresponding to the measured 1 uncertainty was added to each spectral point and the fitting was repeated.
3.2 Star Formation Rates
We compare different MIR SFR indicators using the spectral lines from Table 1, which have not been corrected for extinction. Using the [Ne II] measurement for the full galaxy and the empirical LIR/[Ne II] relationship in Ho & Keto (2007) we estimate log(LIR/L⊙) of 11.93, in close agreement with the Spitzer+Herschel derived 11.91 cited in Sajina et al. (2012). With the SFR/LIR relationship from Murphy et al. (2011), we calculate a [Ne II] galaxy-wide SFR of 128 M⊙ yr-1 with an uncertainty of 0.5 dex from the [Ne II]/LIR calibration. Of the total [Ne II] SFR, 432% comes from the nucleus.
In order to compare SFRs from other indicators, we focus on the nucleus, where the Br and [Ne III] detections are the strongest. The [Ne II]-derived SFR in the nucleus is 552 M⊙ yr-1. Using the [Ne II]+[Ne III] SFR relation (Ho & Keto, 2007, 0.26 dex scatter) we calculate 271 M⊙ yr-1, which is consistent with the metallicity dependent relation from Zhuang et al. (2019) assuming solar metallicity. Since the [Ne II] SFR from Murphy et al. (2011) assumes a Kroupa IMF and the [Ne II]+[Ne III] calibrations assume a Salpeter IMF, we have adjusted the [Ne II]+[Ne III] SFR by a factor of 0.68 (Kennicutt & Evans, 2012). The nucleus Br emission translates to an SFR of 132 M⊙ yr-1, assuming case-B emissivity coefficients for and (Storey & Hummer, 1995) and the H/SFR relationship in Kennicutt & Evans (2012). While the uncertainties on the SFR calibrations account for these different SFR values, a number of physical mechanisms could contribute towards the lower Br SFR, such as differential extinction, the spatial distributions of different tracers, star formation timescales, and continuum absorption. Given the low SNR detection of Br even in the nucleus, we caution against over-interpreting the Br SFR of this one source.
Although [Ar II] is a bright low-ionization line, we did not find any empirical [Ar II] SFR calibrations in the literature. Likewise, although the PAH features are strongly detected, they are blended with other features, including the silicate absorption, and a simple extraction assuming a linear continuum is not reliable. We will explore SFRs from Br, [Ar II] and PAHs with more sophisticated analysis of our full sample in a future paper.
| Br | [Ne II] | [Ne III] | [Ar II] | [Ar III] | H2S(5) | H2S(3) | |
|---|---|---|---|---|---|---|---|
| 4.05 µm | 12.81 µm | 15.56 µm | 6.99 µm | 8.99 µm | 6.91 µm | 9.67 µm | |
| galaxy | 103.3 32.4 | 2050.7 36.4 | 340.1 82.3 | 999.9 40.5 | 135.9 15.3 | 199.6 44.3 | 212.1 20.9 |
| north | 22.7 6.3 | 284.0 3.6 | 29.4 13.3 | 111.2 6.1 | 14.8 4.3 | 22.5 2.3 | 21.6 2.6 |
| nucleus | 88.1 14.1 | 882.2 27.0 | 228.5 32.6 | 435.4 4.7 | 44.9 2.7 | 82.3 8.0 | 62.1 2.9 |
| plume | 37.2 | 70.0 4.1 | 21.3 | 21.4 4.1 | 16.7 | 5.9 1.9 | 14.0 |
| south | 38.8 | 279.4 9.2 | 22.3 | 139.2 2.8 | 18.9 3.2 | 35.5 2.5 | 37.5 2.2 |
3.3 Spatial Extent of Emission Features
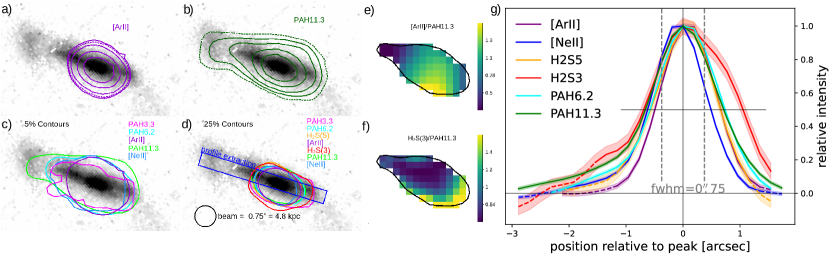
Figure 3 (panels a-d) overlays the HST rest-frame optical image with contours generated from narrow-band images of the spectral lines, and panel g compares the spatial emission profiles of those features along the major axis of FLS1. For the atomic and molecular features, the continuum was removed from the narrow-band images by fitting a linear continuum anchored in two flanking windows. Because the PAH features span a much wider spectral range and are blended with other features (such as silicate absorption), the assumption of a linear continuum is less reliable for PAHs. However, PAH features also contain much more flux, making the continuum fit less significant for determining the spatial extent. We found that including continuum subtraction for the PAH features had almost no impact on most of the contours. The exception was the 3.3 µm PAH feature in Figure 3, where skipping the continuum removal significantly reduced the noise since the continuum is low compared to the noise.
Both the contour plots (panels a-d) and the extracted spatial profiles (panel g) in Figure 3 show that all the features are broader than the [Ne II] beam, making FLS1 the first galaxy with resolved detections of the atomic, warm molecular gas, and PAH lines outside the local universe. We also find that the PAH spatial profiles are more extended than the atomic features and the warm molecular gas features (considering the same percentile contours, panels e and f). We discuss the implications of the different spatial distributions in Section 4.
3.4 Velocity Field
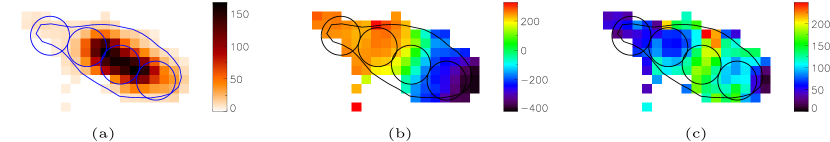
Figure 2 shows that different regions in the disk of FLS1 are offset in velocity. In Figure 4 we show the moment maps of FLS1 for the [Ar II] line. The velocity map is consistent with a rotating disk, with no evidence for large scale systematic departures from circular rotation such as an ongoing major merger. The in-flight performance analysis (Argyriou et al., 2023) indicate a velocity resolution of 92 km/s at the observed wavelength of [Ar II], so we cannot rule out minor departures from circular rotation.
We estimate , where and are the medians of the lower and upper 10th percentile velocities (Gonçalves et al., 2010). This gives us km s-1. The light weighted average of the line width is 118 km s-1 after correcting for the instrumental width in quadrature. Adopting this line width as a characteristic dispersion and adopting as a characteristic velocity, we find , consistent with a turbulent rotating disk.
We investigate whether the kinematics found for [Ar II] are consistent for other lines. Specifically, we rerun our analysis on [Ne II], the brightest line in our spectra, and H2S(5), which is in the same channel as [Ar II]. We find the velocity fields of [Ne II] and H2S(5) also show rotation with , but have lower spatial resolution and lower signal to noise, respectively.
4 Discussion
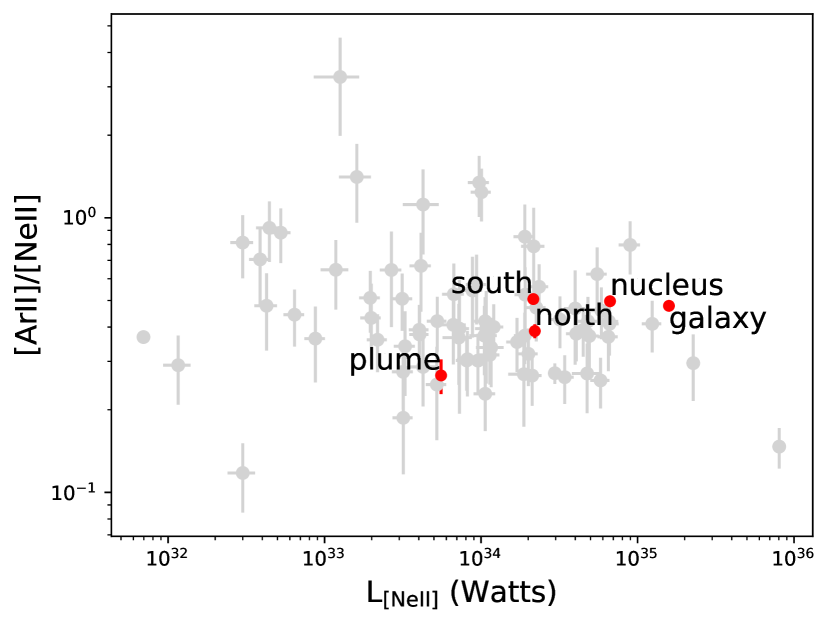
Since [Ar II] is a bright light at a much shorter wavelength than [Ne II] or [Ne III], it is well positioned to be a key tracer of star formation and kinematics at higher redshifts in the JWST era. In Figure 5 we compare the [Ar II]/[Ne II] ratio to [Ne II] luminosity for all five regions of FLS1 and a range of local galaxies. The comparison galaxy observations are from Spitzer IRS and ISO Short Wavelength Spectrometer (SWS), with heterogeneous spatial coverage ranging from whole-galaxy measurements to nuclear measurements, and are included to provide a context for the range of values seen in the local universe. The local measurement span an order of magnitude in [Ar II]/[Ne II] ratio, and all five regions of FLS are consistent with the average. This supports the idea that [Ar II] and [Ne II] trace similar physical conditions, and shows that [Ar II] has the potential to trace star formation and kinematics at redshifts where [Ne II] is inaccessible.
The differences in the spatial extent of the emission features in Section 3.3 can be explained by differences in the current and recent star formation, the effect of the AGN, and/or the presence of shocks. Similar offsets between PAH and atomic lines have been reported in nearby dusty galaxies (Díaz-Santos et al., 2011; Lai et al., 2023). [Ne II] and [Ar II], which are sensitive to star formation within the past 10 Myr, are the most compact, while the PAH emission is more extended. PAH emission traces star formation within the past several 100 Myr (e.g., Smercina et al., 2018). The PAH 11.3 µm emission, which traces neutral PAHs, is the most extended feature we detect in FLS1. The PAH 6.2 µm emission, which is more sensitive to ionized PAHs (Draine et al., 2021), is intermediate in spatial extent between the PAH 11.3 µm and [Ne II] emission. These variations in the spatial extent of the PAH and atomic features are consistent with an ionization gradient driven by current star formation in the nucleus compared to recent star formation in the disk. We cannot rule out the influence of the AGN on the nuclear emission, in which case some degree of the ionization gradient could be attributed to the AGN.
The diminished spatial extent of the [Ne II], [Ar II], and PAH emission in the south compared to the north could be explained by a more turbulent environment in the southern disk that is less favorable for star formation. This scenario is supported by Figure 4c, where we see that the [Ar II] line width in the south region is around 100 km/s, compared to the 50 km/s typical of the north and plume regions. The shock-tracing H2S(3) line extends into the southern disk (Figure 3f,g), unlike fine structure and PAH features, further supporting the picture of a more disturbed environment in the southern disk. Given the high star-formation rate of FLS1, a recent gas accretion event may be the cause of the turbulence seen in the southern disk. In addition to shocks, warm H2 gas can also be heated by UV photons from young stars or by x-rays; however, the high H2/PAH contrast seen in the southern disk makes star formation an unlikely power source (e.g., Nesvadba et al., 2010; U et al., 2023), and the low AGN fraction makes x-rays unlikely.
The overall picture that emerges is consistent with current star formation in the nucleus, recent star formation in the northern disk, and shocks in the southern disk, although these data admit other interpretations. In Section 3.1 we found that the [Ne II] profiles are either single or double peaked, and in Section 3.4 we found that . Therefore, with no kinematic signs of disturbance, FLS1 is not likely undergoing a major merger. However, the hypothesized southern shocks and central starburst are in-line with a recent gas accretion event.
5 Summary
This work highlights the rich assortment of mid-IR spectral diagnostics that are spatially resolved in distant galaxies with MIRI MRS. It demonstrates the power of high spectral resolution spectroscopy to identify rotating disks, even at high redshift. FLS1 and the other galaxies in the Halfway to the Peak program represent a key stepping stone between cosmic noon and the modern universe. Our findings can be summarized as follows:
-
1.
While the Br SFR is roughly half that from the neon lines, they are consistent given the lower SNR detection of Br and scatter in SFR calibrations.
-
2.
We detect spatially extended emission from the star-formation tracers [Ne II] and [Ar II], PAH features at 3.3 , 6.2 and 11.3 µm, and the warm molecular gas tracers H2S(5) and H2S(3).
-
3.
PAH 11.3 µm emission is extended on the northern side of FLS1 and not detected on the southern side. All the PAH, atomic, and molecular features discussed are brightest in the nucleus. These observations are consistent with current star formation in the nucleus, recent star formation in the north, and shocked gas in the south.
-
4.
The kinematics show a rotating disk with , suggesting that FLS1 is not the site of a major merger.
-
5.
The [Ar II]/[Ne II] ratios in FLS1 are consistent with those seen in local galaxies.
In a forthcoming paper we will expand upon these analyses with a full spectral decomposition of the entire sample, which will allow us to test these findings across all eight objects.
Acknowledgments
We thank the anonymous reviewer for their thoughtful comments, which we believe have improved our manuscript. We are grateful to the following individuals who helped with the analysis of these data: David Law, Jane Morrison, Dick Shaw, Bryan Holler, Beth Sargent, and Sean Linden. Based on observations with the NASA/ESA/CSA James Webb Space Telescope obtained at the Space Telescope Science Institute, which is operated by the Association of Universities for Research in Astronomy, Incorporated, under NASA contract NAS5-03127. Support for program number JWST-GO-01762 was provided through a grant from the STScI under NASA contract NAS5-03127. The Flatiron Institute is supported by the Simons Foundation.
References
- Argyriou et al. (2023) Argyriou, I., Glasse, A., Law, D. R., et al. 2023, arXiv e-prints, arXiv:2303.13469, doi: 10.48550/arXiv.2303.13469
- Armus et al. (2006) Armus, L., Bernard-Salas, J., Spoon, H. W. W., et al. 2006, ApJ, 640, 204, doi: 10.1086/500040
- Armus et al. (2023) Armus, L., Lai, T., U, V., et al. 2023, ApJ, 942, L37, doi: 10.3847/2041-8213/acac66
- Bushouse et al. (2023) Bushouse, H., Eisenhamer, J., Dencheva, N., et al. 2023, JWST Calibration Pipeline, 1.9.6, Zenodo, Zenodo, doi: 10.5281/zenodo.7714020
- Calistro Rivera et al. (2018) Calistro Rivera, G., Hodge, J. A., Smail, I., et al. 2018, ApJ, 863, 56, doi: 10.3847/1538-4357/aacffa
- Dale et al. (2009) Dale, D. A., Smith, J. D. T., Schlawin, E. A., et al. 2009, ApJ, 693, 1821, doi: 10.1088/0004-637X/693/2/1821
- Díaz-Santos et al. (2010) Díaz-Santos, T., Alonso-Herrero, A., Colina, L., et al. 2010, ApJ, 711, 328, doi: 10.1088/0004-637X/711/1/328
- Díaz-Santos et al. (2011) Díaz-Santos, T., Charmandaris, V., Armus, L., et al. 2011, ApJ, 741, 32, doi: 10.1088/0004-637X/741/1/32
- Draine (2003) Draine, B. T. 2003, ARA&A, 41, 241, doi: 10.1146/annurev.astro.41.011802.094840
- Draine et al. (2021) Draine, B. T., Li, A., Hensley, B. S., et al. 2021, ApJ, 917, 3, doi: 10.3847/1538-4357/abff51
- Egami et al. (2006) Egami, E., Rieke, G. H., Fadda, D., & Hines, D. C. 2006, ApJ, 652, L21, doi: 10.1086/509886
- Förster Schreiber et al. (2001) Förster Schreiber, N. M., Genzel, R., Lutz, D., Kunze, D., & Sternberg, A. 2001, ApJ, 552, 544, doi: 10.1086/320546
- Gallimore et al. (2010) Gallimore, J. F., Yzaguirre, A., Jakoboski, J., et al. 2010, ApJS, 187, 172, doi: 10.1088/0067-0049/187/1/172
- Gonçalves et al. (2010) Gonçalves, T. S., Basu-Zych, A., Overzier, R., et al. 2010, ApJ, 724, 1373, doi: 10.1088/0004-637X/724/2/1373
- Goold et al. (2023) Goold, K., Seth, A., Molina, M., et al. 2023, arXiv e-prints, arXiv:2307.01252, doi: 10.48550/arXiv.2307.01252
- Ho & Keto (2007) Ho, L. C., & Keto, E. 2007, ApJ, 658, 314, doi: 10.1086/511260
- Kennicutt & Evans (2012) Kennicutt, R. C., & Evans, N. J. 2012, ARA&A, 50, 531, doi: 10.1146/annurev-astro-081811-125610
- Kroupa (2001) Kroupa, P. 2001, MNRAS, 322, 231, doi: 10.1046/j.1365-8711.2001.04022.x
- Lai et al. (2022) Lai, T. S. Y., Armus, L., U, V., et al. 2022, ApJ, 941, L36, doi: 10.3847/2041-8213/ac9ebf
- Lai et al. (2023) Lai, T. S. Y., Armus, L., Bianchin, M., et al. 2023, arXiv e-prints, arXiv:2307.15169, doi: 10.48550/arXiv.2307.15169
- Lang et al. (2019) Lang, P., Schinnerer, E., Smail, I., et al. 2019, ApJ, 879, 54, doi: 10.3847/1538-4357/ab1f77
- Le Floc’h et al. (2001) Le Floc’h, E., Mirabel, I. F., Laurent, O., et al. 2001, A&A, 367, 487, doi: 10.1051/0004-6361:20000569
- Madau & Dickinson (2014) Madau, P., & Dickinson, M. 2014, ARA&A, 52, 415, doi: 10.1146/annurev-astro-081811-125615
- Menéndez-Delmestre et al. (2009) Menéndez-Delmestre, K., Blain, A. W., Smail, I., et al. 2009, ApJ, 699, 667, doi: 10.1088/0004-637X/699/1/667
- Murphy et al. (2011) Murphy, E. J., Condon, J. J., Schinnerer, E., et al. 2011, ApJ, 737, 67, doi: 10.1088/0004-637X/737/2/67
- Nesvadba et al. (2010) Nesvadba, N. P. H., Boulanger, F., Salomé, P., et al. 2010, A&A, 521, A65, doi: 10.1051/0004-6361/200913333
- Pope et al. (2008) Pope, A., Chary, R.-R., Alexander, D. M., et al. 2008, ApJ, 675, 1171, doi: 10.1086/527030
- Rich et al. (2023) Rich, J., Aalto, S., Evans, A. S., et al. 2023, ApJ, 944, L50, doi: 10.3847/2041-8213/acb2b8
- Riechers et al. (2014) Riechers, D. A., Pope, A., Daddi, E., et al. 2014, ApJ, 786, 31, doi: 10.1088/0004-637X/786/1/31
- Rigby et al. (2008) Rigby, J. R., Marcillac, D., Egami, E., et al. 2008, ApJ, 675, 262, doi: 10.1086/525273
- Sajina et al. (2012) Sajina, A., Yan, L., Fadda, D., Dasyra, K., & Huynh, M. 2012, ApJ, 757, 13, doi: 10.1088/0004-637X/757/1/13
- Sales et al. (2010) Sales, D. A., Pastoriza, M. G., & Riffel, R. 2010, ApJ, 725, 605, doi: 10.1088/0004-637X/725/1/605
- Smercina et al. (2018) Smercina, A., Smith, J. D. T., Dale, D. A., et al. 2018, ApJ, 855, 51, doi: 10.3847/1538-4357/aaafcd
- Spilker et al. (2023) Spilker, J. S., Phadke, K. A., Aravena, M., et al. 2023, Nature, 618, 708, doi: 10.1038/s41586-023-05998-6
- Stone et al. (2022) Stone, M., Pope, A., McKinney, J., et al. 2022, ApJ, 934, 27, doi: 10.3847/1538-4357/ac778b
- Storey & Hummer (1995) Storey, P. J., & Hummer, D. G. 1995, MNRAS, 272, 41, doi: 10.1093/mnras/272.1.41
- U et al. (2022) U, V., Lai, T., Bianchin, M., et al. 2022, ApJ, 940, L5, doi: 10.3847/2041-8213/ac961c
- U et al. (2023) U, V., Lai, S.-Y. T., Bianchin, M., et al. 2023, in American Astronomical Society Meeting Abstracts, Vol. 55, American Astronomical Society Meeting Abstracts, 418.07
- Verma et al. (2003) Verma, A., Lutz, D., Sturm, E., et al. 2003, A&A, 403, 829, doi: 10.1051/0004-6361:20030408
- Wright et al. (2023) Wright, G. S., Rieke, G. H., Glasse, A., et al. 2023, PASP, 135, 048003, doi: 10.1088/1538-3873/acbe66
- Yan et al. (2007) Yan, L., Sajina, A., Fadda, D., et al. 2007, ApJ, 658, 778, doi: 10.1086/511516
- Zamojski et al. (2011) Zamojski, M., Yan, L., Dasyra, K., et al. 2011, ApJ, 730, 125, doi: 10.1088/0004-637X/730/2/125
- Zhuang et al. (2019) Zhuang, M.-Y., Ho, L. C., & Shangguan, J. 2019, ApJ, 873, 103, doi: 10.3847/1538-4357/ab0650