A lack of 9-s periodicity in the follow-up NuSTAR observation of LS 5039
Abstract
The Nuclear Spectroscopic Array (NuSTAR) observed the gamma-ray binary LS 5039 for a second time in order to check for the presence of a periodic signal candidate found in the data from the previous NuSTAR observation. We do not detect the candidate signal in the vicinity of its previously reported frequency, assuming the same orbital ephemeris as in our previous paper. This implies that the previously reported periodic signal candidate was a noise fluctuation. We also perform a comparison of the lightcurves from the two NuSTAR observations and the joint spectral fitting. Our spectral analysis confirms the phase-dependence found from a single NuSTAR observation at a higher significance level.
1 Introduction
High-mass gamma-ray binaries (HMGBs) are systems consisting of a high-mass star being orbited by a compact object. The compact object is typically thought to be either a neutron star (NS) or black hole (BH). Two Galactic HMGBs (namely, PSR B1259-63 and PSR J2032+4127) host young, rotation-powered pulsars which are expected to produce powerful relativistic winds. The interaction between the pulsar and stellar winds accelerates particles responsible for the broadband non-thermal (synchrotron and inverse Compton) emission from these systems. However, in several other known HMGBs the nature of the compact object remains unknown. LS 5039 is one of these systems.
LS 5039 is composed of a massive () O6.5V((f)) type star and a compact object () orbiting the star with a period days (the shortest among all Galactic HGMBs) and orbital inclination angle of (Casares et al., 2005; Aragona et al., 2009; Sarty et al., 2011; Casares et al., 2011). Radio observations have shown persistent AU-scale asymmetric extended emission around LS 5039, which have been dubbed “jets”, leading to its microquasar classification. However, the debate on whether the compact object is an accreting BH or a pulsar interacting with its surroundings and producing an extended nebula resembling “jet” (on milli-arcsecond scales) is still ongoing (see, e.g., Dubus 2013, 2015 for reviews). The interest in this topic was further fueled by the recent report of radio pulsations (Weng et al., 2022) from a very similar HMGB LS I +61∘ 303 where magnetar-like flaring was earlier reported (Torres et al., 2012).
Rea et al. (2011) performed a search for pulsations in LS 5039 in the 0.005–175 Hz frequency range using Chandra X-ray Observatory data and found none. However, recently, an intriguing claim has been made by Yoneda et al. (2020) regarding the compact object in LS 5039. They reported the discovery of 9 s pulsations in 10-30 keV based on the analysis of NuSTAR and Suzaku HXD data. The 9-s period is within the range of spin periods of magnetars (see Kaspi & Beloborodov 2017 for a review) and was interpreted as such by Yoneda et al. (2020). Volkov et al. (2021) (hereafter V+21) independently analyzed the same NuSTAR and Suzaku data confirming the excess Fourier power near 9 s, however, they argued that the significance of this excess is not as high as claimed by Yoneda et al. (2020). Since the discovery of a magnetar in HMGB would be an extraordinary finding, shedding light onto the mystery of magnetar progenitors and their evolution, we obtained another NuSTAR observation of LS 5039 to confirm or refute the tentative magnetar-like periodicity. Here we report the results of this observation together with the results of NICER observation which was carried out at the same time. In Section 2 we describe the NuSTAR observation and data reduction. In Section 3 we describe our analysis and results. We conclude in Section 4 with a summary of our findings.
2 Observations and Data Reduction
The Nuclear Spectroscopic Array (NuSTAR; Harrison et al. 2013) observed LS 5039 for ks starting on MDJD=59678.94871528 (2022 09 April; ObsID 30701024002). This observation spanned about 1.07 orbits of LS 5039, which has an orbital period of days. The data were processed and reduced using HEASOFT ver. 6.29c and the NuSTAR data analysis software package (NuSTARDAS) version 2.1.1. Prior to performing any analysis, the photon arrival times were corrected to the solar system barycenter using nuproducts111see https://heasarc.gsfc.nasa.gov/lheasoft/ftools/caldb/help/nuproducts.html and the NuSTAR clock correction file, which improves NuSTARs clock accuracy to about 65 s (Bachetti et al., 2021)222nuCclock20100101v140.fits; see https://nustarsoc.caltech.edu/NuSTAR_Public/NuSTAROperationSite/clockfile.php. We further cleaned the data using the flags saacalc=2 saamode=optimized tentacle=yes, which removes time intervals containing enhanced background emission due to the spacecraft’s passage through the SAA. After reducing the data about 179 ks of scientific exposure remained. For spectral and timing analysis the source events were extracted from an circle centered on the source. To produce the background-subtracted spectrum and lightcurve we selected the background events from a circle placed in a source-free region on the same detector chip.
The details of the 2016 September 1-5 NuSTAR observation and data reduction are given in V+21. The processing was very similar to the one described above.
3 Data Analysis and Results
Below we describe the orbital variability, 9-s periodic candidate, and orbital phase-resolved spectral analysis of NuSTAR data.
| Phases | NH | F | |
|---|---|---|---|
| 1022 cm-2 | 10-11 c.g.s. | ||
| 0.0-0.1 | 1.1(1) | 1.63(4) | 0.95(5) |
| 0.1-0.2 | 1.21(7) | 1.67(3) | 1.08(4) |
| 0.2-0.3 | 1.24(7) | 1.63(3) | 1.97(7) |
| 0.3-0.4 | 1.26(6) | 1.59(2) | 2.86(7) |
| 0.4-0.5 | 1.14(5) | 1.55(2) | 3.23(8) |
| 0.5-0.6 | 1.3(1) | 1.56(2) | 3.76(8) |
| 0.6-0.7 | 1.24(6) | 1.56(2) | 3.74(8) |
| 0.7-0.8 | 1.18(7) | 1.58(2) | 3.19(9) |
| 0.8-0.9 | 1.17(9) | 1.58(3) | 2.09(7) |
| 0.9-1.0 | 1.07(7) | 1.58(3) | 1.51(6) |
3.1 The 9-s period candidate
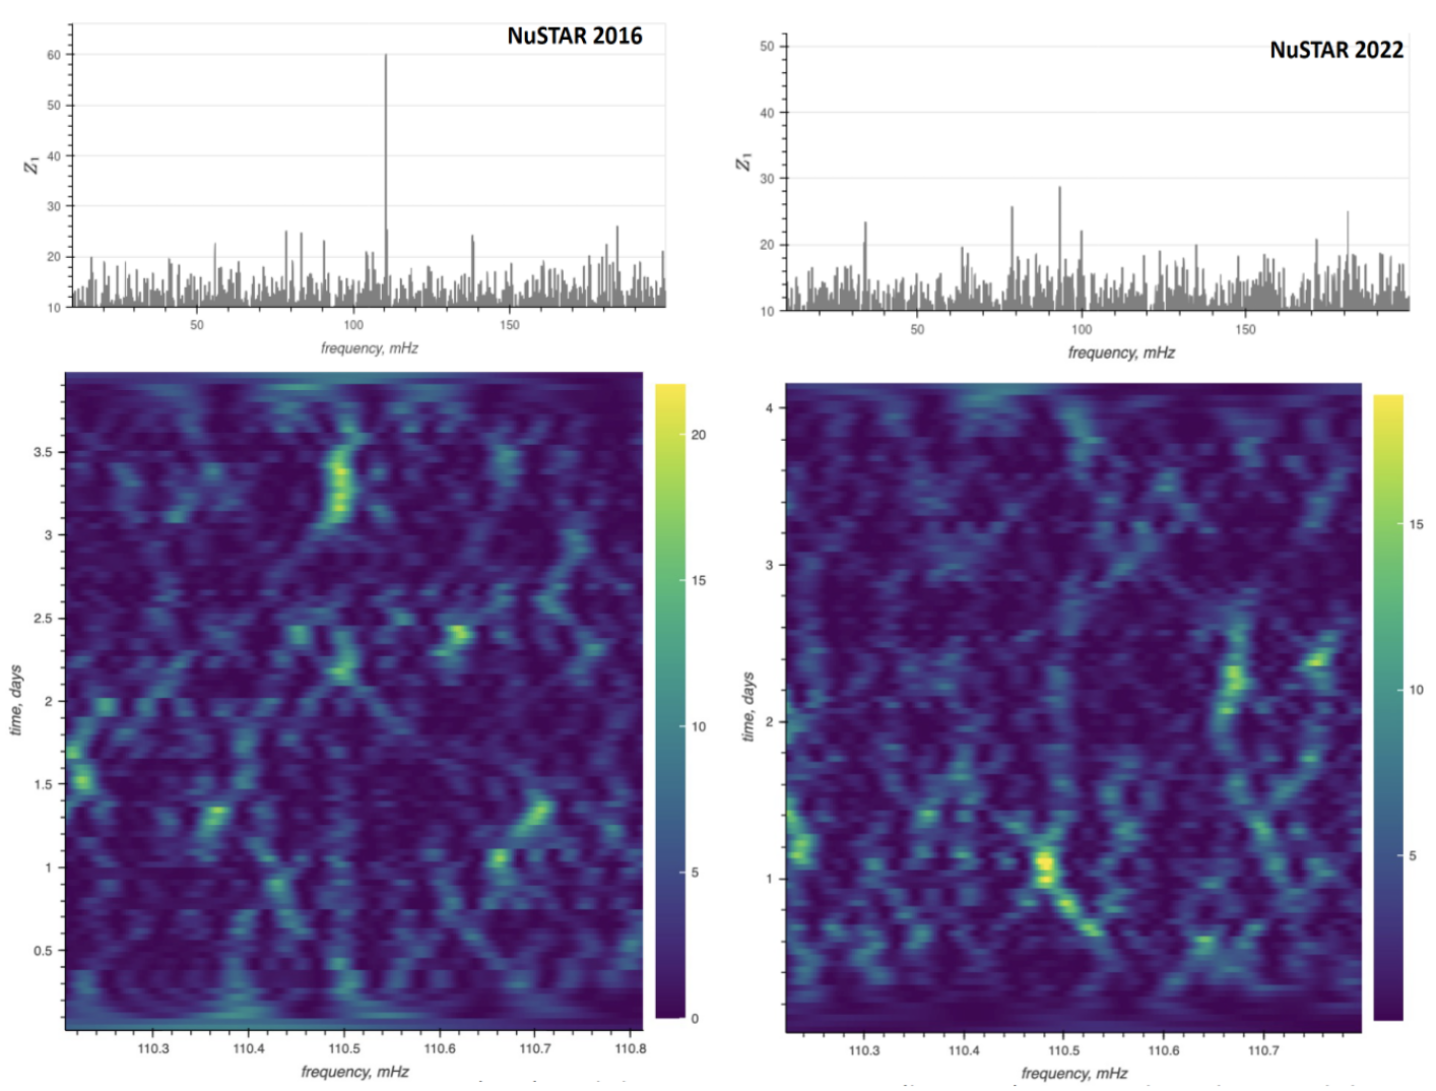
We search for the previously reported s periodic signal candidate using the same approach as the one described in detail in V+21. The top panels of Figure 1 show the distribution of the total (from the entire observation) Rayleigh ( statistic; Buccheri et al. 1983) in the vicinity of the previously reported candidate signal, which stands out in the left top panel. However, it is not present in the data from the 2022 observation shown in the right top panel. The candidate signal was also seen in the dynamic power spectrum333We note that the width of the frequency interval shown in the bottom panels is large enough to capture the drifting signal with a constant s s-1 (corresponding to the drift of mHz) which is the highest known value among known magnetars (see e.g., Figure 1 in Caleb et al. 2022). (vertical stripe of enhanced brightness) from 2016 observation (bottom left panel) but is not seen in the data from 2022 (bottom right panel). For both data sets the Römer delay correction was applied to the photon arrival times using the binary ephemeris found by V+21 (see Table 1 of V+21). Therefore, we conclude that the candidate signal reported from the 2016 data was due to a noise fluctuation. Given the large uncertainties of the ephemeris (see V+21 for discussion), the search for a signal with a strongly drifting (at an unknown rate) frequency is very expensive computationally and unlikely to result in highly significant detection (V+21 attempted such a search in 2016 observation with a negative result). For this reason, we do not carry out it here.
3.2 Orbital variability
Figure 2 shows the comparison of lightcurves from two binary cycles corresponding to the 2016 and 2022 observations. Photon arrival times were processed with nuproducts which uses the nulccorr task to apply the “livetime” correction and creates the binned lightcurves (we selected the binsize of 5.6 ks which results in 60 bins for a single observation lightcurve). We then calculated binary phases corresponding to each lightcurve bin using the 3.90608-day orbital period with a reference (zero phase) epoch of MJD 52825.48 (Aragona et al., 2009).
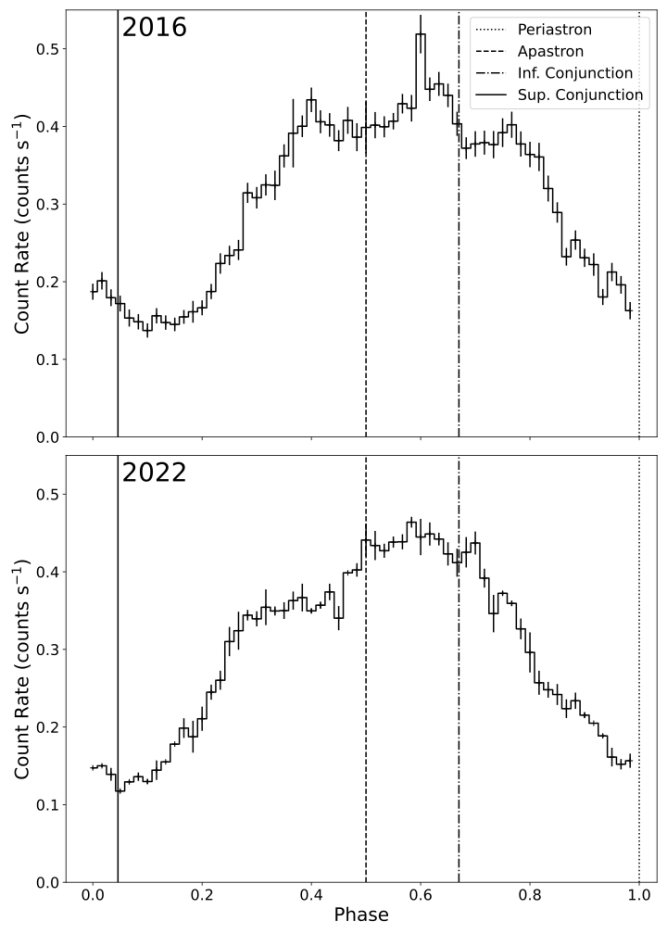
Although the overall shape appears to be preserved, there are some changes at the upper part of the lightcurve. In 2016 observation the top was flat with some short and spiky episodes of emission while in 2022 it appears to have evolved into a more asymmetric (“shoulder-head”) shape and became smoother. The observed changes are reminiscent of those shown in Figure 7 of Yoneda et al. (2023) comparing the 2007 Suzaku XIS and 2016 NuSTAR lightcurves in 3-10 keV. We, however, note that the latter comparison involved detectors with different dependencies of their effective areas on energy and, hence, the difference may partly be due to the phase-varying spectrum (see Figure 3). Also, the lightcurve minimum appears somewhat narrower in the 2022 observation. According to Aragona et al. (2009); Casares et al. (2011) the uncertainty of LS 5039 orbital period measurement is days (at 1 level) which translates into a maximum shift of in the binary phase over the 5.6-yr period between the two NuSTAR observations (i.e. 2-3 bins for the lightcurves shown in Figure 2).
3.3 Spectrum
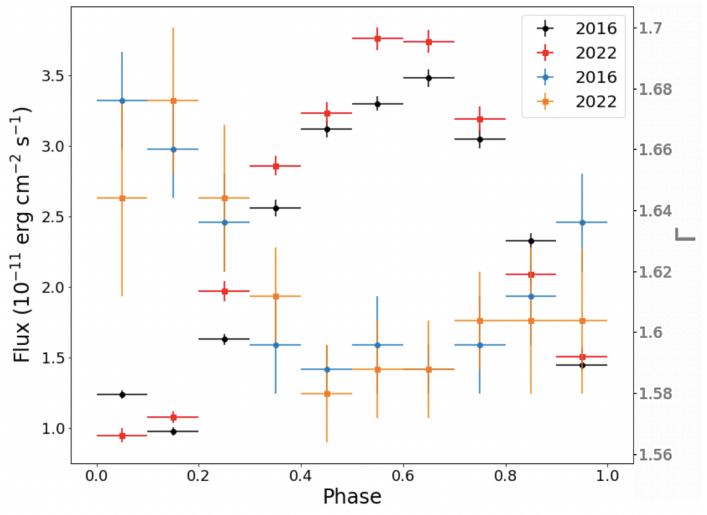
Following V+21 we divided the orbital period into 10 bins and fitted jointly 2022 NuSTAR (3-70 keV) and Suzaku XIS (0.7–10 keV) data. The Suzaku XIS data, obtained in 2007, are the same as those used for the joint fitting in V+21 (see V+21 for more detailed description). The NuSTAR spectral extraction was performed the same way as in V+21 for the 2016 data. The results of the fit with absorbed444We used tbabs Galactic absorption model with wilms abundances (Wilms et al., 2000) and performed the fits in XSPEC v.12.12.0 (Arnaud, 1996). power-law (PL) model are shown in Table 1 and Figure 3. The PL fit quality was good for all phase bins. The new data confirm the previously found anti-correlation between the flux and photon index and show that this picture remains stable on the timescale of years. Our results are also in general agreement with the earlier published analysis of Bosch-Ramon et al. (2005); Kishishita et al. (2009); Takahashi et al. (2009) who used data from ASCA, BeppoSAX, RXTE, XMM-Newton, CXO, and Suzaku.
We also used phase-integrated spectra from both NuSTAR observations to look for any evidence of spectral cutoff but, similar to V+21, did not find one. Since the variations in the photon index with the phase are rather small, the PL model fits well the phase-integrated spectrum ( for 1939 d.o.f.) and the fit shows no systematic residuals at any energy range including the high-energy end of the spectrum.
4 Summary
We analyzed the second NuSTAR observation of the gamma-ray binary LS 5039 mirroring our analysis of the first NuSTAR observation (presented in V+21). We do not confirm the candidate 9-s period discussed in Yoneda et al. (2020) and V+21. Although similar, the orbital lightcurve shows some differences from the previous one which can be explained by the varying properties of the stellar wind. We re-affirm the previously reported anti-correlation between the flux and PL slope with the latter varying between 1.59 and 1.68. No evidence of spectral cutoff is seen at the higher-energy end of the NuSTAR band.
Acknowledgments: Support for this work was provided by the National Aeronautics and Space Administration through the NuSTAR award 80NSSC22K0013. J. H. acknowledges support from NASA under award number 80GSFC21M0002.
References
- Aragona et al. (2009) Aragona, C., McSwain, M. V., Grundstrom, E. D., et al. 2009, ApJ, 698, 514. doi:10.1088/0004-637X/698/1/514
- Arnaud (1996) Arnaud, K. A. 1996, Astronomical Data Analysis Software and Systems V, 101, 17
- Bachetti et al. (2021) Bachetti, M., Markwardt, C. B., Grefenstette, B. W., et al. 2021, ApJ, 908, 184. doi:10.3847/1538-4357/abd1d6
- Buccheri et al. (1983) Buccheri, R., Bennett, K., Bignami, G. F., et al. 1983, A&A, 128, 245
- Caleb et al. (2022) Caleb, M., Heywood, I., Rajwade, K., et al. 2022, Nature Astronomy, 6, 828. doi:10.1038/s41550-022-01688-x
- Casares et al. (2005) Casares, J., Ribó, M., Ribas, I., et al. 2005, MNRAS, 364, 899. doi:10.1111/j.1365-2966.2005.09617.x
- Casares et al. (2011) Casares, J., Corral-Santana, J. M., Herrero, A., et al. 2011, High-Energy Emission from Pulsars and their Systems, 21, 559. doi:10.1007/978-3-642-17251-9_46
- Dubus (2013) Dubus, G. 2013, A&A Rev., 21, 64. doi:10.1007/s00159-013-0064-5
- Dubus (2015) Dubus, G. 2015, Comptes Rendus Physique, 16, 661. doi:10.1016/j.crhy.2015.08.014
- Harrison et al. (2013) Harrison, F. A., Craig, W. W., Christensen, F. E., et al. 2013, ApJ, 770, 103. doi:10.1088/0004-637X/770/2/103
- Kaspi & Beloborodov (2017) Kaspi, V. M. & Beloborodov, A. M. 2017, ARA&A, 55, 261. doi:10.1146/annurev-astro-081915-023329
- Bosch-Ramon et al. (2005) Bosch-Ramon, V., Paredes, J. M., Ribó, M., et al. 2005, ApJ, 628, 388. doi:10.1086/429901
- Kishishita et al. (2009) Kishishita, T., Tanaka, T., Uchiyama, Y., et al. 2009, ApJ, 697, L1. doi:10.1088/0004-637X/697/1/L1
- Rea et al. (2011) Rea, N., Torres, D. F., Caliandro, G. A., et al. 2011, MNRAS, 416, 1514. doi:10.1111/j.1365-2966.2011.19148.x
- Sarty et al. (2011) Sarty, G. E., Szalai, T., Kiss, L. L., et al. 2011, MNRAS, 411, 1293. doi:10.1111/j.1365-2966.2010.17757.x
- Takahashi et al. (2009) Takahashi, T., Kishishita, T., Uchiyama, Y., et al. 2009, ApJ, 697, 592. doi:10.1088/0004-637X/697/1/592
- Torres et al. (2012) Torres, D. F., Rea, N., Esposito, P., et al. 2012, ApJ, 744, 106. doi:10.1088/0004-637X/744/2/106
- Volkov et al. (2021) Volkov, I., Kargaltsev, O., Younes, G., et al. 2021, ApJ, 915, 61. doi:10.3847/1538-4357/abfe0e, (V+21)
- Weng et al. (2022) Weng, S.-S., Qian, L., Wang, B.-J., et al. 2022, Nature Astronomy, 6, 698. doi:10.1038/s41550-022-01630-1
- Wilms et al. (2000) Wilms, J., Allen, A., & McCray, R. 2000, ApJ, 542, 914. doi:10.1086/317016
- Yoneda et al. (2020) Yoneda, H., Makishima, K., Enoto, T., et al. 2020, Phys. Rev. Lett., 125, 111103. doi:10.1103/PhysRevLett.125.111103
- Yoneda et al. (2023) Yoneda, H., Bosch-Ramon, V., Enoto, T., et al. 2023, ApJ, 948, 77. doi:10.3847/1538-4357/acc175
- Younes et al. (2017) Younes, G., Baring, M. G., Kouveliotou, C., et al. 2017, ApJ, 851, 17. doi:10.3847/1538-4357/aa96fd