[]✉ Corresponding author:eoezkan@mit.edu \leadauthorOzkan
Multi-domain improves out-of-distribution and data-limited scenarios for medical image analysis
Abstract
Current machine learning methods for medical image analysis primarily focus on developing models tailored for their specific tasks, utilizing data within their target domain. These specialized models tend to be data-hungry and often exhibit limitations in generalizing to out-of-distribution samples. Recently, foundation models have been proposed, which combine data from various domains and demonstrate excellent generalization capabilities. Building upon this, this work introduces the incorporation of diverse medical image domains, including different imaging modalities like X-ray, MRI, CT, and ultrasound images, as well as various viewpoints such as axial, coronal, and sagittal views. We refer to this approach as multi-domain model and compare its performance to that of specialized models. Our findings underscore the superior generalization capabilities of multi-domain models, particularly in scenarios characterized by limited data availability and out-of-distribution, frequently encountered in healthcare applications. The integration of diverse data allows multi-domain models to utilize shared information across domains, enhancing the overall outcomes significantly. To illustrate, for organ recognition, multi-domain model can enhance accuracy by up to 10% compared to conventional specialized models.
1 Introduction
In medical image analysis, current machine learning approaches propose various models to address wide range of problems [1, 2, 3], which have been tailored for their designated applications and typically utilize data from a single target domain. However, this specialization approach leads to data-intensive specialized models and show limited generalization capabilities.
A spectrum of imaging modalities, including X-rays, magnetic resonance imaging (MRI), computed tomography (CT), ultrasound (US), and positron emission tomography (PET) provides unique perspectives into different aspects of anatomy and pathology. X-ray images excel in revealing bone structures and detecting fractures, while MRI scans provide detailed images of soft tissues like the brain, muscles, and organs. CT scans offer cross-sectional views, helping to identify internal injuries and complex conditions. US images are non-invasive and excel in real-time imaging, often used for monitoring pregnancies and examining internal organs, whereas PET provides metabolic information, aiding in cancer detection and localization. Thus, insights gathered from one imaging modality might benefit another, enhancing overall prediction capabilities. Furthermore, in medical decision-making, clinicians often consider diverse viewpoints, examining a single medical case from multiple angles to reveal hidden critical information. Certain anomalies may be more apparent from one angle than another, ensuring a comprehensive understanding of the patient’s condition and facilitating accurate diagnoses and effective treatment strategies.
Existing works in medical image analysis falls short of fully leveraging the diverse image data available. Such limitations constrain the potential that can be derived from cross-learning across diverse data domains, such as imaging modalities and/or viewpoints. Integrating information from different image domains can provide a comprehensive understanding of a medical condition, enabling more holistic diagnoses and tailored treatment plans. Building upon the advancements in foundation models [4, 5, 6] and the significant growth of medical image datasets, our work seeks to address a pivotal question: Can the integration of diverse data domains improve the generalization capabilities of models for medical image analysis? If this proves to be the case, the combination of expanding datasets and the deep learning era may serve as a catalyst for the development and progression of models, thereby facilitating breakthroughs in medical image analysis [7].
In this work, we introduce the incorporation of diverse medical image data domains and evaluate the performance of specialized models in comparison to multi-domain models. Our evaluation spans out-of-distribution (OOD) and data-limited scenarios, common in healthcare applications. This analysis represents the first instance where multi-domain data is assessed for a single task, different from multi-task setups. It provides new insights into the respective strengths and drawbacks of these models, paving the path toward exploiting the potential of diverse data domains in medical image analysis applications.
1.1 Related work
Recent years have witnessed a rise of foundation models, particularly in fields like natural language processing and computer vision. Large language models for general applications [4, 5, 8, 6, 9, 10] and in healthcare [11, 7, 12, 13, 14, 15, 16, 17, 18, 19, 20] and large vision models for general applications [21, 22, 23, 24, 25, 26, 27, 28, 29, 30, 31, 32] and in healthcare [33, 34, 35, 36, 37, 38, 39, 40, 41, 42, 43, 44, 45, 46, 47, 48, 49, 50] have emerged driving significant advancements across diverse applications [51]. These models have not only expanded in terms of their number of parameters and data handling capacities but have also consistently demonstrated remarkable performance once pre-trained. Furthermore, these models combine data from various domains and demonstrate exceptional generalization capabilities beyond their primary training tasks.
When aiming to enhance generalization capabilities, an alternative approach to consider is multi-task learning [52]. In multi-task learning, the goal is to improve the performance of a model while solving multiple related tasks simultaneously. The idea is that learning from multiple tasks can help the model capture shared patterns and representations, leading to better performance on each individual task. In contrast, in our work we focus on learning from different domains or datasets without necessarily involving multiple tasks.
Several studies have explored the role of multi-modality approaches in healthcare contexts [39, 53, 42, 41, 54]. However, these methods predominantly focus on integrating text with a single imaging modality, rather than incorporating data from various image domains. Closest work to ours is BenchMD [55], where they combined 19 publicly available datasets for 7 medical modalities, including 1D sensor data, 2D images, and 3D volumetric scans. In the case of 2D images, BenchMD combined data from diverse sources, including chest X-rays (CXR), mammograms, dermoscopic, and fundus images. They utilized widely-cited, large dataset as the primary source for each imaging modality, conducting evaluations of distribution shifts on a separate test set. Nevertheless, their analysis did not encompass an assessment of the models’ generalization capability across various domains.
In Table 1, we present a summary of our work, comparing it to related work based on their input, output, and the data needed for training and testing.
| Input [# Images] | Output [# Tasks] | Dataset [# Domains] | Input instance [# Domains] | |
| Specialized | Single | Single | Single | Single |
| Multi-task | Single | Multiple | Single | Single |
| Multi-modal | Multiple | Single | Multiple | Multiple |
| Multi-domain | Single | Single | Multiple | Single |
2 Methods
The level of generalization that multi-domain models can achieve in scenarios involving out-of-distribution and limited data remains uncertain based on prior research involving large scale models applied to medical image analysis [35, 12, 33, 34, 55]. To illustrate this idea, consider the following research question: Can a neural network trained on instances of a medical condition as observed through CT, PET, and US images, provide accurate predictions when presented with MRI images, even in cases where this specific medical condition has been encountered only infrequently in the training set from MRI images?
In order to delve into the specifics, we aim to explore the potential for shared information across different data domains, such as imaging modalities or viewpoints. To achieve this, we will first introduce the datasets employed in this study and then outline the methods used to generate data diversity within these datasets, thereby allowing us to analyse the impact of diverse data domains on generalizability.
2.1 Datasets
Most existing datasets from various data domains are tailored to their specialized applications and these datasets lack commonalities that would allow for evaluating potential knowledge transfer. Thus, we present our results on the following datasets, which do not suffer from these challenges.
PolyMNIST
We start with the multi-modal benchmark PolyMNIST[56] to understand behaviours for different ablations. The PolyMNIST dataset consists of sets of ten MNIST digits where each set includes five images with the same digit label but different backgrounds and different styles of hand writing. For our experiments, each digit represents the shared information across modalities and different background images represent modality-specific information. In total we used for each digit and modality combination 1000 samples of training and validation examples (50000 images in total for ten digits and five modalities) and 891 samples of test examples (44550 images in total) from the original train and test split of the dataset. Our objective is to perform multi-class classification of ten digits across five different modalities.
MedMNIST
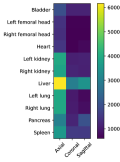
We use MedMNIST v2 [57] benchmark to explore generalization across viewpoints. MedMNIST v2 is a large-scale MNIST-like dataset collection of standardized biomedical images, including datasets of 2D and 3D data. Among these, we use Organ{A,C,S}MNIST subset, which are based on CT images from axial, coronal and sagittal views. The visible organs within this data include bladder, left femoral head, right femoral head, heart, left kidney, right kidney, liver, left lung, right lung, pancreas and spleen. We used the original data split, with 61521 training (34581 for axial, 13000 for coronal and 13940 for sagittal view), 11335 validation (6491 for axial, 2392 for coronal and 2452 for sagittal view) and 34875 test (17778 for axial, 8268 for coronal and 8829 for sagittal view) samples. The goal is to perform multi-class classification of 11 body organs from axial, coronal and sagittal views.
ImageCLEFmedical
We use ImageCLEFmedical Caption challenge [58] dataset, a subset of the extended Radiology Objects in COntext (ROCO) dataset [59]. This dataset is derived from biomedical articles within the PMC OpenAccess subset, a comprehensive collection of figures sourced from open access biomedical journal articles (PubMed Central), along with radiology images extracted from original medical cases. In both training and validation data, each image is paired with UMLS 2020 AB concepts [60], extracted from the accompanying image captions. Our experimentation revolves around the concept detection data within this dataset.
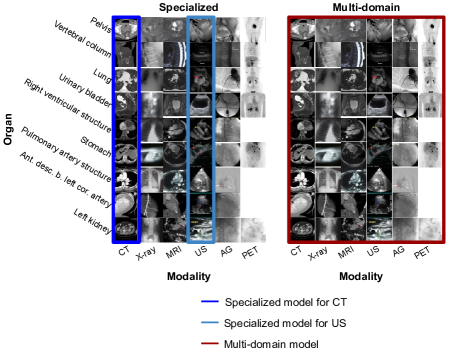
There are more than 8000 concepts in the dataset, each with varying frequencies of occurrence. To enhance control and comprehension of generalization, we opted to work with a subset of images and concepts. Our analysis initially focused on the 100 most frequently employed CUIs. Filtering was then applied to images based on the semantic types of their associated concepts, specifically targeting concepts related to “Diagnostic procedure" for imaging modality identification, and “Body Part, Organ, or Organ Component" for presence of specific organs in the images. From the filtered list of CUIs, we selected a subset of organs for further analysis. This subset comprised nine distinct body organs, namely pelvis, vertebral column, lung, urinary bladder, right ventricular structure, stomach, pulmonary artery structure, anterior descending branch of the left coronary artery, and left kidney. As for imaging modalities, we considered CT, X-ray, MRI, US, angiogram (AG), and PET images. It’s important to note that not all body parts are captured through all imaging modalities.
Since the test images in the original dataset do not come with their concepts, we employed the train split from the original challenge dataset for training and validation, while the validation split was repurposed as the test set. This resulted in a dataset of 6324 images for training and validation, with an additional 688 images reserved for testing. Our task entails multi-class classification of the nine body organs across six distinct imaging modalities.
2.2 Dataset specific tasks and domains
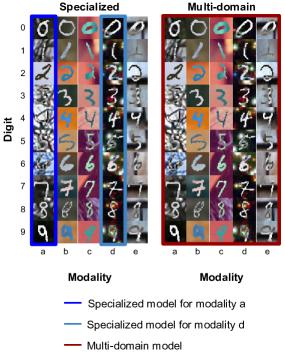
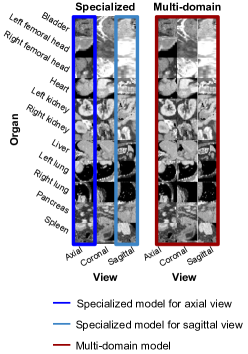
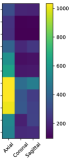
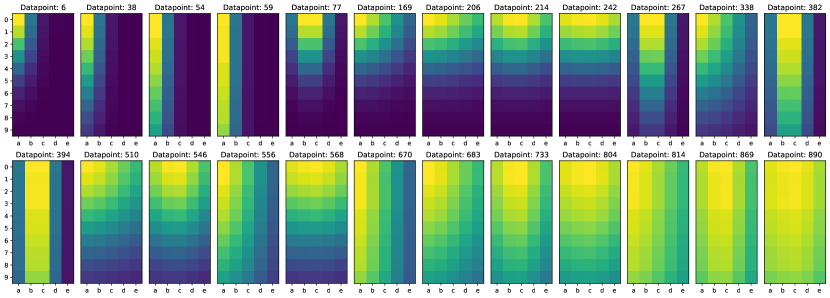
In our experiments, we focus on classifying different digits for PolyMNIST or organs for the medical datasets across different data domains. The datasets can be visualized as a square task and data domain combinations grid. These combinations consist of digit/modality combination for PolyMNIST, organ/view combination for MedMNIST and organ/modality combination for ImageCLEFmedical. For a summary of the tasks and data domains within these datasets, please refer to Figure 1. Each row corresponds to a distinct task, whether it be a digit or an organ-related task, while each column signifies a specific data domain, such as a view or a modality. Each cell within the grid encompasses all the images associated with a particular combination of task and data domain.
2.3 Generating train and validation splits for data diversity
The objective of this work is to conduct a comparative analysis and gain insights into specialized and multi-domain models under conditions of data-limited and OOD scenarios. To accomplish this, we create different data subsets characterized by differing aspects and levels of data diversity. We base the generation of these partitions on two key factors: data availability and the level of OOD, which we will explain in more detail below. During the testing phase, we refrain from any additional data processing and exclusively employ the predefined test splits as provided within each dataset.
Amount of data
For PolyMNIST, we start by constructing train and validation splits with different data distributions. For each of the digit and modality combination in the set, we have access to 1000 samples. To introduce diversity to data distribution, we implemented diverse probability distributions for digit and modality combinations, as follows. We use standard distribution for digit and modality distributions with the following parameters: , , and . We sampled and normalized these distributions, ensuring that all values are within the range of 0 to 1. We then multiply the digit and modality distributions and rescale the product by a factor of 1000, hereby guaranteeing that each distinct modality and digit combination has a sample count between 0 and 1000. In Figure 2(a), we present a graphical representation of this process, employing the specific parameter values of , , , and . The combination of different mean and standard deviation parameters for digit and modality distribution yields a total of 24 distinct distributions to use, as shown in Figure A.1.
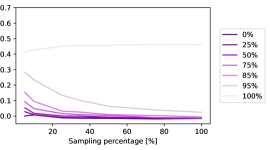
The data distributions for MedMNIST are shown in Figure 2(c), with (i) representing the training, (ii) validation, and (iii) test set. Similarly, for ImageCLEFmedical, the data distributions are visualized in Figure 2(d), where (i) illustrates the combined train and validation set, and (ii) the test distribution. It is important to note that the datasets for both MedMNIST and ImageCLEFmedical inherently exhibit diversity, since they have varying sample counts for each organ across different views in MedMNIST and across different modalities in ImageCLEFmedical. Thus, we employ a range of sampling percentages to create distinct training and validation subsets for these datasets. We use their provided distributions and sample training and validation subsets accordingly. The sampling percentages include %, where 100% indicates the utilization of the entire available training and validation data, while 5% implies that only 5% of the data is incorporated into subsets. As a result, this sampling approach ensures consistent ratios of training samples across different combinations, albeit with varying sample sizes.
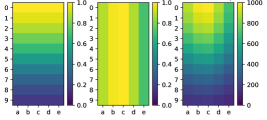
(i) Digit distribution (ii) Modality distribution (iii) Number of samples (i) Amount of data (ii) OOD
(a) Data diversity for PolyMNIST (b) Evaluation scenarios for PolyMNIST
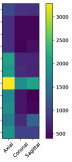
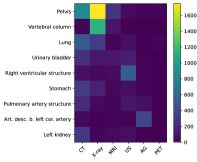
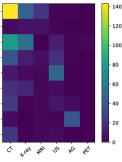
(i) Train (ii) Validation (iii) Test (i) Train + Validation (ii) Test
(c) Data distribution for MedMNIST (d) Data distribution for ImageCLEFmedical
Out-of-distribution (OOD) level
To evaluate the OOD performance of both specialized and multi-domain models across various datasets, we introduce OOD levels, as follows: for each task and data domain combination, we systematically exclude a subset of instances from both the training and validation sets. Subsequently, we repeat the training and validation procedures for each of the combination. We quantify OOD levels using percentages, specifically , where 100% signifies that the specific combination is entirely absent from both the training and validation sets, whereas, 0% indicates that the training and validation datasets contain the complete set of samples for the given combination. As a result, for each experiment, the specific combination becomes either never or less frequently observed. For a fair representation of each combination, we ensure that every combination occurs exactly once, that is, each row and column features only a single cell representing a specific combination.
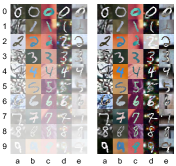
We present an illustrative example of diverse data strategies for PolyMNIST in Figure 2(b). In this visualization, opacity is used to represent the quantity of data, with less opacity indicating a larger amount of data. Specifically, (i) demonstrates an example of utilized data for evaluating data distribution and employs distribution parameters , , , and to define the data distribution, as in Figure 2(a), whereas and (ii) showcases the OOD scenarios with a 75% OOD level for digit 2 and modality d.
2.4 Training and testing procedure
In our experimental setup, we employ identical datasets for both specialized and multi-domain models. The key distinction lies in the manner with which (part of) data the models are trained. To elaborate, for instance, in the case of MedMNIST, we train and evaluate three distinct specialized models, each dedicated to classifying organs based on axial, coronal, or sagittal views using the respective data from the view. In contrast, the multi-domain model leverages the entirety of the available data for the same organ classification task.
It’s important to clarify that the choice between a multi-domain or specialized setup impacts the training and validation phases, determining which data partitions the models are exposed to. When it comes to the test phase, we assess each test image to predict its designated task. Therefore, the multi-domain doesn’t require the simultaneous input of all modalities during testing, e. g. in contrast to multi-modal learning.
3 Experiments and Results
3.1 Experimental Setup
3.1.1 Model Architecture and Hyperparameters
In our experimental setup, we utilize the pre-trained ResNet-18 architecture [61], employing the cross-entropy loss and the AdamW optimizer [62]. Data for PolyMNIST and ImageCLEFmedical is split into training and validation sets with a ratio of 0.75. For MedMNIST, we use the official train/val/test splits. For MedMNIST and ImageCLEFmedical datasets, we evaluate and report the average of five random seeds. We train the models for 25 epochs and decay their learning rate by 0.1 every 5 epochs.
For PolyMNIST, we set the learning rate to 0.005, use a batch size of 512 and employ a optimizer’s weight decay of 0.001. For MedMNIST, the learning rate is set to 0.001, batch size to 128, weight decay to 0.001. For ImageCLEFmedical, we use a learning rate of 0.0005, utilize a batch size of 128, set the weight decay to 0.00001. Note that, we did hyperparameter tuning for multi-domain models, and subsequently replicated this for specialized models, with the hyperparameters largely in alignment and did not impact the convergence of model training.
The images in PolyMNIST and MedMNIST have the resolution of . We pre-process these images by resizing them to . As for ImageCLEFmedical, we center crop the images to ensure equal width and length, further augmenting them with a 0.1x translation and resizing them to dimensions of .
3.1.2 Evaluation
We employ balanced accuracy as our primary evaluation metric, encompassing two distinct evaluation scenarios: out-of-distribution (OOD) accuracy and in-distribution (ID) accuracy. This involves evaluating the accuracy of each excluded combination and subsequently computing the average accuracy across all such combinations. For PolyMNIST, this approach results in a total of 50 evaluations (10 digits and 5 modalities), while for MedMNIST, we conduct 33 evaluations (11 organs and 3 views), and for ImageCLEFmedical, there are 54 evaluations (9 organs and 6 modalities) in total. We refer to the resulting metric as OOD average balanced accuracy.
In addition, we calculate the average balanced accuracy of all combinations except for the excluded ones and once again calculate the average across the different combinations set. We designate this outcome as ID average balanced accuracy. All evaluation metrics are reported in test set.
3.2 Results
PolyMNIST
We begin our analysis by assessing data diversity across various OOD levels. For this, we not only compare specialized and multi-domain models, but but also introduce a modified version of specialized models, which we refer to as specialized upsampled models: we augment the data available to specialized models, ensuring that each digit is classified with an equal number of images for both the specialized upsampled and multi-domain models. The original PolyMNIST dataset provides a sufficient number of samples for this purpose. Thus, both specialized and multi-domain models have access to a maximum of 1000 images for each digit/modality combination, while the upsampled counterparts of the specialized models benefit from an expanded dataset, potentially containing up to 5000 images for each such combination. Furthermore, we would like to mention that the scenario involving specialized upsampled models is not a realistic representation but is exclusively examined to assess the advantages and limitations associated with an augmented dataset.
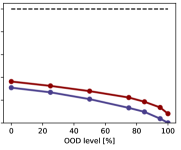
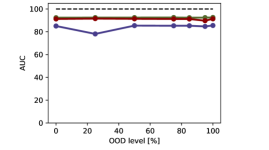
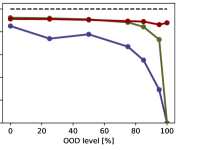
Figure 3 compares the performance of specialized, specialized upsampled and multi-domain models. We compute the area under the curve (AUC) for both the OOD and ID average balanced accuracy curves across various data distributions. Each data point represents the AUC for different OOD levels. Specifically, (a) provides a comparison of ID average balanced accuracy across different data distributions and OOD levels, while (b) shows OOD average balanced accuracy among specialized (blue), specialized upsampled (green), and multi-domain (red) models. Note that, in this experiment, the highest achievable AUC for a model is marked with a dashed black line. The ideal outcome is represented by a flat line at maximum, indicating perfect performance unaffected by OOD levels.

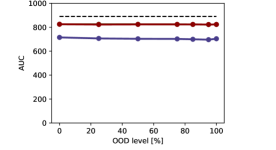
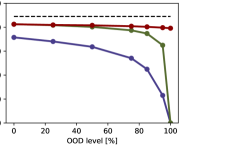
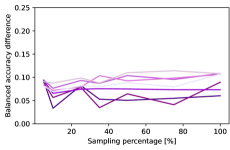
Figure 4 provides an in-depth visualization between the models across diverse data distributions. We depict the balanced accuracy difference between specialized and multi-domain models (a,b) and specialized upsampled and multi-domain models (c,d). Each line represents OOD levels showing the differences between models during data distribution evaluations.
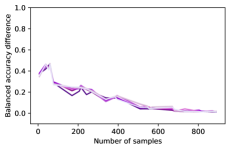
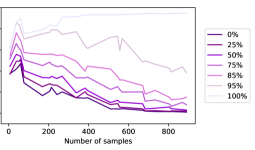
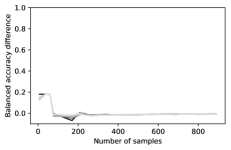
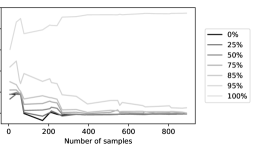
For a more detailed overview, please refer to Figure 5, which provides an overview of the average balanced accuracy scores for specialized (a,b), specialized upsampled (c,d) and multi-domain (e,f) models. The scores are presented across various distributions on the x-axis, and OOD levels, indicated by different color codes for both ID (a,c,e) and OOD (b,d,f) evaluation. To facilitate a meaningful comparison across different distributions, we have organized the 24 distributions in ascending order based on their median values, as shown in Figure A.1. Furthermore, we have calculated the AUC for each line representing the OOD levels in these figures. The results are compared in Figure 3. Additionally, we have computed the balanced accuracy difference for each OOD level in these figures, and the outcomes are presented and compared in Figure 4.
When assessing the ID accuracy, our results indicate that varying levels of OOD scenarios do not significantly affect ID accuracy. The performance of the specialized models are still lower than the specialized upsampled and multi-domain models, showing that ID accuracy can be compensated with higher number of samples. Upon analyzing OOD performance, a notable and consistent pattern emerges: as the OOD level increases, OOD accuracy declines noticeably for specialized and specialized upsampled models. This stands in stark contrast to multi-domain models, which exhibit considerably greater resilience to this phenomenon. The difference becomes particularly pronounced for OOD levels 50%. This can be attributed to the fact that multi-domain models benefit from shared information across different modalities for the classification task, thereby aiding OOD recovery. In contrast, specialized models struggle to recover unseen (at OOD level 100%) or scarce encountered (at OOD level 100%) digit/modality combinations, even when provided with larger sample sizes with specialized upsampled models. Furthermore, across all models, we observe a consistent trend from Figures 4 and 5: both ID and OOD performance declines as the number of samples for each digit/modality combination decreases.
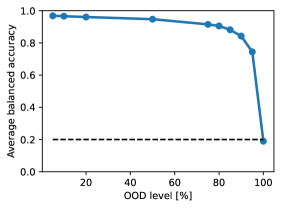
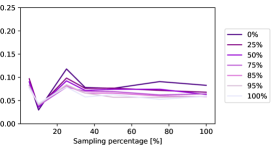
For testing potential knowledge transfer, we conducted a control experiment, where our goal was to evaluate a scenario where information sharing is constrained for multi-domain model. For this, we split the data from various modalities into two distinct domains, grouping classes as follows: 0 and 5 together as one class, 1 and 6 as another, and so on, with classes 4 and 9 comprising the final group. Thus, we split digits 0 through 4 into one domain and digits 5 through 9 into another. Consequently, our multi-domain model exploits both domains, with each class encompassing two dissimilar digits. We then run OOD level experiments for each digit and repeat this experiment for each of the original modalities a to e. In Figure 6, we present the results of the OOD evaluation for different OOD levels, showcasing the average balanced accuracy achieved by aggregating the experiments. The lower the OOD level, the higher is the accuracy. However, when the OOD level reaches 100%, the average accuracy declines to a level expected by chance. This observation shows the fact that at 100% OOD, there is no opportunity for knowledge transfer, emphasizing the absence of information sharing.
MedMNIST
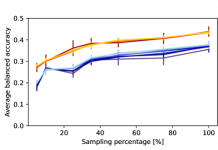
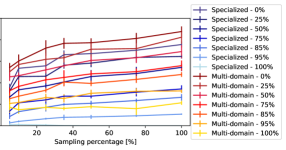
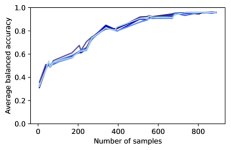
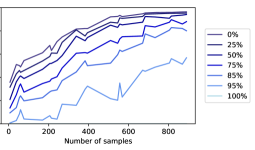
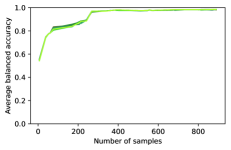
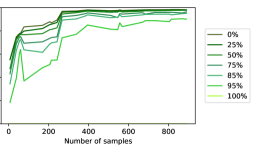
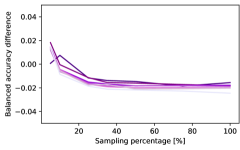
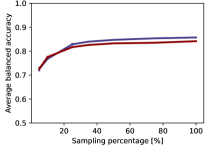
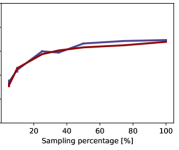
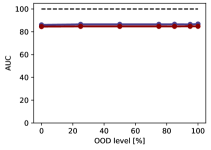
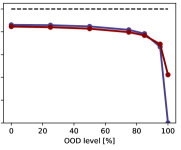
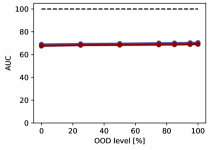
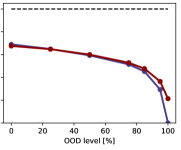
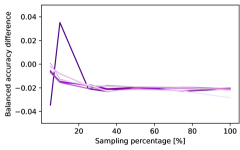
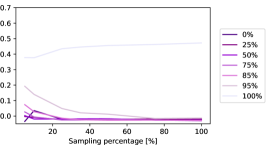
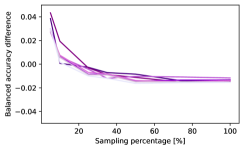
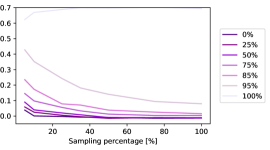
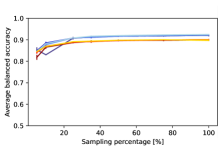
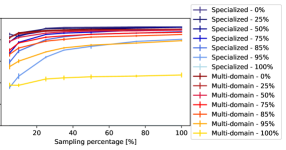
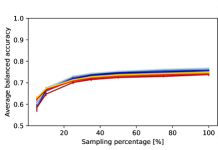
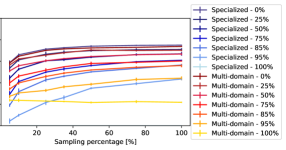
In Figure 7, we present a comparison of AUC values achieved by specialized and multi-domain models across various sampling percentages for both ID (a) and OOD (b) average balanced accuracy curves. The dashed black line, marked with a value of 100, represents the highest attainable AUC, which corresponds to a 100% sampling rate and perfect accuracy. Figure 8 provides a more comprehensive analysis of the specialized and multi-domain models with different amount of data for both ID evaluation (a) and OOD evaluation (b). Each line corresponds to different OOD levels and illustrates the differences between the models across different sampling percentages, as indicated on the x-axis. For a detailed overview, please refer to Figure B.1, which presents an overview of the average balanced accuracy scores for specialized and multi-domain models. Furthermore, in Figure B.2, Figure B.3 and B.4, we report the AUC, accuracy differences, and model accuracies at view level.

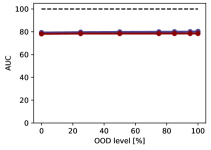
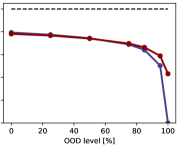
When assessing the ID accuracy, such as in the case of PolyMNIST, our findings suggest that varying OOD levels do not significantly impact ID accuracy and both models exhibit similar levels of accuracy. For the OOD performance, as the OOD level increases, OOD accuracy experiences a noticeable decline for both models. This distinction between the models becomes particularly pronounced for OOD levels exceeding 75%. In the extreme case of a 100% OOD level, the specialized model’s accuracy drops, which makes it impossible for specialized models to predict fully unseen data. In contrast, the multi-domain model still benefits from shared information in this scenario. Furthermore, across all models, both ID and OOD performance decrease as the number of samples for each digit/modality combination decreases.
The data distribution for MedMNIST, given in Figure 2(c), shows a significant bias towards the axial view, particularly in the liver/axial organ/view combination. To investigate whether the matching ID accuracy between specialized and multi-domain models can be attributed to data distribution, we conducted a control experiment. For this, we restructured the data by resampling so that each organ/view combination contained 600 samples for training and 95 samples for the validation split, aligning with the minimum sample size observed in Figure 2(c). We repeat the experiment with using the resampled dataset and for different amount of data using sampling percentage. As an example, with a 50% sampling percentage, each organ/view combination benefits from 300 training and 48 validation samples. Figure 9 provides a comparison of these different distributions for OOD level of 0%. These show that the data distribution has a negligible impact on ID accuracy, as the resampled uniform distribution continues to demonstrate matching ID accuracy between specialized and multi-domain models.

ImageCLEFmedical
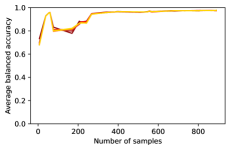
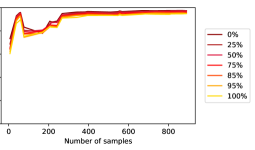
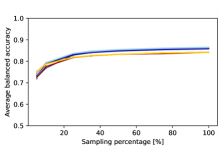
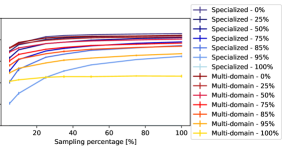
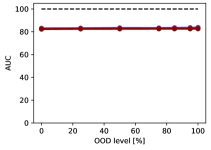
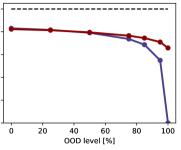
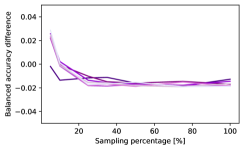
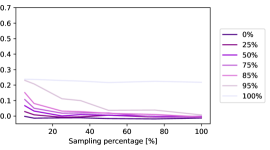
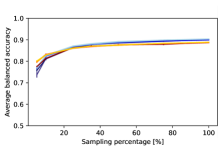
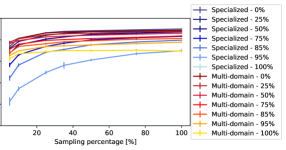
In Figure 10, we compare the models in terms of their AUC values under ID (a) and OOD (b) average balanced accuracy curves. Figure 11 presents a more in-depth comparison of the specialized and multi-domain models in terms of varying amount of data for both ID (a) and OOD (b) evaluation. For a detailed overview, please refer to Figure C.1, which provides a summary of the average balanced accuracy scores for specialized and multi-domain models.

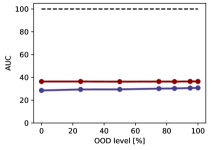
For ID accuracy, our findings are consistent with the outcomes observed in PolyMNIST and MedMNIST studies. Here, variations in OOD scenarios do not significantly impact ID accuracy. In contrast to MedMNIST, the multi-domain model demonstrates a 10% improvement in accuracy, mirroring the findings in PolyMNIST where multi-domain model outperformed specialized models. This result is particularly intriguing given that the utilized images are unprocessed and exhibit remarkable diversity. Regarding OOD performance, as the OOD level increases, both models experience a noticeable decline in OOD accuracy. Importantly, the multi-domain model maintains a consistent 10% advantage across all OOD levels, where the multi-domain model continues to benefit from shared information for both ID and OOD evaluation, even in scenarios characterized by limited data and OOD challenges.
4 Discussion and Conclusion
Motivated by the recent advancements in foundation models, which exploit diverse data sources and demonstrate exceptional generalization abilities, this work investigated specialized and multi-domain models, comparing their performance in scenarios involving OOD and data-limited scenarios. Our evaluations are reported using three datasets: the toy dataset PolyMNIST [56], as well as two medical datasets, MedMNIST [57] and ImageCLEFmedical [58]. Our findings yield following key conclusions:
-
•
Multi-domain models outperform specialized models in OOD and data-limited scenarios, capitalizing on their ability to leverage shared information across diverse domains.
-
•
Multi-domain models consistently either match or excel specialized models in terms of their ID accuracy.
-
•
Specialized models can compensate for ID accuracy with a higher number of samples. However, they face considerable challenges in recovering OOD accuracy for tasks that are entirely unseen or encountered only infrequently, even when provided with larger sample sizes.
-
•
The level of OOD scenario does not impact ID accuracy for any of the models, indicating the robustness in preserving ID accuracy across varying OOD levels.
It’s worth noting that the extent of the advantage of knowledge transfer between domains is limited upon the availability of shared information. As a future direction, understanding the underlying mechanisms behind the generalization capabilities of multi-domain models for OOD and data-limited scenarios is a crucial direction. Deeper investigations into the information sharing within these models hold the potential to yield more efficient strategies for knowledge transfer and domain adaptation. Furthermore, addressing the scalability of these models for real-world, large-scale applications remains a pressing concern for medical image analysis. Future research can concentrate on working with refining these models for efficiency, reducing computational demands, and ensuring their practicality in real-world resource-constrained environments. Additionally, the exploration of more diverse datasets and problem domains will be essential for validating and extending our findings.
In summary, our work underlines the effectiveness of multi-domain models in tackling OOD and data-limited challenges, offering promising avenues for their application in medical image analysis where such challenges are prevalent. These insights contribute to the ongoing exploration and implementation of large scale models in diverse fields and applications.
Acknowledgments
EO was supported by the SNSF grant P500PT-206746.
References
- [1] Varun Gulshan, Lily Peng, Marc Coram, Martin C. Stumpe, Derek Wu, Arunachalam Narayanaswamy, Subhashini Venugopalan, Kasumi Widner, Tom Madams, Jorge Cuadros, Ramasamy Kim, Rajiv Raman, Philip C. Nelson, Jessica L. Mega and Dale R. Webster “Development and Validation of a Deep Learning Algorithm for Detection of Diabetic Retinopathy in Retinal Fundus Photographs” In JAMA 316.22 American Medical Association (AMA), 2016, pp. 2402 DOI: 10.1001/jama.2016.17216
- [2] Jeremy Irvin, Pranav Rajpurkar, Michael Ko, Yifan Yu, Silviana Ciurea-Ilcus, Chris Chute, Henrik Marklund, Behzad Haghgoo, Robyn Ball and Katie Shpanskaya “Chexpert: A large chest radiograph dataset with uncertainty labels and expert comparison” In Proceedings of the AAAI conference on artificial intelligence 33.01, 2019, pp. 590–597
- [3] Yuan Liu et al. “A deep learning system for differential diagnosis of skin diseases” In Nature Medicine 26.6 Springer ScienceBusiness Media LLC, 2020, pp. 900–908 DOI: 10.1038/s41591-020-0842-3
- [4] OpenAI “GPT-4 Technical Report” arXiv, 2023 DOI: 10.48550/ARXIV.2303.08774
- [5] Hugo Touvron, Thibaut Lavril, Gautier Izacard, Xavier Martinet, Marie-Anne Lachaux, Timothée Lacroix, Baptiste Rozière, Naman Goyal, Eric Hambro, Faisal Azhar, Aurelien Rodriguez, Armand Joulin, Edouard Grave and Guillaume Lample “LLaMA: Open and Efficient Foundation Language Models” arXiv, 2023 DOI: 10.48550/ARXIV.2302.13971
- [6] Romal Thoppilan et al. “LaMDA: Language Models for Dialog Applications” arXiv, 2022 DOI: 10.48550/ARXIV.2201.08239
- [7] Kai Zhang, Jun Yu, Zhiling Yan, Yixin Liu, Eashan Adhikarla, Sunyang Fu, Xun Chen, Chen Chen, Yuyin Zhou, Xiang Li, Lifang He, Brian D. Davison, Quanzheng Li, Yong Chen, Hongfang Liu and Lichao Sun “BiomedGPT: A Unified and Generalist Biomedical Generative Pre-trained Transformer for Vision, Language, and Multimodal Tasks” arXiv, 2023 DOI: 10.48550/ARXIV.2305.17100
- [8] Aakanksha Chowdhery et al. “PaLM: Scaling Language Modeling with Pathways” arXiv, 2022 DOI: 10.48550/ARXIV.2204.02311
- [9] Yinhan Liu, Myle Ott, Naman Goyal, Jingfei Du, Mandar Joshi, Danqi Chen, Omer Levy, Mike Lewis, Luke Zettlemoyer and Veselin Stoyanov “RoBERTa: A Robustly Optimized BERT Pretraining Approach” arXiv, 2019 DOI: 10.48550/ARXIV.1907.11692
- [10] Jacob Devlin, Ming-Wei Chang, Kenton Lee and Kristina Toutanova “BERT: Pre-training of Deep Bidirectional Transformers for Language Understanding” arXiv, 2018 DOI: 10.48550/ARXIV.1810.04805
- [11] Tao Tu et al. “Towards Generalist Biomedical AI” arXiv, 2023 DOI: 10.48550/ARXIV.2307.14334
- [12] Karan Singhal et al. “Towards Expert-Level Medical Question Answering with Large Language Models” arXiv, 2023 DOI: 10.48550/ARXIV.2305.09617
- [13] Zheng Yuan, Yijia Liu, Chuanqi Tan, Songfang Huang and Fei Huang “Improving Biomedical Pretrained Language Models with Knowledge” arXiv, 2021 DOI: 10.48550/ARXIV.2104.10344
- [14] Qiao Jin, Bhuwan Dhingra, William W. Cohen and Xinghua Lu “Probing Biomedical Embeddings from Language Models” arXiv, 2019 DOI: 10.48550/ARXIV.1904.02181
- [15] Hongyi Yuan, Zheng Yuan, Ruyi Gan, Jiaxing Zhang, Yutao Xie and Sheng Yu “BioBART: Pretraining and Evaluation of A Biomedical Generative Language Model” arXiv, 2022 DOI: 10.48550/ARXIV.2204.03905
- [16] Jinhyuk Lee, Wonjin Yoon, Sungdong Kim, Donghyeon Kim, Sunkyu Kim, Chan Ho So and Jaewoo Kang “BioBERT: a pre-trained biomedical language representation model for biomedical text mining” In Bioinformatics 36.4 Oxford University Press (OUP), 2019, pp. 1234–1240 DOI: 10.1093/bioinformatics/btz682
- [17] Laila Rasmy, Yang Xiang, Ziqian Xie, Cui Tao and Degui Zhi “Med-BERT: pretrained contextualized embeddings on large-scale structured electronic health records for disease prediction” In npj Digital Medicine 4.1 Springer ScienceBusiness Media LLC, 2021 DOI: 10.1038/s41746-021-00455-y
- [18] Renqian Luo, Liai Sun, Yingce Xia, Tao Qin, Sheng Zhang, Hoifung Poon and Tie-Yan Liu “BioGPT: generative pre-trained transformer for biomedical text generation and mining” In Briefings in Bioinformatics 23.6 Oxford University Press (OUP), 2022 DOI: 10.1093/bib/bbac409
- [19] Yikuan Li, Shishir Rao, José Roberto Ayala Solares, Abdelaali Hassaine, Rema Ramakrishnan, Dexter Canoy, Yajie Zhu, Kazem Rahimi and Gholamreza Salimi-Khorshidi “BEHRT: Transformer for Electronic Health Records” In Scientific Reports 10.1 Springer ScienceBusiness Media LLC, 2020 DOI: 10.1038/s41598-020-62922-y
- [20] An Yan, Julian McAuley, Xing Lu, Jiang Du, Eric Y. Chang, Amilcare Gentili and Chun-Nan Hsu “RadBERT: Adapting Transformer-based Language Models to Radiology” In Radiology: Artificial Intelligence 4.4 Radiological Society of North America (RSNA), 2022 DOI: 10.1148/ryai.210258
- [21] Yanping Huang, Youlong Cheng, Ankur Bapna, Orhan Firat, Mia Xu Chen, Dehao Chen, HyoukJoong Lee, Jiquan Ngiam, Quoc V. Le, Yonghui Wu and Zhifeng Chen “GPipe: Efficient Training of Giant Neural Networks using Pipeline Parallelism” arXiv, 2018 DOI: 10.48550/ARXIV.1811.06965
- [22] Alexander Kolesnikov, Lucas Beyer, Xiaohua Zhai, Joan Puigcerver, Jessica Yung, Sylvain Gelly and Neil Houlsby “Big Transfer (BiT): General Visual Representation Learning” arXiv, 2019 DOI: 10.48550/ARXIV.1912.11370
- [23] Ilija Radosavovic, Raj Prateek Kosaraju, Ross Girshick, Kaiming He and Piotr Dollár “Designing Network Design Spaces” arXiv, 2020 DOI: 10.48550/ARXIV.2003.13678
- [24] Priya Goyal, Mathilde Caron, Benjamin Lefaudeux, Min Xu, Pengchao Wang, Vivek Pai, Mannat Singh, Vitaliy Liptchinsky, Ishan Misra, Armand Joulin and Piotr Bojanowski “Self-supervised Pretraining of Visual Features in the Wild” arXiv, 2021 DOI: 10.48550/ARXIV.2103.01988
- [25] Mingxing Tan and Quoc Le “Efficientnetv2: Smaller models and faster training” In International conference on machine learning, 2021, pp. 10096–10106 PMLR
- [26] Zhuang Liu, Hanzi Mao, Chao-Yuan Wu, Christoph Feichtenhofer, Trevor Darrell and Saining Xie “A ConvNet for the 2020s” arXiv, 2022 DOI: 10.48550/ARXIV.2201.03545
- [27] Mark Chen, Alec Radford, Rewon Child, Jeffrey Wu, Heewoo Jun, David Luan and Ilya Sutskever “Generative Pretraining From Pixels” In Proceedings of the 37th International Conference on Machine Learning 119, Proceedings of Machine Learning Research PMLR, 2020, pp. 1691–1703
- [28] Alexey Dosovitskiy, Lucas Beyer, Alexander Kolesnikov, Dirk Weissenborn, Xiaohua Zhai, Thomas Unterthiner, Mostafa Dehghani, Matthias Minderer, Georg Heigold, Sylvain Gelly, Jakob Uszkoreit and Neil Houlsby “An Image is Worth 16x16 Words: Transformers for Image Recognition at Scale” arXiv, 2020 DOI: 10.48550/ARXIV.2010.11929
- [29] Kai Han, An Xiao, Enhua Wu, Jianyuan Guo, Chunjing Xu and Yunhe Wang “Transformer in transformer” In Advances in Neural Information Processing Systems 34, 2021, pp. 15908–15919
- [30] Ze Liu, Yutong Lin, Yue Cao, Han Hu, Yixuan Wei, Zheng Zhang, Stephen Lin and Baining Guo “Swin transformer: Hierarchical vision transformer using shifted windows” In Proceedings of the IEEE/CVF international conference on computer vision, 2021, pp. 10012–10022
- [31] Hugo Touvron, Matthieu Cord, Matthijs Douze, Francisco Massa, Alexandre Sablayrolles and Herve Jegou “Training data-efficient image transformers & distillation through attention” In Proceedings of the 38th International Conference on Machine Learning 139, Proceedings of Machine Learning Research PMLR, 2021, pp. 10347–10357
- [32] Haiyan Wu, Yuting Gao, Yinqi Zhang, Shaohui Lin, Yuan Xie, Xing Sun and Ke Li “Self-supervised models are good teaching assistants for vision transformers” In International Conference on Machine Learning, 2022, pp. 24031–24042 PMLR
- [33] Sheng Wang, Zihao Zhao, Xi Ouyang, Qian Wang and Dinggang Shen “ChatCAD: Interactive Computer-Aided Diagnosis on Medical Image using Large Language Models” arXiv, 2023 DOI: 10.48550/ARXIV.2302.07257
- [34] Zihao Zhao, Sheng Wang, Jinchen Gu, Yitao Zhu, Lanzhuju Mei, Zixu Zhuang, Zhiming Cui, Qian Wang and Dinggang Shen “ChatCAD+: Towards a Universal and Reliable Interactive CAD using LLMs” arXiv, 2023 DOI: 10.48550/ARXIV.2305.15964
- [35] Sihong Chen, Kai Ma and Yefeng Zheng “Med3d: Transfer learning for 3d medical image analysis” In arXiv preprint arXiv:1904.00625, 2019
- [36] Zongwei Zhou, Vatsal Sodha, Md Mahfuzur Rahman Siddiquee, Ruibin Feng, Nima Tajbakhsh, Michael B Gotway and Jianming Liang “Models genesis: Generic autodidactic models for 3d medical image analysis” In Medical Image Computing and Computer Assisted Intervention–MICCAI 2019: 22nd International Conference, Shenzhen, China, October 13–17, 2019, Proceedings, Part IV 22, 2019, pp. 384–393 Springer
- [37] Shekoofeh Azizi, Basil Mustafa, Fiona Ryan, Zachary Beaver, Jan Freyberg, Jonathan Deaton, Aaron Loh, Alan Karthikesalingam, Simon Kornblith and Ting Chen “Big self-supervised models advance medical image classification” In Proceedings of the IEEE/CVF international conference on computer vision, 2021, pp. 3478–3488
- [38] Hong-Yu Zhou, Shuang Yu, Cheng Bian, Yifan Hu, Kai Ma and Yefeng Zheng “Comparing to Learn: Surpassing ImageNet Pretraining on Radiographs By Comparing Image Representations” arXiv, 2020 DOI: 10.48550/ARXIV.2007.07423
- [39] Shih-Cheng Huang, Liyue Shen, Matthew P. Lungren and Serena Yeung “GLoRIA: A Multimodal Global-Local Representation Learning Framework for Label-efficient Medical Image Recognition” In 2021 IEEE/CVF International Conference on Computer Vision (ICCV) IEEE, 2021 DOI: 10.1109/iccv48922.2021.00391
- [40] Hari Sowrirajan, Jingbo Yang, Andrew Y Ng and Pranav Rajpurkar “Moco pretraining improves representation and transferability of chest x-ray models” In Medical Imaging with Deep Learning, 2021, pp. 728–744 PMLR
- [41] Yuhao Zhang, Hang Jiang, Yasuhide Miura, Christopher D Manning and Curtis P Langlotz “Contrastive learning of medical visual representations from paired images and text” In Machine Learning for Healthcare Conference, 2022, pp. 2–25 PMLR
- [42] Ekin Tiu, Ellie Talius, Pujan Patel, Curtis P. Langlotz, Andrew Y. Ng and Pranav Rajpurkar “Expert-level detection of pathologies from unannotated chest X-ray images via self-supervised learning” In Nature Biomedical Engineering 6.12 Springer ScienceBusiness Media LLC, 2022, pp. 1399–1406 DOI: 10.1038/s41551-022-00936-9
- [43] Duy M.. Nguyen, Hoang Nguyen, Nghiem T. Diep, Tan N. Pham, Tri Cao, Binh T. Nguyen, Paul Swoboda, Nhat Ho, Shadi Albarqouni, Pengtao Xie, Daniel Sonntag and Mathias Niepert “LVM-Med: Learning Large-Scale Self-Supervised Vision Models for Medical Imaging via Second-order Graph Matching” arXiv, 2023 DOI: 10.48550/ARXIV.2306.11925
- [44] Jieneng Chen, Yongyi Lu, Qihang Yu, Xiangde Luo, Ehsan Adeli, Yan Wang, Le Lu, Alan L. Yuille and Yuyin Zhou “TransUNet: Transformers Make Strong Encoders for Medical Image Segmentation” arXiv, 2021 DOI: 10.48550/ARXIV.2102.04306
- [45] Yundong Zhang, Huiye Liu and Qiang Hu “Transfuse: Fusing transformers and cnns for medical image segmentation” In Medical Image Computing and Computer Assisted Intervention–MICCAI 2021: 24th International Conference, Strasbourg, France, September 27–October 1, 2021, Proceedings, Part I 24, 2021, pp. 14–24 Springer
- [46] Yutong Xie, Jianpeng Zhang, Chunhua Shen and Yong Xia “Cotr: Efficiently bridging cnn and transformer for 3d medical image segmentation” In Medical Image Computing and Computer Assisted Intervention–MICCAI 2021: 24th International Conference, Strasbourg, France, September 27–October 1, 2021, Proceedings, Part III 24, 2021, pp. 171–180 Springer
- [47] Jeya Maria Jose Valanarasu, Poojan Oza, Ilker Hacihaliloglu and Vishal M Patel “Medical transformer: Gated axial-attention for medical image segmentation” In Medical Image Computing and Computer Assisted Intervention–MICCAI 2021: 24th International Conference, Strasbourg, France, September 27–October 1, 2021, Proceedings, Part I 24, 2021, pp. 36–46 Springer
- [48] Ali Hatamizadeh, Yucheng Tang, Vishwesh Nath, Dong Yang, Andriy Myronenko, Bennett Landman, Holger R Roth and Daguang Xu “Unetr: Transformers for 3d medical image segmentation” In Proceedings of the IEEE/CVF winter conference on applications of computer vision, 2022, pp. 574–584
- [49] Hu Cao, Yueyue Wang, Joy Chen, Dongsheng Jiang, Xiaopeng Zhang, Qi Tian and Manning Wang “Swin-unet: Unet-like pure transformer for medical image segmentation” In European conference on computer vision, 2022, pp. 205–218 Springer
- [50] Peilun Shi, Jianing Qiu, Sai Mu Dalike Abaxi, Hao Wei, Frank P.-W. Lo and Wu Yuan “Generalist Vision Foundation Models for Medical Imaging: A Case Study of Segment Anything Model on Zero-Shot Medical Segmentation” In Diagnostics 13.11 MDPI AG, 2023, pp. 1947 DOI: 10.3390/diagnostics13111947
- [51] Jianing Qiu, Lin Li, Jiankai Sun, Jiachuan Peng, Peilun Shi, Ruiyang Zhang, Yinzhao Dong, Kyle Lam, Frank P-W Lo and Bo Xiao “Large AI Models in Health Informatics: Applications, Challenges, and the Future” In arXiv preprint arXiv:2303.11568, 2023
- [52] Rich Caruana In Machine Learning 28.1 Springer ScienceBusiness Media LLC, 1997, pp. 41–75 DOI: 10.1023/a:1007379606734
- [53] Julián N. Acosta, Guido J. Falcone, Pranav Rajpurkar and Eric J. Topol “Multimodal biomedical AI” In Nature Medicine 28.9 Springer ScienceBusiness Media LLC, 2022, pp. 1773–1784 DOI: 10.1038/s41591-022-01981-2
- [54] Zheng Yuan, Qiao Jin, Chuanqi Tan, Zhengyun Zhao, Hongyi Yuan, Fei Huang and Songfang Huang “RAMM: Retrieval-augmented Biomedical Visual Question Answering with Multi-modal Pre-training” arXiv, 2023 DOI: 10.48550/ARXIV.2303.00534
- [55] Kathryn Wantlin, Chenwei Wu, Shih-Cheng Huang, Oishi Banerjee, Farah Dadabhoy, Veeral Vipin Mehta, Ryan Wonhee Han, Fang Cao, Raja R. Narayan, Errol Colak, Adewole Adamson, Laura Heacock, Geoffrey H. Tison, Alex Tamkin and Pranav Rajpurkar “BenchMD: A Benchmark for Unified Learning on Medical Images and Sensors” arXiv, 2023 DOI: 10.48550/ARXIV.2304.08486
- [56] Thomas M. Sutter, Imant Daunhawer and Julia E. Vogt “Generalized Multimodal ELBO” arXiv, 2021 DOI: 10.48550/ARXIV.2105.02470
- [57] Jiancheng Yang, Rui Shi, Donglai Wei, Zequan Liu, Lin Zhao, Bilian Ke, Hanspeter Pfister and Bingbing Ni “MedMNIST v2 - A large-scale lightweight benchmark for 2D and 3D biomedical image classification” In Scientific Data 10.1 Springer ScienceBusiness Media LLC, 2023 DOI: 10.1038/s41597-022-01721-8
- [58] Bogdan Ionescu et al. “Overview of the ImageCLEF 2022: Multimedia Retrieval in Medical, Social Media and Nature Applications” In Lecture Notes in Computer Science Springer International Publishing, 2022, pp. 541–564 DOI: 10.1007/978-3-031-13643-6_31
- [59] Obioma Pelka, Sven Koitka, Johannes Rückert, Felix Nensa and Christoph M. Friedrich “Radiology Objects in COntext (ROCO): A Multimodal Image Dataset” In Intravascular Imaging and Computer Assisted Stenting and Large-Scale Annotation of Biomedical Data and Expert Label Synthesis Springer International Publishing, 2018, pp. 180–189 DOI: 10.1007/978-3-030-01364-6_20
- [60] O. Bodenreider “The Unified Medical Language System (UMLS): integrating biomedical terminology” In Nucleic Acids Research 32.90001 Oxford University Press (OUP), 2004, pp. 267D–270 DOI: 10.1093/nar/gkh061
- [61] Kaiming He, Xiangyu Zhang, Shaoqing Ren and Jian Sun “Deep residual learning for image recognition” In Proceedings of the IEEE conference on computer vision and pattern recognition, 2016, pp. 770–778
- [62] Ilya Loshchilov and Frank Hutter “Decoupled weight decay regularization” In arXiv preprint arXiv:1711.05101, 2017
Supplementary Material: Multi-domain improves out-of-distribution and data-limited scenarios
Appendix A PolyMNIST
In Figure A.1, we present 24 distinct data distributions, each representing the number of samples within training and validation splits. Within each subfigure, the titles align with the data points employed for the evaluations in Figure 4 and Figure 5 along the x-axis.
Furthermore, we conducted an additional experiment, mirroring the amount of data experiments conducted with MedMNIST and ImageCLEFmedical datasets using the sampling percentage. For this, we used a uniform sample distribution for each digit/modality combination having 1000 samples. Subsequently, we performed sampling at rates of , resulting further in a uniform distribution. For example, when using a 10% sampling percentage, we obtained 100 samples for each digit/modality combination. Figure A.2 reports AUC under the average balanced accuracy curves across sampling percentage for various OOD levels for PolyMNIST. Notably, these results underscores the similar trend to those observed in Figure 3.

Appendix B MedMNIST
Figure B.1 presents a comprehensive summary of the average balanced accuracy scores for both specialized and multi-domain models for different OOD levels and amount of data. We report the mean and standard deviation (as the error bar) of the test accuracy across five random seeds.
Figure B.2 reports the AUC, Figure B.3 highlights the accuracy differences, and Figure B.4 shows the accuracy of the specialized and multi-domain models at a more granular view level.

Appendix C ImageCLEFmedical
Figure C.1 presents a comprehensive summary of the average balanced accuracy scores for both specialized and multi-domain models for different OOD levels and amount of data. We report the mean and standard deviation (as the error bar) of the test accuracy across five random seeds.