Phosphorus recycling from human excreta in French agroecosystems and potential for food self-sufficiency
Abstract
Phosphorus (P) is an essential constituent of life but large P losses from agroecosystems and sanitation systems are a major source of eutrophication in water bodies. These losses are doubly detrimental as P in human excretions can be used for crop fertilization. Through a unique dataset of 20,000 French WasteWater Treatment Plants (WWTPs) operational measurements over two decades and a P mass balance, we assess the fate of human excretions and their agricultural potential. Despite 75% of French WWTPs sludge being spread on crops, only 50% of the excreted P makes it back to agroecosystems. This is among the highest rate in Western countries where assessments have been made. Meanwhile, another 35% of the excreted P ends up in surface waters or the environment through WWTP discharge, individual autonomous systems diffuse losses, and sewers leaks. The remaining 15% is incinerated or sent to landfills. Moreover, while WWTP removal efficiency increased in the 2000s, reaching an 80% national average, it has been followed by a decade of stagnation in every French basin. The final removal efficiency for each basin, from 65% to 85%, closely matches whether the area was defined as P-sensitive in the European directive. Our results suggest that recycling all P in excretions could help supply 7 to 34% of French food supply without changing the current food system. Reshaping agricultural systems (shifting to more plant-based diets, decreasing P losses and food waste) would enable to go even further on the road to food sufficiency.
Abstract
Keywords
Wastewater Treatment Plant, Removal efficiency, Wastewater, Sludge, Excretions, Phosphorus
Abbreviations
WWTP: WasteWater Treatment Plant P: Phosphorus PUE: Phosphorus Use Efficiency
1 Introduction
Phosphorus (P) is a key nutrient for agriculture. Historically, its limited availability has been a major challenge for crop yields, and it is still limiting crop production in a large part of the African continent. At the same time, the excessive phosphorus application in industrial agriculture and the large amounts that flow into urban wastewater treatment plants lead to discharges in rivers and coastal systems. There, the increased phosphate concentration causes eutrophication and can result in harmful algal blooms [14, 44].
It is considered that P losses exceed planetary boundaries [50], because anthropogenic mined P ending up as influx to ocean is 8 times the natural background rate, potentially leading to large-scale abiotic zones following eutrophication. Globally, only 20-30% of phosphorus used as fertilizer finally reaches consumers’ plate [8]. However, if the P stored in agricultural soils is taken into account, the full chain P use efficiency rises up to 75% [51], leading to a soil P legacy that could be remobilized later along the land–freshwater continuum, worsening eutrophication issues [47]; on the other hand, this remobilized P could also enhance agroecological transitions before full nutrient circularity is achieved, allowing crops to draw from this stock during several decades and decrease phosphate fertilizers applications [32].
These losses mean that phosphorus leaving agroecosystems must be replenished by other sources of phosphorus. Phosphate-rocks-based fertilizers are a finite resource [57, 45] and P losses induce eutrophication and biodiversity loss. Moreover, mined phosphate fertilizers contain high concentrations of heavy metals and radioactive elements, which can pollute agricultural soils [56].
Even without physical P scarcity, countries consuming P fertilizers can be affected by economically or politically induced P scarcity, following price shocks or geopolitical tensions because of the very skewed distribution of P reserves and production towards a handful of countries [6]. A solution to reduce vulnerability is to close this “broken biogeochemical cycle” [13], which will also address the environmental issue.
As recovering phosphorus is extremely difficult once it has reached the ocean, a sustainable P management requires an almost circular system to bring P emissions into water bodies and landfilling as close to zero as possible. Besides diffuse P emissions – erosion from the soil and especially from agricultural parcels during rain events – other main sources of phosphorus emissions in Western societies are point sources: human excretions in urban wastewater that reach the environment through Waste Water Treatment Plants (WWTPs) effluents. WWTPs generally operate in 3 steps to address this pollution. Primary treatment removes suspended solids and organic matter, secondary treatment further removes biodegradable matter, and tertiary treatment focuses on phosphorus and nitrogen enhanced removal [52]. Energy recovery from urban wastewater is often emphasized, namely to produce biogas. While this energy can be valuable to operate WWTPs, the potential represents at the very best only 1% of global anthropic energy consumption [43]. More interesting is to recover nutrients for food self-sufficiency: while livestock excretions are almost completely collected and reused in agroecosystems, this is not the case for human excretions.
Studies have consistently found that recycling all P in human excretions could meet 20% of the current global P demand [38], well above the estimated 1% for energy consumption. Estimations of excretions flows have been produced as part of global P budgets, but with diverging recycling rates, from 10% to 60% [8, 36, 44, 48], due to the uncertainty surrounding the fate of P excreted by the majority of the world population not connected to sewers.
The uncertainty is much less strong in Western societies, where most people are connected to sewers. Multiple P budgets of sanitation systems have been produced as part of national P budgets [23, 26, 39, 46]. Yet they often rely on an average WWTP removal efficiency at the national level, or on mean P concentrations in sewers. In addition, the flows for people not connected to sewers are not always detailed, and sewers losses are often neglected.
[15] have overcome some of these shortcomings at the regional scale for the Paris mega city area, by relying on operational data of a few WWTPs, and found low recycling rates (5%). Yet the Paris area is quite atypical, with a high population density and large industrial WWTPs. Expanding this work to other regions with data from all French WWTP can give more insight beyond Paris particular case. For instance, not all French territories are classified as P sensitive to eutrophication – as defined by the 1991 European directive on wastewaters [16]. Such a classification influences the legal requirements regarding P removal in WWTP [34], and thus recycling rates. Moreover, regional analysis is important for the recycling of WWTP sludge because these sludge have a lower P concentration than conventional fertilizers. Transportation of large amounts of sludge can thus be a major limiting factor of the geographical range for nutrient cycling. Building a dataset of all French WWTPs with their P removal efficiencies and their features (such as classification in a P sensitive zone) can help overcome these knowledge gaps.
To our knowledge, our work is the first P mass balance of a national sanitation system based on real operational data gathered from the more than 20,000 French WWTPs, over 1 decade or more. We analyze P flows into water and soil to evaluate how P management changed as legislation evolved and how this influenced agricultural practices. We also assess the potential of P-recovery from human excreta to sustain French agricultural production. Using our large dataset allows to draw conclusions about the influence of regulations applying to zones classified as sensitive to eutrophication on the performance of WWTPs. It also allows us to reduce uncertainties on upstream and downstream P flows and quantify P losses at steps that are often overlooked: individual autonomous systems and sewers leaks and overflows. This helps to quantitatively assess the levers to bridge the gap between the current P recycling rate and the potential contribution of excreted P.
2 Materials and Methods
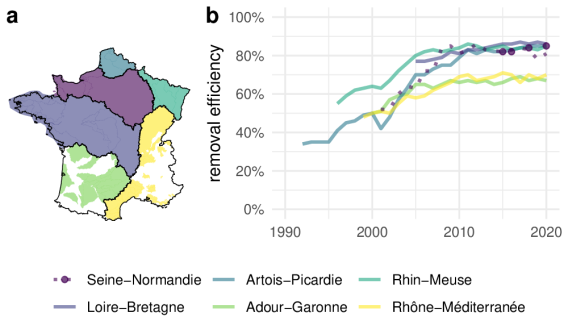
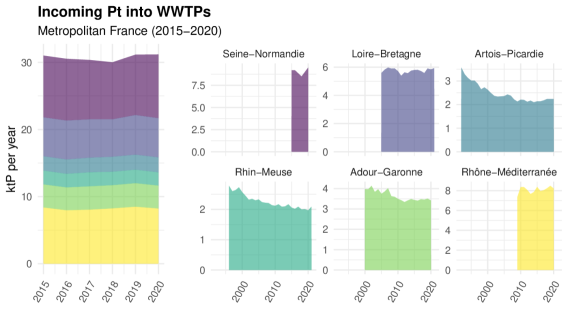
In this section we describe the datasets used for our P budget (outlined in Appendix Table A.1) and the specific parameters incorporated into our modeling (detailed in Table 1), including a discussion of uncertainties (see Appendix A.2 for more details). The core of our work consisted of analyzing the data of the 20,000 French WWTP, issued from the 6 French Water Agencies: Artois-Picardie, Rhin-Meuse, Seine-Normandie, Loire-Bretagne, Rhône-Méditerranée, Adour-Garonne (Figure 2a). Each water agency is attached to the watershed of its main rivers.
The P mass balance is then conducted for each of the six water agency basins in France, and the results are consolidated to achieve a national balance. We also present our method to estimate the potential contribution of P in excretions to domestic food supply. The budget focuses on metropolitan France (including Corsica but excluding overseas territories). The results are part of a larger project assessing nutrient flows in the French sanitation system; the code to generate, cleanup, and analyze the data is available as a Git repository222https://codeberg.org/TStarck/N_P_France_sanitation_system. The original datasets sources before cleanup, the consolidated data used for the analysis, the graphs and more information are available on Zenodo333https://doi.org/10.5281/zenodo.7990171.
2.1 Dataset sources
In France, the number of WWTPs exceeds 20,000, and roughly 1,500 industrial facilities disclose information about P discharge into sewers. Our estimation of P flows released through sewers by industries, WWTPs’ inflows and outflows, as well as the various destinations of WWTP sludge, rely on comprehensive datasets detailed hereafter and listed in Appendix Table A.1. We also address potential data discrepancies by identifying and correcting apparent outliers.
2.1.1 Data corrections
The data on sludge production, industry discharges, and WWTPs inflows and outflows were scrutinized for obvious outliers. At the basin level, the P flows for each year were aggregated and scrutinized to identify unexpected spikes in specific years. This helped in detecting apparent outliers. When it was possible to identify that the peak was simply due to a misplaced comma for that particular year (factor 10, 100, or 1,000), we corrected the entry; otherwise, the outlier was not considered in the analysis and the entry was discarded from the final dataset. For P flows in and out of WWTP, we identified 7 obvious outliers for the 20,000 French WWTPs, over a decade or more depending on the water agencies basins. For sludge quantities production, we identified 25 outliers for the 20,000 WWTPs over the 7 years of reported data. For industry discharge, we found 3 outliers for the 1,000 facilities over 1 decade of data.
2.1.2 Phosphorus flows in and out of wastewater treatment plants and removal efficiencies
France counts over 20,000 WWTPs, with data on the annual average P inflows and outflows for each station collected from the 6 French water agencies. While data availability varies across basins (e.g., 1992–2020 for Artois–Picardie, 2009–2020 for Rhône–Méditerranée), our P mass balance relies on mean flows over 2015–2020. P inflows refers to P entering the WWTP (in ton per year). P outflow refers to P discharged by the WWTP in the water. Phosphorus stored in sludge is assumed to be the difference between P inflow and outflow: . Data was solely available for 2015, 2016, 2018 and 2020 in the Seine–Normandie basin, except for 6 of the biggest WWTPs in the Paris region that are managed by SIAAP (Syndicat Interdépartemental pour l’Assainissement de l’Agglomération Parisienne). These 6 facilities handle half of the basin pollution, and we obtained the data for 2007–2020. Uncertainties on these incoming and outgoing flows, discussed in the Appendix A.2.1, are estimated to be 10%.
The P removal efficiency of a WWTP is defined as .
2.1.3 Sludge production and destination
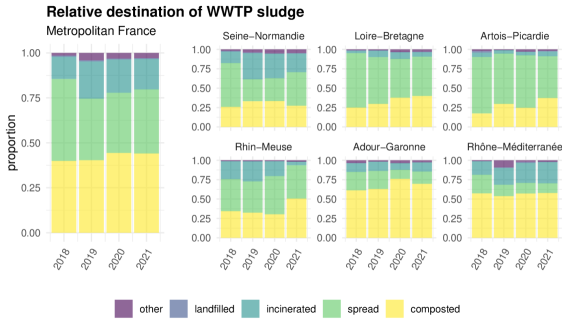
The French sanitation portal database [41] provides annual reports on sludge production for each WWTP, as well as their respective destinations (e.g., direct spreading, composting, incineration). [18] also offers a national-scale summary of sludge production. The annual production is between 1 and 1.1 Mt of dry matter, consistent over the years. From 2018 to 2021, where sludge destinations are stabilized and coherent, approximately 45% of sludge is composted and 30% directly spread on crops at the national level. Uncertainties, discussed in the Appendix A.2.2, are estimated to be 10%.
2.1.4 Large industries discharge in sewers
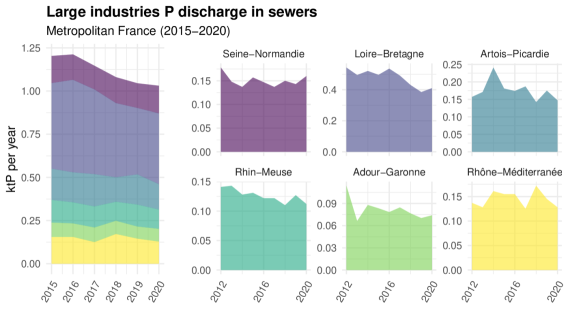
Some industries release their P pollutant in the sewers (after a preliminary treatment). To estimate the annual discharge of P by industries into sewers, we used the GEREP database, provided by the Direction Générale de la Prévention des Risques from the Ministry of Ecological Transition, which reports approximately 1,200 facilities. Uncertainties, discussed in the Appendix A.2.3, are estimated to be 10%.
2.1.5 French population
We used data from the French National Institute of Statistics and Economic Studies [27], which provides information on the population in 2018 in each city together with their age distribution. The uncertainty associated with population data is probably negligible in comparison to the other parameters given the large spatial scales. However, there is a 3% uncertainty at the national level as we do not account for tourism and demographic changes; this is discussed in the Appendix A.2.4.
2.1.6 Reference years for the P budget
We calculate the P balance flows for each water agency, using averaged quantities of industries discharge to sewers and WWTP P flow over the 2015–2020 period. To determine sludge destination, we average over the years 2018–2021, as data before this period is inconsistent and barely reported.
2.2 Individual parameters
This section outlines the various coefficients that were utilized to calculate the phosphorus mass balance, along with their corresponding uncertainties (Table 1).
| parameter | value | source | |
| Direct discharge and losses from sewers at the basin scale ( of pollution entering the wastewater treatment plants) | Artois-Picardie basin | Water agencies data | |
| Rhin-Meuse basin | |||
| Seine-Normandie basin | |||
| Loire-Bretagne basin | |||
| Adour-Garonne basin | |||
| Rhône-Méditerranée basin | |||
| France | Combined basins | ||
| Total population (million) and share not connected to sewers | Artois-Picardie basin | 4.8M, | Water agencies data |
| Rhin-Meuse basin | 4.3M, | ||
| Seine-Normandie basin | 19M, | ||
| Loire-Bretagne basin | 13M, | ||
| Adour-Garonne basin | 7.8M, | ||
| Rhône-Méditerranée basin | 16M, | ||
| France | 64.9M, | Combined basins | |
| Individual autonomous system P mass balance | sludge | [5, 42] | |
| underground diffuse losses | |||
| For people not connected to sewers, share of excretions in sewers (i.e. excretion in public spaces connected to sewers). | 1/3 | estimation | |
| P ingestion by French people (g/day) | female, 10 years old | 0.96 | INCA3 study [11, 9] |
| female, 11-18 years old | 1.09 | ||
| female, 18-44 years old | 1.11 | ||
| female, 45-64 years old | 1.12 | ||
| female, 65 years old | 1.03 | ||
| male, 10 years old | 1.01 | ||
| male, 11-18 years old | 1.32 | ||
| male, 18-44 years old | 1.41 | ||
| male, 45-64 years old | 1.42 | ||
| male, 65 years old | 1.32 | ||
2.2.1 Phosphorus excretions (urine and feces)
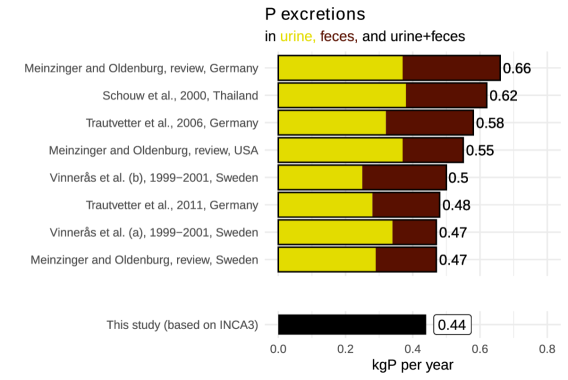
We used data from the INCA3 study [11, 9] to determine P ingestion by French citizens, disaggregated by age and sex categories. This is coupled with INSEE data describing the French population by city and by age [27], to determine P excretions for each water agency basin and France. This results in an averaged national P excretion of 0.44 kgPcapyear-1. More information and a discussion of the uncertainties (30%) can be found in section in the Appendix A.2.5.
2.2.2 Individual Autonomous Systems
The percentage of people not connected to sewers and utilizing independent autonomous systems is calculated using Eurostat’s 18% figure for metropolitan France [19]. Figures from the Status Reports (“Etat des lieux” in French) of various water agency basins’ experts are used for the 6 water agency basins. We assume that individuals not connected to sewers excrete 1/3 of their P in public spaces connected to sewers [24].[5] and [42] produced a P mass balance of skeptic tanks. Based on their results, we assume that for people with individual autonomous system, 85% (80-90%) of the P ends as underground diffuse losses (effluent of the septic tanks), and 15% (10-20%) in skeptic tank sludge, which is then brought to WWTP. The respective uncertainties are discussed in the Appendix A.2.6.
2.2.3 Direct discharge losses
A portion of the discharged phosphorus doesn’t reach the WWTPs because of incorrect pipe connections, sewer overflows and leaks. Through individual WWTP data and water agency status reports we established a national average of 10% for pre-WWTP loss. The high relative uncertainty (50%) is discussed in the Appendix A.2.7.
2.2.4 Calculation of residual pollution
From the inputs measured at the WWTP inlet and our estimated values of networks direct discharges, we obtain the theoretical flow entering sewers. This value is greater than the combined discharge of industry and human excreta into sewers. We call the difference “residuals”, which includes several elements: household detergents, household kitchen leftovers, small industries not required to declare discharges into sewers, surface runoff entering the combined sewer networks…
To estimate the residual flow entering individual autonomous systems, we make the assumption that the residual flow of the networks is essentially due to domestic discharges, and apply the same residues/excretions ratio to individual autonomous systems (still taking into account that people with individual autonomous system excrete 1/3 of their P in public spaces connected to sewers, see section 2.2.2).
2.3 Potential for domestic food consumption
We assess the potential contribution to food security if all P in excretions were reused as fertilizers. First, we compare the amount of P in excretions to P fertilizers consumption reported by [20]. This is useful to indicate the potential decrease in dependence towards providers of phosphate rocks. However this does not indicate how much of the P in domestic food consumption could be covered. Indeed, France is largely an open food system [3], and some P fertilizers are used to grow crops that are finally exported, while others are hidden in imported crops and not accounted for.
To overcome this shortcoming, we use the notion of P footprint, to get a better sense of the potential contribution of human P excretions to food supply in France. The P footprint allows to see the required P to feed a population, and account for the requirements beyond the country’s borders that may be hidden by food commodities imports/exports. The P footprint (Pf) is associated to the food supply P content (Ps) of a population and the the P use efficiency (PUE) through the following relation: . Note that the food supply refers to food before waste at the consumer stage, so its P content is higher than the P ingested/excreted.
We then compare the P content of excretions to the footprint of the domestic food supply, to see what share could be covered if all of the P in excretions were reused as fertilizers. We also distinguish between plant- and animal-based products since they have very different PUEs (and footprints) on average. We look at what would happen if all P excretions used as fertilizers were prioritized towards crops aimed at directly feeding humans. This gives an upper bound for the contribution of excreted P to food production (and thus domestic food self-sufficiency), since crops PUE is much larger than animal products PUE. More details about the calculations can be found in the Appendix A.3 and the Supplementary Spreadsheet.
We compute these contributions for the Paris megacity (10 million inhabitants, taken as a proxy for France, from [15]). Though the precise results at the national scale might be slightly different than for Paris (e.g., P intake of 0.44 kgPcapyear-1 in our study for France vs 0.43 in [15] for Paris megacity), we make the hypothesis that they should be close since the diet should be similar throughout the country.
We also look at figures for the whole world, based on [51], for two main reasons. First, it allows us to have a sanity check on our P footprint method, and to compare it to results already present in the literature. Second, beyond the current food system, the potential contribution of excretions to food security could be further increased by redesigning this food system (reduced share of animal products, increased PUE, decreased food waste). Comparing France to the world is a way to evaluate the effect of diets without further detailed modeling.
All values used as inputs for our analysis come from the values from [51] and [15]; they are reported in Table 2.3, and the detailed calculations are reported in the Appendix A.3 and Supplementary Spreadsheet.
| Reported by the studies (input values) | ||
| World (MtP) (years 2000-2010) [51] | Paris Megacity (ktP) (year 2012) [15] | |
| P in excretions and ingestions | 4 | 4.3 |
| P in domestic food supply | Vegetal 2.9 | Vegetal 2.2 |
| Animal 1.5 | Animal 3.9 | |
| Fish 0.2 | Fish 0.5 | |
| Additives 0.5 | - | |
| Total 5.1 | Total 6.6 | |
| P footprint (excluding fish and additives) | Vegetal 5.8 | Vegetal 2.1 |
| Animal 15-30 | Animal 53.2 | |
| Vegetal + Animal 20.8-35.8 | Vegetal + Animal 55.3 | |
| P use efficiency (supply/footprint) | Crop | Crop (mining) |
| Animal 5-10% | Animal | |
| Vegetal + Animal 12-21% | Vegetal + Animal | |
| Potential contribution of P excretions to domestic food supply (results computed from input values) | ||
| World (MtP) (years 2000-2010) | Paris Megacity (ktP) (year 2012) | |
| P in food (before urban waste) obtained with P excretions used as fertilizer | Prioritizing vegetal production | Prioritizing vegetal production |
| Vegetal 2 | Vegetal 2.1 | |
| Animal 0 | Animal 0.2 | |
| Total 2 | Total 2.3 | |
| Not prioritizing vegetal production | Not prioritizing vegetal production | |
| Total 0.5-0.8 | Total 0.5 | |
| Share of domestic P consumption covered with excretions used as fertilizer | Prioritizing vegetal production | Prioritizing vegetal production |
| Vegetal | Vegetal | |
| Animal | Animal | |
| Total (incl. fish & additives) | Total (incl. fish) | |
| Not prioritizing vegetal production | Not prioritizing vegetal production | |
| Total 10-16% (incl. fish & additives) | Total (incl. fish) | |
3 Results
3.1 French sanitation system P budget and recycling to agroecosystems
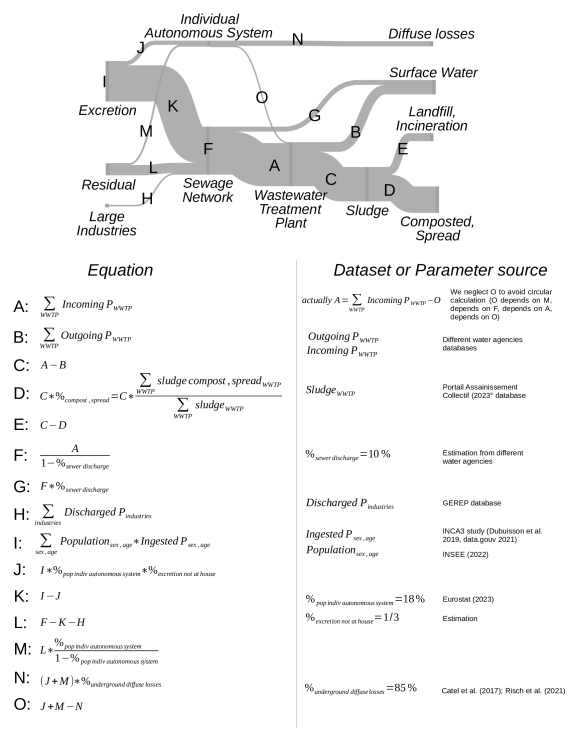
Over 2015–2020, French P excretions totaled 28.4 ktPyear-1, with large industries discharging 1.1 ktPyear-1 into sewers and residual P (e.g. detergents, kitchen waste, runoff, small industries) amounting to 8.5 ktPyear-1 (Figure 1). The 38 ktP resulting from these three flows enter the sanitation system through sewers and individual autonomous systems. Of this, 18.6 ktP (50%) is used as fertilizer on crops (30% as direct application of WWTP sludge and 20% after composting), 13.7 ktP (35%) reaches surface water or is diffusely lost in the ground, and 5.6 ktP (15%) is incinerated or lost in landfill.
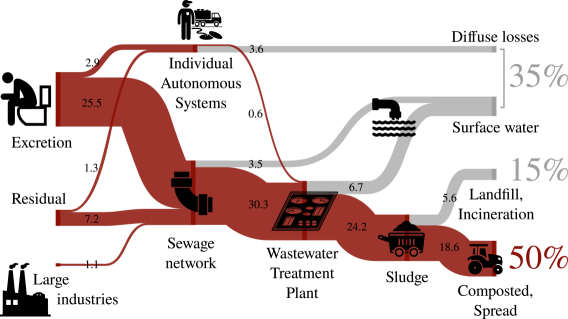
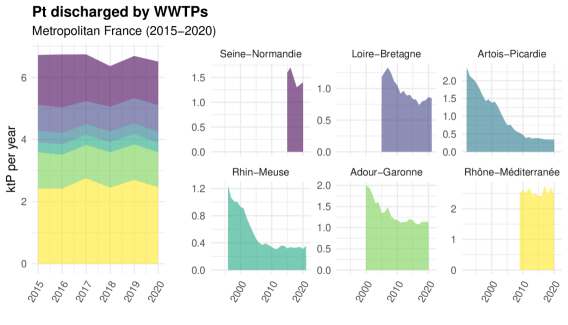
P discharged by WWTP to surface waters is 6.7 ktP (10%). The combined losses from individual autonomous systems – 3.6 ktP (5%) – and direct discharge from sewers – 3.4 ktP (50%) – are 7 ktP ( 25%), thus larger than WWTP discharge, but with much higher uncertainty. Because of these losses, despite a national WWTP removal efficiency of 80%, and 75% of French sludge being used as crop fertilizer (combined recovery of ), the whole sanitation system recycling rate is only 50%.
3.2 WWTP removal efficiency through space and time
Efficiency of P removal in each French water basins increased during the 2000s but plateaued in the 2010s at a national mean of 80%. The final performance correlates closely to the P sensitive area classification; Adour–Garonne and Rhône–Méditerranée basins, partly considered “non-sensitive to P” (Figure 2a), have lower removal efficiencies of 65–70% (Figure 2b), while the other basins achieve 80–85% efficiency.
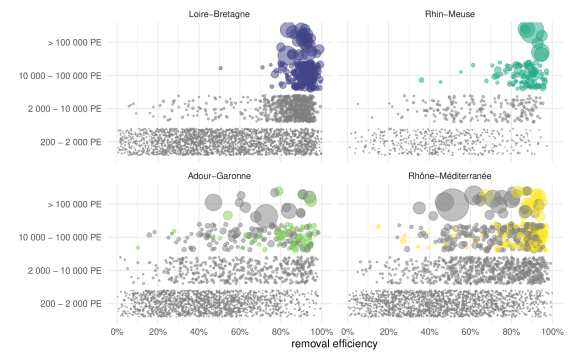
The primary reason for this contrast is the removal efficiency of large WWTPs. French decree [34] requires facilities larger than 10,000 in areas classified as sensitive to P to have 80% annual P removal or outflow concentration below 1–2 mgP/l. These make up 5% of French WWTPs but handle 80% of flows and are responsible for most of the difference between basins. There is no automatic requirement for smaller WWTPs or non-P sensitive areas. Figure 3 illustrates the effect of the decree. Large WWTP in P-sensitive areas tend to have removal efficiencies 80%. However, in Adour–Garonne and Rhône–Méditerranée basins, large facilities not classified as P sensitive frequently have lower removal efficiencies. The removal efficiencies of small (2,000 population equivalent) WWTPs take a wide range of values between 0 and 100%. Interestingly, intermediate WWTPs (2,000–10,000 population equivalent) tend to have higher removal efficiencies than small ones, since they are sometimes subject to local legal requirements.
3.3 Current agricultural potential
For 2015–2020, P fertilizers consumption in France is 180–200 ktP, so the 28 ktP excreted could replace 15% of the fertilizer consumption. Consolidated global figures for 2000–2010 by [51] are 14–18 MtP for fertilizer consumption and 4 MtP in excretions, resulting in a potential of 25%. This is an indication of how much independence could be gained from phosphate rocks imports.
At the global scale, based on our P footprint method, we find that food production requires approximately 21-36 MtP, meaning that completely recycling human P excretions could cover around 10-16% of the P food supply in the current food system. Prioritizing the recycling to plant-based production for human consumption could increase this rate up to 40%. In the case of France (extrapolated from the data of the Paris megacity) as the fraction of animal-based products in the diet is larger, the potential contribution to food domestic supply is only about 7% but it could go up to 34% if plant-based products for human consumption are prioritized (Table 2.3).
4 Discussion
4.1 Consistency of P removal efficiencies with the literature
The 80% removal efficiency at the basin level in P sensitive areas during 2010–2020 aligns with [10] 80–90% values for P tertiary treatment in WWTP. [55] and [54] propose respectively 30%-60%-90% and 10%-45%-90% removal efficiencies for primary, secondary, and tertiary treatments. Given that 1–2% of the French urban wastewaters are handled with primary treatment, 15–20% with secondary, and 80–85% with tertiary [19], the national removal efficiency would be 85% for [55] and 82% for [54], which is close to our study’s 80%.
Regarding the temporal evolution of removal efficiency, [54] suggested a P removal efficiency of 44% in 1990 and 59% in 2000 for Europe. For basins with data at those times, our values are 40% in 1990 and 50–63% in 2000.
4.2 Regulations led to increased P removal efficiency but not to higher recycling
P removal efficiencies closely match classification into P sensitive areas and European directives requirements. First, with the temporal increase in the 2000s for each basin and the stagnation levels in the 2010s (Figure 2); second with the effect on large WWTP when they are in sensitive areas (Figure 3). Further regulation might decrease P discharge from WWTP in Southern basins and for smaller facilities. However, about as much loss happens outside WWTP, because of sewer losses and individual autonomous systems. Improvements in WWTP removal efficiency will only increase sewers and individual autonomous systems losses relative share. Thus, future regulation on P pollution may need to look beyond WWTPs and address the whole sanitation system.
4.3 France recycling rate is one of the highest among western countries
Besides removal efficiencies, France global recycling of 50% of phosphorus in human excreta does not appear very high but is higher than other Western countries, whose recycling rates around 2010-2020 are estimated to be (non-exhaustive list): below 15% for Belgium [39], 25% for Austria [12], 50% for the UK [7], 25% for Sweden [35], 25% for Germany [28], virtually null for Netherlands [49], and 35% in Japan[37]. All these countries have relatively high removal efficiencies (from 60% to 90%). So in these Western and industrialized countries, the main factor underlying global recycling is not the removal efficiency but the share of WWTP sludge reused as fertilizer.
4.4 No silver bullet to increase recycling rate in the current sanitation system, but several levers
In the case of France, currently 75% of WWTP sludge are spread on agricultural land. Recycling all P in produced sludge could increase the sanitation recycling rate of P by 15 percentage points, or 30% in relative terms (figure 1). Increasing WWTP removal efficiencies is another lever, especially in the Southern basins. At best, hypothesizing 100% removal efficiency, it would increase recycling by 6.7 ktP (10%), or about 15-20% percentage points. The potential improvements are thus similar as the P lost from sewers (leaks and storm waters overflows) and Individual Autonomous System together, but these flows are overlooked in current policies. Finding ways to recover P from individual autonomous systems and reducing sewer losses should be considered by policy makers if the aim is to further improve circularity.
However activating all these levers would still leave some issues. First, this will not enhance nitrogen cycling in the sanitation system, which, contrary to phosphorus, is dissipated in the air as and when treated in WWTPs. Second, future regulation and lower thresholds for contaminant (especially heavy metals) in WWTP sludge may prevent high recycling rates. Source separation of excreta, before they reach sewers, could be one way to address these issues [31].
4.5 P in excretions could currently cover 7 to 34% of French food supply
The current global recycling of P excretion is unclear, with estimations from 10% to 66% [8, 36, 44, 48], owing to uncertainties concerning how human waste is handled for people not connected to sewers, representing the majority of world population [54]. However, it has consistently been estimated that recycling all human P excretions could cover roughly 20% of current P fertilizers demand in the current food system.
The P footprint method gives a global distribution for P use of 16–28% for plant products and 72–84% for animal products. This is in line with [51] assertion that “globally, the 80% of N and P in crop and grass harvests that feeds livestock ends up providing only around 20% (15–35%) of the N and P in human diets”. Our global food PUE (vegetal + animal, before waste) is 12–21%, consistent with the reported 12–20% full-chain PUE [51]. This consistency of the P footprint method at the global level thus comforts our results at the French scale.
Importantly, this P footprint method enables to go beyond the potential for food self-sufficiency in the current food system (19% globally and 11% in France): it suggests that prioritizing the recycling towards plant production for human consumption could help cover up to 40% of the P food supply globally and 30% in France. These results are relevant from a food security or a geopolitical perspective, to reduce national dependence on foreign phosphate rock supply.
It is worth mentioning that these figures concern the food system as currently designed. The rates could also be further increased by reducing food loss and waste, increasing crop and animal PUE and shifting towards more plant-based diets. While increasing crop PUE (currently around 50%) at the global scale is possible, this cannot be considered for France which is already in a situation of P mining. Interestingly, even though France has a crop and an animal PUE twice as good as the global figure (100% vs 50% and 10% vs 5%), the total food PUE is higher at the global scale than in France (respectively 21% and 14%). This is because the ratio of P sourced from plant-based versus animal-based products is 2 at the global scale but 0.43 in France, highlighting the impact of mostly animal-based diets in Western countries. About a third of the global food production is lost or wasted [22], and reducing it would increase the full chain PUE and the contribution of P excretions to food supply.
4.6 Regulations on P in detergents reduced P input to WWTPs
At least three successive limitations on P in detergents were taken in France and in Europe. In France, phosphorus in laundry detergents were banned in 2007 [33]. In 2013 the European Union banned consumer laundry detergents with standard doses 0.5 gP, and in 2017 automatic dishwater detergents with standard doses 0.3 gP [17]. As roughly 75% of the P in detergents came from laundry [54], most of the effect of the EU ban is thus expected to be seen before 2013. Supposing a consumption of 1 or 2 “standard doses” per capita and per week for both dishwater and laundry would give an upper limit P detergent emission of 0.04–0.08 kgPcapyear-1 after 2017, or 7–14% of our computed national emissions (0.58 kgPcapyear-1).
For the 2000s in EU25, [54] proposed a human P emission in wastewaters (domestic + industries) of 0.9–1 kgPcapyear-1, 40% of which were due to detergents from laundry and dishwashers (0.4 kgPcapyear-1). Despite large variations between European countries, this is in line with [55], based on [4], reporting a detergent consumption of 0.37 kgPcapyear-1 in 2005 for France. These values imply a non-detergent human P emission (domestic + industries) of 0.6 kgPcapyear-1. This corresponds to our figure of 0.58 kgPcapyear-1 for 2015–2020 in France, after the ban on P detergents.
Our estimation of residual P discharge is 8.5 ktP, or 0.13 kgPcapyear-1 (Figure 1), but this comes with high uncertainties. Given the uncertainty on P excretion per capita and sewer losses, the residual discharges are likely to be between 1.9 and 11 ktPyear-1, i.e., between 0.03 and 0.18 kgPcapyear-1.
From our data, it is not possible to directly observe the impact of P detergent ban through the temporal evolution of P emissions per capita. Reporting rates of WWTP data increase through time, reaching full levels in the 2010s, but are still incomplete before. This complicates the estimation of the temporal evolution of the number of people connected to sewers associated with the reported incoming pollution. Data about sewers overflows and leakage are also non-existent before 2015–2020.
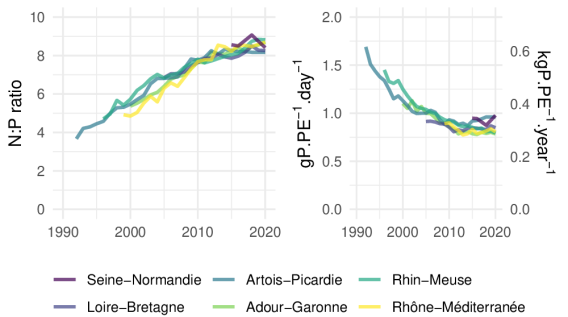
However, we can normalize incoming P flows by the nominal capacity of the reported WWTP data (in 2020 France total nominal capacity was 100 million population equivalents, for 54 million people effectively connected to sewers). We also normalize by incoming N flows (Figure 4). In both cases, most of the decrease in incoming P loads happens before 2010, and by 2015 the stabilization is over, consistent with the EU directive. These 2 ratios could be used in further work as inputs to model emissions of P detergents for 1990–2020 in France.
4.7 Limitations
The main limitations of the study are uncertainty in individual autonomous system P mass balance and rough estimation of sewer losses. Uncertainty in individual autonomous systems will be difficult to reduce, unless a large part of these facilities (5 million in France) is regularly monitored, which is implausible. The issue is different for sewers direct discharge, some of which are monitored. Increasing reporting rates may help reduce our current high uncertainty on this matter (50%). Combining this with quantification of the P flow due to runoff entering combined sewers networks could further improve our P budget. There are also uncertainties concerning P ingestion and excretion, which could be further assessed.
5 Conclusion
Though France has a high P reuse in agriculture, with a 50% recycling rate, this is not primarily due to a will to recycle but to a will to limit P discharge in surface water, combined with a permissive legislation on sewage sludge. Enhancing WWTP P-removal in basins where surface water is currently considered “non sensitive” to eutrophication could both reduce water pollution and increase P recycling rate.
However, sewage sludge use in agriculture also presents significant drawbacks due to health and environmental impacts, notably from various pollutants and heavy metals [30]. Because of this, future legislation may restrict its use [40, 25], thus reducing nutrient cycling. Source separation of human excreta is therefore an important method to investigate, as a way to further increase P recycling while preventing it from mixing with contaminants in the sewers.
Redesigning the food system to reduce food waste and losses, and to increase P use efficiency across the production chain, together with a switch to more plant-based diets could further increase the potential of P excretions used as fertilizers.
More precise assessments of the losses occurring in sewage networks – notably through more systematic direct monitoring of sewers – would be necessary to reduce the uncertainties on the P mass balance.
Declarations
Funding
Thomas Stack was awarded a PhD scholarship from Ecole Polytechnique and Ecole des Ponts Paristech.
This project has received funding from the European Union’s Horizon Europe research and innovation programme under the Marie Skłodowska-Curie grant agreement No 101063239 awarded to Tanguy Fardet.
The OCAPI Program is funded by several public institutions. The funders had no role in study design, data collection and analysis, decision to publish, or preparation of the manuscript.
Competing interests
None
Availability of data and code
The results are part of a larger project assessing nutrient flows in the French sanitation system; the code to generate, cleanup, and analyze the data is available at: https://codeberg.org/TStarck/N_P_France_sanitation_system.
In addition to the code, the original datasets sources before cleanup, the consolidated data used for the analysis, the graphs and more information are available on Zenodo: https://doi.org/10.5281/zenodo.7990171.
Authors’ contributions
Thomas Starck: Data curation, Formal analysis, Methodology, Funding acquisition, Software, Visualization, Writing - Original draft
Tanguy Fardet: Data curation, Validation, Visualization, Funding acquisition, Writing - Original draft, Writing - review & editing
Fabien Esculier: Supervision, Project administration, Methodology, Writing - review & editing
Appendix A Appendices
A.1 Equations and workflow of the P mass balance
A.2 Detailed methodology and discussion of uncertainties
When temporal series were available (P flows in WWTP, sludge production and destination, industries discharge…), we estimated the relative uncertainties over the period 2015-2020 with the maximum absolute difference to the mean. For the punctual parameters (P budget of individual autonomous systems, P excretions) we estimated the uncertainties by qualitative comparison to literature values.
A.2.1 Uncertainty on phosphorus flows in and out of wastewater treatment plants
In the WWTP dataset used to quantify the P flows, the largest stations, with a capacity 100,000 population equivalent, are monitored at least every week, and often every day [34]. They represent 50% of the total French WWTP capacity. Stations from 10,000 to 100,000 population equivalent, representing 30% of the total capacity, are monitored at least every month. So, for 80% of the national flow, there is a high certainty about the yearly-averaged reported value. After data cleaning, the year-to-year flows variability at the basin scale is small and on the order of 10% maximum (Figure A.2 and Figure A.3). We use this value as the uncertainty for incoming and outgoing flows.
A.2.2 Uncertainty on sludge production and destination
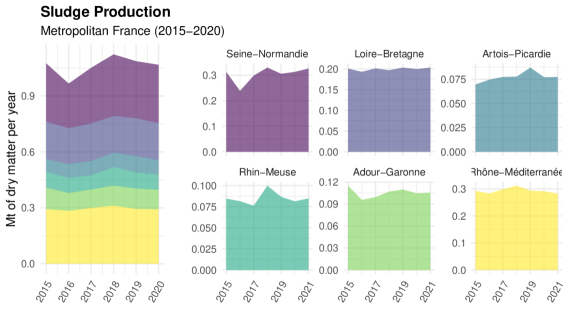
The sum of reported destination quantities does not align with production quantities (only 0.9 to 0.95 Mt reported between 2018 and 2021). Therefore, we extrapolate the total amount of sludge for each destination from the total production quantities, , considering that the fate of missing sludge in the destination report follows the same distribution as the reported quantities.
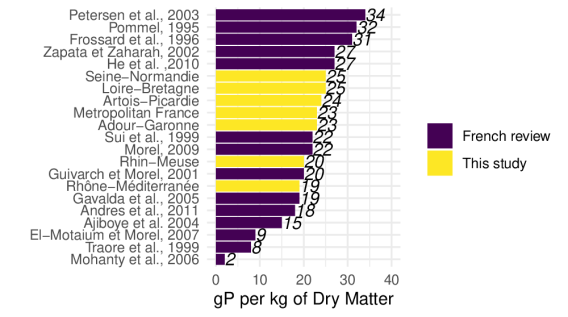
Following data correction, year-to-year variability in sludge production at the basin level is minimal, with a maximum fluctuation of 10% (Figure A.4). Similarly, the relative sludge destination has remained relatively stable since 2018 (45% of sludge composted and 30% directly spread on crops at the national scale) (Figure A.5). We use a 10% uncertainty for sludge destinations. Our results are comforter by the comparison to a French collective scientific expertise review on sludge composition ([21]. Combining our results on sludge production quantities and WWTP removal efficiencies allows us to estimate the mean P sludge content, for each basin and at the national scale. Our values are within the median range of the ones reported by [21] (Figure A.6)
A.2.3 Large industries discharge in sewers
We chose to use the non-open GEREP database rather than the open-access “Géorisques” database [53] that also reports industrial facilities discharging pollutants as part of the European Pollutant Release and Transfer Register (E-PRTR). “Géorisques” data only reports facilities discharging more than 5 tons of P per year [33]. On the other hand, the non-public GEREP data also includes facilities below this 5-ton threshold. While “Géorisques” only reports a few dozen facilities discharging P in sewers, the GEREP database reports about 1,200 facilities, which almost doubles the P flow. There is little year-to-year variability over the 2015–2020 period after data correction (Figure A.7). We estimate the uncertainty to be around 10%.
A.2.4 Population and tourism
Between 2015 and 2020, the French population grew from 64.3 to 65.3 million residents. In the analysis, we used the population census from 2018, with 64.8 million residents, hence a maximum error smaller than 1%. Every year, France receives around 70 million tourists who come to visit the country, staying on average a week. To this, one can add around 10 million tourists who transit through France from non-neighboring countries and around 100 million more who cross the border from a neighboring country, in both cases for a single day. Taken together, this represents an increase of around 9 days’ worth of excretion per capita over a year. Overall, it means that we may underestimate the national input to the sewers from excreta by 3 %. However French people also travel abroad which leads to decreased local excretions. Precise assessment in the case of Paris Megacity [15] shows that outward and inward flows of people closely match. At the French level, the level of uncertainty of national inputs to the sanitation systems due to tourism is probably well below 3%.
A.2.5 Uncertainty regarding P excretion
We assumed no P accumulation in adults’ bodies and that all ingested P is excreted. The same approximation was made for children and adolescents, for whom [29] report a mean storage rate of 6% between 2 and 17 years, which is consistent with medical data on bone growth [2] and P intake from food. This is equivalent to 1.3% over an 80-year lifespan, consistent with estimates from [44] and higher than the 0.5% from [36]. Based on a mean body P content of 500–650 gP and daily intakes of 1–2 gPcapday-1 [1, 14] over 80 years, the resulting annual population-level storage rate is also 1–2%. Our estimate for the average P excretion at the national scale (0.44 kgPcapyear-1, or 1.2 gPcapday-1) is consistent with the lower range of our literature review on P excretions (Figure A.8). This is exactly the same value as for Belgium in [39], also based on food intakes survey. Our method overlooks P body storage, which tends to overestimate P excretions by a few percent, but the food intake survey may underestimate actual P intakes, which could explain the average intake it is slightly lower than values reported in the medical literature that directly measure P in the excreta. Furthermore, standard deviation in medical data was high (typically 30% of the mean) so 0.44 kgPcapyear-1 is compatible with these values. We consider an uncertainty of 30%.
A.2.6 Fate of P from Individual Autonomous Systems
According to the Ministry of Ecological Transition, 15 to 20% of the population is not connected to sewers and relies on Independent Wastewater Treatment [53]. Compared to the Eurostat figure of 18%, which we use for metropolitan France [19], we estimate the uncertainty of this parameter to be around 15%. We did not consider excretions in diapers for newborns and elderly people, which do not enter sewers nor individual autonomous systems but are directly landfilled or incinerated. For the P mass balance of individual autonomous systems, LCA analyses of a septic tank + sand filter from [42] and a French report [5] were used. The P destination for [42] is 83% in underground and 17% in sludge, while the French report gives slightly different figures of 90% and 10% respectively. We assume an intermediate repartition of 85%–15% and that all sludge is directed to wastewater treatment plants. This is the figure used in [35], but lower than the 25% used by [46]. The uncertainty associated with the different P destinations is estimated to give a range of 10% to 20% for sludge and 80% to 90% for underground (relative uncertainty of 50% and 6%)
A.2.7 Phosphorus loss before WWTPs
Part of the P entering sewers does not reach the WWTP entrance, due to combined sewers overflows and sewers leaks. Data are non-existent concerning this latter point, and very scarce for overflows. Adour–Garonne and Loire–Bretagne basins report data from a sample of the largest WWTPs, where direct discharges represent respectively 7% and 15% of the flows finally entering the WWTPs. For these 2 basins, we extrapolate the loss rate of this WWTPs sample to the whole basin. No data was available for the Rhône–Méditerranée basin, so we used the loss rate of the other French Southern basin, Adour–Garonne. For the 3 other basins (Rhin–Meuse, Seine–Normandie and Artois–Picardie), we use estimates from their respective experts’ assessment Etat des lieux (respectively 20%, 10% and 20%). The resulting national mean (weighted by incoming P flow quantity) is 10%. Based on the diverging values among the different basins, we estimate the actual value to be between 5% and 20%. For comparison, [44] estimate wastewater losses due to leakage before reaching WWTPs in the EU15 at 5–10%.
A.3 P footprint and contribution to self-sufficiency calculation
We compute the P footprint of food supply (before food waste) for the world and France based on [51] and [15]. P footprint, P food supply and P use efficiency (PUE) are linked by the relation , being the phosphorus contained in the food supply. P footprint and PUE are computed for: animal+vegetable products together; animal products alone; vegetable products alone. All figures and calculation are detailed in our Supplementary Spreadsheet.
In [51], we use the numbers in pages 23–24 and particularly Figure 3.2. We use reported animal and vegetable . We combine this with reported PUE for crops and animal products to compute the P footprints. For animal products, the reported only concerns the efficiency starting at animal ingestion. To account for the full-chain animal product PUE (), we have to also consider the PUE of crops fed to animals. We consider 2 extreme cases. First, if all forage given to animals come from unfertilized grasslands, then forage PUE is 100% and . The other case is if all feed given to animals comes from crops. Then . This gives a range of animal P footprint, computed by , with the real footprint being somewhere in between these extremes.
For [15], we use numbers in Figure 5 (for PUE, supply and footprint) and Figure 8 (for P ingestion/excretion). The previous issue of feed PUE given to animal does not apply here since it is already computed. The animal P footprint, supply and PUE relate to the combination of “intensive livestock farming” and “mixed crop and livestock farming”. Contrary to [51], P footprint numbers are already reported, and we compute PUE from . The case of “other territories”, where only P supply is reported but not P footprint, is extrapolated from the PUE of their particular farming system (crop farming; mixed crop and livestock farming; intensive livestock farming).
In both cases, the total P food supply is the sum of P content of animal food and vegetable food, but also fish and additives. This P supply is different than the P ingested/excreted, because food waste happens in between.
The potential share of supply that could be covered by recycling P in excretions (not prioritizing vegetable products) is obtained through . For the case when P excretions are prioritize to vegetable products, we first compute . If this quantity exceeds the P supply of vegetable products, we allocate the surplus to animal products , such that:
where if and otherwise.
A.4 Data sources used for the P budget.
| data | sources | |
|---|---|---|
| P discharge to sewers from each individual industry | GEREP database, nonpublic extension of the open access georisque French database, part of the European Pollutant Release and Transfer Register (E-PRTR). | |
| Population by age and sex for each French city. | [27] | |
| Sludge production and destination for each WWTP. | [41] | |
| P flows in and out of each individual wastewater treatment plants, for each water agency basin |
Artois Picardie basin
years 1992-2021 |
Artois-Picardie agency website |
|
Rhin-Meuse basin,
years 1996-2021 |
Rhin-Meuse agency website | |
|
Seine-Normandie basin
years 2015, 2016, 2018, 2020 |
Etat des lieux (status reports) data, only for 2015, 2016, 2018, 2020 communicated through mail. We also have the SIAAP data over 2007-2021, consisting of the 6 largest WWTP representing 50% of the basin nutrient flows. | |
|
Loire-Bretagne basin
years 2005-2021 |
Communicated by email, publicly shareable | |
|
Adour-Garonne basin
years 2000-2020 |
Adour-Garonne agency website, link for nutrient flows discharge and link for WWTP description | |
|
Rhône-Méditerranée basin
years 2009-2020 |
Rhône-Méditerranée agency website | |
References
- [1] Peter Baccini and Paul H Brunner “Metabolism of the anthroposphere: analysis, evaluation, design” mit Press, 2012
- [2] Shona Bass et al. “The differing tempo of growth in bone size, mass, and density in girls is region-specific” publisher: American Society for Clinical Investigation PMID: 10491415 In The Journal of Clinical Investigation 104.6, 1999, pp. 795–804 DOI: 10.1172/JCI7060
- [3] Gilles Billen, Julia Le Noë and Josette Garnier “Two contrasted future scenarios for the French agro-food system” publisher: Elsevier In Science of the Total Environment 637, 2018, pp. 695–705
- [4] Fayçal Bouraoui, Bruna Grizzetti and Alberto Aloe “Nutrient discharge from rivers to seas for year 2000” European Commission, 2017
- [5] Laureline Catel, Catherine Boutin, Vivien Dubois and Philippe Roux “Inventaires du cycle de vie de filières de traitement des eaux usées en assainissement non collectif”, 2017
- [6] Daniel L Childers, Jessica Corman, Mark Edwards and James J Elser “Sustainability challenges of phosphorus and food: solutions from closing the human phosphorus cycle” publisher: American Institute of Biological Sciences Circulation, AIBS, 1313 Dolley … In Bioscience 61.2, 2011, pp. 117–124
- [7] James Cooper and Cynthia Carliell-Marquet “A substance flow analysis of phosphorus in the UK food production and consumption system” In Resources, Conservation and Recycling 74, 2013, pp. 82–100 DOI: 10.1016/j.resconrec.2013.03.001
- [8] Dana Cordell, Jan-Olof Drangert and Stuart White “The story of phosphorus: Global food security and food for thought” In Global Environmental Change 19.2, Traditional Peoples and Climate Change, 2009, pp. 292–305 DOI: 10.1016/j.gloenvcha.2008.10.009
- [9] data.gouv “Données de consommations et habitudes alimentaires de l’étude INCA 3 - data.gouv.fr” [Online; accessed 2023-04-12] In data.gouv, 2021 URL: https://www.data.gouv.fr/fr/datasets/donnees-de-consommations-et-habitudes-alimentaires-de-letude-inca-3/
- [10] G Degrémont “Mémento technique de l’eau, Tome 1, 10éme édition, Edit” In Tec et doc, 2005, pp. 3–38
- [11] Carine Dubuisson et al. “The Third French Individual and National Food Consumption (INCA3) Survey 2014–2015: method, design and participation rate in the framework of a European harmonization process” In Public health nutrition 22.4 Cambridge University Press, 2019, pp. 584–600
- [12] L. Egle et al. “The Austrian P budget as a basis for resource optimization” In Resources, Conservation and Recycling 83, 2014, pp. 152–162 DOI: 10.1016/j.resconrec.2013.09.009
- [13] James Elser and Elena Bennett “A broken biogeochemical cycle” number: 7367 publisher: Nature Publishing Group In Nature 478.7367, 2011, pp. 29–31 DOI: 10.1038/478029a
- [14] Jim Elser and Phil Haygarth “Phosphorus: Past and Future” Google-Books-ID: SIoIEAAAQBAJ Oxford University Press, 2020
- [15] Fabien Esculier et al. “The biogeochemical imprint of human metabolism in Paris Megacity: A regionalized analysis of a water-agro-food system” In Journal of Hydrology 573, 2019, pp. 1028–1045 DOI: 10.1016/j.jhydrol.2018.02.043
- [16] EU “Council Directive 91/271/EEC of 21 May 1991 concerning urban waste-water treatment”, 1991 URL: http://data.europa.eu/eli/dir/1991/271/oj/eng
- [17] EU “Regulation (EU) No 259/2012 of the European Parliament and of the Council of 14 March 2012 amending Regulation (EC) No 648/2004 as regards the use of phosphates and other phosphorus compounds in consumer laundry detergents and consumer automatic dishwasher detergentsText with EEA relevance”, 2012 URL: https://eur-lex.europa.eu/LexUriServ/LexUriServ.do?uri=OJ:L:2012:094:0016:0021:en:PDF
- [18] Eurostat “Sewage sludge production and disposal” [Online; accessed 2023-04-12], 2022 URL: https://ec.europa.eu/eurostat/databrowser/view/ENV_WW_SPD/default/table?lang=en&category=env.env_wat.env_nwat
- [19] Eurostat “Population connected to urban wastewater collecting and treatment systems, by treatment level” [Online; accessed 2023-04-12] In Eurostat, 2023 URL: https://ec.europa.eu/eurostat/databrowser/view/ten00020/default/line?lang=en
- [20] FAOSTAT “Fertilizers by Nutrient” [Online; accessed 2023-04-19], 2023 URL: https://www.fao.org/faostat/en/#data/RFN
- [21] J Fuchs et al. “Chapitre 3. Effets agronomiques attendus de l’épandage des MAFOR sur les écosystèmes agricoles et forestiers, Rapport final de l’ESCo “Matières fertilisantes d’origine résiduaire.”” INRA-CNRS-Irstea, 2014
- [22] Jenny Gustavsson, Christel Cederberg and Ulf Sonesson “Global food losses and food waste: extent, causes and prevention ; study conducted for the International Congress Save Food! at Interpack 2011, [16 - 17 May], Düsseldorf, Germany” Rome: FoodAgriculture Organization of the United Nations, 2011
- [23] Uwe Häußermann et al. “National nitrogen budget for Germany” publisher: IOP Publishing In Environmental Research Communications 3.9, 2021, pp. 095004 DOI: 10.1088/2515-7620/ac23e5
- [24] J Hellstrand “Nitrogen flow in Scania: substance flow analysis on a regional level”, 2015
- [25] Hana Hudcová, Jan Vymazal and Miloš Rozkošnỳ “Present restrictions of sewage sludge application in agriculture within the European Union” In Soil and Water Research 14.2, 2019, pp. 104–120
- [26] N.. Hutchings et al. “A nitrogen budget for Denmark; developments between 1990 and 2010, and prospects for the future” publisher: IOP Publishing In Environmental Research Letters 9.11, 2014, pp. 115012 DOI: 10.1088/1748-9326/9/11/115012
- [27] INSEE “Population selon le sexe et l’âge quinquennal de 1968 à 2019 (1990 à 2019 pour les DOM) — Insee” [Online; accessed 2023-04-12] In INSEE, 2022 URL: https://www.insee.fr/fr/statistiques/1893204
- [28] Michael Jedelhauser and Claudia R. Binder “Losses and efficiencies of phosphorus on a national level – A comparison of European substance flow analyses” In Resources, Conservation and Recycling 105, Losses and Efficiencies in Phosphorus Management, 2015, pp. 294–310 DOI: 10.1016/j.resconrec.2015.09.021
- [29] Håkan Jönsson, Anna Richert Stintzing, Björn Vinnerås and Eva Salomon “Guidelines on the use of urine and faeces in crop production” EcoSanRes Programme, 2004
- [30] Lucrezia Lamastra, Nicoleta Alina Suciu and Marco Trevisan “Sewage sludge for sustainable agriculture: contaminants’ contents and potential use as fertilizer” In Chemical and Biological Technologies in Agriculture 5.1 Springer, 2018, pp. 1–6
- [31] Tove Larsen, Kai Udert and Judit Lienert “Source separation and decentralization for wastewater management” Iwa Publishing, 2013
- [32] J Le Noë et al. “The phosphorus legacy offers opportunities for agro-ecological transition (France 1850–2075)” In Environmental Research Letters 15.6, 2020, pp. 064022 DOI: 10.1088/1748-9326/ab82cc
- [33] Légifrance “Décret n°2007-491 du 29 mars 2007 relatif à l’interdiction des phosphates dans certains détergents.” [Online; accessed 2023-05-31] In 2007-491, 2007 URL: https://www.legifrance.gouv.fr/loda/id/JORFTEXT000000278656
- [34] Légifrance “Arrêté du 21 juillet 2015 relatif aux systèmes d’assainissement collectif et aux installations d’assainissement non collectif, à l’exception des installations d’assainissement non collectif recevant une charge brute de pollution organique inférieure ou égale à 1,2 kg/j de DBO5 - Légifrance” [Online; accessed 2023-04-12], 2015 URL: https://www.legifrance.gouv.fr/loda/id/JORFTEXT000031052756/2021-01-06/
- [35] Kersti Linderholm, Jan Erik Mattsson and Anne-Marie Tillman “Phosphorus Flows to and from Swedish Agriculture and Food Chain” In AMBIO 41.8, 2012, pp. 883–893 DOI: 10.1007/s13280-012-0294-1
- [36] Yi Liu, Gara Villalba, Robert U. Ayres and Hans Schroder “Global Phosphorus Flows and Environmental Impacts from a Consumption Perspective” In Journal of Industrial Ecology 12.2, 2008, pp. 229–247 DOI: 10.1111/j.1530-9290.2008.00025.x
- [37] Kazuyo Matsubae-Yokoyama, Hironari Kubo, Kenichi Nakajima and Tetsuya Nagasaka “A material flow analysis of phosphorus in Japan: The iron and steel industry as a major phosphorus source” In Journal of Industrial Ecology 13.5 Wiley Online Library, 2009, pp. 687–705
- [38] James R Mihelcic, Lauren M Fry and Ryan Shaw “Global potential of phosphorus recovery from human urine and feces” In Chemosphere 84.6 Elsevier, 2011, pp. 832–839
- [39] Anastasia Papangelou and Erik Mathijs “Assessing agro-food system circularity using nutrient flows and budgets” In Journal of Environmental Management 288, 2021, pp. 112383 DOI: 10.1016/j.jenvman.2021.112383
- [40] Alberto Pivato et al. “The Role Of The Precautionary Principle In The Agricultural Reuse Of Sewage Sludge From Urban Wastewater Treatment Plants” In Detritus 19 CISA Publisher, 2022, pp. V–XII
- [41] Portail Assainissement Collectif [Online; accessed 2023-04-12], 2023 URL: https://www.assainissement.developpement-durable.gouv.fr/PortailAC/
- [42] Eva Risch, Catherine Boutin and Philippe Roux “Applying life cycle assessment to assess the environmental performance of decentralised versus centralised wastewater systems” In Water Research 196, 2021, pp. 116991 DOI: 10.1016/j.watres.2021.116991
- [43] Bruce E Rittmann “The energy issue in urban water management” In Source Separation and Decentralization for Wastewater Management 13 IWA Publishing London, 2013
- [44] Roland W Scholz et al. “Sustainable phosphorus management: a transdisciplinary challenge” In Sustainable phosphorus management: A global transdisciplinary roadmap Springer, 2014, pp. 1–128
- [45] Roland W. Scholz and Friedrich-Wilhelm Wellmer “Approaching a dynamic view on the availability of mineral resources: What we may learn from the case of phosphorus?” In Global Environmental Change 23.1, 2013, pp. 11–27 DOI: 10.1016/j.gloenvcha.2012.10.013
- [46] Kalimuthu Senthilkumar et al. “Phosphorus recovery and recycling from waste: An appraisal based on a French case study” In Resources, Conservation and Recycling 87, 2014, pp. 97–108 DOI: 10.1016/j.resconrec.2014.03.005
- [47] Andrew Sharpley et al. “Phosphorus legacy: overcoming the effects of past management practices to mitigate future water quality impairment” In Journal of environmental quality 42.5 Wiley Online Library, 2013, pp. 1308–1326
- [48] Vaclav Smil “Phosphorus in the environment: natural flows and human interferences” In Annual review of energy and the environment 25.1 Annual Reviews 4139 El Camino Way, PO Box 10139 Palo Alto, USA, 2000, pp. 53–88
- [49] A.. Smit, J.. Middelkoop, W. Dijk and H. Reuler “A substance flow analysis of phosphorus in the food production, processing and consumption system of the Netherlands” In Nutrient Cycling in Agroecosystems 103.1, 2015, pp. 1–13 DOI: 10.1007/s10705-015-9709-2
- [50] Will Steffen et al. “Planetary boundaries: Guiding human development on a changing planet” publisher: American Association for the Advancement of Science section: Research Article PMID: 25592418 In Science 347.6223, 2015 DOI: 10.1126/science.1259855
- [51] Mark A Sutton et al. “Our nutrient world. The challenge to produce more food & energy with less pollution”, 2013
- [52] George Tchobanoglus, Franklin Burton and H David Stensel “Wastewater engineering: treatment and reuse” In American Water Works Association. Journal 95.5 American Water Works Association, 2003, pp. 201
- [53] Ministère Transition Ecologique “Installations industrielles rejetant des polluants” In Géorisques, 2023 URL: https://www.georisques.gouv.fr/installations-industrielles-rejetant-des-polluants
- [54] G Van Drecht, AF Bouwman, J Harrison and JM Knoop “Global nitrogen and phosphate in urban wastewater for the period 1970 to 2050” In Global Biogeochemical Cycles 23.4 Wiley Online Library, 2009
- [55] Olga Vigiak et al. “Domestic waste emissions to European waters in the 2010s” number: 1 publisher: Nature Publishing Group In Scientific Data 7.1, 2020, pp. 33 DOI: 10.1038/s41597-020-0367-0
- [56] Ingrid Watson et al. “Mining and concentration: what mining to what costs and benefits?” In Sustainable phosphorus management: a global transdisciplinary roadmap Springer, 2014, pp. 153–182
- [57] Stuart White and Dana Cordell “Peak phosphorus: the sequel to peak oil” In Global Phosphorus Research Initiative http://www. phosphorusfuturesnet Accessed April, 2010