Exploring Users’ Pointing Performance on Virtual and Physical Large Curved Displays
Abstract.
Large curved displays have emerged as a powerful platform for collaboration, data visualization, and entertainment. These displays provide highly immersive experiences, a wider field of view, and higher satisfaction levels. Yet, large curved displays are not commonly available due to their high costs. With the recent advancement of Head Mounted Displays (HMDs), large curved displays can be simulated in Virtual Reality (VR) with minimal cost and space requirements. However, to consider the virtual display as an alternative to the physical display, it is necessary to uncover user performance differences (e.g., pointing speed and accuracy) between these two platforms. In this paper, we explored users’ pointing performance on both physical and virtual large curved displays. Specifically, with two studies, we investigate users’ performance between the two platforms for standard pointing factors such as target width, target amplitude as well as users’ position relative to the screen. Results from user studies reveal no significant difference in pointing performance between the two platforms when users are located at the same position relative to the screen. In addition, we observe users’ pointing performance improves when they are located at the center of a semi-circular display compared to off-centered positions. We conclude by outlining design implications for pointing on large curved virtual displays. These findings show that large curved virtual displays are a viable alternative to physical displays for pointing tasks.
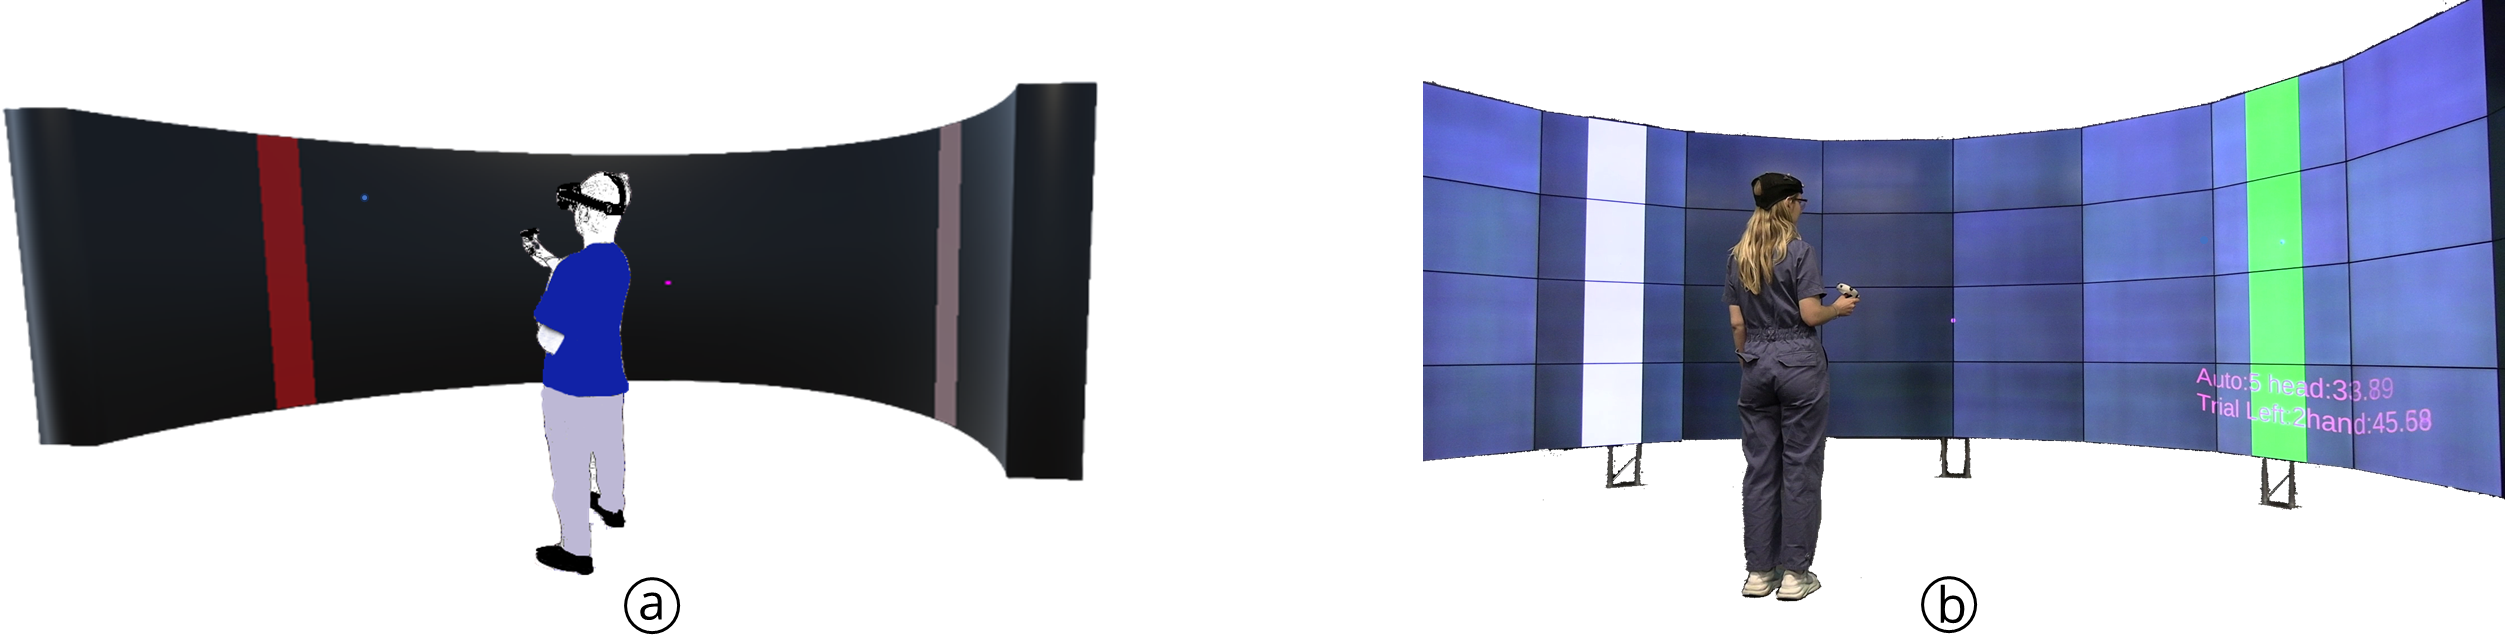
Pointing on large curved displays: a participant using (a) virtual and (b) physical displays.
1. Introduction
Large displays are widely used for collaboration (Andrews et al., 2011; Card et al., 1999; Baudisch et al., 2001; Cockburn et al., 2009), data visualization (Novak et al., 2008; Satyanarayan et al., 2013; Birnholtz et al., 2007), and entertainment (Ardito et al., 2015; Scheible and Ojala, 2005; Khoo et al., 2008). However, hardware and space requirements make it challenging to use large displays (Cavallo et al., 2019). Due to the advancement in Virtual Reality (VR) technology, large virtual screens are emerging as a viable option to replace physical ones (Ullah et al., 2023). Although large physical displays have been explored extensively in previous research, little work has been done on virtual displays - especially comparing users’ performance between these two platforms to explore the potential of using large virtual displays as an alternative to physical displays.
Numerous studies have used Fitts law to explore users’ pointing performance on large physical displays (Tao et al., 2021; Babic et al., 2018; Lischke et al., 2016; Liu et al., 2015; Haque et al., 2015; Siddhpuria et al., 2018; Nancel et al., 2013). These studies revealed that users’ performance is significantly affected by target width and amplitude (i.e., the distance between two targets in meters or pixels). Previous studies (Shi et al., 2022; Hansen et al., 2018; Batmaz et al., 2022, 2019; Chowdhury et al., 2022) on target selection in VR evaluated pointing performance using Fitts law in a 3D environment rendered via an HMD. These studies in VR also concluded that user performance primarily depends on target widths and amplitudes. In addition, researchers showed that large curved displays offer many advantages over flat displays, as the user can be situated at a uniform distance from the center, offering higher levels of immersion and satisfaction (Kyung and Park, 2021; Shupp et al., 2009). However, there is limited research on pointing performance on curved displays as previous work on curved displays focuses mainly on viewing tasks (Ahn et al., 2014; Shupp et al., 2009; Urakami et al., 2021) and reading tasks (Kyung and Park, 2021; Park et al., 2017). Due to the gap in previous literature on pointing performance on virtual and large curved displays, it is critical to compare users’ pointing performance between virtual and physical large curved displays.
We hypothesize that large virtual displays can be an alternative to physical displays for investigating users’ pointing-related performance. To validate our hypothesis, we conduct user studies comparing users’ performance between the two platforms - large physical and virtual curved displays with the same experimental setup. We consider standard pointing factors (e.g., target width and movement amplitude) and curve-related user position (e.g., off-centered position and distance from the center of the screen). We performed two user studies. In the first study, we explore the difference between the physical and the virtual platform on users’ pointing performance with 1D Fitts’ law tasks when users are positioned at the center of the semi-circular screen. Study results revealed no difference in pointing performance between virtual and physical display platforms when users are positioned at the center of the semi-circular displays. In our second study, we explore the effect of users’ location (relative to the center of the display) on pointing performance for both platforms. Results showed no difference in users’ pointing performance for the virtual and physical platforms for the investigated locations. Additionally, we observed that interaction distance (i.e., distance from the screen center to the user) significantly affects user performance. Pointing from the center of the semi-circular display leads to higher performance and user preference.
The contributions of the paper are:
-
•
A comparison between two curved display platforms, i.e., virtual and physical, on users pointing performance with Fitts law
-
•
An exploration of the effect of user position relative to display on their pointing performance with virtual and physical displays
2. Background and Related Work
We review works on users’ interaction with physical and virtual environments and pointing tasks in physical and virtual displays.
2.1. Comparison between Physical and Virtual Environments
Sharples et al. (Sharples et al., 2008) examined the VR-induced sickness symptoms for four different displays (i.e., head-mounted display: Virtual research V8 resolution 1920480 FOV 60∘, desktop (17” 800600), projection screen, and curved large displays [screen resolution 10243556]) when viewing and interacting in a Virtual Factory (i.e., a program where the participants were instructed on potential health and safety hazards). They found significantly higher levels of nausea, oculomotor, and disorientation in the Head-mounted display compared to the large curved display. Deisinger et al.(Deisinger et al., 1997) asked participants to identify boxes in their correct order on three different display platforms: HMD (240120), desktop screen (21” 12801024), and wall-sized projection-based large display (144” 4096768). They found that participants experienced higher levels of immersion on the large wall-sized display compared to the two other platforms. Although previous literature found differences in subjective feedback between physical and virtual displays, they did not explore pointing performance (e.g., completion time and error rate for pointing) between virtual and physical displays.
2.2. Large Physical Displays: Flat and Curved
Prior work largely focused on pointing performance on large flat displays. Very few dealt with pointing performance on curved displays. However, we found no research on pointing performance on virtual curved displays. Research on large curved displays can be divided into two major streams: their comparison to flat displays, and the exploration of curved display specificities.
Flat vs. Curved Large Displays: Shupp et al. (Shupp et al., 2009) compared flat and curved large displays for search, comparison, and overview tasks. They found that curved displays outperformed flat displays for search (i.e., locating a symbol on a map) and comparison (finding differences between 2D graphs ) tasks. The study also shows that objects on a curved display are uniformly located from the user and thus are free from user bias (different regions do not suffer from performance issues). However, users have to rotate their heads more while using curved displays compared to flat ones. Flat displays had an advantage over curved displays on overview tasks (i.e., state observations from visual data). However, users have to walk more for flat displays and suffer from region bias, where the task performance degrades as the objects are placed further away from the display center. A recent study by Liu et al. (Liu et al., 2020) ran user studies to compare three different layouts: flat, quarter-circular, semi-circular, and full-circular for data visualization in a VR environment based on chart comparison and finding max value tasks. They found that for lower scale (12 visualizations placed on 3 4 grid) format, the flat layout outperformed curved layouts. However, when they increased the scale (36 visualizations placed on 12 3 grid) they found no difference in performance between the flat and curved layout. For the large-scale layout, the users preferred the half-circle layout compared to the flat layout as they had to walk less. Overall, studies have shown several advantages of curved displays with semi-circular layout over traditional flat ones; hence, we use a curved display in our study.
Curved Displays Specificities: As compared to flat displays, curved displays have been shown to be more ergonomically suited for visual tasks for large-scale displays. Kyung and Park (Kyung and Park, 2021) compared 33” and 50” displays with different display curvatures (i.e., 40 cm, 60 cm, 120 cm radius and Flat) and recommended using a 60 cm radius for both displays for visual search tasks. Their result also found that with increasing size, curved displays do not face performance issues, unlike Flat displays. Nevertheless, there is an absence of research examining pointing tasks on large curved displays. The sole study focusing on pointing on curved displays was a Fitts law study by Hennecke et al.(Hennecke et al., 2013), who used a 42” curved display to examine 2D pointing tasks using two inputs: direct touch and mouse inputs. For both types of inputs, Fitts law was applicable. Due to technical limitations, the display was created from two HD projector outputs, and thus, was neither totally curved nor large in scale. Ens et al. (Ens et al., 2016) conducted a Fitts law study in which the targets were arranged in a circular orientation using projectors in a CAVE environment. They considered five different field-of-view conditions (ranging from 8∘ to 128∘). They observed improved pointing performance with a higher field-of-view; however, the improvement was not statistically significant. In conclusion, pointing performance on large curved screens has been largely ignored. Moreover, the research on curved displays did not take into consideration aspects specific to curved displays, such as interaction distance relative to display curvature. Particularly, pointing performance research has only been done for physical displays, thus there is scope for advancement in this field with virtual ones.
2.3. Target Pointing in HMD
Researchers examined Fitts law tasks in virtual head-mounted displays. Shi et al. (Shi et al., 2022) conducted a Fitts law study in a head-mounted VR setting to determine the impact of various factors (i.e., input type, target width, and user distance) on pointing performance. Their research revealed that the input mode, user distance, and target width all had significant effects on the movement time. Hansen et al. (Hansen et al., 2018) compared three input types (i.e., eye gaze, head pointing, and mouse ) for pointing in HMDs and found that the mouse had the highest performance while head pointing was better than eye gaze. Contrarily, eye gaze had a significantly lower subjective workload than head pointing. Batmaz et al. (Batmaz et al., 2019) compared pointing performance in augmented and virtual reality using a pointing task that involved moving a spatially-tracked wand between front-back (i.e., viewing direction movement) and left-right(i.e., lateral movement). They demonstrated that movement direction (i.e., lateral and viewing direction) and target width had significant effects on movement time. Furthermore, for the viewing direction movements, front-to-back movements were significantly faster than back-to-front movements. Contrary to the previous claims (Jones et al., 2008; Naceri et al., 2010), they found no significant differences in pointing performance between augmented reality and virtual reality headsets. The aforementioned studies have only considered pointing performance in an HMD-based 3D environment. However, researchers are yet to explore pointing performance on virtual interactable displays inside VR.
2.4. Summary
In contrast to the significant research (Kopper et al., 2010; Shoemaker et al., 2012; Janzen et al., 2016) done on pointing performances on large flat displays, users pointing performance on large curved displays has remained unexplored. However, for large displays, curved screens were preferred over flat displays (Liu et al., 2020; Kyung and Park, 2021). Investigating and designing varying display properties of large curved displays are subject to hardware and financial restrictions(Cavallo et al., 2019). Consequently, there is a lack of research that has investigated curve display-specific features, such as display curvature and off-centered interaction position (Ullah et al., 2023; Shupp et al., 2009; Kyung and Park, 2021). Virtual displays inside VR has the potential to substitute physical displays in a variety of scenarios (e.g., for visual analytic tasks (Ullah et al., 2023; Cao et al., 2019)). Yet, prior work on HMDs primarily focused on pointing in 3D spaces with targets on flat planes, overlooking virtual displays and targets on curved surfaces. These curved surfaces can potentially impact users’ pointing performance due to the characteristics of targets projected onto them, including factors such as users’ position. Therefore, a comparative study of user performance between physical and virtual curved displays is necessary to find the nuances between them.
3. Design Space for Curved Displays Exploration
We begin with a summary of the different variations of Fitts law investigated in prior work. We next discuss the factors that we consider in a Fitts law to compare pointing performances between physical and virtual large curved displays. Standard pointing variables (such as target size and amplitude) and curved-display specific variables (such as relative user position relative to display curvature) are both taken into account for our study.
3.1. Fitts Law
Fitts law is widely used for modelling pointing performance of 1D (Fitts, 1954; Card et al., 1978; Jota et al., 2010), 2D (MacKenzie, 1992; HOFFMANN, 1995; Hoffmann et al., 2011; Nancel et al., 2013) and 3D (Triantafyllidis and Li, 2021; Hoffmann et al., 2011; Kulik et al., 2020; Leusmann and Angerbauer, 2021) pointing tasks. The Shannon-Fitts formula proposed by MacKenzie (MacKenzie, 1992) is the most popular version of Fitts law (ISO 9241-9 (ISO, 2000)) for pointing tasks. In their work, they calculated the movement time for pointing via:
| (1) |
Where A denotes the target amplitude, W denotes the target width, and a and b are empirically calculated constants. The Index of Difficulty (ID) of a pointing task is equal to which represents the task difficulty, i.e., the higher the ID value, the more challenging the task. Various works have proposed Fitts law extensions by incorporating target height (Crossman, 1956; MacKenzie and Buxton, 1992; Hoffmann and Sheikh, 1994), angular measurements (Kondraske, 1994; Kopper et al., 2010; Kopper, 2011), and depth factors (Grossman and Balakrishnan, 2004). In these extensions, the original Fitts law was modified to include additional variables or adapt the law to specific contexts or devices.
3.2. Target Width, Target Amplitude, and IDs
Prior work on target pointing mostly considered linear (e.g., in meters or pixels) target width and amplitude (Fitts, 1992; Tao et al., 2021; Babic et al., 2018; Lischke et al., 2016; Liu et al., 2015; Haque et al., 2015; Siddhpuria et al., 2018; Nancel et al., 2013). Later, angular measurements (i.e., in degrees or radians) of target width and amplitude were explored for pointing tasks (Kondraske, 1994; Kopper et al., 2010; Kopper, 2011). As we are using one display curvature for both displays, the Index of difficulty () values for both angular and linear measurements will be the same. Therefore, we consider linear measurements for amplitude and width in our study. ISO 9241-9 (ISO, 2000) standard recommends covering a wide range of IDs (between 2 bits and 8 bits) (Soukoreff and MacKenzie, 2004; ISO, 2000) to represent the task difficulty - which we used in our studies.
3.3. Interaction Distance
Interaction distance is defined by the distance from the user perpendicular to the center of the display (Tao et al., 2021; Janzen et al., 2016; Shi et al., 2022). Prior works reveal that users’ pointing performance varies based on the interaction distance (Kovacs et al., 2008; Hourcade and Bullock-Rest, 2012; Kopper et al., 2010). Researchers showed that it has a direct correlation with the target width in the display space, which further impacts the target selection time (Kovacs et al., 2008; Hourcade and Bullock-Rest, 2012): the further away from a display, the smaller the target. To alleviate this confounding effect, Kopper et al. (Kopper et al., 2010) integrated the interaction distance by using angular measurements of target width and amplitude. They showed that angular measures are more accurate for distal pointing tasks than linear measures. Tao et al. (Tao et al., 2021) evaluated the effects of interaction distance on pointing performance where they found that linear interaction distance significantly affected pointing accuracy and workload. However, using angular measures is not yet commonly accepted in the HCI community (Shoemaker et al., 2012; Janzen et al., 2016).
3.4. Position Relative to Screen Center
To our knowledge, no prior work considered pointing at objects while varying user positions from the display center for curved displays. With flat displays, the user’s position impacts the viewing angle, which impacts performances (Hourcade and Bullock-Rest, 2012). With curved displays, the position might have an impact on performance. For instance, users at the center of the curve interact with a display uniformly distributed around them. However, users with an offset from the center interact with screen portions closer than others. In addition, limited FoV on HMDs might create differences in users’ pointing performance based on users’ position and head rotation to find the targets in virtual displays. Thus, it warrants further investigation into how users’ pointing performance varies between physical and virtual displays based on their position relative to the screen.
3.5. Exploration Summary
Based on the design space, we selected the following four critical factors to explore - target width, target amplitude, interaction distance, and user offset. We report on two user studies:
-
•
Study 1: Compare physical and virtual large display from the center of the displays: The first study aims to compare users’ pointing performances between a physical and a virtual large curved display with a Fitts law. More specifically, we investigate whether there are differences in users’ pointing performance between the two platforms, especially when users are located at the center of the curved displays.
-
•
Study 2: Explore Physical and Virtual Curved displays from different User distance/offset: In our second study, we explore the effect of factors specific to curved displays on users’ pointing performance. More specifically, we investigated how users’ pointing performance varies in two platforms when they are placed with an offset from the center of the screen.
3.6. Goals and Hypotheses
Our study has two main goals (G1, and G2):
-
•
G1) To identify differences in pointing performance between virtual and physical large displays from the center of the displays.
-
•
G2) To evaluate the effect of user positions relative to the display on their pointing performance on both large curved display platforms.
To reach these goals, we formulate the following Hypotheses:
-
•
H1) There are no differences in users’ pointing performance irrespective of display type i.e., physical or virtual from the center of the display. Indeed, as a human motor behavior model, Fitts Law should not reveal any discrepancies if users’ location is the same across conditions (G1).
-
•
H2) Users pointing performance between two platforms will not vary even if users are positioned with an offset from the center of the display (G2).
-
•
H3) Pointing from farther away from the screen will lead to faster selections as increasing interaction distance allows the users to acquire targets with lower hand and head movements (G2).
4. User Study 1
We first conduct a 1D Fitts law study comparing users pointing performance between virtual and physical displays. Prior work mostly explored users’ interaction with curved displays while positioning them at the center of the display (Shupp et al., 2009; Liu et al., 2020). Therefore, in this study, we positioned users at the center of the semi-circular large curved display (in our case, 3.27m from the display).
4.1. Apparatus
We used a physical curved display manufactured by Mechdyne (Mechdyne, 2023) for this study, The display has forty 46-inch LED monitors arranged in 4 rows 10 columns (a portion of the display shown in Figure 1b). The 3D horizontally curved display has a 180∘ viewing angle. The height of the display is 3 meters, and the radius of the semi-circular display is 3.27 meters. The display is powered by CPU: Intel Xeon W-3224 8C/16T (3.5-4.6 GHz), RAM: 192GB DDR4 2933MHz (12 16GB), GPU: 4 X Nvidia RTX6000 with 1 x Nvidia Quadro SYNC II. We used Unity 3D (technologies, 2023) to write applications to run on large physical displays. To create the virtual display, we used the Oculus Quest 2 (Meta, 2023), which has a horizontal field-of-view of 90∘. We created a semi-circular display in the Unity game environment (technologies, 2023) with the same display height and radius as the physical setup. To ensure a fair pointing comparison between the two platforms, we used the right controller of the Quest 2 with the raycasting technique (Takashina et al., 2021) for pointing at the displays. We placed markers on the Quest 2 controller and tracked its position and orientation using an 8-camera Optitrack System (OptiTrack, 2023). The Firebase Realtime Database (Google, 2023) was used for logging data during the study. Figure1 a and b show both displays.
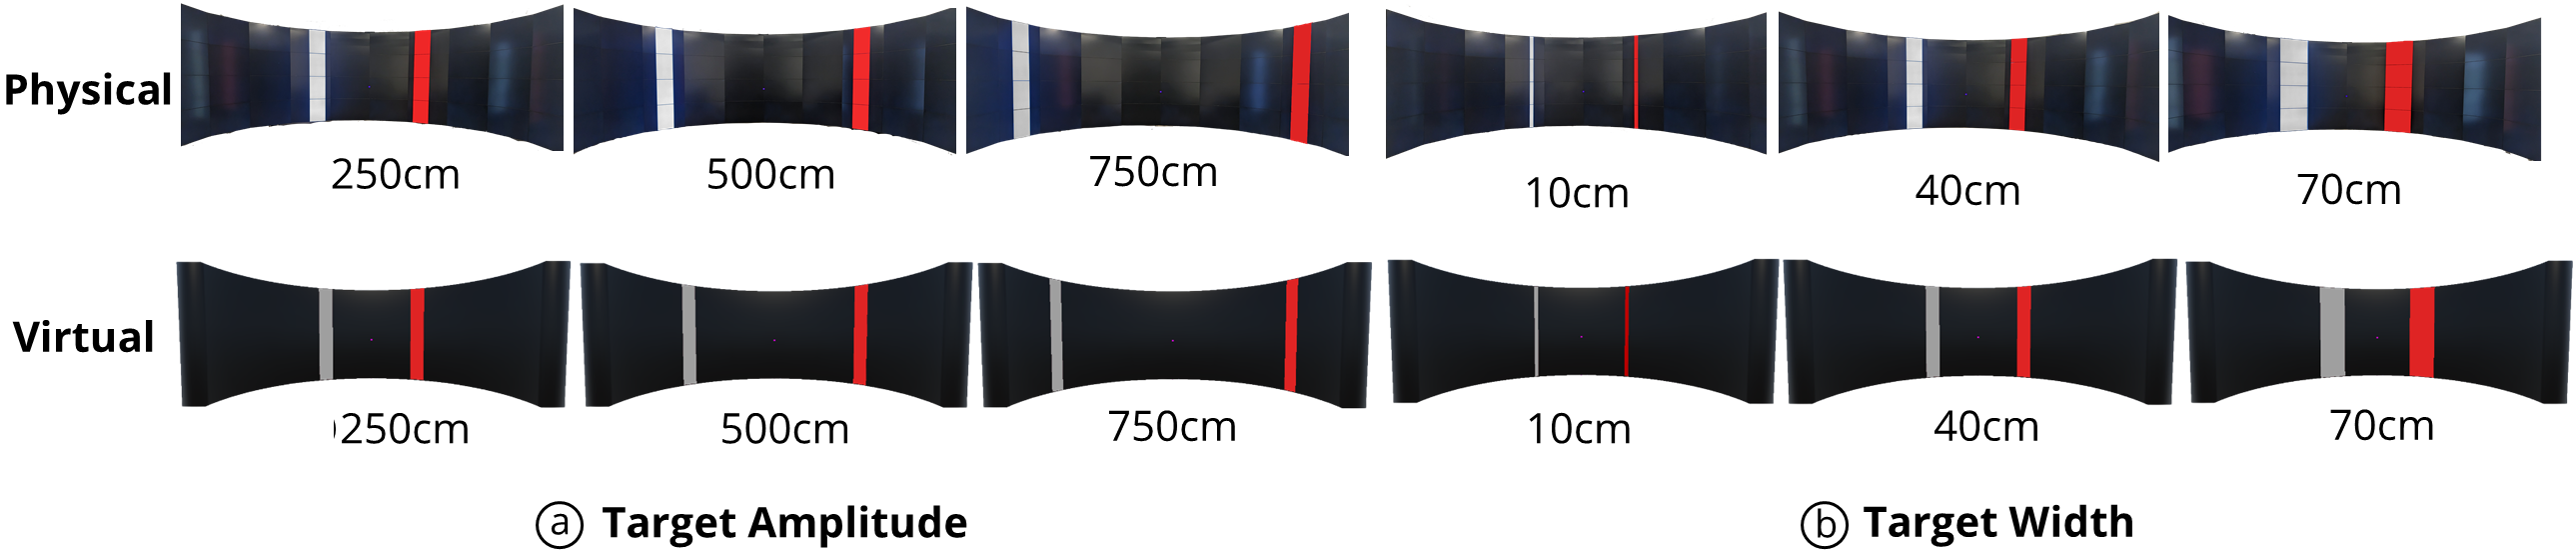
4.2. Target Amplitude and Target Width
We consider linear measurements (Shoemaker et al., 2012; Janzen et al., 2016; MacKenzie and Buxton, 1992; Soukoreff and MacKenzie, 2004) for our study. We used 250cm, 500cm, and 750cm for the amplitude of our study (Figure 2a). For the target width, we used 10cm, 40cm, and 70cm (Figure 2b). Once they were projected on the physical display, we ensured the linear measurements were correct with a measuring tape. In addition, for the VR application, the target widths and amplitudes were measured from the Unity application. Further, we used the pass-through feature of the Oculus Quest 2 (Meta, 2023) to overlay the virtual targets on top of the physical targets to avoid any discrepancies between the two platforms. For instance, the 10cm target width and 250cm target amplitude on the virtual display perfectly overlapped with the 10cm target width and 250cm target amplitude on the physical display ensuring a 1-to-1 mapping.
4.3. Participants
We recruited 14 participants (7 male, 7 female; avg. 25.43, SD. 4.72) from our university. We used online advertisements as well as paper posters to recruit participants. All of the participants were right-handed. Participants had an average of 1.56 years (SD. 2.02) of experience with VR HMDs and 0.14 years (SD. 0.36) of experience with large-scale displays. Note that participants reported the time of their first-hand experience when using VR to reflect their year of experience. Consequently, the reported values indicated a higher average experience with VR HMDs than with large-curved displays, as VR technology is more prevalent in the market. Only two individuals had no prior experience using a VR headset, while another two had experience with a large-scale display. Each participant received $15 as compensation for participating in the study.
4.4. Procedure
A 1D Fitts law task was used in this study, where users were presented with two vertical bars representing targets. For both platforms, the participants were placed at the center of the semi-circular display, which is 3.27m away from the screen. Participants had to use the Quest 2 controller that was tracked with an OptiTrack System. From the controller, a ray was extended in the orthogonal direction to point at the large curved display (Figure 1a and b). Participants could move the ray in any direction by changing the orientation of the controller. Once they moved the ray tip (i.e., the end point of the ray) on top of the targets, they could press the trigger button to confirm a selection. Initially, we placed a ‘start’ target at the center of the display for both conditions. Once participants selected the ‘start’ target, it disappeared and the application showed two new targets: colored red and grey. They were to select the red-colored target, which switches between the two targets after each selection. A selection outside the target region was logged as an error and re-queued among the unfinished trials. Audio feedback was used to indicate successful and unsuccessful selections.
4.5. Design
This study used a within-subject design with three independent variables: Platform (physical and virtual), Target Amplitude (250cm, 500cm, and 750cm) and Target Width (10cm, 40cm, and 70cm). The Target Width Target Amplitude combinations lead to Index of Difficulty (ID) ranging from 2.85 to 6.25 bits. We applied a Latin square design to counterbalance the presentation order of the Platform among the participants. Each Index of Difficulty (ID) was repeated 10 times. Target Amplitude and Target Width were randomly presented to participants. Each participant had to perform a total of 180 selections (2 Platform 3 Target Amplitude 3 Target Width 10 repetitions). Additionally, the participants were allowed to take breaks to reduce fatigue. Note that participants were provided with 45 practice trials before beginning with a Platform to help familiarize themselves with the study conditions (i.e., 9 Index of Difficulty (ID) 5 repetitions). Each participant took approximately 40 minutes to complete the experiment.
4.6. Measurements
Before starting the user study, participants were asked to provide demographic information. We recorded the movement time and error rate for each trial. The movement time for a trial starts immediately after the previous selection and ends when participants press the trigger button to select the current target. A trial is marked as an error if participants make a selection outside the target boundary. We used the NASA-TLX (Ames, 2023) to collect participants’ perceived workload for the two platforms (physical and virtual).
5. Study 1 Results
In both studies, Shapiro-Wilk tests were used to verify the normal distribution of the data. We analyze movement time and error with RM-ANOVA, and pairwise comparisons with Bonferroni corrections. In case of sphericity violation, we report Greenhouse-Geisser corrected p-values and degrees of freedom.
5.1. Movement Time
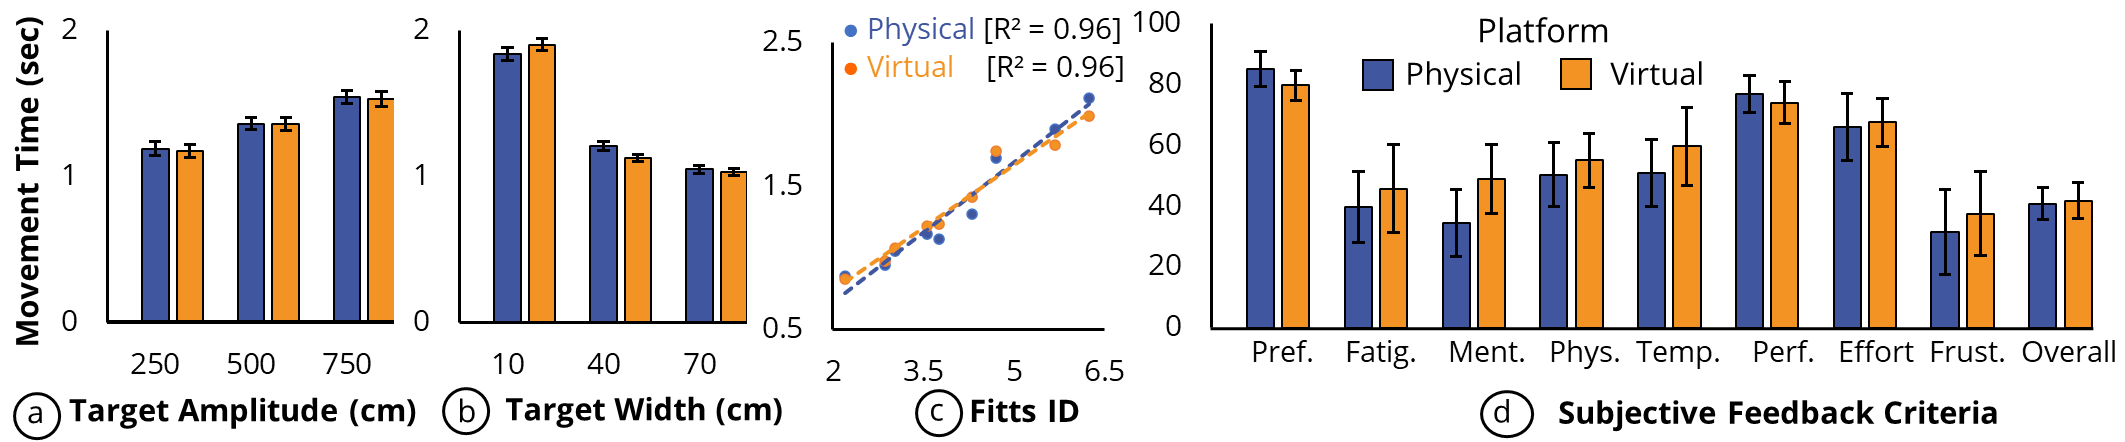
Figure 3a-b show the Movement Time (MT) for different Target Amplitude and Target Width across two platforms, respectively. In terms of movement time, we did not find any significant effect of Platform (, ) on movement time. The mean movement time is 1.37s CI: [1.35, 1.38] for the Virtual and 1.36s CI: [1.34, 1.38] for the Physical Platform. As expected, we found significant main effects for the independent variables Target Amplitude (, , =0.89), and Target Width (, , =0.96). For Target Amplitude, the mean movement time is 1.18s (95% confidence interval, CI: [1.08, 1.28]) for 250cm, 1.36s (CI: [1.27, 1.45]) for 500cm, and 1.54s (CI: [1.44, 1.64]) for 750cm (Figure 3a). Post-hoc pairwise comparisons revealed that lower Target Amplitude had significantly faster movement time than higher Target Amplitude (, all ). For Target Width, the mean movement time is 1.87s (CI: [1.79, 1.95]) for 10cm, 1.17s (CI: [1.12, 1.22]) for 40cm, 1.04s (CI: [0.99, 1.09]) for 70cm (Figure 3b). Post-hoc comparison indicated that larger targets had significantly lower movement time than smaller targets (, all ). We found significant interactions of Target Amplitude Target Width (, , ) and Platform Target Width (, , ).
5.2. Error Rate
There is no significant difference in the error rate for the different display Platform (, ). We found significant main effect of Target Width (, , =0.30) and Target Amplitude (, , =0.09) on error rate. The smallest target (Target Width=10cm, mean: 12.93%, CI: [9.70, 16.15]) has a significantly higher error rate () than the other two Target Widths (40cm, mean: 3.21%, CI: [1.65, 4.76]; 70cm, mean: 2.18%, CI: [0.72, 3.64]). Targets placed the farthest apart (Target Amplitude=750, mean: 8.86%, CI: [6.04, 11.68]) have significantly higher error rates () than targets which are closest to the display center (Target Amplitude=250, mean: 3.17%, CI: [1.23, 5.11]). Pairwise comparisons reveal no other significant differences.
5.3. Fitts Law Regression Lines
Figure 3c shows the regression analysis that represents an average movement time for display Platforms based on Index of Difficulty (ID). Overall, we found that the Fitts law model (Eq. 1) provides a fit of for both the physical and the virtual displays. This also indicates that the model could accurately explain about 96% of the data points for both display platforms. Interestingly, predictions have the same slope (b 0.3), indicating that both physical () and virtual () displays exhibit the same tolerance to an increase in task difficulty. Note that physical and virtual platforms lead to very similar regression lines - which indicates that pointing tasks across these display platforms indeed lead to similar movement times. This further establishes that both display platforms have similar pointing performance.
5.4. Preference Score
We used NASA TLX (Ames, 2023) questionnaire to collect users’ feedback on their effort, mental demand, physical demand, temporal demand, performance, frustration and overall task load for Platform. We also used another questionnaire to collect participants’ general preference and fatigue for the physical and the virtual displays (Figure 3d). A Friedman test showed that pointing on the virtual display (mean: 48.92, CI: [37.60, 60.26]) is significantly () more mentally demanding than pointing on the physical one (mean: 34.28, CI: [23.26, 45.31]). There were no other statistically significant differences observed for other data.
5.5. Discussion Study 1
5.5.1. Pointing performance comparison
H1: no difference in pointing performance for the physical and virtual display is valid. We found no significant difference between the two displays based on users pointing performance. This similarity in performance holds across different target widths and amplitudes. The Fitts law further validates no difference in users’ pointing performance between the two display platforms.
5.5.2. Subjective feedback comparison
The subjective feedback between the virtual and physical display showed no significant difference except for the mental demand criteria. Three participants mentioned that tasks were more cognitively demanding with VR compared to the larger display due to the limited Field-of-View (FOV) available in VR. This restriction in FOV posed greater mental demand for visually searching the targets. Based on participant feedback, we attribute this increased mental demand to the field-of-view difference between the two platforms.
6. User Study 2
In our first study, we did not find any difference in users’ pointing performance between the two platforms (virtual and physical) when participants are located at the center of the semi-circular screen. Researchers found that users’ pointing performance changes depending on users’ position relative to the screen (Tao et al., 2021; Hourcade and Bullock-Rest, 2012; Kovacs et al., 2008). Thus, our second study examines how users’ pointing performance is affected based on their relative position from the center of virtual and physical displays.
6.1. Interaction Distance & User Offset
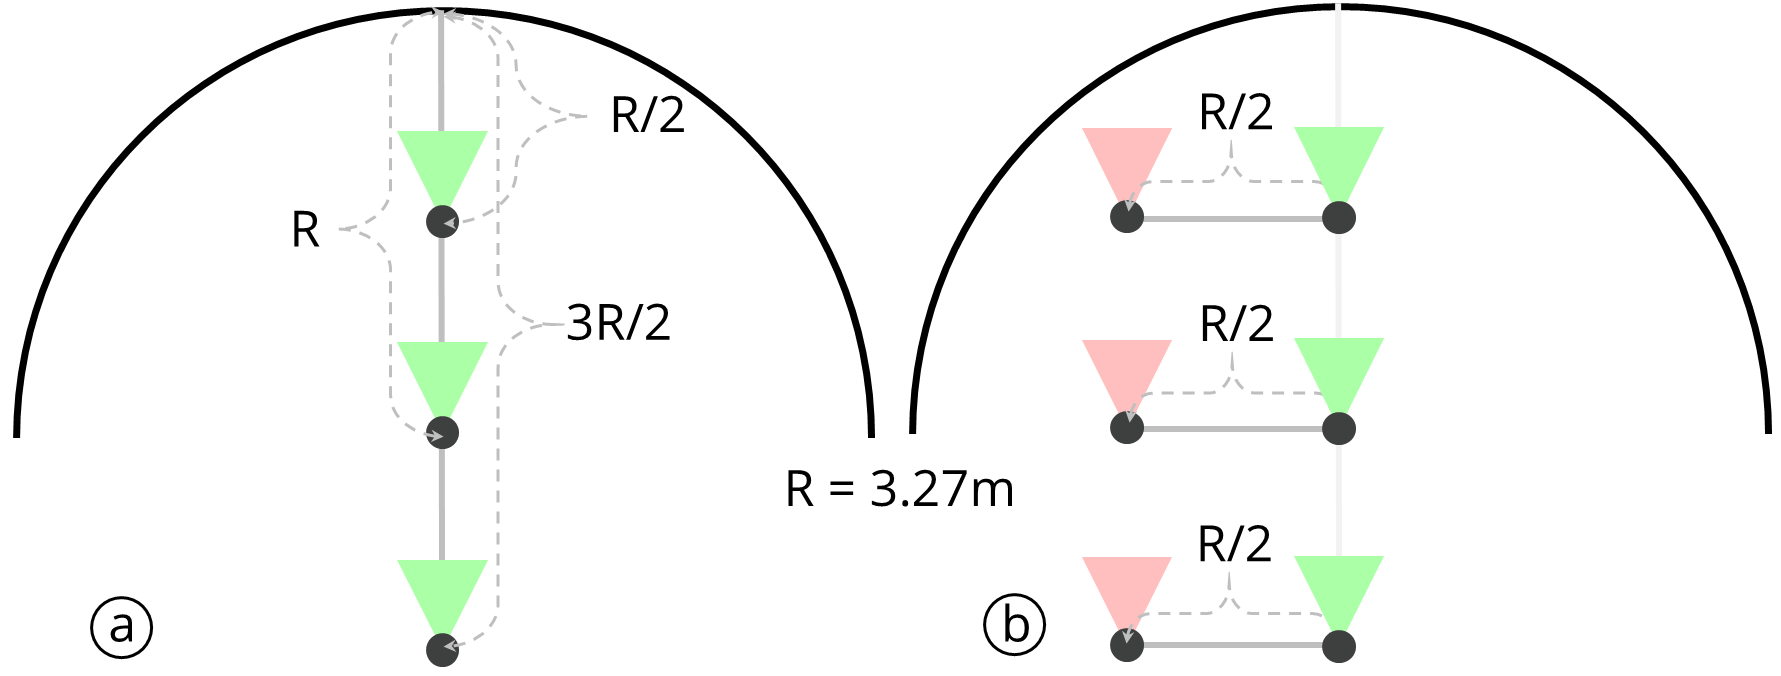
We used the Interaction distance as the distance from the screen on the main axis (i.e., the axis that connects the middle of the screen and the center of the semi-circular display). In addition, we represent User offset as the lateral displacement of the users’ position from the ‘main axis’. Figure 4 shows the interaction distance and user offset from the center of the display. While research has shown that interaction distance affects pointing performance for smaller displays (Tao et al., 2021; Hourcade and Bullock-Rest, 2012; Kovacs et al., 2008), we are unaware of any prior work that specifically addressed both of these relationships for wall-sized curved screens. In addition, the offset is directly associated with the users’ Field of View (FoV) in the VR condition. Therefore, it is critical to investigate the impact of the offset and compare it to the physical display condition to reveal the potential effects and implications of the FoV on user performance.
We investigate three interaction distances which are denoted by R, R, and R (shown in Figure 4a) where R is the radius of the semi-circular display (3.27m). To illustrate, for our 3270R display - which has a radius of 3.27m, we consider the interaction distance R which is 3.27m, R, which is 1.64m, and R which is 4.91m from the center of the screen. A user can be positioned to the left or right of the main axis (i.e., User Offset). Since target positions on axis-symmetric directions have no difference in pointing performance (Zhang et al., 2012; Radwin et al., 1990), we place users on the left side of the main axis. We consider two offsets: No-offset (i.e., no lateral displacement from the main axis) and Left-Offset (c of R from the main axis) as shown in Figure 4b. Thus, the Interaction Distance and the User Offset result in 6 different positions for a display. We did this as in a real scenario interactive items and UI elements would be displayed on the curved display irrespective of the user’s position in the VR environment. We keep the target widths and amplitude uniform across trials, with linear measurements from the curve center to maintain consistency between different user positions.
6.2. Participants and Apparatus
We recruited 12 participants (6 male and 6 female; mean age 25.92 years, SD. 4.91) from the local University. The participants’ average prior experience was 1.57 years (SD. 2.19) for VR HMDs and 0.18 years (SD. 0.37) for the large-scale display. Only three people had no experience using a VR headset, while only four had prior experience using large-scale displays. Each participant received a $15 honorarium for their participation.
The participants had to interact will the same physical display (3270R large 3D curved large display) and virtual display (3270R rendered using the Oculus Quest 2). To keep the input device consistent for both platforms, we used the same Quest 2 right controller with the raycasting technique for pointing at the displays. The movement of the controller was tracked with the Optitrack System (OptiTrack, 2023). A modified version of the two separate unity applications from Study 1 was used for logging user data.
6.3. Procedure & Design
In Study 2, the participants had to perform the identical 1D pointing task as in Study 1, but from varying user positions (marked with ground indications illustrated in Figure 4). We had five independent factors: Platform (physical and virtual), Amplitude (250cm, 500cm, and 750cm), Width (10cm and 70cm), User Offset (No-offset, Left), and the Interaction Distance (R, R, and R). However, we were more interested in exploring the effect of the Platform, User Offset, and Interaction Distance - which we considered as our primary factors for study 2. Based on the Amplitude Width configuration, we had six IDs (ranging between 2.85 to 6.25 bits). The participants had to repeat each task condition 10 times, resulting in 720 trials (2 Platform 2 User Offset 3 Interaction Distance 3 Amplitude 2 Width 10 repetitions). Trials are divided into 12 blocks where each block contains 10 repetitions of 6 IDs for each Platform, Interaction Distance, and User Offset. After completing each block, the participants rested for two minutes to lower fatigue and motion sickness. We applied a Latin square to counterbalance the order of presentation of the platform while randomizing other factors (i.e., Interaction Distance, User Offset, and IDs). Participants provided subjective feedback on each combination during the break. Note that participants had to complete at least five practice trials before starting a new block. The total time of the study was around 80 minutes per participant.
6.4. Measurement
For each trial, movement time and error rate were recorded as we did in Study 1. Demographic information and subjective feedback for each user offset and interaction distance condition was also collected.
7. Study 2 Results
We analyze movement time and error data with repeated measures ANOVA on log-transformed data and post-hoc pairwise comparisons with Bonferroni corrections. In sphericity violation, we report Greenhouse-Geisser corrected p-values and degrees of freedom.
7.1. Movement Time
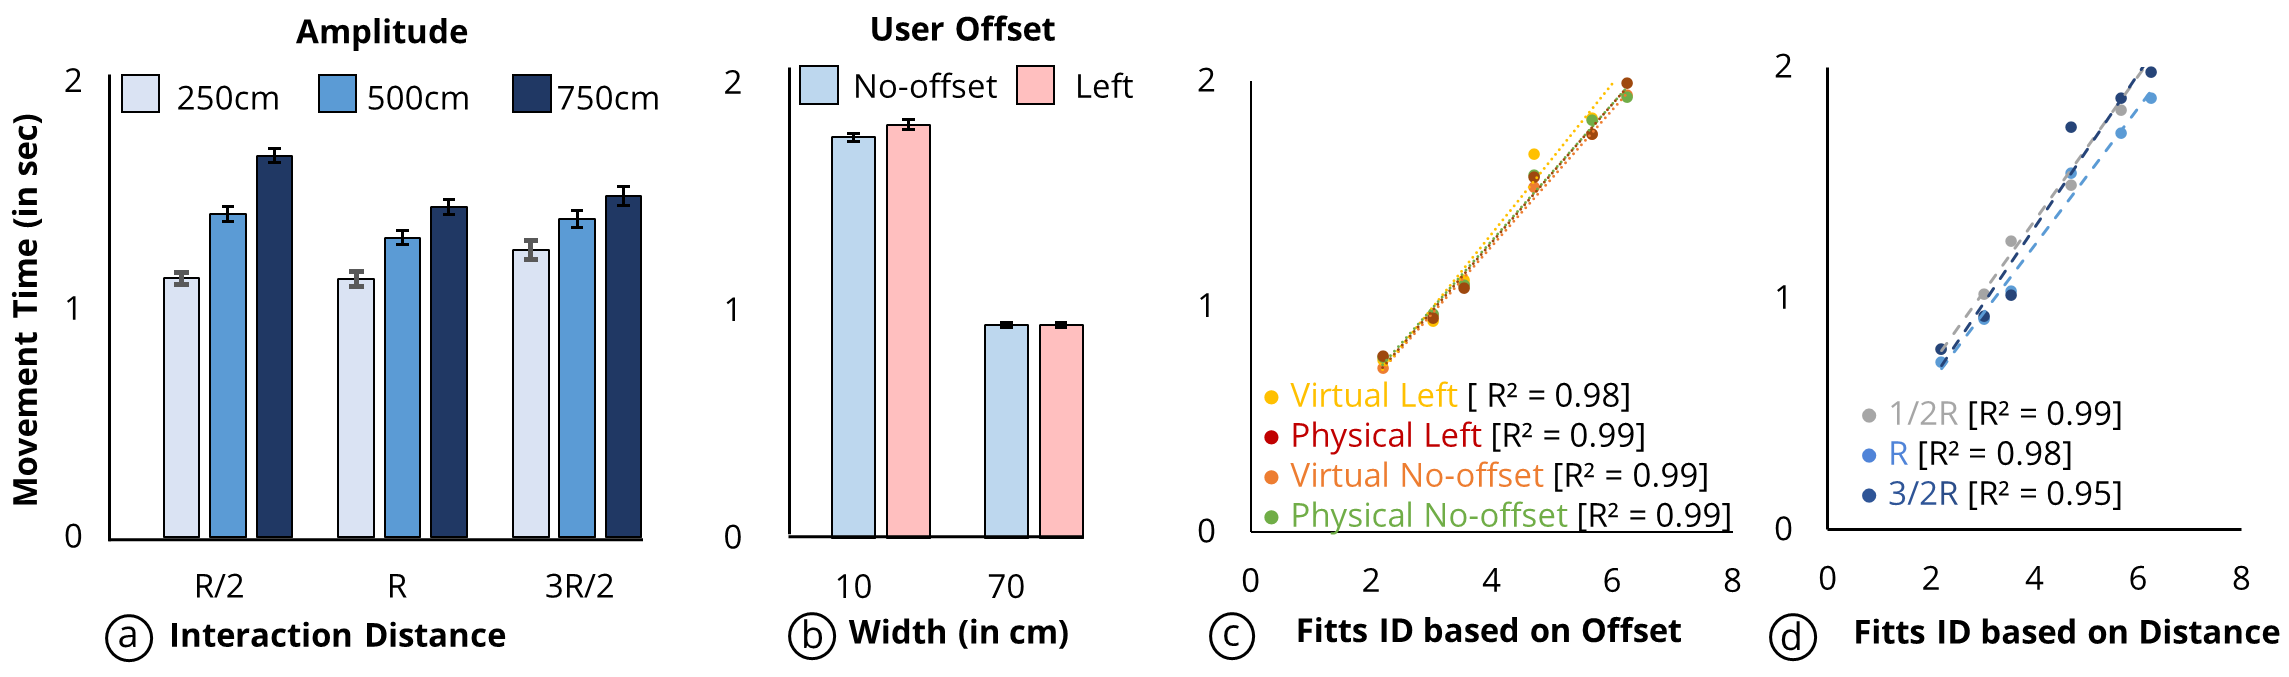
Interestingly, we again did not find any significant effect for Platform on movement time (, ). The mean movement time is 1.37s CI: [1.35, 1.38] for the Virtual and 1.36s CI: [1.34, 1.38] for the Physical Platform. We found significant main effects of Amplitude (, , = 0.98), Width (, , = 0.96), and Interaction Distance (, , = 0.51) on movement time. The mean movement time is 1.41s (CI: [1.35, 1.47]) for Interaction Distance R, 1.3s (CI: [1.24, 1.35]) for R and 1.38s (CI: [1.32, 1.45]) for R. Post-hoc pairwise comparisons reveal that pointing at R is significantly faster than R and R (all ). In addition, pointing at R is significantly faster than R (). For User Offset (, ), we did not observe any significant effect on movement time.
We found a significant effect of Amplitude Interaction Distance (, , ) in Figure 5a, Width Interaction Distance (, , ) and Width Offset (, , ) 5b. While offset did not have an effect on selection times, for Width = 10cm, the selection was faster in the center (mean: 1.76s, CI:[1.72,1.8]) compared to the left position (mean: 1.82s, CI:[1.77,1.87]) (p¡0.05).
7.2. Error Rate
We found no significant difference in the error rate for the different display Platforms (, ). There is a significant difference in the error rate for Interaction Distance (, , ) and Width (, ). For Interaction Distance, we found an error rate of (6.15%, CI: [5.07, 7.24]) for R, (8.33%, CI: [7.10, 9.56]) for the R, and (10.30%, CI: [8.97, 11.64]) for R.. Post-hoc tests with Bonferroni corrections on Interaction Distance showed that R has significantly lower rates (all ) than R, and R. For Offset, we found an error rate of 7.74% (CI: [6.75, 8.73) for the no-offset position and 8.88% (CI: [7.84, 9.91]) for the Left offset position. However, there is no significant difference in the error rate for Offset (, ) and Amplitude (, ). Overall, we found Study 2 has higher average error rates as only two target widths were considered - leading to an increased proportion of 10cm Widths.
7.3. Fitts’ Law Regression Line
The Fitts law equation for Offset and Platforms were for Virtual Left, for Physical Left, for Virtual No-offset, and . There was so little difference in movement time for Offset and Platform that the regression lines were indistinguishable ( (all ), Figure 5c). Additionally, we observe that the Fitts law could accurately model pointing performance( Figure) with varying Interaction Distance (regression equations were R: ; R: ; R: ). We observed that pointing from interaction distance R is faster than the other two positions (3/2R and 1/2R) in Figure 5d.
7.4. Preference Scores
We collected users’ feedback on the seven Nasa TLX criteria along with their preference, fatigue for Interaction Distance and Offset.
For Offset, Friedman tests show that participants preferred being in the No-offset position compared to the Left for all of the 9 criteria [Preference (), Fatigue (), Mental Demand (), Physical Demand (), Temporal Demand (), Performance (), Effort (), Frustration (), and Overall task load ()].
For Interaction Distance, Friedman tests reveal significant differences for all subjective criteria [Preference (), Fatigue (), Mental Demand (), Physical Demand () , Temporal Demand (), Performance (), Effort (), Frustration (), and Overall task load ()]. Post-hoc pairwise comparisons (Bonferroni: -levels from 0.05 to 0.016) reveal that R and R are significantly preferred than R for all subjective criteria (all p¡0.01).
7.5. Discussion Study 2
7.5.1. Comparison between the two platforms
From the results, we found that our H2 is valid. Similar to study 1, we again found no significant effect of Platform on movement time and error rate. This further highlights that there is no difference in pointing performance between virtual and physical displays when using the same setup, e.g., the same controller, screen size, target amplitudes, and widths. Participants even commented ”Pointing at targets were identical in both platforms.” [P7, male, 21 years old]
7.5.2. Effect of Interaction Distance
Our H3 on improved pointing performance as the user is placed farther away is not valid. We observed a relationship between interaction distance and movement time: users perform faster selection when the interaction distance is equal to the radius of the curved display. As seen from Figure 5a, being close to the display (interaction distance R/2) is beneficial for small amplitude movements (A=250cm) whereas being farther away (interaction distance 3R/2) is advantageous for large amplitude movements (A=750cm). However, this relationship needs further investigation with more interaction distances to confirm the scalability of our findings. Eight out of twelve participants complained that being positioned closer to the display required constantly rotating their head and body to perform the reciprocal selection task for movements with large amplitudes (such as A=500cm and A=750cm). This observation aligns with findings from prior research (Liu et al., 2022). Furthermore, they commented being farther away increased the pointer speed, which was difficult to control for targets close to the display center (A=250cm). Being at the center (interaction distance R) optimizes the trade-off between interaction distance vs. performance and allows the users to make faster selections than the other interaction distance (i.e., R/2 and 3R/2). When the user is located at the center of the display, the distance from the user to the target is the same irrespective of the target amplitude. These allow the users to select the targets faster using muscle memory (as suggested by participants. One participant commented ”Selection from the center is better than the left as we can leverage muscle memory to select targets that are symmetrically positioned on the left and right sides.” [P11, male. 23 years old]. This observation is consistent with previous work which suggests that being positioned at the center of the semi-circular displays improves user task performance (Park et al., 2019). Two participants preferred to be positioned farther away as this allowed them to select targets with minimal body movement and ensured a larger portion of the display was visible to the user for both platforms. One participant stated ”Being located farther away provided higher peripheral vision, especially for the virtual display as it had a low FOV.” [P12, female, 24 years old]. Thus, we observed better subjective ratings for R and 3R/2.
7.5.3. Effect of User Offset
We found no difference in pointing performance between the center (i.e., no-offset) and the left Figure 5b. However, the subjective ratings show that no-offset positions are significantly better than the left positions. As the users performed reciprocal selection tasks, targets were equally spaced around the display center. Thus, they preferred to be in the center rather than the left position. Comments from the participants revealed that users have to do different hand movements to select targets when positioned towards the left. In contrast, users can select the targets doing uniform hand movements when positioned in the center, allowing them to easily select targets using muscle memory. However, this feeling is due to the abstract reciprocal task. It might be different if - imagine - we propose an asymmetric task (e.g., text on the last, large pics on the right)
8. Design Implications, Limitations and Future work
We interpret key insights from our results and discuss the design implications for large curved displays. We highlight limitations observed during the studies and discuss potential future works.
8.1. Design Implications
8.1.1. Virtual prototypes for Physical Interactive surfaces
Results from the Studies indicate no significant difference in pointing performance between the two platforms. Study 2 further shows that similar performance is maintained for near or farther user placements and off-centered positions. Based on these results, we suggest that virtual displays in VR can be a potential alternative for evaluating pointing-related tasks for large physical displays - reducing development time and cost of researching on large curved displays.
8.1.2. Interaction Distance
Study 2 results show that pointing from the center of the curved displays (interaction distance R and no-offset) is more favorable to the users. Furthermore, interaction distance R/2 is better for the targets closer to the display center (lower amplitude), whereas interaction distance 3R/2 is better for targets farther away from the display center (high amplitude). Based on the results, we suggest that the center of the circular display (interaction distance = R) is the optimal location for interaction with the display, irrespective of the target location on the display - especially when using a large curved display for pointing tasks. Also, note that the impact of interaction distance may vary depending on the display properties (e.g., display curvature) and specific tasks (e.g. map browsing).
8.1.3. User Offset
Based on the study results, we found no difference in pointing performance (movement time and error rate) for the center (i.e., no-offset) and the left position, subjective feedback shows that the no-offset position is significantly better than the left position for all nine subjective feedback criteria. Therefore, we suggest placing users at the center of the displays with no offset on large curved displays.
8.2. Limitations and Future work
The study was conducted between a physical and a virtual large display considering only one display radius of 3.27 meters (3270R) and a height of 3 meters. Future studies can evaluate whether these results are valid irrespective of display sizes (e.g., small, medium, and large displays) and display curvature (e.g., 2000R, 6000R). Due to the Oculus Quest 2 having a higher than usual Field-of-view (90∘) and display resolution (1920 x 1832 for each eye), we did not notice any performance difference between the two display platforms. Future studies can evaluate how the results change when using different head-mounted displays with different FoV and display resolutions (e.g., Apple Vision Pro, Valve Index, HTC Vive, Quest 3, Microsoft Hololens). Our study investigated users’ pointing performance in a single-user scenario. Further research could evaluate whether users’ pointing performance remains consistent between two platforms in collaborative multi-player scenarios. It is worth noting that our participant pool was relatively small, with 14 participants in Study 1 and 12 in Study 2. This sample size may not be representative of the broader population. Additionally, we intentionally excluded left-handed individuals, as our focus was solely on the left offset. In addition, incorporating left-handed participants would have necessitated examining both left and right offsets, complicating the study design. To improve the generalizability of our findings, future research should consider a larger and more diverse participant pool, encompassing a more comprehensive range of ages and handedness.
9. Conclusion
In this paper, we investigated users pointing performance between a large curved physical and virtual display. More specifically, we explored the effect of standard pointing factors (i.e., target width and amplitude) and curvature-specific factors (e.g., users’ relative position to the display) on users’ pointing performance between two displays. We found comparable performance for both the virtual and physical on 1D pointing tasks irrespective of the investigated factors. We further showed that positioning users at the curvature center helps them to select targets efficiently compared to off-centered positions. We provided guidelines for designers to leverage large virtual displays in VR for pointing-related tasks.
References
- (1)
- Ahn et al. (2014) Sung Hee Ahn, Byungki Jin, Sanghyun Kwon, and Myung Hwan Yun. 2014. A research on curved display comparing to flat display regarding posture, tilt angle, focusing area and satisfaction. Journal of the Ergonomics Society of Korea 33, 3 (2014), 191–202.
- Ames (2023) TLX @ NASA Ames. 2023. Home. Retrieved January 15, 2023 from https://humansystems.arc.nasa.gov/groups/tlx/.
- Andrews et al. (2011) Christopher Andrews, Alex Endert, Beth Yost, and Chris North. 2011. Information visualization on large, high-resolution displays: Issues, challenges, and opportunities. Information Visualization 10, 4 (2011), 341–355. https://doi.org/10.1177/1473871611415997 arXiv:https://doi.org/10.1177/1473871611415997
- Ardito et al. (2015) Carmelo Ardito, Paolo Buono, Maria Francesca Costabile, and Giuseppe Desolda. 2015. Interaction with Large Displays: A Survey. ACM Comput. Surv. 47, 3, Article 46 (feb 2015), 38 pages. https://doi.org/10.1145/2682623
- Babic et al. (2018) Teo Babic, Harald Reiterer, and Michael Haller. 2018. Pocket6: A 6DoF Controller Based On A Simple Smartphone Application. In Proceedings of the 2018 ACM Symposium on Spatial User Interaction (Berlin, Germany) (SUI ’18). Association for Computing Machinery, New York, NY, USA, 2–10. https://doi.org/10.1145/3267782.3267785
- Batmaz et al. (2022) Anil Ufuk Batmaz, Moaaz Hudhud Mughrabi, Mayra Donaji Barrera Machuca, and Wolfgang Stuerzlinger. 2022. Effect of Stereo Deficiencies on Virtual Distal Pointing. In Proceedings of the 28th ACM Symposium on Virtual Reality Software and Technology (Tsukuba, Japan) (VRST ’22). Association for Computing Machinery, New York, NY, USA, Article 12, 8 pages. https://doi.org/10.1145/3562939.3565621
- Batmaz et al. (2019) Anil Ufuk Batmaz, Mayra Donaji Barrera Machuca, Duc Minh Pham, and Wolfgang Stuerzlinger. 2019. Do Head-Mounted Display Stereo Deficiencies Affect 3D Pointing Tasks in AR and VR?. In 2019 IEEE Conference on Virtual Reality and 3D User Interfaces (VR). 585–592. https://doi.org/10.1109/VR.2019.8797975
- Baudisch et al. (2001) Patrick Baudisch, Nathaniel Good, and Paul Stewart. 2001. Focus plus Context Screens: Combining Display Technology with Visualization Techniques. In Proceedings of the 14th Annual ACM Symposium on User Interface Software and Technology (Orlando, Florida) (UIST ’01). Association for Computing Machinery, New York, NY, USA, 31–40. https://doi.org/10.1145/502348.502354
- Birnholtz et al. (2007) Jeremy P. Birnholtz, Tovi Grossman, Clarissa Mak, and Ravin Balakrishnan. 2007. An Exploratory Study of Input Configuration and Group Process in a Negotiation Task Using a Large Display. In Proceedings of the SIGCHI Conference on Human Factors in Computing Systems (San Jose, California, USA) (CHI ’07). Association for Computing Machinery, New York, NY, USA, 91–100. https://doi.org/10.1145/1240624.1240638
- Cao et al. (2019) Lizhou Cao, Chao Peng, and Jeffery T. Hansberger. 2019. A Large Curved Display System in Virtual Reality for Immersive Data Interaction. In 2019 IEEE Games, Entertainment, Media Conference (GEM). 1–4. https://doi.org/10.1109/GEM.2019.8811550
- Card et al. (1999) SK Card, JD Mackinlay, and Ben Shneiderman. 1999. Information Visualization. Readings in Information Visualization.
- Card et al. (1978) Stuart K. Card, William K. English, and Betty J. Burr. 1978. Evaluation of Mouse, Rate-Controlled Isometric Joystick, Step Keys, and Text Keys for Text Selection on a CRT. Ergonomics 21, 8 (1978), 601–613. https://doi.org/10.1080/00140137808931762 arXiv:https://doi.org/10.1080/00140137808931762
- Cavallo et al. (2019) Marco Cavallo, Mishal Dholakia, Matous Havlena, Kenneth Ocheltree, and Mark Podlaseck. 2019. Dataspace: A Reconfigurable Hybrid Reality Environment for Collaborative Information Analysis. In 2019 IEEE Conference on Virtual Reality and 3D User Interfaces (VR). 145–153. https://doi.org/10.1109/VR.2019.8797733
- Chowdhury et al. (2022) Sohan Chowdhury, A K M Amanat Ullah, Nathan Bruce Pelmore, Pourang Irani, and Khalad Hasan. 2022. Wriarm: Leveraging wrist movement to design wrist+ arm based teleportation in vr. In 2022 IEEE International Symposium on Mixed and Augmented Reality (ISMAR). IEEE, 317–325.
- Cockburn et al. (2009) Andy Cockburn, Amy Karlson, and Benjamin B. Bederson. 2009. A Review of Overview+detail, Zooming, and Focus+context Interfaces. ACM Comput. Surv. 41, 1, Article 2 (jan 2009), 31 pages. https://doi.org/10.1145/1456650.1456652
- Crossman (1956) Edward RFW Crossman. 1956. The measurement of perceptual load in manual operations. Ph. D. Dissertation. University of Birmingham.
- Deisinger et al. (1997) Joachim Deisinger, Carolina Cruz-Neira, Oliver Riedel, and Jürgen Symanzik. 1997. The Effect of Different Viewing Devices for the Sense of Presence of Immersion in Virtual Environments: A Comparison of Stereoprojections Based on Monitors, HMDs and Screens. In HCI (2). 881–884.
- Ens et al. (2016) Barrett Ens, David Ahlström, and Pourang Irani. 2016. Moving Ahead with Peephole Pointing: Modelling Object Selection with Head-Worn Display Field of View Limitations. In Proceedings of the 2016 Symposium on Spatial User Interaction (Tokyo, Japan) (SUI ’16). Association for Computing Machinery, New York, NY, USA, 107–110. https://doi.org/10.1145/2983310.2985756
- Fitts (1954) Paul M Fitts. 1954. The information capacity of the human motor system in controlling the amplitude of movement. Journal of experimental psychology 47, 6 (1954), 381. https://doi.org/10.1037/h0055392
- Fitts (1992) Paul M Fitts. 1992. The information capacity of the human motor system in controlling the amplitude of movement. Journal of Experimental Psychology: General 121, 3 (1992), 262. https://doi.org/10.1037/0096-3445.121.3.262
- Google (2023) Google. 2023. Firebase realtime database: store and SYNC data in Real time. Retrieved January 15, 2023 from https://firebase.google.com/products/realtime-database.
- Grossman and Balakrishnan (2004) Tovi Grossman and Ravin Balakrishnan. 2004. Pointing at Trivariate Targets in 3D Environments. In Proceedings of the SIGCHI Conference on Human Factors in Computing Systems (Vienna, Austria) (CHI ’04). Association for Computing Machinery, New York, NY, USA, 447–454. https://doi.org/10.1145/985692.985749
- Hansen et al. (2018) John Paulin Hansen, Vijay Rajanna, I. Scott MacKenzie, and Per Bækgaard. 2018. A Fitts’ Law Study of Click and Dwell Interaction by Gaze, Head and Mouse with a Head-Mounted Display. In Proceedings of the Workshop on Communication by Gaze Interaction (Warsaw, Poland) (COGAIN ’18). Association for Computing Machinery, New York, NY, USA, Article 7, 5 pages. https://doi.org/10.1145/3206343.3206344
- Haque et al. (2015) Faizan Haque, Mathieu Nancel, and Daniel Vogel. 2015. Myopoint: Pointing and Clicking Using Forearm Mounted Electromyography and Inertial Motion Sensors. In Proceedings of the 33rd Annual ACM Conference on Human Factors in Computing Systems (Seoul, Republic of Korea) (CHI ’15). Association for Computing Machinery, New York, NY, USA, 3653–3656. https://doi.org/10.1145/2702123.2702133
- Hennecke et al. (2013) Fabian Hennecke, Alexander De Luca, Ngo Dieu Huong Nguyen, Sebastian Boring, and Andreas Butz. 2013. Investigating Pointing Tasks across Angularly Coupled Display Areas. In Human-Computer Interaction – INTERACT 2013, Paula Kotzé, Gary Marsden, Gitte Lindgaard, Janet Wesson, and Marco Winckler (Eds.). Springer Berlin Heidelberg, Berlin, Heidelberg, 720–727.
- HOFFMANN (1995) ERROL R. HOFFMANN. 1995. Effective target tolerance in an inverted Fitts task. Ergonomics 38, 4 (1995), 828–836. https://doi.org/10.1080/00140139508925153 arXiv:https://doi.org/10.1080/00140139508925153
- Hoffmann et al. (2011) Errol R. Hoffmann, Colin G. Drury, and Carol J. Romanowski. 2011. Performance in one-, two- and three-dimensional terminal aiming tasks. Ergonomics 54, 12 (2011), 1175–1185. https://doi.org/10.1080/00140139.2011.614356 arXiv:https://doi.org/10.1080/00140139.2011.614356 PMID: 22103725.
- Hoffmann and Sheikh (1994) Errol R Hoffmann and Ilyas H Sheikh. 1994. Effect of varying target height in a Fitts’ movement task. Ergonomics 37, 6 (1994), 1071–1088.
- Hourcade and Bullock-Rest (2012) Juan Pablo Hourcade and Natasha Bullock-Rest. 2012. How Small Can You Go? Analyzing the Effect of Visual Angle in Pointing Tasks. In Proceedings of the SIGCHI Conference on Human Factors in Computing Systems (Austin, Texas, USA) (CHI ’12). Association for Computing Machinery, New York, NY, USA, 213–216. https://doi.org/10.1145/2207676.2207706
- ISO (2000) ISO ISO. 2000. 9241-9 Ergonomic requirements for office work with visual display terminals (VDTs)-Part 9: Requirements for non-keyboard input devices (FDIS-Final Draft International Standard), 2000. International Organization for Standardization (2000).
- Janzen et al. (2016) Izabelle Janzen, Vasanth K. Rajendran, and Kellogg S. Booth. 2016. Modeling the Impact of Depth on Pointing Performance. In Proceedings of the 2016 CHI Conference on Human Factors in Computing Systems (San Jose, California, USA) (CHI ’16). Association for Computing Machinery, New York, NY, USA, 188–199. https://doi.org/10.1145/2858036.2858244
- Jones et al. (2008) J. Adam Jones, J. Edward Swan, Gurjot Singh, Eric Kolstad, and Stephen R. Ellis. 2008. The Effects of Virtual Reality, Augmented Reality, and Motion Parallax on Egocentric Depth Perception. In Proceedings of the 5th Symposium on Applied Perception in Graphics and Visualization (Los Angeles, California) (APGV ’08). Association for Computing Machinery, New York, NY, USA, 9–14. https://doi.org/10.1145/1394281.1394283
- Jota et al. (2010) Ricardo Jota, Miguel A. Nacenta, Joaquim A. Jorge, Sheelagh Carpendale, and Saul Greenberg. 2010. A Comparison of Ray Pointing Techniques for Very Large Displays. In Proceedings of Graphics Interface 2010 (Ottawa, Ontario, Canada) (GI ’10). Canadian Information Processing Society, CAN, 269–276. https://doi.org/10.5555/1839214.1839261
- Khoo et al. (2008) Eng Tat Khoo, Tim Merritt, and Adrian David Cheok. 2008. Designing physical and social intergenerational family entertainment. Interacting with Computers 21, 1-2 (11 2008), 76–87. https://doi.org/10.1016/j.intcom.2008.10.009 arXiv:https://academic.oup.com/iwc/article-pdf/21/1-2/76/2164289/iwc21-0076.pdf
- Kondraske (1994) G.V. Kondraske. 1994. An angular motion Fitt’s Law for human performance modeling and prediction. In Proceedings of 16th Annual International Conference of the IEEE Engineering in Medicine and Biology Society, Vol. 1. 307–308 vol.1. https://doi.org/10.1109/IEMBS.1994.412031
- Kopper et al. (2010) Regis Kopper, Doug A. Bowman, Mara G. Silva, and Ryan P. McMahan. 2010. A human motor behavior model for distal pointing tasks. International Journal of Human-Computer Studies 68, 10 (2010), 603–615. https://doi.org/10.1016/j.ijhcs.2010.05.001
- Kopper (2011) Régis Augusto Poli Kopper. 2011. Understanding and improving distal pointing interaction. Ph. D. Dissertation. Virginia Tech. http://hdl.handle.net/10919/28183
- Kovacs et al. (2008) AJ Kovacs, JJ Buchanan, and CH Shea. 2008. Perceptual influences on Fitts’ law. Experimental Brain Research 190, 1 (2008), 99–103. https://doi.org/10.1007/s00221-008-1497-3
- Kulik et al. (2020) Alexander Kulik, André Kunert, and Bernd Froehlich. 2020. On Motor Performance in Virtual 3D Object Manipulation. IEEE Transactions on Visualization and Computer Graphics 26, 5 (2020), 2041–2050. https://doi.org/10.1109/TVCG.2020.2973034
- Kyung and Park (2021) Gyouhyung Kyung and Sungryul Park. 2021. Curved versus flat monitors: Interactive effects of display curvature radius and display size on visual search performance and visual fatigue. Human Factors 63, 7 (2021), 1182–1195. https://doi.org/10.1177/0018720820922717
- Leusmann and Angerbauer (2021) Jan Leusmann and Sven Mayer Katrin Angerbauer. 2021. A literature review on distant object selection methods. (2021). https://doi.org/10.18419/opus-12060
- Lischke et al. (2016) Lars Lischke, Valentin Schwind, Kai Friedrich, Albrecht Schmidt, and Niels Henze. 2016. MAGIC-Pointing on Large High-Resolution Displays. In Proceedings of the 2016 CHI Conference Extended Abstracts on Human Factors in Computing Systems (San Jose, California, USA) (CHI EA ’16). Association for Computing Machinery, New York, NY, USA, 1706–1712. https://doi.org/10.1145/2851581.2892479
- Liu et al. (2020) Jiazhou Liu, Arnaud Prouzeau, Barrett Ens, and Tim Dwyer. 2020. Design and Evaluation of Interactive Small Multiples Data Visualisation in Immersive Spaces. In 2020 IEEE Conference on Virtual Reality and 3D User Interfaces (VR). 588–597. https://doi.org/10.1109/VR46266.2020.00081
- Liu et al. (2022) Jiazhou Liu, Arnaud Prouzeau, Barrett Ens, and Tim Dwyer. 2022. Effects of Display Layout on Spatial Memory for Immersive Environments. Proceedings of the ACM on Human-Computer Interaction 6, ISS (2022), 468–488.
- Liu et al. (2015) Mingyu Liu, Mathieu Nancel, and Daniel Vogel. 2015. Gunslinger: Subtle Arms-down Mid-Air Interaction. In Proceedings of the 28th Annual ACM Symposium on User Interface Software & Technology (Charlotte, NC, USA) (UIST ’15). Association for Computing Machinery, New York, NY, USA, 63–71. https://doi.org/10.1145/2807442.2807489
- MacKenzie (1992) I. Scott MacKenzie. 1992. Fitts’ Law as a Research and Design Tool in Human-Computer Interaction. Hum.-Comput. Interact. 7, 1 (mar 1992), 91–139. https://doi.org/10.1207/s15327051hci0701_3
- MacKenzie and Buxton (1992) I. Scott MacKenzie and William Buxton. 1992. Extending Fitts’ Law to Two-Dimensional Tasks. In Proceedings of the SIGCHI Conference on Human Factors in Computing Systems (Monterey, California, USA) (CHI ’92). Association for Computing Machinery, New York, NY, USA, 219–226. https://doi.org/10.1145/142750.142794
- Mechdyne (2023) Mechdyne. 2023. Mechdyne Corporation. Retrieved June 15, 2023 from https://www.mechdyne.com/.
- Meta (2023) Meta. 2023. Meta quest 2: Advanced all-in-one VR headset. Retrieved January 15, 2023 from https://www.meta.com/gb/en/quest/products/quest-2.
- Naceri et al. (2010) Abdeldjallil Naceri, Ryad Chellali, Fabien Dionnet, and Simone Toma. 2010. Depth perception within virtual environments: comparison between two display technologies. International Journ. on Advances in Intelligent Systems 3 (2010).
- Nancel et al. (2013) Mathieu Nancel, Olivier Chapuis, Emmanuel Pietriga, Xing-Dong Yang, Pourang P. Irani, and Michel Beaudouin-Lafon. 2013. High-Precision Pointing on Large Wall Displays Using Small Handheld Devices. In Proceedings of the SIGCHI Conference on Human Factors in Computing Systems (Paris, France) (CHI ’13). Association for Computing Machinery, New York, NY, USA, 831–840. https://doi.org/10.1145/2470654.2470773
- Novak et al. (2008) Jasminko Novak, Mattias Aggeler, and Gerhard Schwabe. 2008. Designing Large-Display Workspaces for Cooperative Travel Consultancy. In CHI ’08 Extended Abstracts on Human Factors in Computing Systems (Florence, Italy) (CHI EA ’08). Association for Computing Machinery, New York, NY, USA, 2877–2882. https://doi.org/10.1145/1358628.1358777
- OptiTrack (2023) OptiTrack. 2023. OptiTrack - Motion Capture Systems. Retrieved June 15, 2023 from https://optitrack.com/.
- Park et al. (2017) Sungryul Park, Donghee Choi, Jihhyeon Yi, Songil Lee, Ja Eun Lee, Byeonghwa Choi, Seungbae Lee, and Gyouhyung Kyung. 2017. Effects of display curvature, display zone, and task duration on legibility and visual fatigue during visual search task. Applied Ergonomics 60 (2017), 183–193. https://doi.org/10.1016/j.apergo.2016.11.012
- Park et al. (2019) Sungryul Park, Gyouhyung Kyung, Donghee Choi, Jihhyeon Yi, Songil Lee, Byeonghwa Choi, and Seungbae Lee. 2019. Effects of display curvature and task duration on proofreading performance, visual discomfort, visual fatigue, mental workload, and user satisfaction. Applied Ergonomics 78 (2019), 26–36. https://doi.org/10.1016/j.apergo.2019.01.014
- Radwin et al. (1990) Robert G. Radwin, Gregg C. Vanderheiden, and Mei-Li Lin. 1990. A Method for Evaluating Head-Controlled Computer Input Devices Using Fitts’ Law. Human Factors 32, 4 (1990), 423–438. https://doi.org/10.1177/001872089003200405 arXiv:https://doi.org/10.1177/001872089003200405 PMID: 2150065.
- Satyanarayan et al. (2013) Arvind Satyanarayan, Daniel Strazzulla, Clemens N. Klokmose, Michel Beaudouin-Lafon, and Wendy E. Mackay. 2013. The CHI 2013 Interactive Schedule. In CHI ’13 Extended Abstracts on Human Factors in Computing Systems (Paris, France) (CHI EA ’13). Association for Computing Machinery, New York, NY, USA, 2987–2990. https://doi.org/10.1145/2468356.2479591
- Scheible and Ojala (2005) Jürgen Scheible and Timo Ojala. 2005. MobiLenin Combining a Multi-Track Music Video, Personal Mobile Phones and a Public Display into Multi-User Interactive Entertainment. In Proceedings of the 13th Annual ACM International Conference on Multimedia (Hilton, Singapore) (MULTIMEDIA ’05). Association for Computing Machinery, New York, NY, USA, 199–208. https://doi.org/10.1145/1101149.1101178
- Sharples et al. (2008) Sarah Sharples, Sue Cobb, Amanda Moody, and John R. Wilson. 2008. Virtual reality induced symptoms and effects (VRISE): Comparison of head mounted display (HMD), desktop and projection display systems. Displays 29, 2 (2008), 58–69. https://doi.org/10.1016/j.displa.2007.09.005 Health and Safety Aspects of Visual Displays.
- Shi et al. (2022) Mengdi Shi, Tao Hu, and Jiawen Yu. 2022. Pointing Cursor Interaction in Virtual Reality from the Perspective of Distance Perception. Traitement du Signal 39, 2 (2022). https://doi.org/10.18280/ts.390209
- Shoemaker et al. (2012) Garth Shoemaker, Takayuki Tsukitani, Yoshifumi Kitamura, and Kellogg S. Booth. 2012. Two-Part Models Capture the Impact of Gain on Pointing Performance. ACM Trans. Comput.-Hum. Interact. 19, 4, Article 28 (dec 2012), 34 pages. https://doi.org/10.1145/2395131.2395135
- Shupp et al. (2009) Lauren Shupp, Christopher Andrews, Margaret Dickey-Kurdziolek, Beth Yost, and Chris North. 2009. Shaping the display of the future: The effects of display size and curvature on user performance and insights. Human–Computer Interaction 24, 1-2 (2009), 230–272. https://doi.org/10.1080/07370020902739429
- Siddhpuria et al. (2018) Shaishav Siddhpuria, Sylvain Malacria, Mathieu Nancel, and Edward Lank. 2018. Pointing at a Distance with Everyday Smart Devices. In Proceedings of the 2018 CHI Conference on Human Factors in Computing Systems (Montreal QC, Canada) (CHI ’18). Association for Computing Machinery, New York, NY, USA, 1–11. https://doi.org/10.1145/3173574.3173747
- Soukoreff and MacKenzie (2004) R. William Soukoreff and I. Scott MacKenzie. 2004. Towards a standard for pointing device evaluation, perspectives on 27 years of Fitts’ law research in HCI. International Journal of Human-Computer Studies 61, 6 (2004), 751–789. https://doi.org/10.1016/j.ijhcs.2004.09.001 Fitts’ law 50 years later: applications and contributions from human-computer interaction.
- Takashina et al. (2021) Tomomi Takashina, Mitsuru Ito, Hitoshi Nagaura, and Eisuke Wakabayashi. 2021. Evaluation of Curved Raycasting-based Interactive Surfaces in Virtual Environments. In 2021 IEEE Conference on Virtual Reality and 3D User Interfaces Abstracts and Workshops (VRW). 534–535. https://doi.org/10.1109/VRW52623.2021.00149
- Tao et al. (2021) Da Tao, Xiaofeng Diao, Tieyan Wang, Jingya Guo, and Xingda Qu. 2021. Freehand interaction with large displays: Effects of body posture, interaction distance and target size on task performance, perceived usability and workload. Applied Ergonomics 93 (2021), 103370. https://doi.org/10.1016/j.apergo.2021.103370
- technologies (2023) Unity technologies. 2023. Unity Real-Time Development Platform — 2D, 3D, VR & AR Engine. Retrieved January 15, 2023 from https://unity.com/.
- Triantafyllidis and Li (2021) Eleftherios Triantafyllidis and Zhibin Li. 2021. The Challenges in Modeling Human Performance in 3D Space with Fitts’ Law. In Extended Abstracts of the 2021 CHI Conference on Human Factors in Computing Systems (Yokohama, Japan) (CHI EA ’21). Association for Computing Machinery, New York, NY, USA, Article 56, 9 pages. https://doi.org/10.1145/3411763.3443442
- Ullah et al. (2023) A K M Amanat Ullah, William Delamare, and Khalad Hasan. 2023. Exploring Users Pointing Performance on Large Displays with Different Curvatures in Virtual Reality. IEEE Transactions on Visualization and Computer Graphics (2023).
- Urakami et al. (2021) Jacqueline Urakami, Henrique Matulis, Shio Miyafuji, Zhengqing Li, Hideki Koike, and Mark Chignell. 2021. Comparing immersiveness and perceptibility of spherical and curved displays. Applied Ergonomics 90 (2021), 103271.
- Zhang et al. (2012) Xinyong Zhang, Hongbin Zha, and Wenxin Feng. 2012. Extending Fitts’ Law to Account for the Effects of Movement Direction on 2d Pointing. In Proceedings of the SIGCHI Conference on Human Factors in Computing Systems (Austin, Texas, USA) (CHI ’12). Association for Computing Machinery, New York, NY, USA, 3185–3194. https://doi.org/10.1145/2207676.2208737