The Not-So Dramatic Effect of Advective Flows on Gas Accretion
Abstract
Super-Earths and mini-Neptunes are the most common types of exoplanets discovered, yet the physical scenarios behind their formation are still debated. Standard core accretion models in gas-rich environment find that typical mini-Neptune mass planets would blow up into Jupiters before the underlying disk gas dissipates away. The injection of entropy from the protoplanetary disk into forming gaseous envelopes has recently been put forward as a mechanism to delay this runaway accretion, specifically at short orbital distances. Here, we reevaluate this line of reasoning by incorporating recycling flows of gas into a numerical one-dimensional thermodynamic model with more realistic equation of state and opacities and the thermal state of the advective flow. At 0.1 AU, unless these advective flows can penetrate below 0.2 of the planet’s gravitational sphere of influence, the gas-to-core mass ratio (GCR) stays above 10% before the nebular disk dissipates which is still too large to explain the measured properties of mini-Neptunes, necessitating other gas-limiting processes such as late-time core assembly. The effect of entropy advection on gas accretion weakens even further at wider orbital separations. We present an updated scaling relation between GCR and the penetration depth of the advective flows which varies non-trivially with orbital distances, core masses and dusty vs. dust-free opacity. We further demonstrate how measurements of planet mass distribution beyond 1 AU can be used to disambiguate between different formation conditions of gas-poor planets.
1 Introduction
Super-Earths and mini-Neptunes dominate the discovered exoplanetary populations, with 30–50% of all Sun-like stars harboring at least one of these planets within orbital periods of 300 days (e.g., Howard et al., 2010; Batalha et al., 2013; Petigura et al., 2013; Dong & Zhu, 2013; Fressin et al., 2013; Rowe et al., 2014; Burke et al., 2015; Zhu et al., 2018). The mini-Neptunes in particular have measured masses of 2-20 (Weiss & Marcy, 2014; Wu & Lithwick, 2013) and radii of 1.8–4, which imply a thin H-He atmosphere atop a rocky core with the envelope mass fraction ranging from 1 % to 10% (Rogers & Seager, 2010; Lopez & Fortney, 2014; Wolfgang & Lopez, 2015). Classical theories of core accretion expected such planets (especially the more massive ones 10) to have undergone a runaway gas accretion and blow up into gas giants (e.g., Mizuno, 1980; Stevenson, 1982; Pollack et al., 1996; Ikoma et al., 2000), prompting a need for a revision to such a theory to explain the existence and prevalence of mini-Neptunes.
One solution is to consider the late-time assembly of planetary cores which delays the onset of gas accretion (Lee et al., 2014; Lee & Chiang, 2016). By comparing the empirically determined orbit-crossing timescale from Zhou et al. (2007) with the eccentricity damping timescale from gas dynamical friction, Lee & Chiang (2016) argued that the nebular gas needs to be depleted by about four orders of magnitude with respect to a solar nebula for the protocores to merge. By coupling a direct N-body simulation with gas accretion, Dawson et al. (2016) demonstrated that the core mergers can begin from the gas depletion factor of 1000, and Choksi & Chiang (2020) identified the peaks in the observed orbital period ratio of multi-planetary systems just wide of mean motion resonance can be explained by eccentricity damping and short-scale migration in heavily gas-depleted environment, by 3–5 orders of magnitude with respect to solar nebula, in agreement with previous literature. Such gas-depleted environment is consistent with the very late stage of disk evolution and so the limited time and the lower nebular density prevents the runaway accretion and ensures the accumulation of 1–10% by mass envelope (Lee & Chiang, 2016).
An alternative mechanism to delay runaway is to consider hydrodynamic effects such as planetary rotation (Zhong & Yu, 2021) and the injection of entropy from the outer disk inside the envelope by “atmospheric recycling” (Ormel et al. 2015; see also Fung et al. 2015). Three-dimensional (3-D) hydrodynamic models report the advective flows can penetrate deep into the envelope which can slow down the cooling of the planet as these flows are expected to bring in the (higher) disk entropy into the deep envelopes and therefore effect the formation of mini-Neptunes instead of Jupiters (Lambrechts & Lega, 2017; Popovas et al., 2018; Béthune & Rafikov, 2019; Moldenhauer et al., 2021). Ali-Dib et al. (2020) accounted for this atmospheric recycling in one-dimensional (1-D) semi-analytical thermal calculations by modelling the upper advective region as an adiabat since they argue that the advection timescale is short compared to the cooling timescale of the envelope. They found that at short orbital distances, the effect is strong enough to significantly stall accretion which could explain why mini-Neptunes do not undergo runaway and remain small.
In their comparison between 1-D semi-analytical thermal calculations and 3-D global radiative simulations that include realistic opacities and equation of state, Zhu et al. (2021) found the upper advective region to be not an adiabat. They further found that the thermal state of the envelope should not be significantly altered by recycling at least at 5 AU which is where they focused their simulations. As high entropy flows from the protoplanetary disk try to penetrate a low entropy region of the envelope, buoyancy forces prevent the flows from penetrating deep in the atmosphere, as is commonly found in more realistic non-isothermal simulations (Kurokawa & Tanigawa, 2018). Zhu et al. (2021) note however that it may still be the case that such advective flows could potentially inhibit runaway accretion at short orbital distances (0.1 AU).
In this work, we revisit the role of recycling at short orbital distances by accounting for the outer hydrodynamic flow in 1D thermal calculations. Although our approach is similar to the one proposed by Ali-Dib et al. (2020), the main difference is that we do not treat the recycling flows as an adiabatic process. Instead, we favor a gradual transition between the disk and the atmosphere following the suggestion of Zhu et al. (2021) while also using realistic equation of state and opacities. We ultimately seek to quantify the effect of entropy advection on its ability to slow down gas accretion and whether it can successfully produce mini-Neptunes at short orbital periods, even in gas-rich environments.
The paper is organized as follows. We outline the construction of envelope profiles and their time evolution in Section 2. Results are presented in Section 3 along with an updated semi-analytic scaling relationship between the envelope mass fraction, time, and the depth of the advective flow. Section 4 discusses the importance of using realistic opacity and equation of state in thermal evolution of planetary envelopes, summarizes how mini-Neptunes avoid runaway in the context of our results, and presents the critical core mass that separates gas-poor from gas-rich planets over a range of orbital distances and avenues for identifying likely formation conditions of gas-poor planets using future instruments such as the Nancy Grace Roman Space Telescope. Finally, we summarize and conclude in Section 5.
2 Time-dependent model atmospheres
We follow the spherically symmetric model of Lee et al. (2014) to simulate the formation of an atmosphere around a rocky core while also incorporating atmospheric recycling into the calculations. We first build a series of “hydrostatic snapshots" of the envelope, each corresponding to different gas-to-core mass ratio GCR . These snapshots are threaded together by computing the time it takes for the envelope to cool from one snapshot to the next.
2.1 Hydrostatic snapshots
For each value of GCR, we solve the standard stellar structure equations:
| (1) |
| (2) |
| (3) |
for the density , the pressure , the temperature , and the enclosed mass as functions of the radius . Here, is the gravitational constant, is the mass of the central star which we fix to the solar mass, and is the orbital distance from the star. The term on the far right of Equation (2) is inserted to account for the central star’s gravitational field as suggested by Zhu et al. (2022). The effect of this correction is small as we expect within the atmosphere. The dimensionless temperature gradient ln ln depends on whether the energy transport is dominated by radiation or convection. Convection initially dominates throughout the envelope, but as the gas cools and more mass is accreted, radiation zones develop in the outer regions of the envelope. From radiative diffusion,
| (4) |
where is the opacity, is the internal luminosity of the envelope, and is the Stefan-Boltzmann constant. When the energy transport is dominated by convection,
| (5) |
where is the specific entropy of the gas.
We relate the state variables (, , and ) in the atmosphere with the equation of state (EOS) computed in Lee et al. (2014) which includes H (molecular, atomic, and ionized), He, and metallic species in solar elemental abundances (Grevesse & Noels, 1993). We fix mass fractions of X=0.7 for H, Y=0.28 for He and Z=0.02 for metals. As we will discuss more in Section 4, adopting this realistic equation of state instead of a fixed adiabatic index affects critically the rate of gas accretion.
Assuming an environment where the heavy elements are homogeneously distributed, the envelope is unstable to convection when the Schwarzschild criterion
| (6) |
is satisfied, where we ignore compositional gradients in our analysis as it is found to drive convection on negligible scales and only at the very bottom of the envelope for mini-Neptunes (see Lee et al., 2014). Thus we use min in Equation (3). Throughout this work, we will refer to the boundary between the innermost convective zone and the overlying radiative region as the radiative-convective boundary (rcb).
It has been shown that opacity has a sizable effect on planetary accretion rates (e.g., Ikoma et al., 2000; Piso et al., 2015). We adopt the same opacity table that is used in Lee et al. (2014) which is an expansion of the calculation of Ferguson et al. (2005) with the smoothing and extrapolation scheme outlined in Lee et al. (2014), their Section 2.1.3. Both dusty and dust-free models are considered where in the former, dust grains follow the interstellar medium (ISM) size distribution and in the latter, grains do not contribute to the opacity due to, e.g., coagulation and rain out.
2.2 Boundary conditions
We describe the outer boundary of a planet with core mass with the Hill radius
| (7) | ||||
and the Bondi radius
| (8) | ||||
where is the sound speed, is the Boltzmann constant, is the disk midplane temperature, is the mean molecular weight, and is the mass of the hydrogen atom, all evaluated at .
We fix the outer boundary of the envelope at the minimum of those two radii
| (9) |
with the inclusion of a free parameter , which accounts for a flow-dominated region of the atmosphere () where the outer disk injects entropy into the system. The thermal state of this flow-dominated region will be developed in Section 2.3. As for the inner boundary down to which we integrate Equations (1)-(3), we use a core radius which scales as (Valencia et al., 2006)
| (10) |
The center of our planet is placed at the disk midplane for which the fiducial parameters and are taken from the minimum-mass extrasolar nebula (MMEN) of Chiang & Laughlin (2013) modified for the irradiated disk profile of Chiang & Goldreich (1997):
| (11) |
| (12) |
Since we are interested in revisiting the ability of advective flows in delaying the accretion timescale in gas-rich environment, we limit our calculations to the gas-full disk profiles. We assume that the disk midplane parameters are constant in time over the duration of gas accretion which not only simplifies the computations, but is also justified given the weak dependence of accretion rate on outer nebular conditions (e.g., Lee et al., 2014; Ginzburg et al., 2016), as long as the nebular gas density does not deplete by more than 8 orders of magnitude (Lee et al., 2018).
2.3 Thermal state of the outer shells
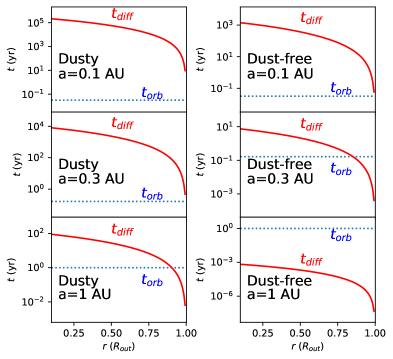
To account for strong advective flows from the disk penetrating the planetary envelope, we include an outer advection region of the envelope () dominated by entropy advection which we treat separately from the inner shells. The thermal state of this region of the envelope is determined by whether the cycling material is allowed to cool before being ejected out back to the disk. The flow timescale of this gas is well approximated by the local orbital period (e.g., Ormel et al., 2015; Zhu et al., 2021) at a given distance .
By comparison, following Zhu et al. (2021, their Section 5.2), we calculate the cooling timescale of the recycling gas where is the thermal energy that must be dissipated for the envelope temperature to be below the isentropic extension of the disk ,111Cooling is mediated by radiative diffusion here since in gas-rich environment, the advective region is optically thick.
| (13) |
and is the excess luminosity generated by the adiabat,
| (14) |
all evaluated over the advection zone () and is the heat capacity of the cycling gas. Using the ideal gas law and a diatomic heat capacity where is the ideal gas constant and is the mean molecular weight of the gas. It follows that
| (15) |
where the optical depth
| (16) |
defined over , and is evaluated using the opacity model described in Section 2.1.
If the gas injected into the envelope is allowed to cool down (i.e. ), radiation will prevail through the outer region. Following the procedure of Zhu et al. (2022), the density outside the envelope () then follows the background Gaussian density profile of the protoplanetary disk
| (17) |
where is the local disk scale height, is the Keplerian orbital frequency.
We combine Equations (2), (3) and (4) for this radiative outer profile in order to compute the temperature over :
| (18) |
If , the penetrating inflow retains the disk entropy over its recycling time and so here we adopt the isentropic approach of Ali-Dib et al. (2020) while remaining consistent with our realistic EOS and opacities. In other words, we solve Equations (2) and (3) for and from to fixing to the adiabatic gradient evaluated for the local disk temperature and pressure, where the subscript ‘S,disk’ is used to remind us that this region is isentropic with respect to the local disk entropy. We ignore the small gas mass present above (this assumption is justified by the centrally concentrated mass distribution shown in Figure 2). Because this region is taken to be isentropic with the disk, we can relate to the disk properties:
| (19) |
with the radially dependent adiabatic index . Here, , and are all computed with the disk conditions at height above the midplane.
To systematically account for these two different methods of heat transport in our simulations, we adopt a hybrid model as follows. For a given set of parameters (dusty vs. dust-free opacity, , and ), we first compute over the outer region . If over the whole region, the envelope profile in the advective region follows , , and . If over the whole region, then the envelope profile follows , and the corresponding according to the EOS. If there there is any transition within the advective region then we use a radiative profile within the newly defined outer shell and for the inner shell we adopt the isentropic profile.
Figure 1 illustrates, as an example, the radial profiles of for 5 core at 0.1, 0.3, and 1 AU, down to 0.1. In the dusty model, we find that over the whole envelope at 0.1 AU and 0.3 AU and for at 1 AU. As for dust-free atmospheres, the local orbital timescale is also shorter than the diffusion timescale at 0.1 AU and at 0.3 AU for . However, the flows are allowed to cool everywhere at 1 AU in the dust-free regime which leads to a fully radiative advective layer.
2.4 Connecting snapshots in time
Like Piso & Youdin (2014), we take the planet luminosity to be spatially constant which implicitly assumes the luminosity generated in the outer region to be minimal, which we verify a posteriori, even when we account for entropy advection. For a fixed GCR, there is a constant luminosity eigenvalue for the stellar structure equations (Equations 1-3). We integrate these equations from to with the boundary conditions at described by the thermal state of the advective layer (Section 2.3). We iteratively solve for until the mass profile agrees with the fixed GCR value within 0.01% for each specific snapshot.
We connect the resulting snapshots together by computing the time it takes to cool from one snapshot to next. Although the planetesimal accretion of solids forming the core can act as an battery, the range of planetesimal accretion rate that can successfully avoid runaway is extremely limited over 0.1–5 AU and the typical solid accretion rate in solar nebula would in fact accelerate the runaway by way of growing the core to too high a mass (see Lee & Chiang, 2015, their Figure 2). Changes to the energy budget of the envelope therefore come directly from its cooling and accretion of gas. Since most of the envelope mass is centrally concentrated (owing to H2 dissociation driving adiabatic index ) and the surface lid of the convective zone acts as a thermal bottleneck, we can characterize the thermal state of the envelope with the state variables at the radiative-convective boundary . We follow the cooling treatment of Piso & Youdin (2014) for the change in energy which gives the time elapsed between snapshots:
| (20) |
Here, the average and difference of a quantity Q over two snapshots are denoted with and respectively, and is the total energy of the envelope
| (21) |
where we account for the specific internal energy () contributions with the equation of state. The integral is carried out from to to cover the entire inner convective zone. Energy from mass accretion is given by
| (22) |
The last term in the numerator of Equation (20) accounts for the change in the volume of the innermost convective zone with the pressure taken along its surface. We do not ignore the contribution of the surface energy terms and as excluding these terms can underestimate the GCR by factors of –2 and artificially delay the runaway. We discuss this effect more in Section 4.
3 Results
3.1 Effect of advection on envelope structure and cooling
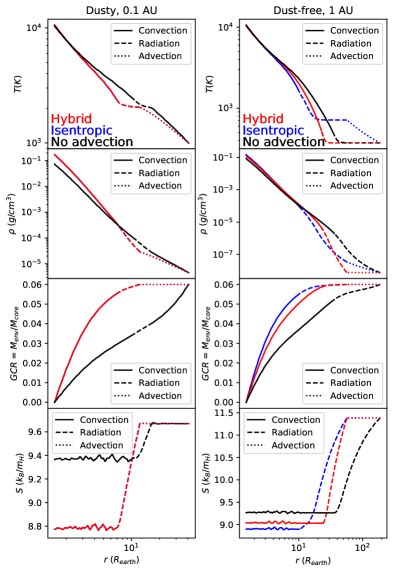
With the one-dimensional differential system developed in Sections 2.1 and 2.2 and the hybrid characterization of the advective flows penetrating the envelope explored in Section 2.3, we can solve for snapshots of the thermal state of the envelope for any core mass, orbital distance, different opacity regimes, advection depth and total GCR. Figure 2 shows the resulting temperature, density, entropy and envelope mass profiles under this hybrid scheme for a core embedded in a gas-rich nebula at both 0.1 AU with dusty opacities and 1 AU with dust-free opacities. While we explore the full parameter space, we choose these two limiting cases for illustration purpose: the former envelope is characterized by a fully isentropic entropy advection region while the latter envelope is allowed to cool by radiation (see Figure 1).
In both 0.1 AU and 1 AU cases, we find that accounting for the advective flows result in steeper envelope profiles with more centrally concentrated mass and smaller internal specific entropy. These steep profiles emerge because for a given envelope mass, an outer penetrative flow shrinks the spatial volume within which the gas mass can be packed. While the temperature at the rcb remains the same between models with and without outer advective zones, the density at the rcb rises in the former which increases the optical depth and so we expect a delay in cooling time when advection is taken into account. Compared to 0.1 AU, we see that the changes to the thermal structures at 1 AU by advective flows are more muted. At wider orbits, the advective flows can cool easily and appear nearly isothermal, similar to the upper envelopes of non-advective, unrestricted cases. For the same core mass and gas mass, the Hill sphere is larger at 1 AU; there is more room to pack the same amount of gas mass and so the envelope profiles are less affected by the changes in the outer envelope. We see from Figure 2 that forcing an isentropic profile at 1 AU would create an even steeper inner envelope structure overestimating the density at the rcb.
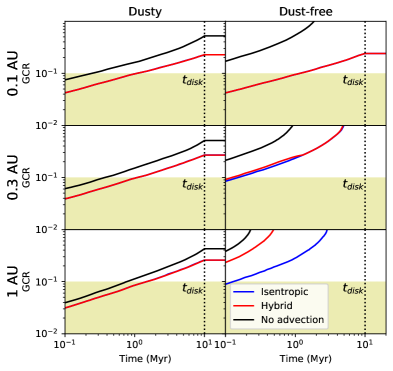
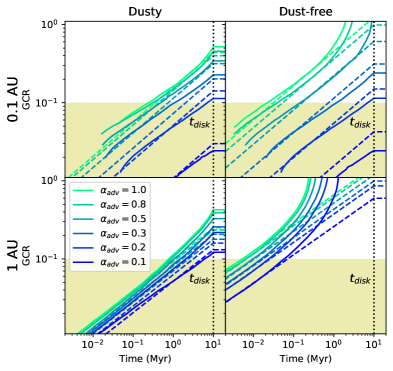
Figure 3 illustrates the degree of delay in gas accretion by cooling caused by the entropy advection. In general, the effect is minor, causing factors of 2 changes in the final GCR. One exception is dust-free accretion at 0.1 AU where the entropy advection successfully avoids the runaway gas accretion as compared to the unrestricted evolution. As mentioned previously, the smaller Hill sphere at shorter orbital distances forces a significantly steeper envelope structure when advective flows are taken into account and the higher rcb density leads to higher optical depth and so slower cooling. Even so, we find that a 5 core that begins accreting gas in early, gas-rich environment will always (even for dust-free accretion at 0.1 AU) end up with GCR 0.2 (for our fiducial ) which is larger than the expected envelope mass fraction of mini-Neptunes. If dust grains do not contribute to opacity during accretion, such a core is expected to undergo runaway gas accretion and blow up into gas giants even at 0.3 AU, even with the recycling flows. We therefore conclude that entropy advection alone is insufficient in limiting the rapid gas accretion onto high-mass mini-Neptune cores. Our use of realistic EOS, opacity, and cooling time calculation arrive at a result that differs from the previous study by Ali-Dib et al. (2020), which we discuss in more detail in Section 4.1.
3.2 Scaling relations for GCR(,)
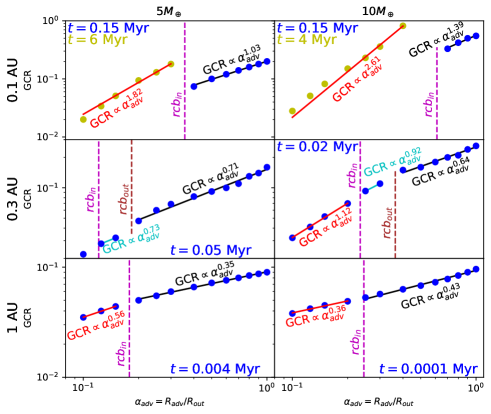
With the realistic treatment of atmospheric recycling developed in this work, we update the previously developed semi-analytic scaling relationships between GCR, time, and the penetration depth of advective flows. In unrestricted systems, Lee & Chiang (2015) derived a general expression for the evolution of the atmospheric mass in terms of state variables and fiducial parameters of the model. The goal of this section is to empirically obtain a scaling of form
| (23) |
where and over the parameter space we explore. Because we fix the core mass, we do not refit the scaling on (but we check a posteriori that the GCR- scaling derived by Lee & Chiang 2015 matches well our calculations between 5 and 10, shown in Figure A.1 in the Appendix). Other dependencies such as the adiabatic gradient and mean molecular weight are not directly discussed here as they do not vary significantly across our simulations; we also do not discuss the effect of metallicity in this paper as we have fixed our calculations to solar metallicity. The GCR- scaling depends on scaling which we find to vary non-trivially as we vary since the ranges from 2000–3000 K where the scaling probes the transition to H- opacity (i.e., from a weak dependence to a near exponential). We therefore subsume the dependence on under GCR- scaling which we fit against our numerical results.
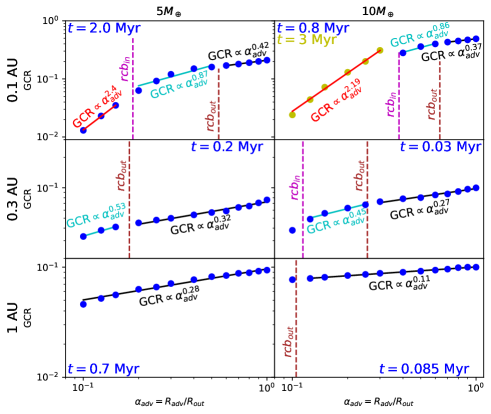
We empirically fit for over numerical results computed at 0.1, 0.125, 0.15, 0.2, 0.25, 0.3, 0.4, 0.5, 0.6, 0.7, 0.8, 0.9, 1 at a fixed time where all GCR values of are pre-runaway. The resulting values of GCR as a function of advection depth are presented in Figure 4. In some instances at 0.1 AU where the delays due to advection are significant (usually for ), the GCR for low had to be taken at a later time (as otherwise the envelope is fully convective). We observe that the GCR as a function of behaves differently for different advection depths, whereby the effect of becomes more significant when the advective flows penetrate below the rcb’s in the original unrestricted envelopes, similar to what was reported by Lee et al. (2022).
The calculation of Lee et al. (2022) differs from ours in two ways. First, their focus was on gas-depleted environment. Second, they accounted for advective flows by simply shrinking . To more directly compare our results with Lee et al. (2022), we reduce the MMEN disk density by a factor of 0.01. We find a dependency on advection depth at 0.3 AU in dust-free atmosphere (GCR ) that agrees with the scaling of the GCR with of Lee et al. (2022, see their Figures 4 and 5). Here, the outer advection region is isothermal with the disk at 0.3 AU where changes in the Gaussian density of the disk are small. Restricting the dust-free envelope with advective flows in depleted MMEN disks is therefore equivalent to simply varying its outer boundary. However, the analogous dusty atmosphere is not characterized by such an outer isotherm leading to a denser rcb in the warmer envelope restricted by entropy advection, and so for dusty envelopes, simply changing the is not equivalent to a more careful treatment of the advective flows. This difference manifests in the GCR- scaling for which we find GCR , steeper than the GCR computed by Lee et al. (2022) for dusty envelopes.
In gas-rich environments (which is our focus), our unrestricted dusty envelopes are characterized by outermost and innermost convective zones with a radiative window sandwiched in-between, so that there are two rcb’s: the outer one (rcbout) where the envelope transitions from convective to radiative zone outside-in; and the inner one (rcbin) where the envelope transitions from radiative to convective zone outside-in. As demonstrated in Figure 4, we see that is the largest (i.e., GCR is affected most strongly) when the flow can penetrate inside rcbin; this is expected because the envelope is forced to be confined within a radius that is smaller than the initial rcbin, significantly increasing the density (and also the temperature) at the new rcb, delaying the cooling process. When the flow penetrates below rcbout but above rcbin, the GCR- becomes weaker, and when the flow cannot penetrate even the outer rcb, the GCR- scaling becomes even weaker.
There is one exception to this trend presented by dust-free accretion onto a core at 1 AU where we see that GCR- steepens for larger . This difference in behavior is due to the envelope mass becoming less centrally concentrated for in the large Hill sphere of a core at 1 AU so that the envelope thermal evolution is more strongly affected by the outer boundary conditions. We confirm that if we limit our empirical fit of GCR to , for above rcbin becomes shallower.
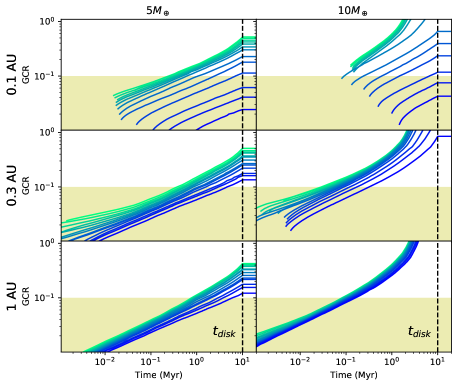
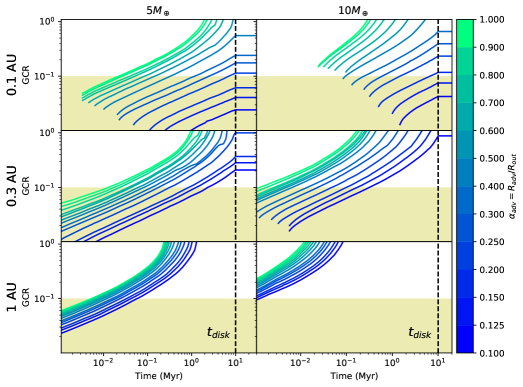
We demonstrate in Figure 5 that Equation (23) with the computed in Figure 4 provides a good approximation to our numerical results. We note that the scaling at 0.1 AU for is slightly off due to imperfect numerical fitting. While the strong effect of entropy advection when the flow penetrates below the inner rcb could theoretically keep the final envelope mass small enough to be consistent with the observed properties of mini-Neptunes (see Figures A.1 and 5), it would require advection depths of which is deeper than the flow penetration depths found in three-dimensional non-isothermal hydrodynamic simulations for marginally superthermal planets (i.e., ; Lambrechts & Lega 2017), which is the relevant regime for 5 cores inside 1 AU. At 1 AU, 5 cores become sub-thermal () and numerical simulations report deeper penetration depths reaching down to 0.1–0.2 (e.g., Zhu et al., 2021); however, at this orbital distance, we find that even for such deep flows, the final GCR would exceed 0.1 (dusty accretion) or actually trigger runaway accretion (dust-free accretion), as illustrated in Figure 5.
4 Discussion
4.1 Importance of opacity and equation of state
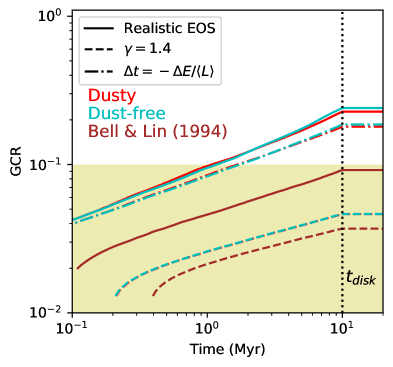
Our results highlight the importance of realistic EOS, opacities, and thermal state of recycling flows in quantifying the latter’s effect on planetary envelope formation. Figure 6 demonstrates how simplifications of these elements can lead to an underestimation of gas cooling and therefore accretion rates. We replace the EOS of Lee et al. (2014) used in the previous sections with the one of Ali-Dib et al. (2020) which adopts a fixed adiabatic index of and a mean molecular weight of . Doing so reduces the final values of GCR by a factor of , well and artificially within the mini-Neptune mass range. With our more realistic EOS, the adiabatic index is allowed to drop down to in the deep envelope allowing convection to prevail through a larger radial extent and leading to faster envelope cooling.
We investigate the effect of using realistic opacities by comparing the dusty and dust-free tables of Ferguson et al. (2005) to the power-law opacity of Bell & Lin (1994) with grains opacity suppressed by a factor of 10 as done by Ali-Dib et al. (2020). As illustrated in Figure 6, adopting the more realistic opacities result in the final GCR larger by a factor 2.5 compared to assuming the power-law opacity of Bell & Lin (1994). When adopting the latter simple power-law opacity, the outer radiative region, and so the radiative-convective boundary, becomes more optically thick from larger opacity (while remaining radiative) which results in reduced rate of cooling and therefore smaller final GCR. We also note that the dusty and dust-free models are nearly identical at 0.1 AU as the outer advective region () is isentropic and the inner envelope has temperatures above the H2 dissociation threshold of 2500 K so that dust grain opacities are irrelevant. Replacing both our EOS and opacity by the ones of Ali-Dib et al. (2020) limits the final GCR to which is times lower than what we find with our realistic treatment of advection ().
Ignoring the surface energy sources in cooling timescale calculations also plays a role in overestimating the effect of entropy advection in limiting gas accretion. In particular, the extra energy gained from accreting gas between snapshots ( term in Equation (20)) increases when including advection, even before runaway accretion begins. This extra energy contribution can increase from % of the total changes in the energy budget for to % for . As shown in Figure 6, including this extra energy source in cooling time calculations hastens accretion rates, with the final GCR higher by %. While this variation is not as drastic as the impact of using realistic opacity and EOS, we still recommend including these surfaces energy sources to more accurately portray the thermal relaxation of the envelope.
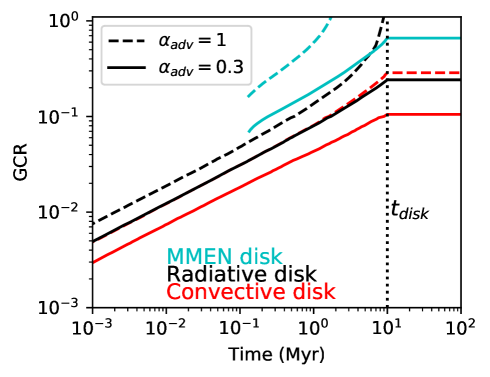
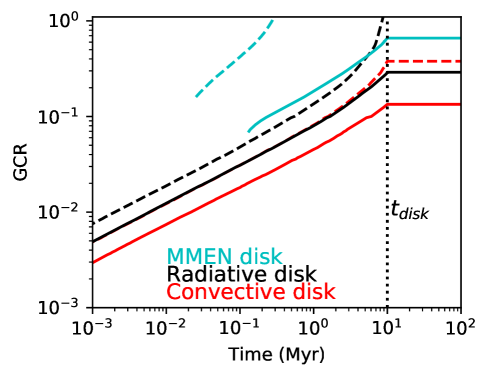
Ali-Dib et al. (2020) found that the density and the temperature of the disk can affect critically the gas accretion rate. For example, they report that within their convective disks, planets would quickly establish an inner isothermal region thereby completely halting accretion. In Figure 7, we illustrate the effect of adopting different disk conditions on the rate of gas accretion, using the radiative and convective disks defined by Ali-Dib et al. (2020). Even with advection, accretion is never halted before the protoplanetary disk dissipates unlike the isothermal state reached by Ali-Dib et al. (2020) after Myr in the radiative disk and over the entire life of the disk in the convective disk (refer to their Figure 5 for comparison). We attribute the cause of this different result to our use of more realistic EOS, opacity and proper accounting of surface energy in the calculation of cooling timescale. Nevertheless, compared to the gas-full MMEN disk, there is a reduction in the final GCR in the radiative and convective disks, which are functionally equivalent to depleting the MMEN disks by factors of 800 and 1200 respectively. Such gas-poor environments have been suggested in late-time formation scenarios as we discuss in Section 4.2.
4.2 How do mini-Neptunes avoid runaway?
Although this work argues advection from the protoplanetary disks can only play a limited role on envelope formation timescales of mini-Neptunes, the observed population of such planets with thin envelopes are still amongst the most common types of exoplanets discovered. We thus need to revert back to other scenarios to explain why accretion onto cores does not result in the formation of gas giants.
Late-stage assembly of the cores remains a promising theory as to how mini-Neptunes can avoid runaway. The delay in the last mass doubling of planetary cores is naturally explained by gas dynamical friction within the initially gas-rich disk preventing the merger of small protocores until the last 10% ( Myr) of the protoplanetary disk lifetime. Lee & Chiang (2016) showed that the gas-poor conditions within that shorter period of time can be sufficient for core accretion to produce the observed thin envelopes. They also determined that this model is consistent with the degree of depletion required for mergers of protocores (see also Dawson et al., 2016). In addition, late-time core assemblies are consistent with the observed flat orbital period distribution of these small planets (Lee & Chiang, 2017), the observed distribution of orbital period ratios in Kepler multi-planetary systems which feature peaks near (but not in) first-order mean motion resonances (e.g., Choksi & Chiang, 2020) with the majority of planet pairs being far away from such resonances (e.g., Izidoro et al., 2017, 2021), as well as the observed intra-system similarity (e.g., MacDonald et al., 2020; Lammers et al., 2023) whereby planets within a given system have more similar masses and radii compared to system-by-system variations. Therefore, late-time formation of planetary cores remains a likely explanation of the abundance of mini-Neptunes.
We note that post formation effects may explain, in part, the thin envelope mass of mini-Neptunes. As shown in Figure 3, realistically accounting for entropy advection can lead to final GCRs of 20-25% at 0.1 AU. At such separation from the central star ( AU), photoevaporation could play a significant role during the post-formation era in whittling down the final GCR to a value that is consistent with the observed radius and mass (e.g., Lopez et al., 2012; Owen & Wu, 2013, 2017; Jin et al., 2014). However, using a hierarchical inference analysis, Rogers & Owen (2021) argue that the typical initial (pre-evaporation) envelope mass fraction of mini-Neptunes must have been 1–10% in order to explain the observed radius-period distribution (see their Figure 11) under the theory of photoevaporation and so we conclude that entropy advection will not be enough even if we consider post-formation photoevaporative mass loss and that further limiting processes such as late-stage assembly is still required.
Alternatively, Inamdar & Schlichting (2016) demonstrated how giant impacts post-formation (i.e., after the disk gas has completely dissipated away) can result in a loss of approximately half the envelope mass. Thus, the fully formed dusty envelopes of Figure 3 even at 1 AU could become mini-Neptunes following one or two giant collisions over billion years timescales. It remains unclear however whether the lost material following impact is accreted back to the planet or ejected from the system, unbound from the orbit. Furthermore, N-body calculations report systems that tend to complete the last mergers in gas-free environments end up with rocky planets (2; see Figures 4 and 8 of MacDonald et al. (2020)) whereas systems with enough material to create more gas-enveloped mini-Neptunes tend to complete the last mergers in gas-poor but not gas-free environments. We conclude that mass loss by giant impacts may not be so relevant for mini-Neptune populations.
4.3 Planet population past 1 AU
Currently, little is known about the population of low-mass planets beyond 1 AU as they are mostly detected by transit methods which are only sensitive to orbital periods 300 days (e.g., Petigura et al., 2018; Hsu et al., 2019; Wilson et al., 2022). The Nancy Grace Roman Space Telescope set to launch in mid-2020 promises to provide some answers with space based microlensing surveys that are uniquely capable of probing masses as low as 0.01 at a few AU (Gaudi et al., 2021; Zhu & Dong, 2021). The amount of gas a planet can accrete depends most sensitively on the mass of the core (Lee & Chiang, 2015; Lee, 2019), a result that is consistent with our calculation (see Figure A.1). Therefore, in this section, we discuss how the current and future measurements of planet masses and mass distribution can be leveraged to distinguish between different formation conditions (e.g., dusty vs. dust-free accretion, core assembly time, penetration depth of advective flows) at orbital distances from 0.1 to a few AU.
We focus our attention on sub-Saturns—planets with radii 3–8 which are the boundary population between more gas-poor mini-Neptunes and more gas-rich Jupiters. These planets are unambiguously enveloped by H/He-dominated gas rendering their model-inferred gas-to-core mass ratios more accurate and less subject to the degeneracy between different chemical compositions (e.g., Petigura et al., 2017).222While Petigura et al. (2017) define the lower limit of sub-Saturn radius as 4, we choose slightly smaller 3 based on the distinct clusters shown in bulk density-mass space as shown in Figure 1 of Luque & Pallé (2022) as well as the clear departure of planets at radii beyond 3 from the waterworlds and rocky planets in the mass-radius space shown in Figure 1 of Otegi et al. (2020).
Because the planets formally begin their runaway gas accretion at GCR 0.5 (see Figure 5), we define the mass of the core that reaches this GCR for a given set of formation conditions as the maximal core mass that defines the boundary between those that are gas-poor (and so we can still probe the masses of their cores) vs. those that are gas-rich (and so their masses are dominated by the gas). We solve for this core mass by inverting GCR scalings of Lee & Chiang (2015) modified for the core radius-mass relation of Equation (10) and the dependence on that we found in Equation (23) which takes the form
| (24) |
where we use the values of presented in Figure 4 and and are computed at each orbital distance. We fix the initial unrestricted envelope to GCR0 = 0.08 and to the associated computed time .
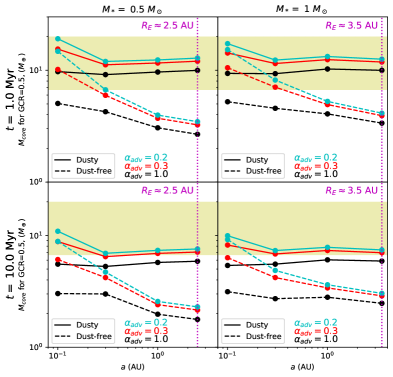
At short orbital distances, our model-predicted maximal core mass can be directly compared with observations using the measured masses and radii of sub-Saturns. From a visual inspection of Figure 1 of Otegi et al. (2020) and Luque & Pallé (2022), we see that the total masses of such planets range from 10–30 for both solar-type stars and M dwarfs. We divide this total mass by 1.5 to obtain the inferred core mass assuming a typical GCR of 0.5 (shaded region in Figure 8).
As demonstrated in Figure 8, the maximal core mass under dusty accretion is generally independent of orbital distance (because the rate of accretion is set by H2 dissociation and H- opacity which are insensitive to boundary conditions) and larger than that expected from dust-free accretion (because dusty opacity is generally higher than dust-free opacity), in agreement with Lee et al. (2014). Under dust-free accretion, the maximal core mass decreases to 2–4 beyond 1 AU, as expected due to diminished opacity farther away from the star where the disk is colder. We find that at 0.3 AU, both dusty and dust-free accretion provide similar maximal core of 10 in agreement with current observations. At wider orbits, the two opacity models diverge so it is potentially possible to observationally distinguish between the two formation models. Other parameters such as the total time allotted for gas accretion (at least between 1 and 10 Myr) and effect factors of 2 differences and so would be more difficult to disambiguate using planet mass alone.
Current radial velocity measurements are insensitive to these small mass planets beyond 1 AU. While microlensing studies of Suzuki et al. (2018) report a potential break in the planet mass distribution at mass ratio 710-5 (consistent with 12 assuming 0.5 host star), the shape of the distribution below this mass ratio is not well constrained and so it remains unclear whether the break is real or not. Theoretically, we would expect such a break to appear at a transition mass between gas-poor and gas-rich planets as the former would more closely track the underlying core mass distribution whereas the latter would track the physics of gas accretion.
In order to provide a more direct prediction of our model that is applicable to microlensing measurements which are more sensitive to M dwarf host stars, we construct the gas accretion evolution of planets around 0.5 host stars and renormalize our scaling relationship to compute the maximal core mass. We adopt a cooler disk midplane temperature scaling Equation (12) by following Chachan & Lee (2023); in addition, would also change accordingly given that . As shown in the left panels of Figure 8, there is little difference in our maximal core mass between 0.5 and 1.0 host stars because the changes in make minor differences in our boundary conditions. Like the 1.0 case, we find that the maximal core mass is 2–3 at for dust-free accretion around M dwarfs, significantly smaller than 6–13 expected from dusty accretion around the same host stars. These two limits can be compared to the measurements of breaks in planet mass distributions from future microlensing surveys in order to determine the role of dust opacity (and more generally any physical process that gives rise to orbital-distance-dependent opacities; Chachan et al. 2021) in shaping planet population at orbits beyond 1 AU.
5 Conclusion
We have investigated the role of atmospheric recycling in delaying or halting gas accretion by cooling onto planetary cores embedded in gas-rich nebula. Our main findings are summarized as follows:
-
1.
When more realistic EOS and opacities are taken into account, along with proper accounting of surface energies in thermal evolution, except for a very specific scenario (dusty accretion, , 0.1 AU), advection alone is insufficient to produce mini-Neptunes because even if runaway may be avoided, the final envelope mass fraction of mini-Neptune mass planets would be 0.2, too large to explain their measured masses and radii. Further limiting process such as late-time core assembly is required.
-
2.
At close-in distances (0.1 AU), the outer advective layer is expected to be isentropic with the disk while at large distances (1 AU), this outer layer is found to be more radiative so that the effect of entropy advection is more pronounced at 0.1 AU compared to 1 AU.
-
3.
The dependence of the final gas-to-core mass ratio (GCR) on the penetration depth of advective flow generally strengthens for deeper flows (lower ) and at close-in orbital distances. The critical where the behavior of the GCR- scaling relationship changes is at the locations of radiative-convective boundaries in unrestricted () envelopes.
-
4.
The critical core mass that separates gas-poor vs. gas-rich planets is most sensitively determined by the nature of opacity (dusty vs. dust-free) more so than the core assembly times and and they deviate more at larger orbital distances beyond 1 AU where a measurement in a break in planet mass distribution using e.g., microlensing survey can distinguish between dusty vs. dust-free gas accretion at these distances.
Our findings highlight the importance of EOS and opacities in regulating the thermal evolution of planetary envelopes which are the key difference between our calculations than that of e.g., Ali-Dib et al. (2020) that lead to different conclusions. Future three-dimensional hydrodynamic simulations that employ realistic EOS and opacities over a wide range of orbital distances would be welcome to verify the 1D calculations showcased in this work.
We are indebted to Jason Ferguson for extending and sharing his opacity tables, and we thank Zhaohuan Zhu for his insight and helpful discussions. We also thank Andrew Cumming for his feedback on the initial version of this paper. V.S. acknowledges the support of the Natural Sciences and Engineering Research Council of Canada (NSERC), of le Fonds de recherche du Québec – Nature et technologies (FRQNT) and of the Trottier Institute for Research on Exoplanets (iREx) under the Trottier Excellence Grant for Summer Interns. E.J.L. gratefully acknowledges support by NSERC, by FRQNT, by the Trottier Space Institute, and by the William Dawson Scholarship from McGill University.
Appendix A Parameter study
A gallery of envelope mass growth profiles across our entire parameter space is presented in Figure A.1. We recover the strong dependence of GCR on the core mass finding a more massive 10 core to undergo runaway accretion in unrestricted envelopes (e.g., Mizuno, 1980; Stevenson, 1982; Pollack et al., 1996; Ikoma et al., 2000). While keeping 0.4 is enough to avoid runaway for these massive cores at 0.1 AU, even under severe penetration of advective flows (), runaway is already unavoidable at 1 AU for formation in gas-rich environments, showcasing the need for further limiting process (see Section 4.2) is particularly dire for massive cores.
References
- Ali-Dib et al. (2020) Ali-Dib, M., Cumming, A., & Lin, D. N. C. 2020, Monthly Notices of the Royal Astronomical Society, 494, 2440, doi: 10.1093/mnras/staa914
- Batalha et al. (2013) Batalha, N. M., Rowe, J. F., Bryson, S. T., et al. 2013, ApJS, 204, 24, doi: 10.1088/0067-0049/204/2/24
- Bell & Lin (1994) Bell, K. R., & Lin, D. N. C. 1994, ApJ, 427, 987, doi: 10.1086/174206
- Béthune & Rafikov (2019) Béthune, W., & Rafikov, R. R. 2019, MNRAS, 488, 2365, doi: 10.1093/mnras/stz1870
- Burke et al. (2015) Burke, C. J., Christiansen, J. L., Mullally, F., et al. 2015, ApJ, 809, 8, doi: 10.1088/0004-637X/809/1/8
- Chachan & Lee (2023) Chachan, Y., & Lee, E. J. 2023, ApJ, 952, L20, doi: 10.3847/2041-8213/ace257
- Chachan et al. (2021) Chachan, Y., Lee, E. J., & Knutson, H. A. 2021, ApJ, 919, 63, doi: 10.3847/1538-4357/ac0bb6
- Chiang & Laughlin (2013) Chiang, E., & Laughlin, G. 2013, MNRAS, 431, 3444, doi: 10.1093/mnras/stt424
- Chiang & Goldreich (1997) Chiang, E. I., & Goldreich, P. 1997, ApJ, 490, 368, doi: 10.1086/304869
- Choksi & Chiang (2020) Choksi, N., & Chiang, E. 2020, MNRAS, 495, 4192, doi: 10.1093/mnras/staa1421
- Dawson et al. (2016) Dawson, R. I., Lee, E. J., & Chiang, E. 2016, ApJ, 822, 54, doi: 10.3847/0004-637X/822/1/54
- Dong & Zhu (2013) Dong, S., & Zhu, Z. 2013, The Astrophysical Journal, 778, 53, doi: 10.1088/0004-637X/778/1/53
- Ferguson et al. (2005) Ferguson, J. W., Alexander, D. R., Allard, F., et al. 2005, ApJ, 623, 585, doi: 10.1086/428642
- Fressin et al. (2013) Fressin, F., Torres, G., Charbonneau, D., et al. 2013, ApJ, 766, 81, doi: 10.1088/0004-637X/766/2/81
- Fung et al. (2015) Fung, J., Artymowicz, P., & Wu, Y. 2015, The Astrophysical Journal, 811, 101, doi: 10.1088/0004-637x/811/2/101
- Gaudi et al. (2021) Gaudi, B. S., Meyer, M., & Christiansen, J. 2021, in ExoFrontiers (IOP Publishing), doi: 10.1088/2514-3433/abfa8fch2
- Ginzburg et al. (2016) Ginzburg, S., Schlichting, H. E., & Sari, R. 2016, ApJ, 825, 29, doi: 10.3847/0004-637X/825/1/29
- Grevesse & Noels (1993) Grevesse, N., & Noels, A. 1993, in Origin and Evolution of the Elements, ed. N. Prantzos, E. Vangioni-Flam, & M. Casse, 15–25
- Howard et al. (2010) Howard, A. W., Marcy, G. W., Johnson, J. A., et al. 2010, Science, 330, 653, doi: 10.1126/science.1194854
- Hsu et al. (2019) Hsu, D. C., Ford, E. B., Ragozzine, D., & Ashby, K. 2019, AJ, 158, 109, doi: 10.3847/1538-3881/ab31ab
- Ikoma et al. (2000) Ikoma, M., Nakazawa, K., & Emori, H. 2000, ApJ, 537, 1013, doi: 10.1086/309050
- Inamdar & Schlichting (2016) Inamdar, N. K., & Schlichting, H. E. 2016, The Astrophysical Journal, 817, L13, doi: 10.3847/2041-8205/817/2/l13
- Izidoro et al. (2021) Izidoro, A., Bitsch, B., Raymond, S. N., et al. 2021, A&A, 650, A152, doi: 10.1051/0004-6361/201935336
- Izidoro et al. (2017) Izidoro, A., Ogihara, M., Raymond, S. N., et al. 2017, MNRAS, 470, 1750, doi: 10.1093/mnras/stx1232
- Jin et al. (2014) Jin, S., Mordasini, C., Parmentier, V., et al. 2014, ApJ, 795, 65, doi: 10.1088/0004-637X/795/1/65
- Kurokawa & Tanigawa (2018) Kurokawa, H., & Tanigawa, T. 2018, MNRAS, 479, 635, doi: 10.1093/mnras/sty1498
- Lambrechts & Lega (2017) Lambrechts, M., & Lega, E. 2017, A&A, 606, A146, doi: 10.1051/0004-6361/201731014
- Lammers et al. (2023) Lammers, C., Hadden, S., & Murray, N. 2023, MNRAS, 525, L66, doi: 10.1093/mnrasl/slad092
- Lee (2019) Lee, E. J. 2019, ApJ, 878, 36, doi: 10.3847/1538-4357/ab1b40
- Lee & Chiang (2015) Lee, E. J., & Chiang, E. 2015, The Astrophysical Journal, 811, 41, doi: 10.1088/0004-637x/811/1/41
- Lee & Chiang (2016) Lee, E. J., & Chiang, E. 2016, ApJ, 817, 90, doi: 10.3847/0004-637X/817/2/90
- Lee & Chiang (2017) —. 2017, ApJ, 842, 40, doi: 10.3847/1538-4357/aa6fb3
- Lee et al. (2018) Lee, E. J., Chiang, E., & Ferguson, J. W. 2018, MNRAS, 476, 2199, doi: 10.1093/mnras/sty389
- Lee et al. (2014) Lee, E. J., Chiang, E., & Ormel, C. W. 2014, The Astrophysical Journal, 797, 95, doi: 10.1088/0004-637x/797/2/95
- Lee et al. (2022) Lee, E. J., Karalis, A., & Thorngren, D. P. 2022, ApJ, 941, 186, doi: 10.3847/1538-4357/ac9c66
- Lopez & Fortney (2014) Lopez, E. D., & Fortney, J. J. 2014, The Astrophysical Journal, 792, 1, doi: 10.1088/0004-637x/792/1/1
- Lopez et al. (2012) Lopez, E. D., Fortney, J. J., & Miller, N. 2012, ApJ, 761, 59, doi: 10.1088/0004-637X/761/1/59
- Luque & Pallé (2022) Luque, R., & Pallé, E. 2022, Science, 377, 1211, doi: 10.1126/science.abl7164
- MacDonald et al. (2020) MacDonald, M. G., Dawson, R. I., Morrison, S. J., Lee, E. J., & Khandelwal, A. 2020, ApJ, 891, 20, doi: 10.3847/1538-4357/ab6f04
- Mamajek (2009) Mamajek, E. E. 2009, in American Institute of Physics Conference Series, Vol. 1158, Exoplanets and Disks: Their Formation and Diversity, ed. T. Usuda, M. Tamura, & M. Ishii, 3–10, doi: 10.1063/1.3215910
- Michel et al. (2021) Michel, A., van der Marel, N., & Matthews, B. C. 2021, ApJ, 921, 72, doi: 10.3847/1538-4357/ac1bbb
- Mizuno (1980) Mizuno, H. 1980, Progress of Theoretical Physics, 64, 544, doi: 10.1143/PTP.64.544
- Moldenhauer et al. (2021) Moldenhauer, T. W., Kuiper, R., Kley, W., & Ormel, C. W. 2021, A&A, 646, L11, doi: 10.1051/0004-6361/202040220
- Ormel et al. (2015) Ormel, C. W., Shi, J.-M., & Kuiper, R. 2015, MNRAS, 447, 3512, doi: 10.1093/mnras/stu2704
- Otegi et al. (2020) Otegi, J. F., Bouchy, F., & Helled, R. 2020, A&A, 634, A43, doi: 10.1051/0004-6361/201936482
- Owen & Wu (2013) Owen, J. E., & Wu, Y. 2013, ApJ, 775, 105, doi: 10.1088/0004-637X/775/2/105
- Owen & Wu (2017) —. 2017, ApJ, 847, 29, doi: 10.3847/1538-4357/aa890a
- Petigura et al. (2013) Petigura, E. A., Howard, A. W., & Marcy, G. W. 2013, Proceedings of the National Academy of Science, 110, 19273, doi: 10.1073/pnas.1319909110
- Petigura et al. (2017) Petigura, E. A., Sinukoff, E., Lopez, E. D., et al. 2017, AJ, 153, 142, doi: 10.3847/1538-3881/aa5ea5
- Petigura et al. (2018) Petigura, E. A., Marcy, G. W., Winn, J. N., et al. 2018, AJ, 155, 89, doi: 10.3847/1538-3881/aaa54c
- Piso & Youdin (2014) Piso, A.-M. A., & Youdin, A. N. 2014, ApJ, 786, 21, doi: 10.1088/0004-637X/786/1/21
- Piso et al. (2015) Piso, A.-M. A., Youdin, A. N., & Murray-Clay, R. A. 2015, ApJ, 800, 82, doi: 10.1088/0004-637X/800/2/82
- Pollack et al. (1996) Pollack, J. B., Hubickyj, O., Bodenheimer, P., et al. 1996, Icarus, 124, 62, doi: 10.1006/icar.1996.0190
- Popovas et al. (2018) Popovas, A., Nordlund, Å., Ramsey, J. P., & Ormel, C. W. 2018, Monthly Notices of the Royal Astronomical Society, 479, 5136, doi: 10.1093/mnras/sty1752
- Rogers & Owen (2021) Rogers, J. G., & Owen, J. E. 2021, MNRAS, 503, 1526, doi: 10.1093/mnras/stab529
- Rogers & Seager (2010) Rogers, L. A., & Seager, S. 2010, The Astrophysical Journal, 712, 974, doi: 10.1088/0004-637x/712/2/974
- Rowe et al. (2014) Rowe, J. F., Bryson, S. T., Marcy, G. W., et al. 2014, ApJ, 784, 45, doi: 10.1088/0004-637X/784/1/45
- Stevenson (1982) Stevenson, D. J. 1982, Planet. Space Sci., 30, 755, doi: 10.1016/0032-0633(82)90108-8
- Suzuki et al. (2018) Suzuki, D., Bennett, D. P., Ida, S., et al. 2018, ApJ, 869, L34, doi: 10.3847/2041-8213/aaf577
- Valencia et al. (2006) Valencia, D., O’Connell, R. J., & Sasselov, D. 2006, Icarus, 181, 545, doi: https://doi.org/10.1016/j.icarus.2005.11.021
- Weiss & Marcy (2014) Weiss, L. M., & Marcy, G. W. 2014, ApJ, 783, L6, doi: 10.1088/2041-8205/783/1/L6
- Wilson et al. (2022) Wilson, R. F., Cañas, C. I., Majewski, S. R., et al. 2022, AJ, 163, 128, doi: 10.3847/1538-3881/ac3a06
- Wolfgang & Lopez (2015) Wolfgang, A., & Lopez, E. 2015, ApJ, 806, 183, doi: 10.1088/0004-637X/806/2/183
- Wu & Lithwick (2013) Wu, Y., & Lithwick, Y. 2013, ApJ, 772, 74, doi: 10.1088/0004-637X/772/1/74
- Zhong & Yu (2021) Zhong, W., & Yu, C. 2021, ApJ, 922, 215, doi: 10.3847/1538-4357/ac2cc5
- Zhou et al. (2007) Zhou, J.-L., Lin, D. N. C., & Sun, Y.-S. 2007, ApJ, 666, 423, doi: 10.1086/519918
- Zhu & Dong (2021) Zhu, W., & Dong, S. 2021, ARA&A, 59, 291, doi: 10.1146/annurev-astro-112420-020055
- Zhu et al. (2018) Zhu, W., Petrovich, C., Wu, Y., Dong, S., & Xie, J. 2018, ApJ, 860, 101, doi: 10.3847/1538-4357/aac6d5
- Zhu et al. (2022) Zhu, Z., Bailey, A., Macías, E., Muto, T., & Andrews, S. M. 2022, Directly Detecting the Envelopes of Low-mass Planets Embedded In Protoplanetary discs and The Case For TW Hydrae, arXiv, doi: 10.48550/ARXIV.2204.04404
- Zhu et al. (2021) Zhu, Z., Jiang, Y.-F., Baehr, H., et al. 2021, Monthly Notices of the Royal Astronomical Society, 508, 453, doi: 10.1093/mnras/stab2517