v#1
Fast production of cosmological emulators in modified gravity: the matter power spectrum
Abstract
We test the convergence of fast simulations based on the COmoving Lagrangian Acceleration (COLA) method for predictions of the matter power spectrum, specialising our analysis in the redshift range , relevant to high-redshift spectroscopic galaxy surveys. We then focus on the enhancement of the matter power spectrum in modified gravity (MG), the boost factor, using the Dvali-Gabadadze-Porrati (DGP) theory as a test case but developing a general approach that can be applied to other MG theories. After identifying the minimal simulation requirements for accurate DGP boost factors, we design and produce a COLA simulation suite that we use to train a neural network emulator for the DGP boost factor. Using MG-AREPO simulations as a reference, we estimate the emulator accuracy to be of up to at . We make the emulator publicly available at: https://github.com/BartolomeoF/nDGPemu.
1 Introduction
With the successful launch of the Euclid222https://www.euclid-ec.org/ satellite and the DESI333https://www.desi.lbl.gov collaboration releasing their survey data [1], cosmology is living a very exciting time. The extraordinarily large amount of galaxies that these surveys will observe is fuelling the efforts of the scientific community aimed at accurately modelling the non-linear regime of structure formation to obtain precise cosmological constraints.
One of the key objectives of next-generation surveys is to shed light on the nature of gravity by constraining alternative gravity models. The simplest modified gravity (MG) theories can be described by means of a fifth force mediated by an additional scalar field. Given the stringent constraints coming from solar system tests of gravity, MG theories of interest to cosmology incorporate screening mechanisms which suppress the fifth force in specific environments. Hence, the large-scale structure (LSS) of the Universe provides a unique laboratory to test the validity of GR and explore alternative gravity models. By comparing LSS probes with theoretical predictions, we can place constraints on the deviations from GR and potentially uncover new physics.
Yet, accessing the non-linear regime of structure formation presents significant challenges. Analytical techniques, such as perturbation theory, break down in this regime, and numerical simulations become essential. Cosmological simulations play a vital role in studying the formation and evolution of structures, enabling us to investigate the complex interplay between gravity, dark matter (DM), and baryonic physics. To simulate structure formation on the smallest scales, DM-only N-body simulations are not enough and it is necessary to run hydrodynamical simulations which incorporate the effects of baryonic matter. However, despite the advances in simulating baryonic physics, hydrodynamical simulations show important discrepancies in their small-scales predictions [2], so weak lensing data below baryonic-feedback scales is discarded in cosmological analysis (e.g. see [3, 4]).
Furthermore, cosmological simulations are computationally demanding, requiring substantial computational resources and time. To overcome these computational challenges, the development of efficient methods to speed up simulations has been a topic of active research. One such method is the COmoving Lagrangian Acceleration (COLA) method [5], which combines second-order Lagrangian Perturbation Theory (2LPT) with the Particle Mesh N-body technique to accurately reproduce the non-linear dynamics of structure formation while significantly reducing computational costs. In particular, COLA exploits the fact that long-range forces perceived by the N-body particles in a frame comoving with the 2LPT solution are weaker than the ones perceived in the Eulerian frame. This allows COLA simulations to use a coarser time-resolution while providing an accurate description of the matter distribution on large scales [5, 6]. An interesting alternative approach recently developed in [7], proposes the use of non-symplectic integrators inspired by LPT to recover the correct large-scale evolution in PM simulations without the need to explicitly compute the 2LPT solution.
The potential of the COLA method was already exploited in [8] to produce mock galaxy catalogues for the analysis of the WiggleZ survey [9], where it was shown that COLA simulations can be used to create synthetic galaxy catalogues with comparable accuracy to the full N-body code Gadget [10] on scales . Since then, the COLA method has seen several extensions:
-
•
to create more accurate halo catalogues [6],
- •
- •
-
•
to include the effects of massive neutrinos [17].
Of particular interest to this work is the extension to MG theories presented in [14] and as implemented in the publicly available library \codewordFML444https://fml.wintherscoming.no. This relies on the extension to MG of the 2LPT solutions and to an approximation of the screening mechanisms based on the analytic solution in spherical symmetry [18] which is provided for the Vainshtein and chameleon screening mechanisms. Recently, an alternative technique to approximate the Vainshtein screening [19] has been revised and implemented in a custom version of \codewordFML-COLA [20].
Despite the speed-up brought by fast simulation methods like COLA, the computational cost of simulations is still too high to allow a fine sampling of the vast theory parameter space that is needed in Monte Carlo searches to infer precise parameter constraints. One possible solution to this problem is to approximate the predictions of cosmological simulations for specific summary statistics making use of machine learning techniques [21, 22] or fitting functions (see for instance [23]). The resulting approximating functions are normally referred to as emulators in the field and their key feature is that they provide theoretical predictions at extremely small computational cost. Accurate emulators for the matter power spectrum, one of the most elementary summary statistics that can be predicted thanks to simulations, are available for standard cosmologies [24, 25]. Matter power spectrum emulators have been developed also in MG gravity theories such as [26, 27, 28, 29, 30] in Hu-Sawicki model [31], and [32] in the Dvali-Gabadadze-Porrati (DGP) model [33]. Interesting alternative approaches based on the halo model were also developed to predict the matter power spectrum in MG theories [34, 35, 36].
Due to the many subtleties that characterise N-body simulations and to the approximate nature of emulators, these tools need to be validated. This can be done for example by means of comparisons between different approaches [37, 24, 25]. In the case of N-body simulations, it is also important to check that the agreement with the other codes is not just due to a coincidence and that the predictions converge to the true answer when increasing resolution.
In this work we push the COLA method to its limits to study the convergence of COLA predictions for the matter power spectrum and its enhancement in MG, the boost factor. We employ the results of this analysis to design and produce an emulator for the matter power spectrum in DGP gravity that we publicly release together with this paper. While in this work we focus on DGP gravity, the framework that we develop is quite general and can be applied to other MG theories.
The remainder of this paper is organised as follows. In section 2 we provide an in-depth analysis of the convergence and validation of COLA simulations for prediction of the DM power spectrum in GR. In section 3 we extend the convergence analysis to the nDGP boost factor for the DM power spectrum and present an emulator for this signal trained on COLA simulations. Finally, we come to our conclusions in section 4.
2 Convergence tests
Cosmological simulations are subject to errors due to the finite resolution characterising their numerical implementation. In the case of N-body simulations, time-resolution, force-resolution and mass-resolution are important quantities which control the simulation accuracy [38, 39, 24]. To validate simulation results it is necessary to compare the output of simulations against well-established results like analytic predictions or previous simulations already validated (e.g., in [16, 40] we validated COLA simulations by comparing them with ELEPHANT simulations). Furthermore, the self-consistency of a simulation technique can be established by performing relative convergence tests, where simulations with different resolutions are compared to understand the reliability of specific simulation settings.
The COLA method exploits the 2LPT and the Particle-Mesh (PM) method to evolve the DM distribution. The use of 2LPT allows us to reduce the time resolution of simulations without losing accuracy on large scales [6]. Conversely, increasing the time resolution makes the use of 2LPT less important and with sufficient time resolution, the simulations evolve like PM-only simulations. In this sense, we will refer to COLA simulations with high time resolution as PM simulations in the following sections. This equivalence is important since the accuracy of PM simulations (and therefore of COLA simulations in CDM) is only limited by resolution and they converge to full N-body simulations results with increasing resolution [41]. However, when comparing COLA with PM-only algorithms, it is not fair to compare their computational cost using the same number of time-steps as done in [38]. In fact, COLA does not necessarily need as many time-steps as PM-only simulations to achieve comparable accuracy. This is evident in the low time-resolution case, where the 2LPT guarantees that COLA provides accurate results on large scales while PM-only simulations already show significant deviations [6]. Even in the high time-resolution case, COLA can achieve the same accuracy as PM-only codes with fewer time-steps. Indeed, the latter needs a finer time-stepping at high redshift to deal with the rapidly changing growth factor [38] while the 2LPT guarantees good accuracy at high redshift in COLA even with larger time-steps [5, 6]. For instance, the PM code \codewordGLAM needs 147 time-steps to have at [38] while COLA needs only time-steps for the same low-redshift time resolution.
The focus of this section is to validate COLA simulations for the predictions of the matter power spectrum. To do so, we first introduce the cosmological emulators in subsection 2.1, then we compare COLA results with full N-body simulations and cosmological emulators in subsection 2.2, and finally, we study the relative-convergence of COLA simulations for the matter power spectrum in subsection 2.3.
2.1 Cosmological emulators
Cosmological emulators interpolate the results of computationally expensive cosmological simulations in high-dimensional parameter spaces. Two notable such emulators are the Bacco emulator [25] and the Euclid Emulator 2 (EE2) [24]. While these emulators differ on many aspects (e.g. the interpolation techniques employed, the parameter space spanned and the N-body techniques used for the training set) they have been shown to be in agreement with each other within the claimed accuracy [24, 42] for several test cosmologies.
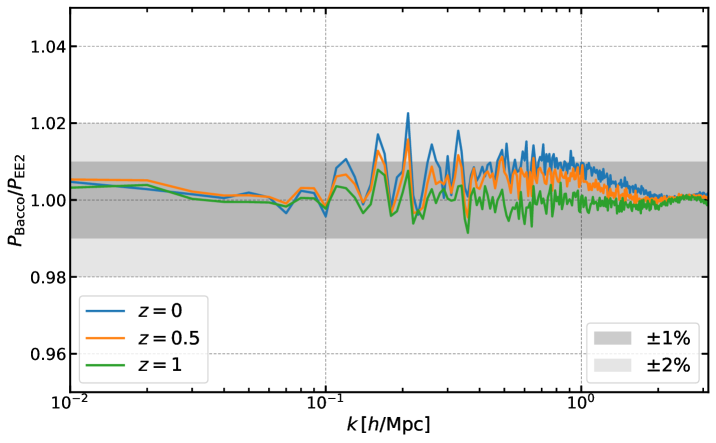
Here in particular we are interested in the agreement between these two emulators for a specific cosmology, the one that was used to run the N-body simulation suite that we will discuss in subsection 2.2. In figure 1 we show the ratio of the matter power spectra estimated with Bacco and EE2 at redshifts , and for the above-mentioned cosmology (see eq 2.1). The agreement is within at all the scales considered. At , the agreement is well within . This is consistent with the accuracy claimed by the two emulators and gives additional reliability to the emulators’ results, in particular at redshift , that we use in the next subsection to prove the accuracy of COLA simulations for predictions of the matter power spectrum.
2.2 Comparison of COLA with emulators and N-body simulations
As reference results to compare COLA with, we make use of the power spectra obtained from a suite of DM-only simulations in GR and nDGP gravity555The nDGP results (for values of 0.5, 1, 2, 5) are used in section 3. ran with \codewordMG-AREPO [43, 44] which uses the tree-particle-mesh technique for gravitational interactions and a moving mesh to solve the hydrodynamic equations (see references [45, 10] for more on the N-body techniques at the base of this code). The simulations were started at redshift using the cosmological parameters
| (2.1) |
and evolved down to redshift using particles in a box [46].
To assess the accuracy of COLA simulations we produce a suite of simulations in a Mpc box, with the same cosmology of the Arepo simulations and with different mass resolutions (), time resolutions () and with force resolutions depending on the mass resolutions ( for and for ). We start the simulations at redshift and stop them at redshift . The choice of 25 time-steps as the low time-resolution case is motivated by the time-step size of typical COLA configurations (). In the high time-resolution case, where the late-time evolution is PM-like, 75 time-steps produce a time-step size of . This is the same step size of the reference simulations used in the convergence tests of \codewordGLAM at [38].
In the next subsection, we will use the highest resolution PM run (, , ) as the reference to assess the accuracy of all the other runs. Before that, we validate the highest resolution run by comparing its matter power spectrum with the ones from the Bacco emulator and from the Arepo simulations. In Figure 2
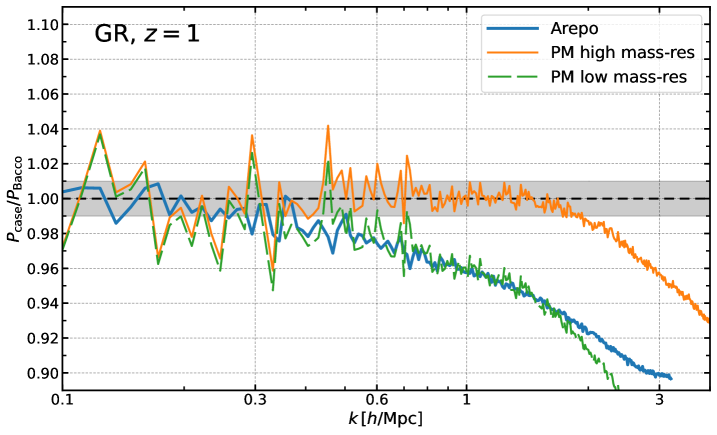
we plot the ratio of the matter power spectra of PM and Arepo simulations with the Bacco power spectrum for the cosmology of eq. (2.1), in GR at redshift 1. The first thing that comes to the eye, is that the Arepo power spectrum (green line) departs from Bacco already at /Mpc, and at Mpc the discrepancy is already at . We attribute this to the low mass resolutions of these Arepo simulations () [24], and to motivate this claim we add to the comparison the PM simulation for , , (blue line) which has a similar mass resolution of Arepo simulations. This is in good agreement with Arepo up to Mpc. The blue line instead shows that the higher resolution PM run is in sub-percent agreement with Bacco up to .
2.3 Relative convergence of COLA simulations
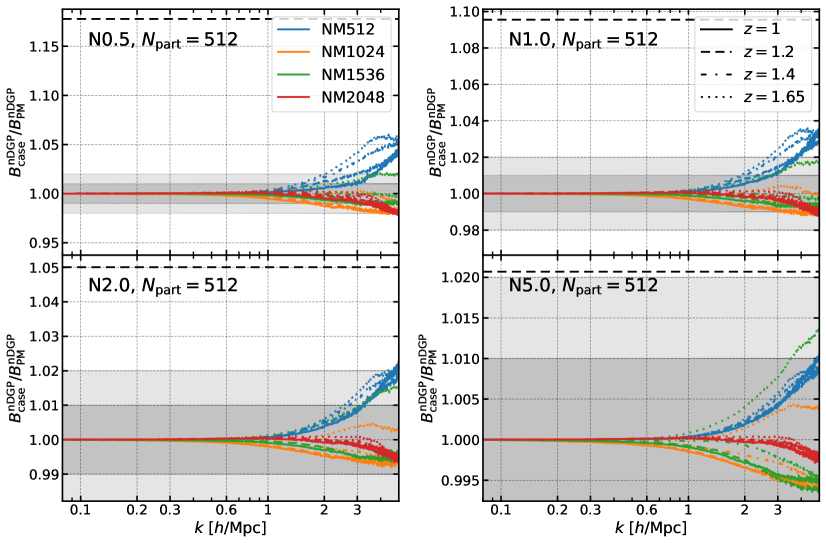
With all the simulations of the convergence suite, we compare the accuracy of all the different settings using the high-resolution run as the reference. To summarise the results, we show in different figures different mass resolutions, figure 3 for , figure 4 for , figure 5 for , and split each figure into 2 panels for two redshift values respectively on the left and on the right666This choice of redshift values is motivated by the expected redshift localisation of H emitters in the Euclid spectroscopic survey [47].. In each panel, we show the ratio of the power spectra in the COLA run with that of the high-resolution run for the various force and time resolutions described in the legends .
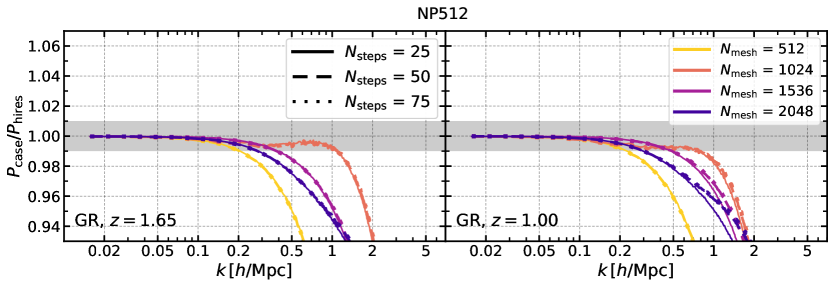
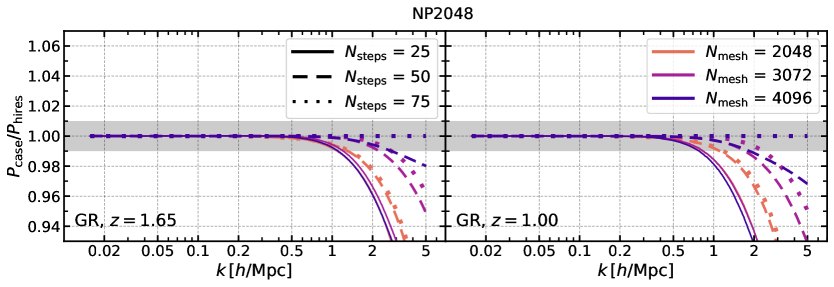
For the case, we notice that the results are almost insensitive to the time resolution and do not converge towards the high-resolution result. This is attributed to the fact that the low mass resolution has a strong effect on the scales considered in the comparison, especially for higher redshifts. In addition to this, we notice that the convergence is non-monotonic: the fact that results have significantly larger power than the ones of and is somehow surprising. From additional tests that we have run, we could identify this behaviour as being due to discreteness effects happening at high redshifts (see [48, 49] for recent progress on this topic) when the particles’ displacements from the Fourier grid are small in combination with the continuous Fourier space kernels used for the force computation in the PM scheme777In the FML library it is now possible to choose the technique adopted by the PM solver for the force computation. In particular, it is possible to choose the same finite differencing scheme used in codes like FastPM [50] and GLAM [38] which seems to avoid these problems of non-monotonic convergence in low mass-resolution PM simulations.. While this effect is moderate when starting the simulations at , it becomes more important when starting the simulations at higher redshift.
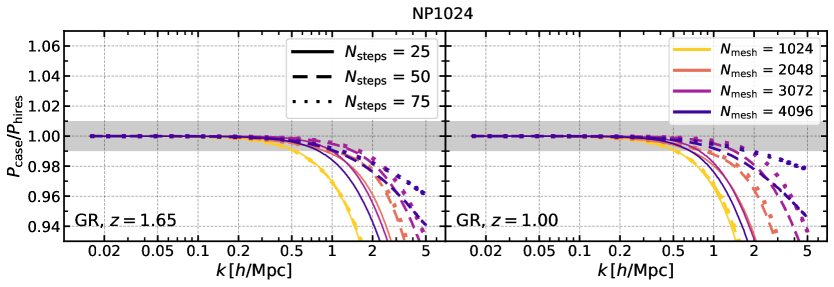
For the and cases, the convergence towards the high-resolution PM result happens only if the force and time resolutions are increased accordingly. This condition is particularly evident in the simulations with , where increasing the number of time steps from 25 to 75 keeping the fixed force resolution of does not improve the convergence toward the high-resolution run. Similarly, increasing the force resolution above but using only 25 time-steps does not improve the agreement with the highest-resolution run. We notice that, in the case, the results for high force and time resolution appear to be more converged at low redshift than at high redshift: this is due to the fact that discreteness effects are more important at early times while force resolution becomes more important at late times.
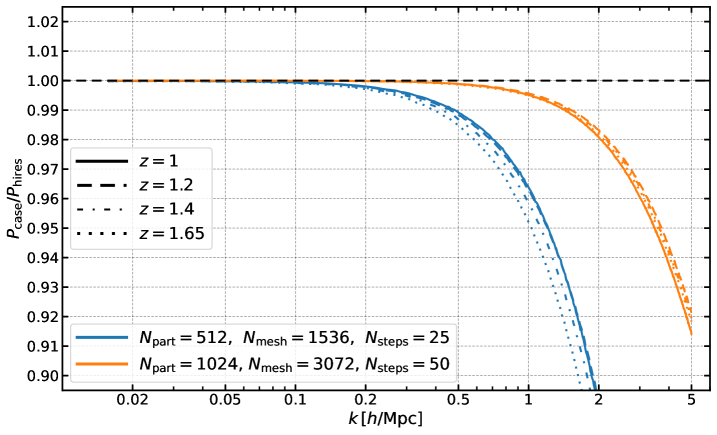
To assess the convergence of the highest-resolution run used as a reference in the previous figures, we compare in figure 6 the power spectra of lower-resolution simulations with the highest-resolution one, as done previously, but now increasing mass, force and time resolution simultaneously. The agreement between the , , run and the highest-resolution run indicates that the latter is converged at sub-percent level up to . This is in line with the result of the comparison with the Bacco emulator.
3 Modified gravity boost factor
Another interesting application of COLA simulations is to predict the matter power spectrum in MG [26]. As non-linear matter power spectrum emulators are already available, it is possible to obtain the matter power spectrum in MG by multiplying the matter power spectrum in GR with the MG boost factor
| (3.1) |
In general, the MG boost factor depends on MG parameters as well as on cosmological parameters and redshift. In the following, we focus on the DGP model and use COLA simulations to train an emulator for the matter power spectrum in this gravity theory. Nonetheless, the method that we develop is not specific to the DGP model and can be used to produce emulators for other MG theories.
The DGP gravity is a braneworld model in 5-dimensions, which has been thoroughly studied by the modified gravity community due to its interesting cosmological features [51, 52, 53]. This theory has 2 branches of solutions for the Hubble expansion on the brane [51]: a self-accelerating branch with ghost instabilities on a de Sitter background [52, 54], and a normal branch which requires fine-tuning in the form of an effective dark energy to recover the observed CDM-like expansion history [55, 56]. Nonetheless, the normal branch of the DGP theory (nDGP) also presents a non-trivial fifth force dynamics which can be described by the Vainshtein mechanism [57], so this theory was often used as a test-case representative for the class of Vainshtein-screened theories. In particular, several N-body codes were developed to simulate non-linear structure formation in nDGP theory (e.g. DGPM [55], ECOSMOG [58], MG-AREPO [59], MG-GLAM [41]) and two of them, DGPM and ECOSMOG, were showed to give consistent prediction for the matter power spectrum boost-factor in [60].
To develop the nDGP emulator, we start by studying the simulation requirements to accurately predict the nDGP boost factor with COLA and investigate the sensitivity of the boost factor to the theory parameters in subsection 3.1. Then we present the simulations suite and the data processing used to create the emulator’s data sets in subsection 3.2 and finally, we discuss the emulator’s training and performance in subsection 3.3.
3.1 Accuracy and sensitivity
The computational cost of cosmological simulations depends on several parameters. In particular, it is very sensitive to volume and resolution. With this in mind, we want to find the optimal simulation settings that allow us to have the target accuracy while probing large enough scales but without requiring excessive computational resources.
To define the simulation requirements for the nDGP emulator, we start by assessing the accuracy of COLA in predicting the boost factor of nDGP theories against Arepo simulations. To this extent, we run high-resolution PM simulations888We emphasize that PM here refers to the high time-resolution used by these COLA simulations at late time, which makes the 2LPT contribution important only at early times as discussed in section 2. It is important to note that the screening mechanism is implemented only approximately in COLA simulations for DGP gravity [18, 14, 16, 61]. For an alternative screening approximation for general Vainshtein mechanism see [20]. On the other hand, Arepo simulations solve the non-linear scalar field exactly. with the same cosmology of Arepo simulations for several values of the nDGP parameter, . We simulate the evolution of particles in a box of side using mesh-grids and 75 time-steps from redshift to . The mass resolutions that we use in the PM simulations is , roughly 8 times higher than the one of the Arepo simulations. The force resolution is and the time resolution is . We run the simulations in GR and nDGP from the same IC. For nDGP simulations we use the 4 values of the parameter (0.5, 1, 2, 5) used in the Arepo simulations suite.
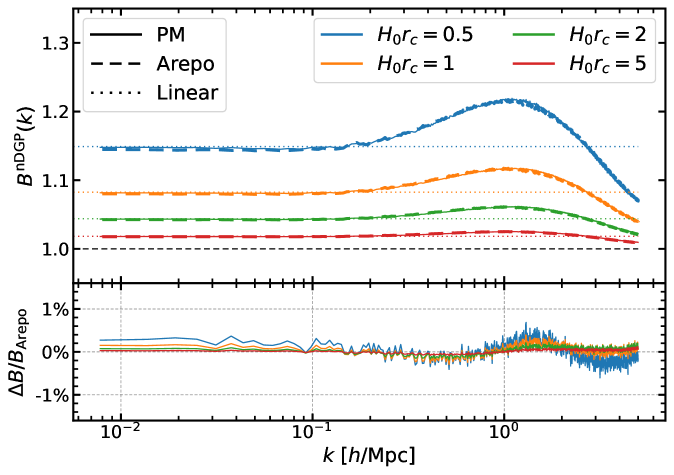
Figure 7 shows a comparison between the nDGP boost factors of PM and Arepo simulations for the different values of the parameter. We also include in the comparison the nDGP boost factor estimated from linear theory. In the top panel, we show the nDGP boost factors, while in the bottom we show the relative difference between the PM and linear boost factors from Arepo boost factors. On large scales, PM results seem to be more consistent with linear theory than the ones from Arepo simulations. Overall, we find agreement in all gravity models up to between the high-resolution simulations and Arepo simulations. This means that the screening approximation used in COLA simulations in nDGP theory [14, 16], once tuned on full N-body simulations for a single value of , is sub-percent accurate in reproducing the power spectrum boost factor of nDGP theories for a wide range of the parameter and for different redshift values 999We are using here the same screening settings adopted in [16] and tuned against Ecosmog [58] results at ..
The COLA simulations that we run in nDGP use IC produced with the back-scaling approach. The IC are set in such a way that the IC power spectrum is the same for nDGP and GR simulations. This is done by integrating the growth factors from matter domination at redshift and by normalising them at the redshift of IC
| (3.2) |
Due to this choice of normalisation, COLA simulations ignore the fact that nDGP can be different from GR also at higher redshift. In particular, COLA simulations are usually started at redshift , while nDGP effects can be significant up to redshift . We can correct this by multiplying the final power spectrum by101010For the sake of generality, we stress that this correction should not be used when providing input power spectra for the MG simulations which already take into account MG effects at high redshift. Furthermore, this correction may be irrelevant for MG models whose modifications are weaker than those of the nDGP model at high redshift.
| (3.3) |
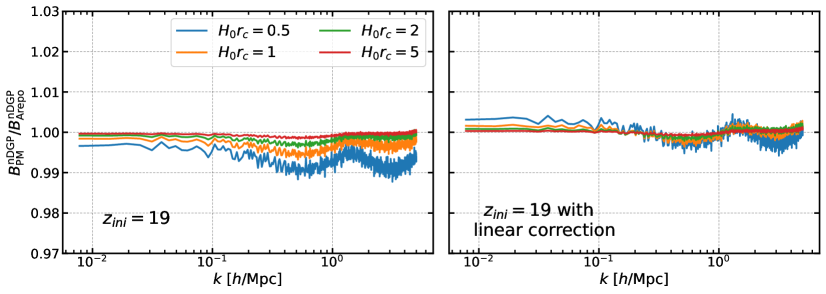
which has the effect of re-scaling the amplitude of the power spectrum as if the simulations were started at redshift . This approach neglects the effects of non-linearity before , but these are sub-dominant due to the weakness of the nDGP fifth force at early times. The importance of this correction is evident from figure 8, where we show that the agreement with Arepo of the nDGP boost factors from PM simulations started at is improved when applying the linear correction. In fact, the raw results of PM simulations show deviations from Arepo (left panel), while they are in better than agreement with Arepo once corrected using eq (3.3) (right panel).
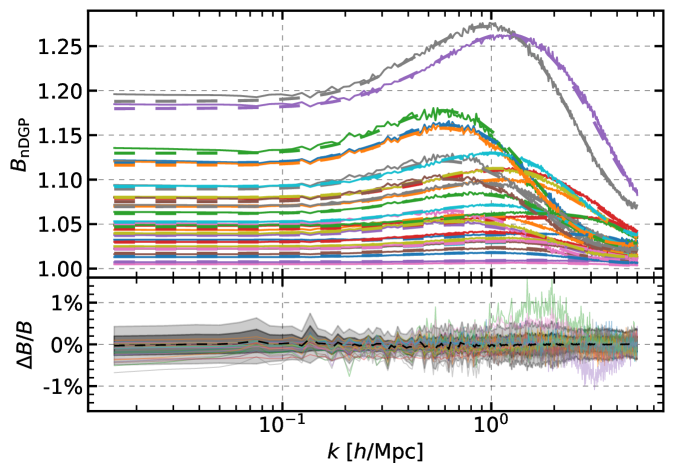
Having tested the accuracy of COLA simulations in the PM-limit in reproducing the nDGP boost factor, we want to test the impact of force and mass resolution on the nDGP boost factor in COLA simulations to find the optimal setup to span the theory parameter space running a large number of simulations. To do so, we run more COLA simulations in a box of side with lower mass-resolution (, similarly to Arepo simulations), with time-resolution and with 4 force resolutions: (low force resolution), , , (high force resolution). We compare the results for the nDGP boost factor of low mass-resolutions COLA simulations with high-resolutions PM simulations in figure 9 where we can see that the results are converged at sub-percent level up to and the force resolution has a significant impact on the boost factor only on very small scales, . The results of the intermediate cases, and , are consistent with the high-resolution PM simulations within up to .
Before choosing a strategy to sample the parameter space for producing the emulator’s training set, we explore the impact that each parameter has on the boost factor. To do so we first investigate the range of values that the parameter should span: for stronger deviations from GR we choose deviations as the upper limit, while for the other limit, we want to "smoothly" connect to GR so we look for models where the deviation is (i.e., below our target accuracy). Based on previous results in the literature [62], we select as the strong deviation case and as the weak deviation case.
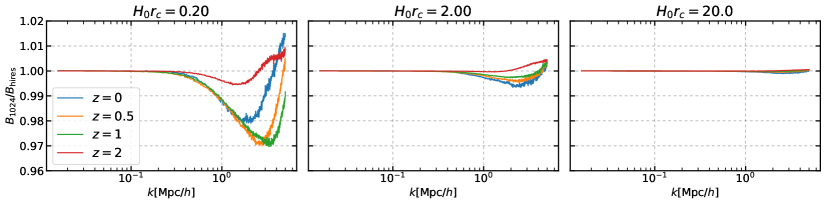
The results of [42] show that the response function of the DM power spectrum for changes in cosmological parameters estimated with COLA agrees with cosmological emulators in a wide range of cosmologies when using . We shall use at least the same force resolution here for the boost factor since we want to predict it for a similar range of cosmologies. As an additional test to check the accuracy of the boost factor for the wider range of gravity parameters, we produce high-resolution PM simulations and use them to make a comparison with the boost factors of simulations. Using a default box side of , we in fact compare the boost factors obtained using particles and with the ones obtained using particles and . We show the ratio of the two boost factors for 4 redshift values (legend) and 3 values of the parameter (plot titles) in figure 10. In the most extreme case, the difference in the two boost factors is up to ( up to ). This is in line with our target accuracy so we rely on these low-resolution settings for the simulations that we use to conduct the rest of our analysis.
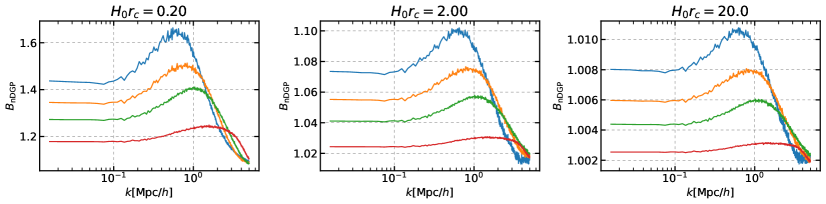
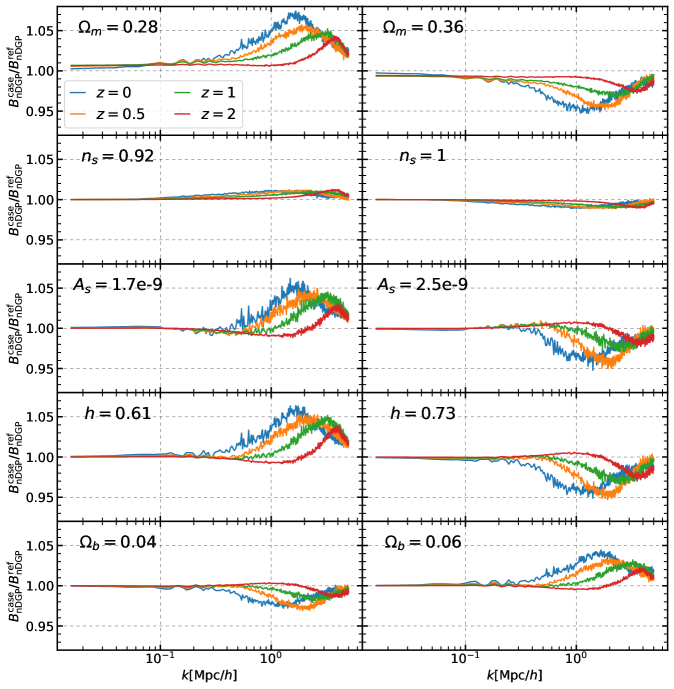
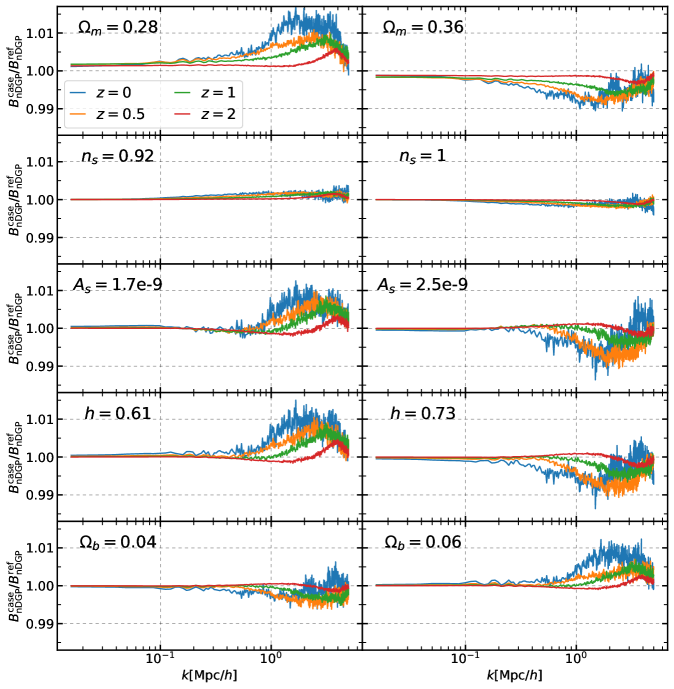
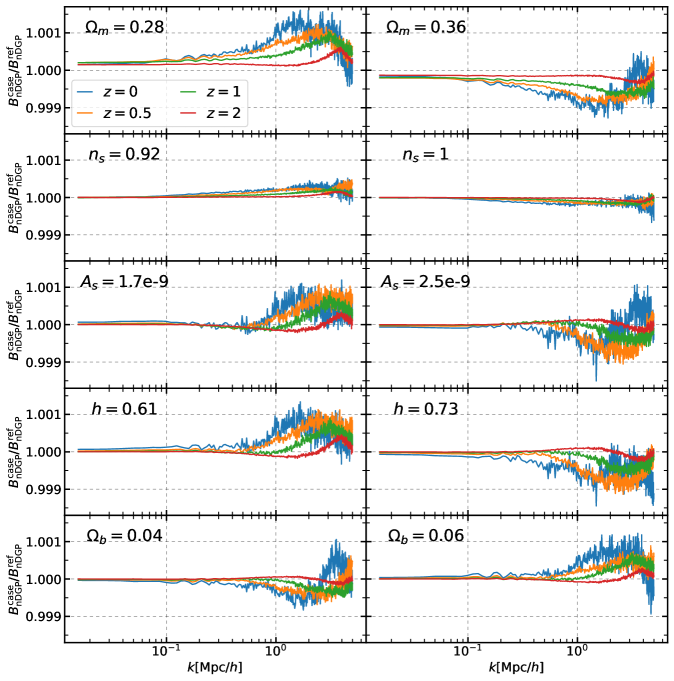
The boost factor of nDGP is strongly dependent on the theory parameter and on the redshift as shown in figure 11, where we plot the boost factors for three values of (titles) and 4 redshift values (legend). However, the cosmological dependence of the nDGP boost factor is quite weak. In support of this statement, we show the effect of changing each cosmological parameter on the nDGP boost factor for in figure 12, in figure 13 and in figure 14. These figures not only show that the response is limited to in the most extreme case (variations of for at redshift ) but also that its scale dependence is similar across the different cosmological parameters and values of . The amplitude of the effect is smaller for larger values.
3.2 Simulations and data sets
We produce two independent simulation suites, one for the training set and the other for the test set. Both training and test set simulations use particles to track the evolution of the matter density field in a box. The forces are calculated using mesh grids. The simulations are started at and evolved up to using 50 time-steps linearly spaced in the scale factor. We sample the cosmological parameter space using the Latin Hypercube Sampling (LHS) technique [63], a space-filling sampling method widely used in computer experiments to produce near-random sets of points which represent the real variability of multi-dimensional sample spaces. The range of cosmological parameters spanned by the training and test sets is described in table 1. We use 20 cosmologies111111In this work we assume for the primordial power spectrum. for the training set and 10 for the test set, which are listed in table 2 and table 3 respectively. For the modified gravity parameter we opt for a logarithmic sampling with 21 points in the range to produce the training set, and with 10 log-random points in the same range for the test set. The redshift sampling is determined by the time-stepping of COLA simulations. For each cosmology in the training set (test set), we run a vanilla GR simulation and nDGP simulations in all the gravity models of the training set (test set) using the same IC.
| Parameter | Min. | Max. |
|---|---|---|
Each simulation takes roughly 28 minutes on a single node of the Sciama High-Performance Compute (HPC) cluster using 32 tasks121212The specific partition used to run the simulations mounts Intel Xeon E5-2683v4 processors.. This corresponds to CPU hours. In total, we ran simulations for the training set and simulations for the test set. This means that the total computational cost for the simulations is CPU hours. In particular, we have used a partition counting 12 nodes with 32 cores each for a total of 384 cores (a typical value for an HPC cluster) obtaining all the power spectra in less than one wall-clock day.
| [] | ||||
|---|---|---|---|---|
| 0.282 | 0.0515 | 0.667 | 0.950 | 2.12 |
| 0.286 | 0.0445 | 0.655 | 0.990 | 2.44 |
| 0.294 | 0.0585 | 0.697 | 0.938 | 2.00 |
| 0.298 | 0.0415 | 0.619 | 0.978 | 2.04 |
| 0.290 | 0.0545 | 0.625 | 0.986 | 1.80 |
| 0.302 | 0.0485 | 0.709 | 0.922 | 1.72 |
| 0.306 | 0.0435 | 0.649 | 0.942 | 2.36 |
| 0.314 | 0.0595 | 0.721 | 0.958 | 2.28 |
| 0.318 | 0.0575 | 0.661 | 0.962 | 2.32 |
| 0.310 | 0.0405 | 0.673 | 0.966 | 1.88 |
| [] | ||||
|---|---|---|---|---|
| 0.322 | 0.0465 | 0.727 | 0.982 | 1.96 |
| 0.326 | 0.0455 | 0.637 | 0.994 | 2.08 |
| 0.334 | 0.0535 | 0.631 | 0.974 | 2.16 |
| 0.338 | 0.0555 | 0.703 | 0.954 | 1.92 |
| 0.330 | 0.0525 | 0.613 | 0.934 | 2.24 |
| 0.342 | 0.0495 | 0.685 | 0.998 | 2.20 |
| 0.346 | 0.0565 | 0.691 | 0.970 | 2.48 |
| 0.354 | 0.0505 | 0.643 | 0.930 | 1.76 |
| 0.358 | 0.0425 | 0.679 | 0.926 | 2.40 |
| 0.350 | 0.0475 | 0.715 | 0.946 | 1.84 |
| [] | ||||
|---|---|---|---|---|
| 0.284 | 0.0410 | 0.700 | 0.956 | 1.82 |
| 0.292 | 0.0490 | 0.628 | 0.940 | 1.74 |
| 0.308 | 0.0510 | 0.652 | 0.964 | 2.22 |
| 0.316 | 0.0430 | 0.688 | 0.996 | 2.30 |
| 0.324 | 0.0470 | 0.712 | 0.932 | 2.06 |
| [] | ||||
|---|---|---|---|---|
| 0.332 | 0.0530 | 0.724 | 0.980 | 2.38 |
| 0.348 | 0.0450 | 0.616 | 0.972 | 1.98 |
| 0.340 | 0.0550 | 0.664 | 0.948 | 1.90 |
| 0.356 | 0.0570 | 0.640 | 0.988 | 2.46 |
| 0.300 | 0.0590 | 0.676 | 0.924 | 2.14 |
The power spectra are computed by interpolating the DM distribution on a mesh grid with the cloud-in-cell mass-assignment scheme. The power spectra are corrected for the window function used in the interpolation and for shot noise. We use bins of width between and , where is the fundamental frequency of the box. Our target accuracy is up to , scales up to which we have already proven COLA simulations with these specifications to have reliable determination of the cosmological response function [42]. However for practical applications (e.g. weak lensing predictions) we extend the emulation range to , where the analysis discussed in the previous section suggests an accuracy of our simulations of for the nDGP boost factor. Beyond , baryonic effects are dominant over MG effects and it is still unclear whether we can extract additional information from these small scales [3]. As we have seen that mass resolution is a limiting factor at high redshift, we make the conservative choice of restricting our data sets to the power spectra at . We take the ratio of the power spectra in nDGP theories with the respective power spectrum in GR for each redshift and cosmology to obtain the nDGP boost factors. As the nDGP and GR simulations are run from the same IC, the sample variance is largely cancelled out when computing the nDGP boost factors. Since our simulations are started at redshift we multiply the nDGP boost factors with the linear theory correction in eq. (3.3).
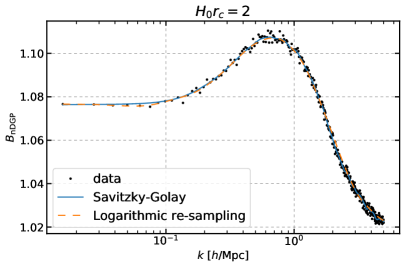
Due to the numerical methods used to estimate the power spectrum of the N-body particles, the nDGP boost factors that we obtain are sampled with a linear binning in -space and are affected by finite resolution noise at small scales. This noise is non-physical and may worsen the interpolation accuracy, therefore we decide to smooth the boost factors. We compare two smoothing techniques: one based on a logarithmic re-sampling of the data, the other based on the Savitzky-Golay filter [64]. In the left plot of Fig 15 is shown a comparison of the two smoothing techniques for the central case of and . The two techniques give consistent results so we decided to perform the rest of the analysis with the Savitzky-Golay filter.
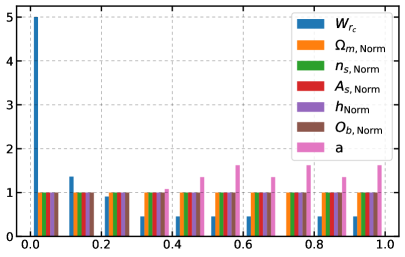
Multi-layer perceptrons (MLP), simple neural networks that we want to employ for the parameter space interpolation, work better when they deal with normalised input values [65], hence we re-scale our parameters accordingly. We map the cosmological parameters in such a way that the minimum and maximum values they assume in parameter space are 0 and 1. The redshift is naturally mapped in the range by computing the scale factor. We finally convert the MG parameter into which spans for our range (or more precisely it spans as we include the GR trivial results). In the right plot of Fig 15, the distribution of the normalised parameters is summarised in 10 linear bins between 0 and 1.
We convert the boost factor with the formula
| (3.4) |
to give more importance to small deviations from GR than to larger deviations131313Notice that the boost for (limit in which we recover GR) is trivial, i.e. . In this case, we get which explains the choice of the factor in eq (3.4). The subtraction of the value inside the logarithm is instead performed to place the GR result at a reasonable distance from the nDGP weakest deviation result in the -space.. The simplicity and self-similarity of the nDGP boost factor curve suggest that the 407 -modes that we are using to represent the boost factor are probably unnecessary. After subtracting the mean value of the boost factor from each element of the dataset, we perform a Principal Component Analysis (PCA) [66] to study if the variance of the training set is significantly larger in some -modes-space directions than in others. We find that the component with the greatest variance accounts for more than of the variance, while by using the first three components it is possible to describe of the variance. This means that we can reduce the dimensionality of the problem from 407 output values (one for each bin) to 3 output values losing only of the information. Furthermore, this remapping from the -space manifold to the 3-dimensional manifold of the principal eigenvalues makes the emulation problem insensitive to the choice of -binning used to compute the power spectra.
3.3 Emulator
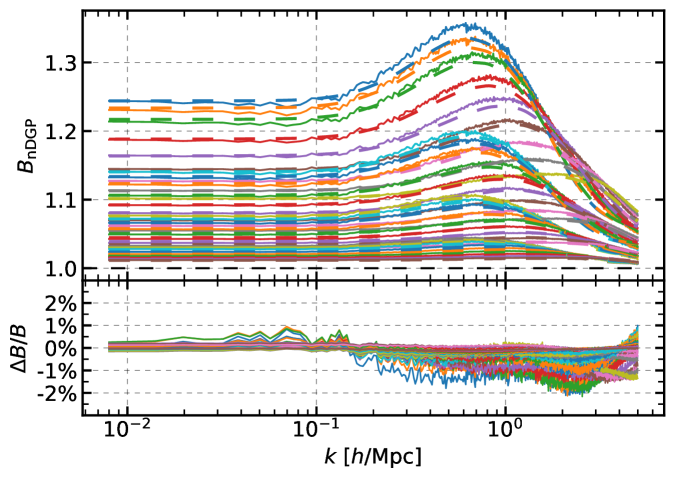
We train an MLP with one hidden layer of 100 nodes activated by hyperbolic tangent functions with the limited-memory Broyden–Fletcher–Goldfarb–Shanno [67] optimiser141414This iterative optimisation technique exploits a numerical estimate of the Hessian based only on gradient evaluations to determine the descent direction, which makes the technique computationally more efficient than Newton’s method. on the training set. This converges in less than 5000 iterations, producing the nDGP emulator that we benchmark on the test set. In the top panel of figure 16 we show some boost factors examples taken from the test set (solid lines) and compared with the emulator’s predictions (dashed lines). It is worth noticing that the emulated boost factors are free of high-frequency noise thanks to the smoothing discussed in subsection 3.2. In the bottom panel of figure 16 we show the mean (black dashed line) and variance ( and shaded regions) of the emulation error on the test set together with the residuals for the 30 examples shown in the top panel. The contours are well within the threshold at all scales.
As an additional test of the emulation accuracy, we compare the emulator’s predictions with the boost computed from Arepo simulations in nDGP gravity using 4 values of : 0.5, 1, 2, 5. Thanks to the flexibility of the emulator, unlike in the comparison between PM and Arepo simulations of figure 7, we are able in this case to compare the boosts at each of the 9 output redshifts of the Arepo simulation suite within the interpolation range. The results are shown in figure 17. The emulator predicts the nDGP boost factor of Arepo with accuracy in all cases and at all the scales considered. Additionally, we have checked that the emulator performance reaches accuracy if restricting the redshift range to . This is made possible by the excellent agreement between the nDGP boost factors of COLA and Arepo simulations but also by the linear-theory correction of eq (3.3) applied to the nDGP boost factors of COLA simulations started at redshift .
It is important to notice that even the results of these Arepo simulations might be not perfectly converged, but it is beyond the scope of this paper to assess the accuracy of these full N-body simulations. Furthermore, we have Arepo results for specific values of the modified gravity parameter , so the accuracy of the emulator at the edges of the parameter space cannot be fully assessed. With these caveats, and considering the level of convergence of the COLA predictions for the nDGP boost factor discussed in subsection 3.1, we estimate the accuracy of the emulator to be of up to and of up to . Once a thorough assessment of the accuracy of the Arepo boost factors used here as ground truth should become available, this should be factored into the error budget for the emulator.
The biggest computational cost behind the nDGP emulator comes from running the COLA simulations necessary to produce the power spectra in GR and nDGP theories ( CPU hours). The data processing applied to the power spectra in order to produce the training set has a minor impact on the computational cost ( CPU minutes). Also, the training of the emulator is relatively fast ( CPU hour). Once the model is trained, predictions are extremely fast. On an average single-core CPU, the model can produce predictions in a second. The prediction speed of emulators is key to enabling fast cosmological inference with Monte Carlo techniques which require evaluations [68, 69, 70].
As we have shown here, DM power spectrum emulators can be extended to MG models, and in particular to nDGP gravity, with modest computational cost thanks to COLA simulations, enabling accurate and extremely fast predictions of the matter power spectrum up to .
4 Conclusions
This article focused on the application of the COLA simulations for predictions of the matter power spectrum in GR and Modified Gravity (MG) theories. We addressed the issue of errors arising from finite resolution in numerical implementations of simulations, including time-resolution, force-resolution, and mass-resolution. Based on our analysis we designed and exploited a COLA simulation suite to extend cosmological emulators to nDGP gravity. Together with this paper, we release the nDGP emulator that will be publicly available at the address: https://github.com/BartolomeoF/nDGPemu.
To study the convergence of COLA simulations in CDM, we argued that COLA converges to PM-only simulations increasing the time resolution, and referred to results obtained in this limit as PM results. By comparing high force-resolution PM simulations with Bacco emulator (trained with high mass-resolution simulations) and low mass-resolution N-body simulations (Arepo) for predictions of the matter power spectrum at redshift , we highlighted the importance of mass resolution, responsible for differences at , while showing that PM simulations reproduce the reference results in both the low mass-resolution and high-mass-resolution cases with accuracy up to . After that, we produced a suite of simulations in CDM with the same cosmology but with different numbers of particles, force grids and time-steps, and using high-resolution PM simulations as a reference, we tested the relative convergence of COLA simulations. We concluded that the power spectra converge towards the reference only when mass-resolution, force-resolution and time-resolution are increased accordingly.
To showcase the potentiality of COLA for extending cosmological emulators to MG theories, we developed an nDGP boost-factor emulator of the matter power spectrum in section 3. By using Arepo predictions as a reference, we investigated the accuracy of COLA simulations for the nDGP boost factor in relation to the resolution settings and identified minimal requirements for our target accuracy. To include MG effects at in the back-scaling approach, we proposed and validated the linear theory correction of eq (3.3). We also studied the response of the nDGP boost factors to the change of cosmological parameters finding weak cosmological dependence of the nDGP boost factor and confirming that the cosmological dependence becomes weaker for smaller deviations from CDM (larger values of ). In subsection 3.2, we detailed our simulation strategy to compute the nDGP boost factors and examined the computational cost consisting of a total of CPU hours. After smoothing the signals and remapping the parameters in a unitary interval, we performed a PCA and selected only 3 components while preserving of the information. We then used the resulting data set to train a neural network and bench-marked its accuracy on an independent test set ( at all scales considered). As an additional test, we compared the emulator predictions with the Arepo results and found better than agreement at all scales considered. We concluded that COLA simulations can be used to accurately extend matter power spectrum emulators to MG theories up to () with accuracy ( accuracy).
The approach developed in this work can be extended to other gravity models. In particular it would be interesting to train an emulator for the matter power spectrum in Horndeski gravity [71, 72] which is made possible thanks to the recent extension of the COLA method [15, 42, 20] to the sub-class of Horndeski theories incorporating the Vainshtein screening mechanism. Furthermore, we plan to extend the convergence of COLA simulations for predictions of halo statistics for which we have already collected promising results. Finally, we aim to develop a suite of COLA-based emulators for several LSS probes, such as the ones studied in [16, 40].
Acknowledgments
We thank Albert Izard, Daniela Saadeh and Jamie Donald-McCann for useful insight and stimulating discussions on COLA simulations and cosmological emulators. We thank Hans Winther for creating the FML library and continuously improving it with new features. We thank César Hernández-Aguayo for providing access to the MG-Arepo simulations. For the purpose of open access, the authors have applied a Creative Commons Attribution (CC BY) licence to any Author Accepted Manuscript version arising from this work. Numerical computations were done on the Sciama High Performance Compute (HPC) cluster which is supported by the ICG, SEPNet and the University of Portsmouth. BF is supported by a Royal Society Enhancement Award (grant no. RFERE210304). KK is supported by the STFC grant ST/W001225/1. TB is supported by ERC Starting Grant SHADE (grant no. StG 949572) and a Royal Society University Research Fellowship (grant no. URFR1180009).
Data availability
Supporting research data are available on reasonable request from the corresponding author.
References
- [1] DESI collaboration, Validation of the Scientific Program for the Dark Energy Spectroscopic Instrument, 2306.06307.
- [2] N.E. Chisari et al., Modelling baryonic feedback for survey cosmology, Open J. Astrophys. 2 (2019) 4 [1905.06082].
- [3] DES collaboration, Dark Energy Survey Year 3 results: Cosmological constraints from galaxy clustering and weak lensing, Phys. Rev. D 105 (2022) 023520 [2105.13549].
- [4] J.U. Lange, A.P. Hearin, A. Leauthaud, F.C. van den Bosch, E. Xhakaj, H. Guo et al., Constraints on from a full-scale and full-shape analysis of redshift-space clustering and galaxy-galaxy lensing in BOSS, 2301.08692.
- [5] S. Tassev, M. Zaldarriaga and D. Eisenstein, Solving Large Scale Structure in Ten Easy Steps with COLA, JCAP 06 (2013) 036 [1301.0322].
- [6] A. Izard, M. Crocce and P. Fosalba, ICE-COLA: Towards fast and accurate synthetic galaxy catalogues optimizing a quasi -body method, Mon. Not. Roy. Astron. Soc. 459 (2016) 2327 [1509.04685].
- [7] F. List and O. Hahn, Perturbation-theory informed integrators for cosmological simulations, 2301.09655.
- [8] J. Koda, C. Blake, F. Beutler, E. Kazin and F. Marin, Fast and accurate mock catalogue generation for low-mass galaxies, Mon. Not. Roy. Astron. Soc. 459 (2016) 2118 [1507.05329].
- [9] M.J. Drinkwater et al., The WiggleZ Dark Energy Survey: Survey Design and First Data Release, Mon. Not. Roy. Astron. Soc. 401 (2010) 1429 [0911.4246].
- [10] V. Springel, The Cosmological simulation code GADGET-2, Mon. Not. Roy. Astron. Soc. 364 (2005) 1105 [astro-ph/0505010].
- [11] C. Howlett, M. Manera and W.J. Percival, L-PICOLA: A parallel code for fast dark matter simulation, Astron. Comput. 12 (2015) 109 [1506.03737].
- [12] A. Izard, P. Fosalba and M. Crocce, ICE-COLA: fast simulations for weak lensing observables, Mon. Not. Roy. Astron. Soc. 473 (2018) 3051 [1707.06312].
- [13] G. Valogiannis and R. Bean, Efficient simulations of large scale structure in modified gravity cosmologies with comoving Lagrangian acceleration, Phys. Rev. D 95 (2017) 103515 [1612.06469].
- [14] H.A. Winther, K. Koyama, M. Manera, B.S. Wright and G.-B. Zhao, COLA with scale-dependent growth: applications to screened modified gravity models, JCAP 08 (2017) 006 [1703.00879].
- [15] LSST Dark Energy Science collaboration, Hi-COLA: fast, approximate simulations of structure formation in Horndeski gravity, JCAP 03 (2023) 040 [2209.01666].
- [16] B. Fiorini, K. Koyama, A. Izard, H.A. Winther, B.S. Wright and B. Li, Fast generation of mock galaxy catalogues in modified gravity models with COLA, JCAP 09 (2021) 021 [2106.05197].
- [17] B.S. Wright, H.A. Winther and K. Koyama, COLA with massive neutrinos, JCAP 10 (2017) 054 [1705.08165].
- [18] H.A. Winther and P.G. Ferreira, Fast route to nonlinear clustering statistics in modified gravity theories, Phys. Rev. D 91 (2015) 123507 [1403.6492].
- [19] R. Scoccimarro, Large-Scale Structure in Brane-Induced Gravity I. Perturbation Theory, Phys. Rev. D 80 (2009) 104006 [0906.4545].
- [20] G. Brando, K. Koyama and H.A. Winther, Revisiting Vainshtein Screening for fast N-body simulations, 2303.09549.
- [21] S. Agarwal, F.B. Abdalla, H.A. Feldman, O. Lahav and S.A. Thomas, PkANN - I. Non-linear matter power spectrum interpolation through artificial neural networks, "Mon. Not. Roy. Astron. Soc." 424 (2012) 1409 [1203.1695].
- [22] S. Habib, K. Heitmann, D. Higdon, C. Nakhleh and B. Williams, Cosmic Calibration: Constraints from the Matter Power Spectrum and the Cosmic Microwave Background, Phys. Rev. D 76 (2007) 083503 [astro-ph/0702348].
- [23] VIRGO Consortium collaboration, Stable clustering, the halo model and nonlinear cosmological power spectra, Mon. Not. Roy. Astron. Soc. 341 (2003) 1311 [astro-ph/0207664].
- [24] Euclid collaboration, Euclid preparation: IX. EuclidEmulator2 – power spectrum emulation with massive neutrinos and self-consistent dark energy perturbations, Mon. Not. Roy. Astron. Soc. 505 (2021) 2840 [2010.11288].
- [25] R.E. Angulo, M. Zennaro, S. Contreras, G. Aricò, M. Pellejero-Ibañez and J. Stücker, The BACCO simulation project: exploiting the full power of large-scale structure for cosmology, Mon. Not. Roy. Astron. Soc. 507 (2021) 5869 [2004.06245].
- [26] H. Winther, S. Casas, M. Baldi, K. Koyama, B. Li, L. Lombriser et al., Emulators for the nonlinear matter power spectrum beyond CDM, Phys. Rev. D 100 (2019) 123540 [1903.08798].
- [27] LSST Dark Energy Science collaboration, Matter Power Spectrum Emulator for f(R) Modified Gravity Cosmologies, Phys. Rev. D 103 (2021) 123525 [2010.00596].
- [28] C. Arnold, B. Li, B. Giblin, J. Harnois-Déraps and Y.-C. Cai, FORGE – the f(R) gravity cosmic emulator project I: Introduction and matter power spectrum emulator, 2109.04984.
- [29] I.n. Sáez-Casares, Y. Rasera and B. Li, The e-MANTIS emulator: fast predictions of the non-linear matter power spectrum in CDM cosmology, 2303.08899.
- [30] R. Mauland, H.A. Winther and C.-Z. Ruan, Sesame: A power spectrum emulator pipeline for beyond-CDM models, 2309.13295.
- [31] W. Hu and I. Sawicki, Models of f(R) Cosmic Acceleration that Evade Solar-System Tests, Phys. Rev. D 76 (2007) 064004 [0705.1158].
- [32] J. Harnois-Déraps, C. Hernandez-Aguayo, C. Cuesta-Lazaro, C. Arnold, B. Li, C.T. Davies et al., mglens: Modified gravity weak lensing simulations for emulation-based cosmological inference, Mon. Not. Roy. Astron. Soc. 525 (2023) 6336 [2211.05779].
- [33] G.R. Dvali, G. Gabadadze and M. Porrati, 4-D gravity on a brane in 5-D Minkowski space, Phys. Lett. B 485 (2000) 208 [hep-th/0005016].
- [34] M. Cataneo, L. Lombriser, C. Heymans, A. Mead, A. Barreira, S. Bose et al., On the road to percent accuracy: non-linear reaction of the matter power spectrum to dark energy and modified gravity, Mon. Not. Roy. Astron. Soc. 488 (2019) 2121 [1812.05594].
- [35] B. Bose, M. Tsedrik, J. Kennedy, L. Lombriser, A. Pourtsidou and A. Taylor, Fast and accurate predictions of the nonlinear matter power spectrum for general models of Dark Energy and Modified Gravity, 2210.01094.
- [36] S. Gupta, W.A. Hellwing and M. Bilicki, Improved analytical modeling of the nonlinear power spectrum in modified gravity cosmologies, Phys. Rev. D 107 (2023) 083525 [2301.12016].
- [37] H.A. Winther et al., Modified Gravity N-body Code Comparison Project, Mon. Not. Roy. Astron. Soc. 454 (2015) 4208 [1506.06384].
- [38] A. Klypin and F. Prada, Dark matter statistics for large galaxy catalogues: power spectra and covariance matrices, Mon. Not. Roy. Astron. Soc. 478 (2018) 4602 [1701.05690].
- [39] J. DeRose, R.H. Wechsler, J.L. Tinker, M.R. Becker, Y.-Y. Mao, T. McClintock et al., The Aemulus Project I: Numerical Simulations for Precision Cosmology, Astrophys. J. 875 (2019) 69 [1804.05865].
- [40] B. Fiorini, K. Koyama and A. Izard, Studying large-scale structure probes of modified gravity with COLA, 2208.01345.
- [41] C. Hernández-Aguayo, C.-Z. Ruan, B. Li, C. Arnold, C.M. Baugh, A. Klypin et al., Fast full N-body simulations of generic modified gravity: derivative coupling models, JCAP 01 (2022) 048 [2110.00566].
- [42] G. Brando, B. Fiorini, K. Koyama and H.A. Winther, Enabling matter power spectrum emulation in beyond-CDM cosmologies with COLA, JCAP 09 (2022) 051 [2203.11120].
- [43] C. Arnold, M. Leo and B. Li, Realistic simulations of galaxy formation in modified gravity, Nature Astron. 3 (2019) 945 [1907.02977].
- [44] C. Hernández-Aguayo, C. Arnold, B. Li and C.M. Baugh, Galaxy formation in the brane world I: overview and first results, Mon. Not. Roy. Astron. Soc. 503 (2021) 3867 [2006.15467].
- [45] V. Springel, E pur si muove: Galiliean-invariant cosmological hydrodynamical simulations on a moving mesh, Mon. Not. Roy. Astron. Soc. 401 (2010) 791 [0901.4107].
- [46] M.A. Mitchell, C. Hernández-Aguayo, C. Arnold and B. Li, A general framework to test gravity using galaxy clusters IV: cluster and halo properties in DGP gravity, Mon. Not. Roy. Astron. Soc. 508 (2021) 4140 [2106.13815].
- [47] Euclid collaboration, Euclid preparation: VII. Forecast validation for Euclid cosmological probes, Astron. Astrophys. 642 (2020) A191 [1910.09273].
- [48] M. Michaux, O. Hahn, C. Rampf and R.E. Angulo, Accurate initial conditions for cosmological N-body simulations: Minimizing truncation and discreteness errors, Mon. Not. Roy. Astron. Soc. 500 (2020) 663 [2008.09588].
- [49] F. List, O. Hahn and C. Rampf, Fluid-limit Cosmological Simulations Starting from the Big Bang, 2309.10865.
- [50] Y. Feng, M.-Y. Chu, U. Seljak and P. McDonald, FastPM: a new scheme for fast simulations of dark matter and haloes, Mon. Not. Roy. Astron. Soc. 463 (2016) 2273 [1603.00476].
- [51] C. Deffayet, Cosmology on a brane in Minkowski bulk, Phys. Lett. B 502 (2001) 199 [hep-th/0010186].
- [52] M.A. Luty, M. Porrati and R. Rattazzi, Strong interactions and stability in the DGP model, JHEP 09 (2003) 029 [hep-th/0303116].
- [53] K. Koyama and F.P. Silva, Non-linear interactions in a cosmological background in the DGP braneworld, Phys. Rev. D 75 (2007) 084040 [hep-th/0702169].
- [54] K. Koyama, Ghosts in the self-accelerating universe, Class. Quant. Grav. 24 (2007) R231 [0709.2399].
- [55] F. Schmidt, Self-Consistent Cosmological Simulations of DGP Braneworld Gravity, Phys. Rev. D 80 (2009) 043001 [0905.0858].
- [56] L. Lombriser, W. Hu, W. Fang and U. Seljak, Cosmological Constraints on DGP Braneworld Gravity with Brane Tension, Phys. Rev. D 80 (2009) 063536 [0905.1112].
- [57] C. Deffayet, G.R. Dvali, G. Gabadadze and A.I. Vainshtein, Nonperturbative continuity in graviton mass versus perturbative discontinuity, Phys. Rev. D 65 (2002) 044026 [hep-th/0106001].
- [58] B. Li, G.-B. Zhao, R. Teyssier and K. Koyama, ECOSMOG: An Efficient Code for Simulating Modified Gravity, JCAP 01 (2012) 051 [1110.1379].
- [59] C. Hernández-Aguayo, C. Arnold, B. Li and C.M. Baugh, Galaxy formation in the brane world I: overview and first results, Mon. Not. Roy. Astron. Soc. 503 (2021) 3867 [2006.15467].
- [60] H.A. Winther and P.G. Ferreira, Fast route to nonlinear clustering statistics in modified gravity theories, Phys. Rev. Lett. 91 (2015) 123507 [1403.6492].
- [61] B. Fiorini, Testing gravity on cosmological scales : theoretical predictions with the COLA method, Ph.D. thesis, University of Portsmouth, 2023. 2303.07121.
- [62] C.-Z. Ruan, C. Hernández-Aguayo, B. Li, C. Arnold, C.M. Baugh, A. Klypin et al., Fast full N-body simulations of generic modified gravity: conformal coupling models, JCAP 05 (2022) 018 [2110.00328].
- [63] M.D. McKay, R.J. Beckman and W.J. Conover, Comparison of three methods for selecting values of input variables in the analysis of output from a computer code, Technometrics 21 (1979) 239 [https://doi.org/10.1080/00401706.1979.10489755].
- [64] A. Savitzky and M.J.E. Golay, Smoothing and differentiation of data by simplified least squares procedures., Analytical Chemistry 36 (1964) 1627 [https://doi.org/10.1021/ac60214a047].
- [65] C.M. Bishop, Neural Networks for Pattern Recognition, Oxford University Press, Inc., USA (1995).
- [66] I.T. Jolliffe, Principal Component Analysis, Springer Series in Statistics, Springer-Verlag (2002), 10.1007/b98835.
- [67] R. Fletcher, Practical Methods of Optimization, Wiley (2000).
- [68] J. Donald-McCann, F. Beutler, K. Koyama and M. Karamanis, matryoshka: halo model emulator for the galaxy power spectrum, Mon. Not. Roy. Astron. Soc. 511 (2022) 3768 [2109.15236].
- [69] A. Spurio Mancini, D. Piras, J. Alsing, B. Joachimi and M.P. Hobson, CosmoPower: emulating cosmological power spectra for accelerated Bayesian inference from next-generation surveys, Mon. Not. Roy. Astron. Soc. 511 (2022) 1771 [2106.03846].
- [70] J. Donald-McCann, K. Koyama and F. Beutler, matryoshka II: Accelerating Effective Field Theory Analyses of the Galaxy Power Spectrum, 2202.07557.
- [71] G.W. Horndeski, Second-order scalar-tensor field equations in a four-dimensional space, Int. J. Theor. Phys. 10 (1974) 363.
- [72] C. Deffayet, X. Gao, D.A. Steer and G. Zahariade, From k-essence to generalised Galileons, Phys. Rev. D 84 (2011) 064039 [1103.3260].