Recent results of cosmic-ray studies with IceTop at the IceCube Neutrino Observatory
Abstract
The IceCube Neutrino Observatory is a cubic-kilometer Cherenkov detector that is deployed deep in the Antarctic ice at the South Pole. A square kilometer companion surface detector, IceTop, located directly above in the in-ice array, measures cosmic-ray initiated extensive air showers with primary energies between 100 TeV and 1 EeV. By combining the events measured by IceTop and the in-ice detectors of IceCube in coincidence, we can reconstruct the energy spectra for different primary mass groups. Therefore, we provide information about the origin of cosmic rays, in particular, in the transition region from galactic to extra-galactic origin of high-energy cosmic rays. In this contribution we present recent experimental results, as well as prospects by the foreseen enhancement of the surface detectors of IceTop and the future IceCube-Gen2 surface array.
keywords:
\KWDcosmic rays, energy spectrum, mass composition, GeV muons1 Introduction
Investigations of the energy spectrum and mass composition of primary cosmic rays (CR) are fundamental tools to understand the origin, acceleration and propagation mechanism of these particles. It is also important for the determination of the atmospheric neutrino flux. The presumed origin of galactic cosmic rays are supernovae. The shock acceleration at supernova remnants can explain the intensity of the cosmic radiation at least up to 1015 eV (Hillas, 2005). A continuous and steady source distribution would generate an energy spectrum of cosmic rays with a simple power law for all the elements. However, in a more realistic approach, sources are discrete and a possible non-uniform distribution in space and time could generate structures and changes in the spectral indexes of the spectra of primaries at certain energies (Peters, 1961). This situation would be more pronounced at higher energies, where the most recent sources would dominate the spectra. A refined study of the CR primary spectrum, composition and anisotropy is, therefore, extremely important to address the open questions: the astrophysical origin of cosmic rays, and conditions at the acceleration sites.
The direct study of CRs can be performed by means of satellite or balloon-borne detectors only at energies below 1015 eV (Yoon et al., 2011). Above that energy, due to statistics, only Extensive Air Showers (EAS) detection can be used (Antoni et al., 2005). By using multiple particle detectors to study different air shower components, the energy of the primary particles can be inferred in a quite reliable way through the comparison of the data with extensive simulation studies. However, the results of the composition analysis depend to some extent on the high-energy interaction model used in the simulations.
Above 1015 eV the all-particle spectrum has a power-law-like behavior (, ) with features known as the knee around 3-51015 eV and the ankle at 4-101018 eV, respectively, where the spectrum shows a distinct change of the spectral index (Blümer et al., 2009). The energy range between 1017 eV and 1019 eV is in particular very interesting as it is expected to be the region where a transition from a galactic dominated to an extra-galactic dominated origin is observed (Hillas, 2005). The Pierre Auger collaboration confirmed the extragalactic origin of cosmic rays beyond the ankle (Aab et al., 2017), but not the transition itself. The exact energy transition region from galactic to extragalactic cosmic rays is not well understood yet. Therefore, the study of the chemical composition and of the shape of the energy spectrum in this energy range is also of great interest.
The muon content of EAS is important for identifying properties of primary cosmic rays. Since the muonic component in an air shower depends on the energy and the mass of the primary particle, it plays an important role in studies of the cosmic-ray composition. They carry information about the last hadronic interaction that created their parent pion. Due to the propagation of muons at nearly the speed of light, this information is reflected in the lateral density profile and in the arrival times of muons when an air shower reaches the ground. Several experiments have observed the muon lateral density profile and found a consistent deficit in the simulated numbers of muons in the lateral profile compared to experimental data. This discrepancy is referred to as the muon puzzle (Albrecht et al., 2022). IceCube (Fig. 1) has a unique capability to measure the GeV and TeV muon components in air showers, separately. Therefore, measurements by IceTop and IceCube can give a clue on the muon puzzle.
Recent findings indicate that one of the most promising methods to bring further insights into high-energy CR physics is the observation of CR-initiated EAS using multiple detection channels. The IceCube Neutrino Observatory constitutes a unique setup, allowing for in-ice detection of the high-energy core of the air-shower as well as its footprint using IceTop.
2 The IceCube detector
The IceCube Neutrino Observatory (Aartsen et al., 2017) is a cubic-kilometer Cherenkov detector that is deployed deep in the Antarctic ice at the South Pole. The schematic view of the IceCube Neutrino Observatory can be seen in Fig. 1. It has 5160 digital optical modules (DOMs) placed on 86 strings in the glacial ice at depths between roughly 1450 m to 2450 m below the surface. Each DOM consists of a 25 cm photomultiplier tube plus associated digitization and calibration electronics, hosted inside a 35 cm diameter pressure vessel. Reconstruction of the direction, energy and identity of penetrating particles at IceCube relies on the optical detection of Cherenkov radiation emitted in the surrounding ice. In addition to the in-ice array, a square kilometer companion surface detector, IceTop with a mean spacing of 125 m (Abbasi et al., 2013), located directly above the in-ice array, measures extensive cosmic ray air showers with primary energies between 100 TeV and 1 EeV. The altitude of the surface array is 2835 m a.s.l., which corresponds to an atmospheric depth of about 680 g/cm2. It is close to the shower maximum for showers with tens of PeV energies, therefore, an excellent energy resolution is expected at these primary energies. IceTop consists of 81 stations with two Cherenkov tanks each and each tank is equipped with two Digital Optical Modules (DOMs) identical to those used by IceCube in-ice array. During deployment, water was filled into the tanks and allowed to freeze under controlled conditions to ensure bubble-free, clear ice. The angular resolution of air showers detected by IceTop is about 1∘ and the timing resolution is around 3 ns. The energy resolution is about 0.1 or less in units of log10(E/GeV) above about 1 PeV (Aartsen et al., 2019).
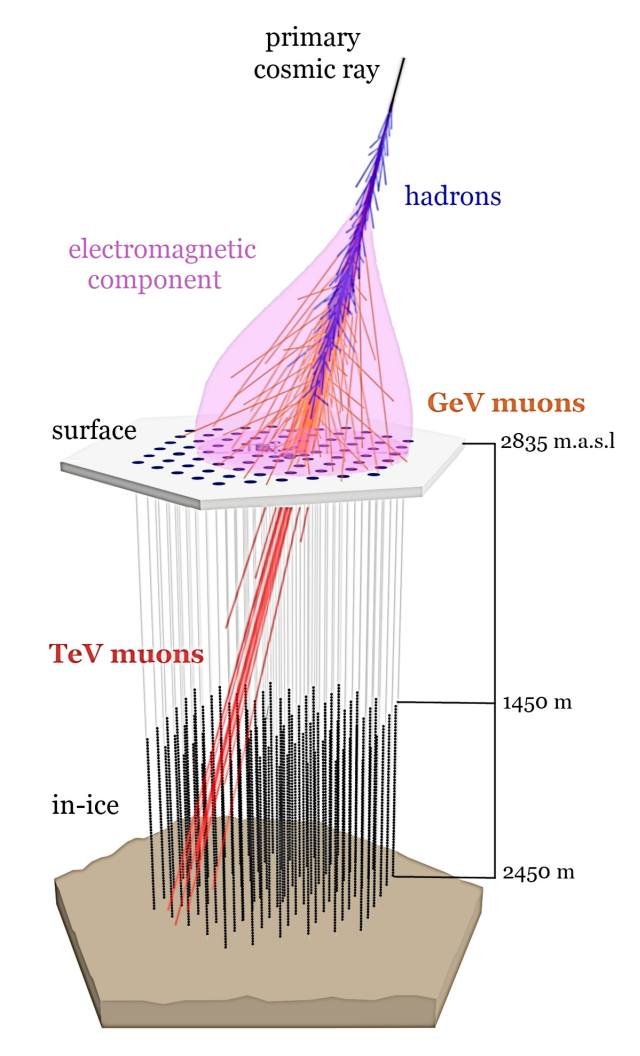
IceCube is a unique instrument for cosmic ray physics, by using a three-dimensional detector concept (Fig. 1). The surface array IceTop measures the electromagnetic and low energy ( 1 GeV) muon components of extensive air showers. From that, the energy and the direction of cosmic rays are reconstructed. The high-energy muons ( 400 GeV) go through and can be measured by the in-ice detector. The track or bundle of muons is reconstructed and the deposited energy along the track is used as an in-ice energy proxy for the analysis. Using both information of IceTop and in-ice, composition studies can be performed more precisely.
3 Energy spectrum
3.1 IceTop alone
In the “IceTop-alone” analysis, the energy spectrum is reconstructed using only data from the IceTop tanks. Although it does not use accompanying information from the in-ice detector, it can access a greater range of zenith angles and larger statistics. The tank signals collected by IceTop are cleaned and calibrated in units of vertical equivalent muons (VEM), and these cleaned data are reconstructed (Abbasi et al., 2013). The unit 1 VEM is defined as the charge value at 95% of the muon peak value, which is the maximum of the muon contribution (Abbasi et al., 2013). The properties of the primary cosmic ray are reconstructed by fitting the measured signals with a Lateral Distribution Function (LDF), which depends on the perpendicular distance from the shower axis, :
| (1) |
where is the shower size at 125 m from the shower axis and is a slope of the LDF function and a free parameter. The curvature of the parabola, , is fixed at a value of 0.303, which studies suggest is similar across different hadronic interaction models.
The fitting of the lateral distribution of charge signals results in the shower size parameter , expressed in the unit of VEM, which is used as an energy proxy of IceTop. This parameter is nearly composition independent.
Figure 2 presents the correlation between and the primary energy in IceTop for the primary proton assumption for cos 0.95. Events are weighted to the relative abundances of the primary nuclei in the mixed composition H4a model (Gaisser, 2012). For the Monte Carlo simulation, the hadronic interaction model Sibyll 2.1 (Ahn et al., 2009) is used, whereas FLUKA (Ferrari et al., 2005) is used for low energy hadronic interactions below 80 GeV.
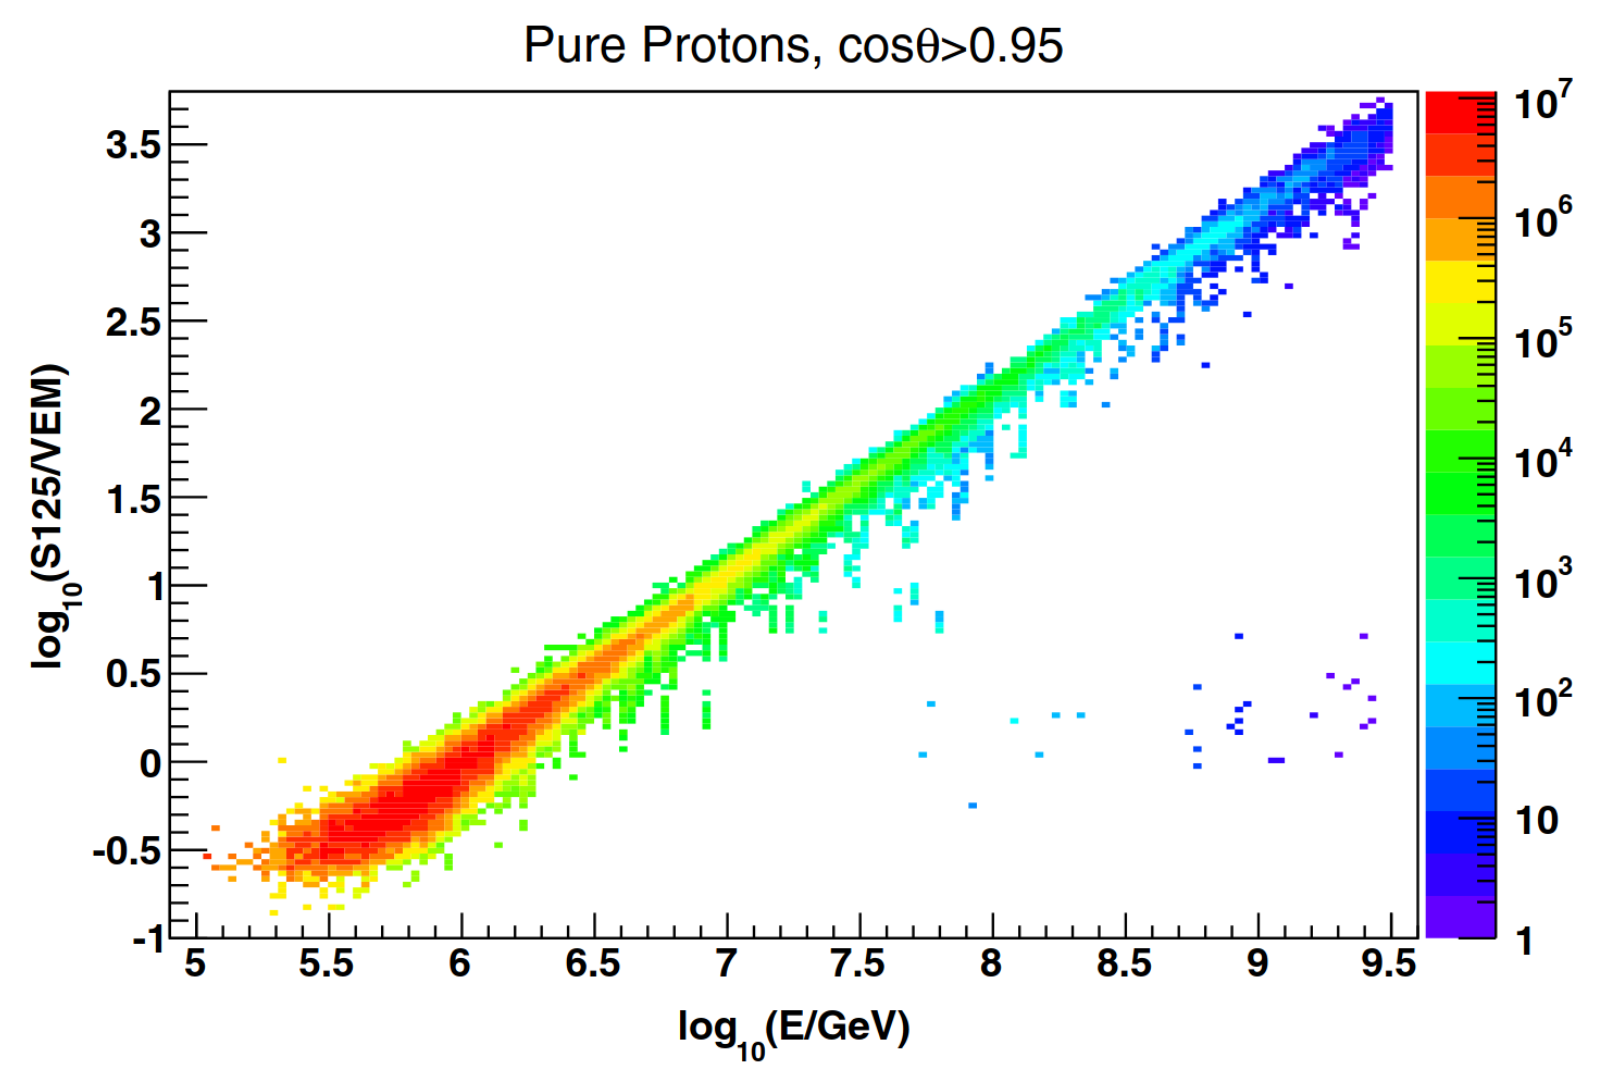
By means of the relationship between and the primary energy, a conversion function (Aartsen et al., 2019) was developed, which depends on the composition assumption, the zenith angle and the assumed spectral index. After applying this relationship to experimental data, the all-particle energy spectrum is reconstructed.
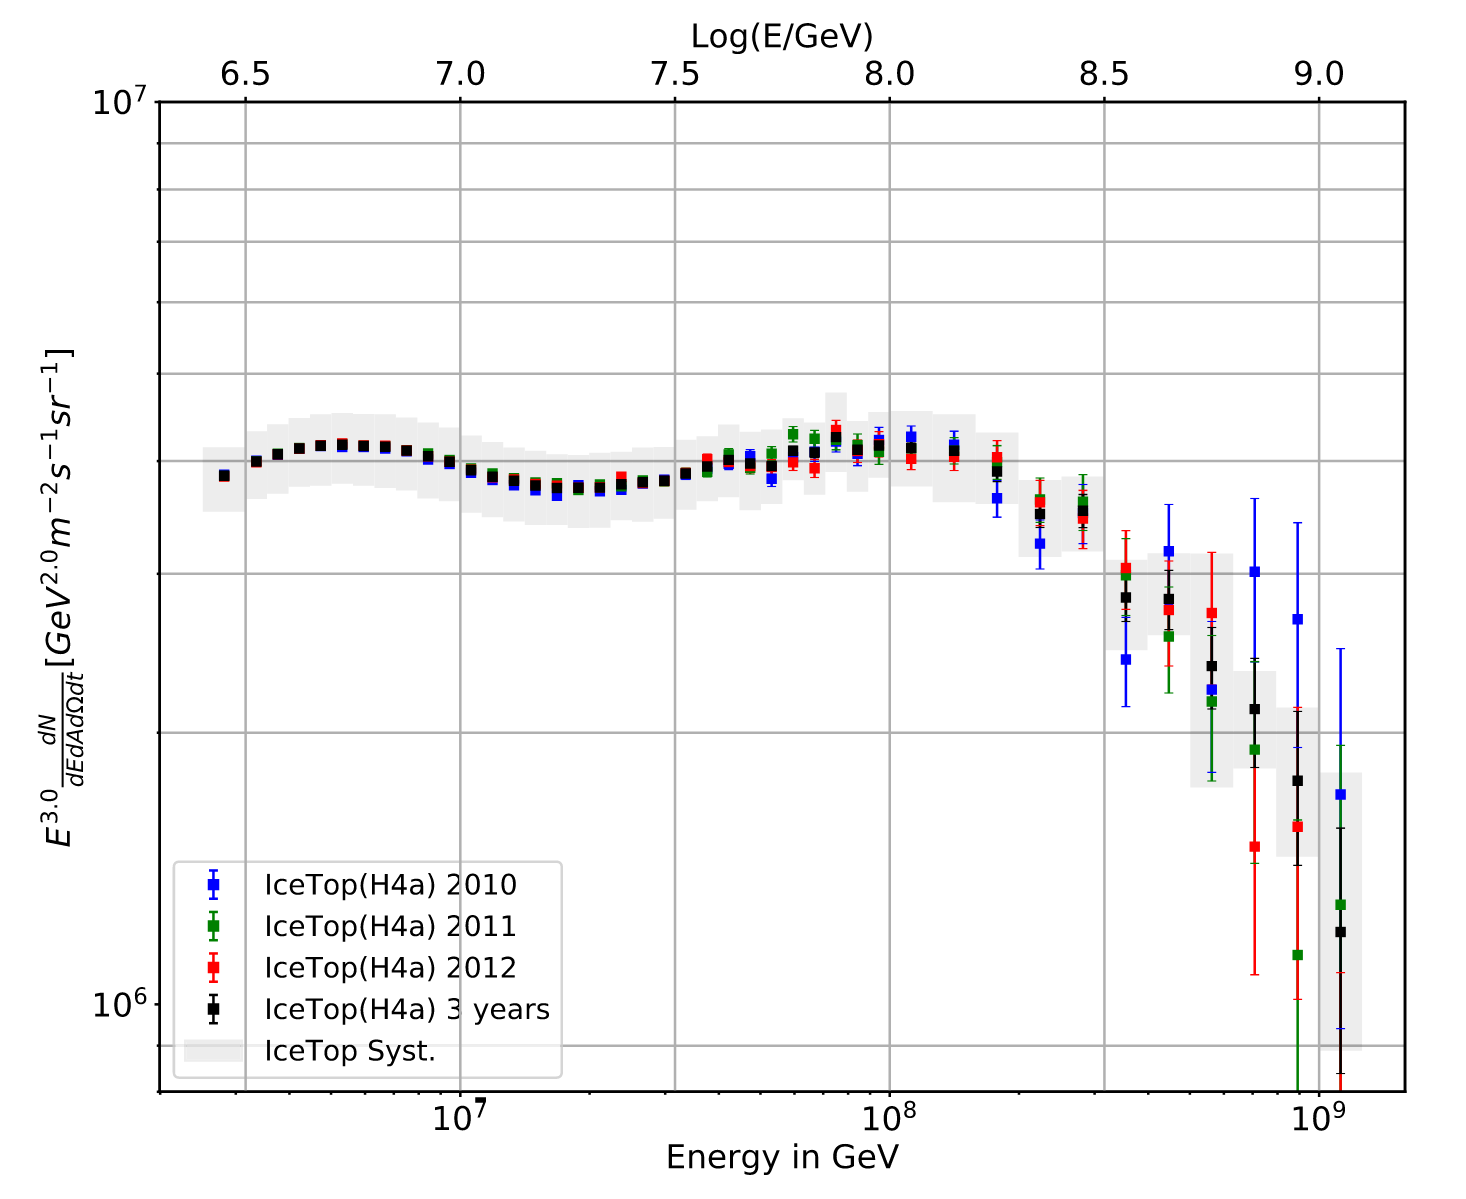
For this analysis three years of data from May 2010 to June 2013 are used, and the selected events after considering quality cuts and full trigger and reconstruction efficiency is in total. Most of the IceTop selections rely on the success of the reconstruction algorithm, while the in-ice quality selections focus on ensuring an accurate reconstruction of the energy loss. Detailed cuts for the analysis are described in Ref. (Aartsen et al., 2019). The resulting spectrum derived from three years of data is displayed in Fig. 3, where the bin-to-bin migration effect is expected, but it is so small as to be negligible. It shows two features, the so-called knee around 5 PeV and a second knee around 100 PeV. The observation of the second knee structure is relatively recent, but it is now confirmed by at least three different experiments: KASCADE-Grande, IceCube, and TUNKA (Apel et al., 2011; Aartsen et al., 2019; Budnev et al., 2020; Abreu et al., 2021).
An important systematic effect is the varying snow layers on top of the IceTop tanks. There is considerable snow drift at the South Pole and it leads to snow accumulation of an average of 20 cm per year on top of the IceTop array. Due to snow effects, the electromagnetic components are attenuated and this effect changes slowly over time. Thus, the attenuation by snow is corrected for using a simple exponential factor (Rawlins, 2013):
| (2) |
where is the no-snow expected signal, is the slant depth that particles travel to a tank at a depth of , is a year-dependent effective attenuation length between 2.1 and 2.3 meters.
The dataset divided into individual years shows strong agreement with each other, with systematic uncertainties of about 10%, where the dominant contributions are from snow accumulation. Detailed discussions on the systematic uncertainties can be found in Ref. (Aartsen et al., 2019).
3.2 Low energy spectrum
One of the important goals for the reconstruction of the primary energy spectrum of cosmic rays is to investigate the overlap region between direct and indirect measurements. Recently, IceCube has published a new low-energy spectrum (Aartsen et al., 2020a), which is extended to low energies down to 250 TeV, using the IceTop infill array. IceTop has several closely-spaced stations in the center of the array, for which the separation between stations is less than 50 m; this densely-instrumented region is sensitive to cosmic rays with low energy. A two-station trigger is implemented to collect lower energy events. This trigger condition is fulfilled when four pairs of infill stations are hit within a time window of 200 ns. In this analysis, a random forest algorithm for reconstruction of showers was used, since there are insufficient hits for the standard fit to a lateral distribution function. Each simulated event is weighted based on the H4a cosmic ray primary composition model during training to remove an energy-dependent bias on reconstructed energy for cos 0.9. The reconstructed energy distribution which was derived from the random forest regression is unfolded by using an iterative Bayesian unfolding procedure (D’Agostini, 1995) to take energy bin migration into account.
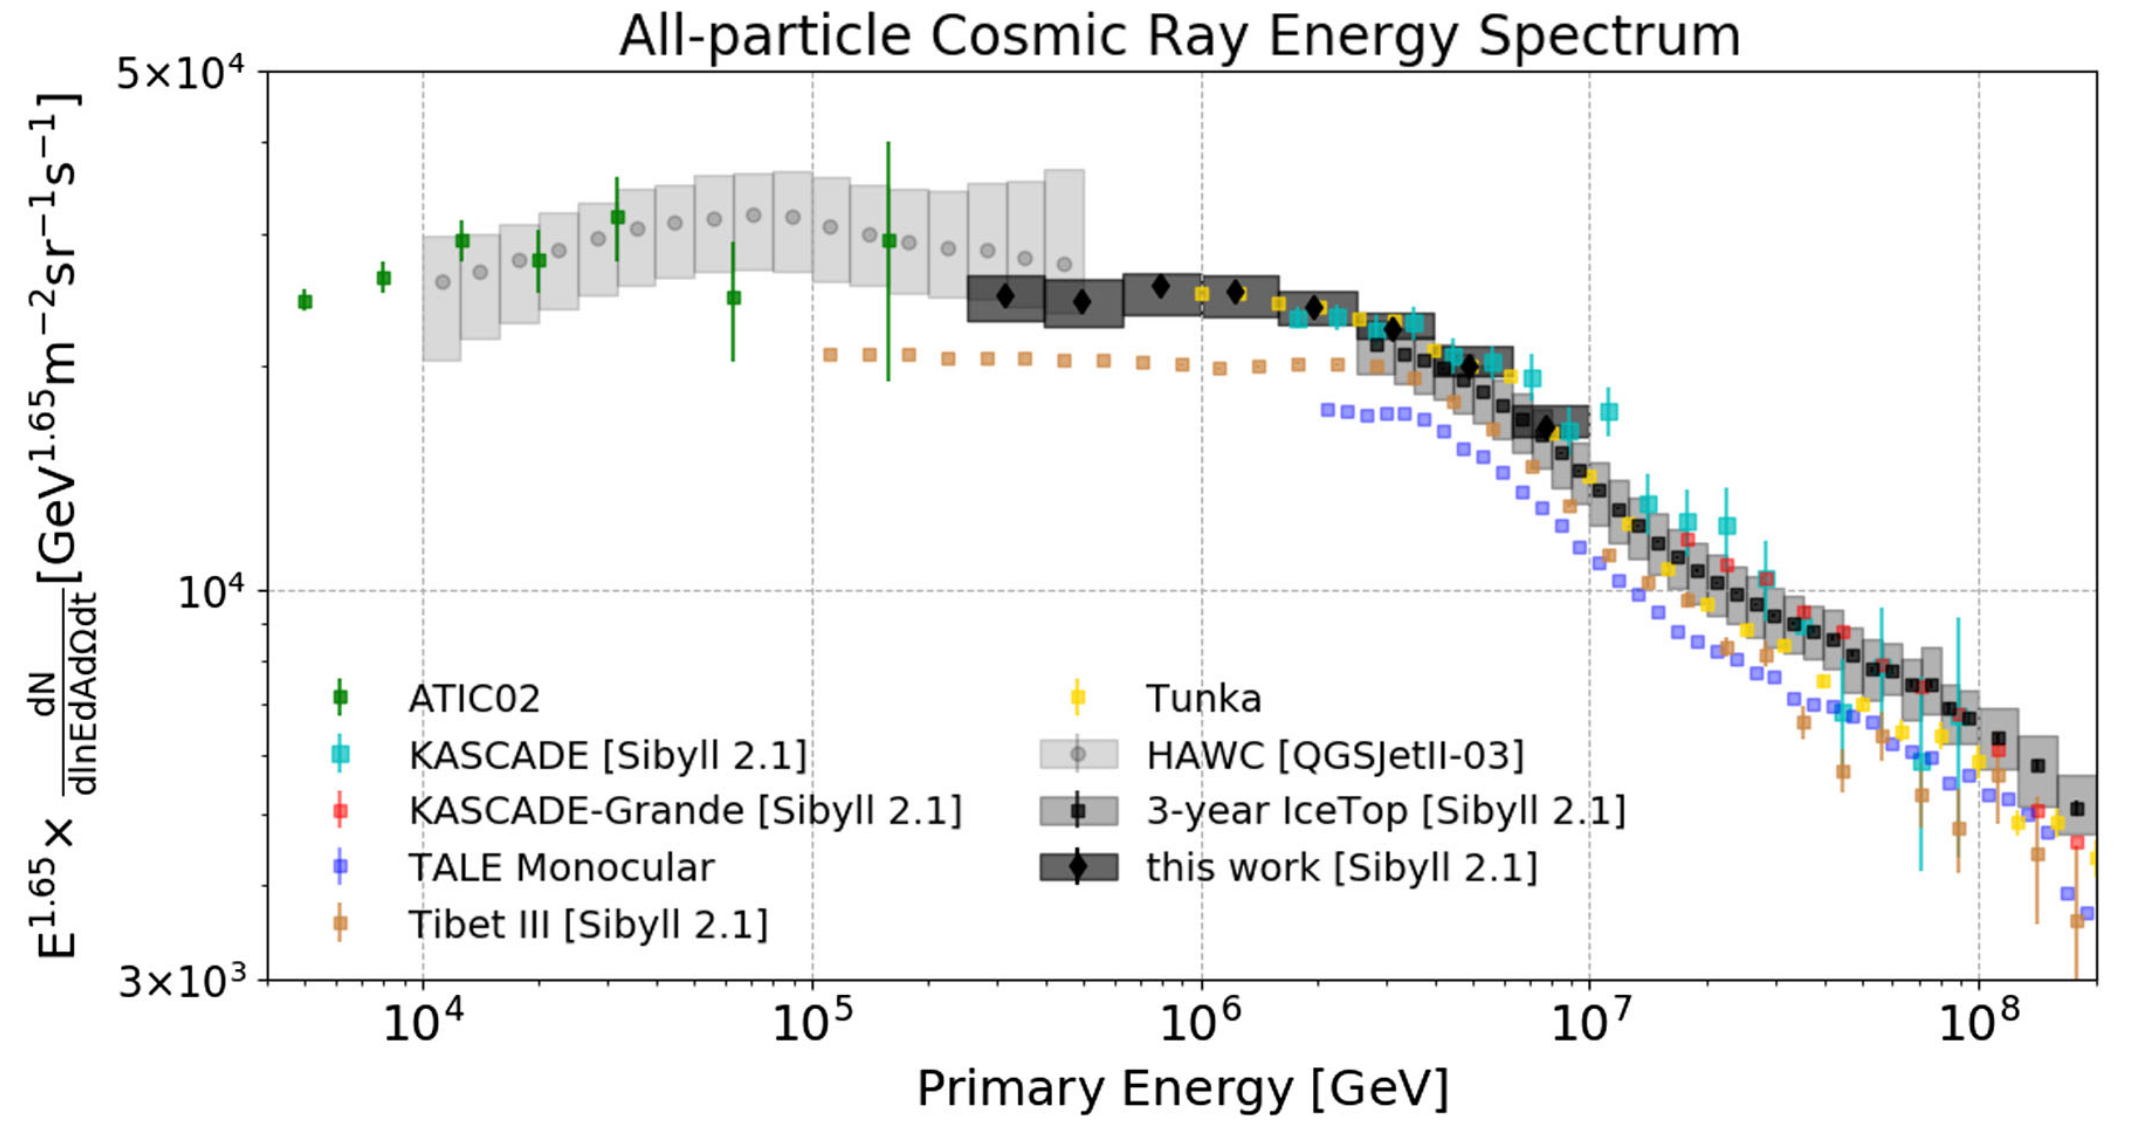
The total energy spectrum using IceTop 2016 data, scaled by and compared to the cosmic-ray flux from other previous experiments, is presented in Fig. 4. The spectrum shows a clear behavior in the knee region: a slope of 1.65 below PeV and a steepening between 2 PeV and 10 PeV.
The IceTop low-energy spectrum connects to direct measurements and overlaps with HAWC measurements (Alfaro et al., 2017) at lower energies, where this and the analysis of the HAWC energy spectrum use the different hadronic interaction models Sibyll 2.1 and QGSJetII-03 (Ostapchenko, 2006), respectively. The uncertainty of the HAWC spectrum appears larger than the one for IceTop. The reason is that the uncertainty from hadronic interaction models is included for HAWC, but not for IceTop. In addition, the largest uncertainty for HAWC comes from uncertainties in the photomultiplier (PMT) parameters. This result is also compared with the results of KASCADE and Tunka at higher energies. The Tibet-III measurement (Amenomori et al., 2008) is the most relevant for comparison, since it is a ground-based air shower array at high altitude with small distances between detectors (7.5 m). The Tibet-III result in Fig. 4 is based on the heavy-dominated (HD) composition model (Amenomori et al., 2008) with Sibyll 2.1, whereas this analysis uses the composition model of H4a. Due to the different composition assumptions, an apparent difference (in energy scale of 20%) between measurements appears. The Telescope Array Low-Energy Extension (TALE) experiment detects low-energy cosmic rays in the PeV energy range using atmospheric fluorescence detectors, which are also sensitive to the Cherenkov radiation produced by shower particles. There is a discrepancy between the TALE result (Abbasi et al., 2018) and the ground based experiments due to systematic effects. However, the low-energy spectrum shows an excellent agreement with the 3 years IceTop result in the overlapping region, where the knee structure is visible.
Due to the large statistics of data, the statistical uncertainty of the energy spectrum is small. However, the total systematic uncertainties (dark shaded band) are rather large. The largest contribution to the uncertainty is the composition assumption, while the effects form the unfolding method, effective area and atmosphere are relatively small. Total systematic uncertainties in percentage can be found in Ref. (Aartsen et al., 2020a). The effect of the hadronic interaction model is not included in the total systematic uncertainty.
4 Mass composition
4.1 Coincident analysis
Another way to estimate the energy spectrum was derived from coincident events seen in IceTop and IceCube. For the coincident analysis, the behavior of the in-ice detector due to the high-energy muons is studied. In-ice observables provide a handle on primary composition, since the heavier the shower-initiating particle is, the more muons are expected for a given primary energy. Therefore, iron-induced showers result in a larger deposit of Cherenkov light in IceCube than proton-induced showers of the same primary energy. In addition, the energy loss of the muon bundle at a fixed slant depth depends strongly on the multiplicity of the muon bundle and accordingly on the composition. Moreover, the stochastic behavior is also composition dependent since the probability of multiple muons emitting via a radiative energy loss on the same track is higher for iron, which has higher multiplicity, than for proton. This technique was already exploited by the EAS-TOP and MACRO experiments where results on the mass composition in the knee region were derived (Aglietta et al., 2004).
Eventually, it turns out that proton showers are expected to create a small number of muons with higher-energy stochastic losses in the detector, while iron showers have more muons, but more lower-energy stochastic losses than proton showers. Thus, we consider this stochastic fluctuation as an additional composition-sensitive parameter.
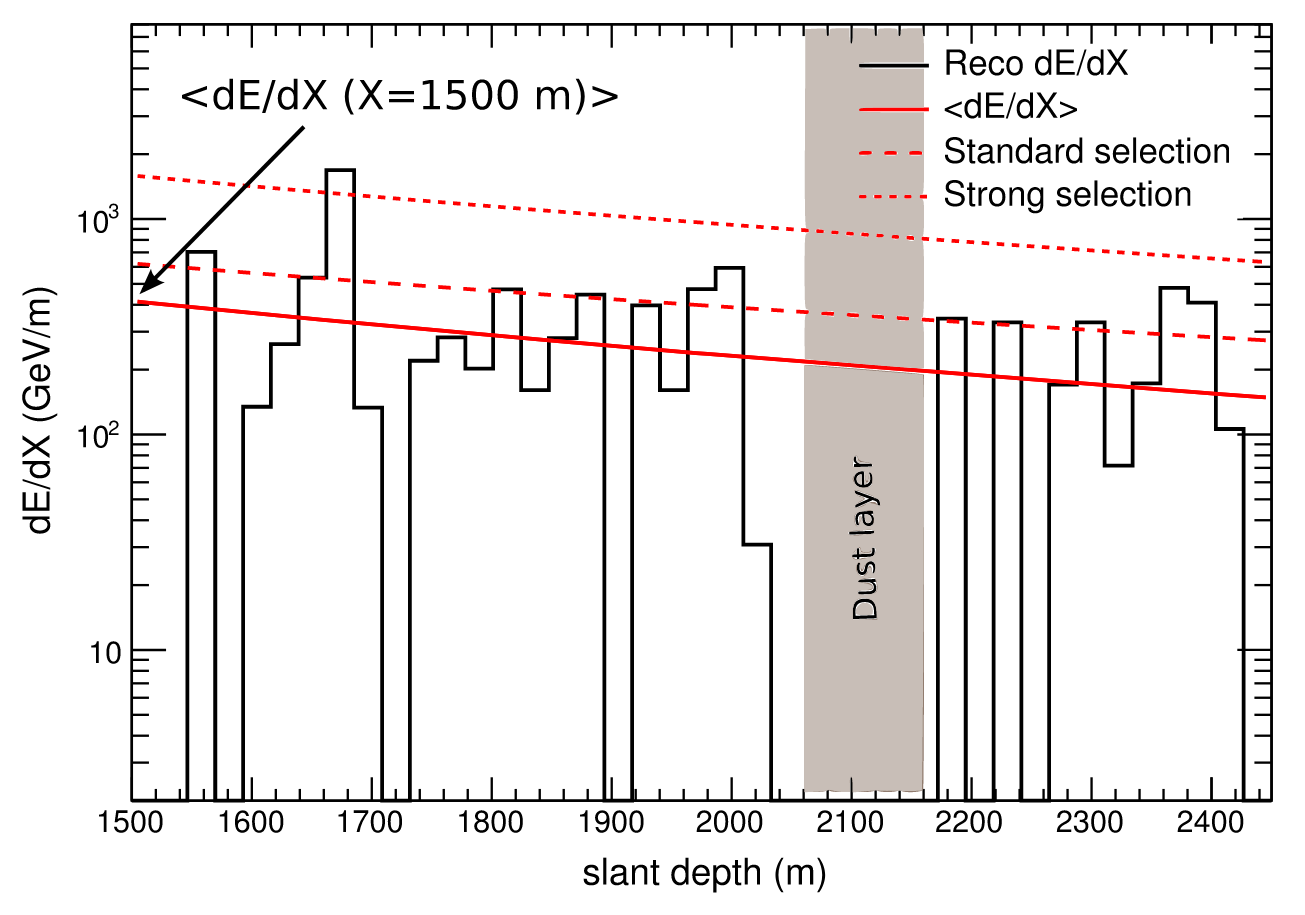
Figure 5 shows an average energy loss profile for a large event. The energy loss profile is then fitted to obtain two composition-sensitive parameters: the average energy loss (red solid line in Fig. 5) and deviations from the average (i.e. stochastics). Thus the energy loss parameter in ice, , is defined as the value from the fitting to the energy loss profile at a fixed slant depth of 1500 m, which is roughly corresponding to the top of IceCube. Two different selections of high-energy stochastics from an energy loss profile are used: a standard selection (red dashed line in Fig. 5) and a strong selection requiring higher stochastic energy losses (red dotted line in Fig. 5).
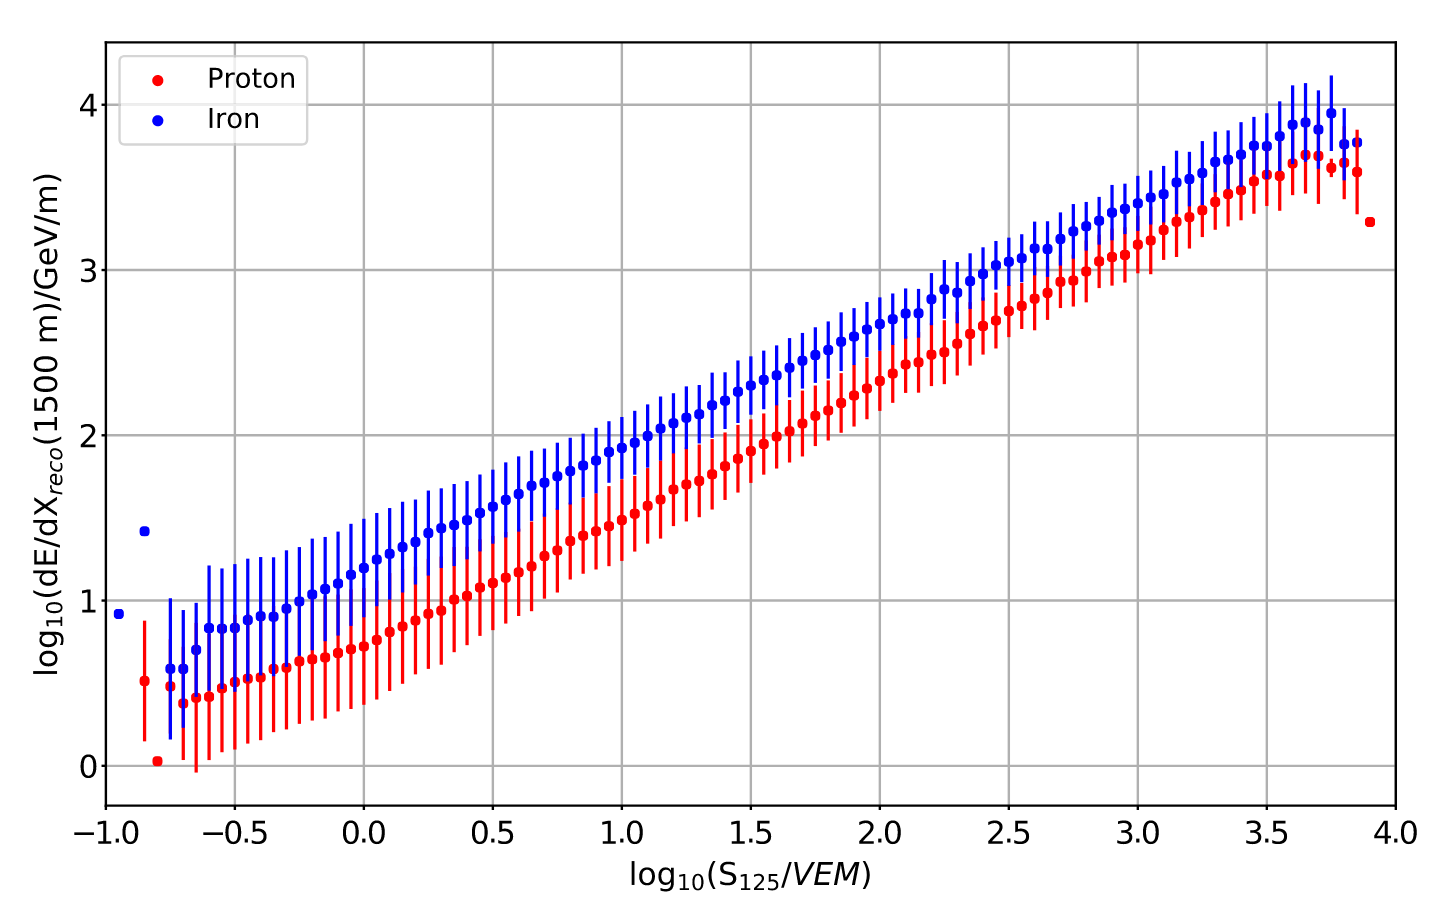
Figure 6 presents the correlation of energy proxies between the reconstructed shower size from IceTop and the reconstructed energy loss from IceCube for simulations with proton and iron assumptions. It shows a strong composition sensitivity, so there is a clear separation between proton and iron primaries.
By means of coincident events of IceTop and IceCube, a neural network technique is applied to obtain the reconstructed primary energy and the primary mass. This analysis uses five input parameters, which have a non-linear behavior in primary energy and mass. The shower size and the zenith angle in terms of cos are from IceTop, whereas the energy loss of muons and the number of high-energy stochastics of standard and strong selections are from in-ice. The network has a strong dependency on the variables of and . The neural network is trained on simulation to determine the correlation between the five inputs and the two outputs. Half of the sample of Monte Carlo simulation is used to train and test the neural network, while the other half is used for comparison of data and simulation to verify the sample. The network was constructed from three groups of network structures and the number of neurons was varied within the hidden layers. The neural network produces two outputs: one representing energy, and the other mass. The first energy output can be used to estimate the primary energy for each individual event, and to create a continuous energy distribution. The second mass output is a lower-resolution proxy for the primary mass number. Therefore, for the mass composition, the mass is not classified on an event-by-event basis and further statistical analysis is required to decompose the primary mass.
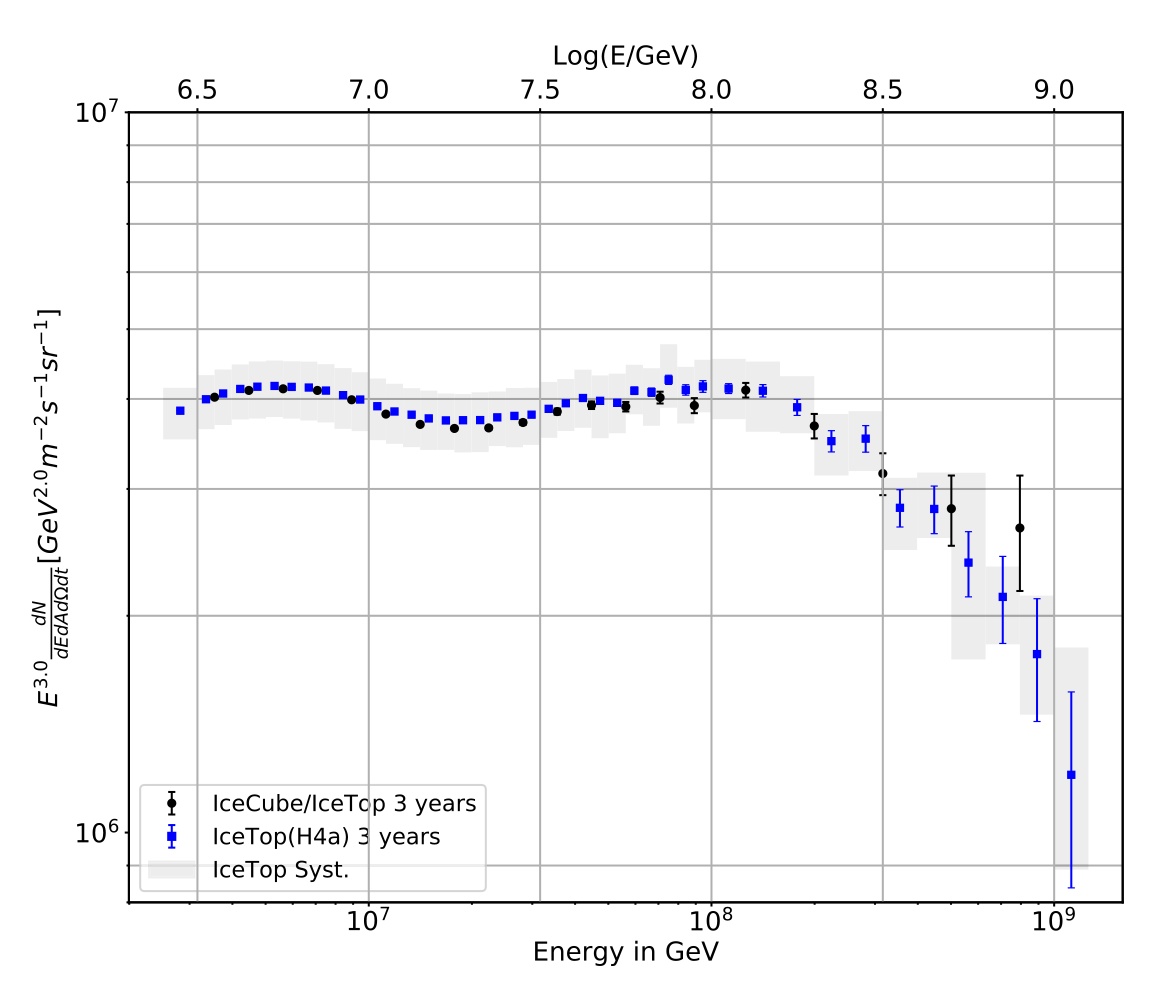
Figure 7 displays a comparison of the energy spectra resulting from the IceTop-alone analysis (blue dots) and the coincident analysis (black dots) using the neural network technique. Both analyses are in good agreement with each other within statistical and systematic uncertainties.
The neutral network mass output in each energy bin for each primary element is converted into a template probability density function (p.d.f.) by using an adaptive kernel density estimation (KDE) method. The four template p.d.f.’s were weighted to find the fractions which best fit the neural network mass output for the experimental data in the same bin in reconstructed energy.
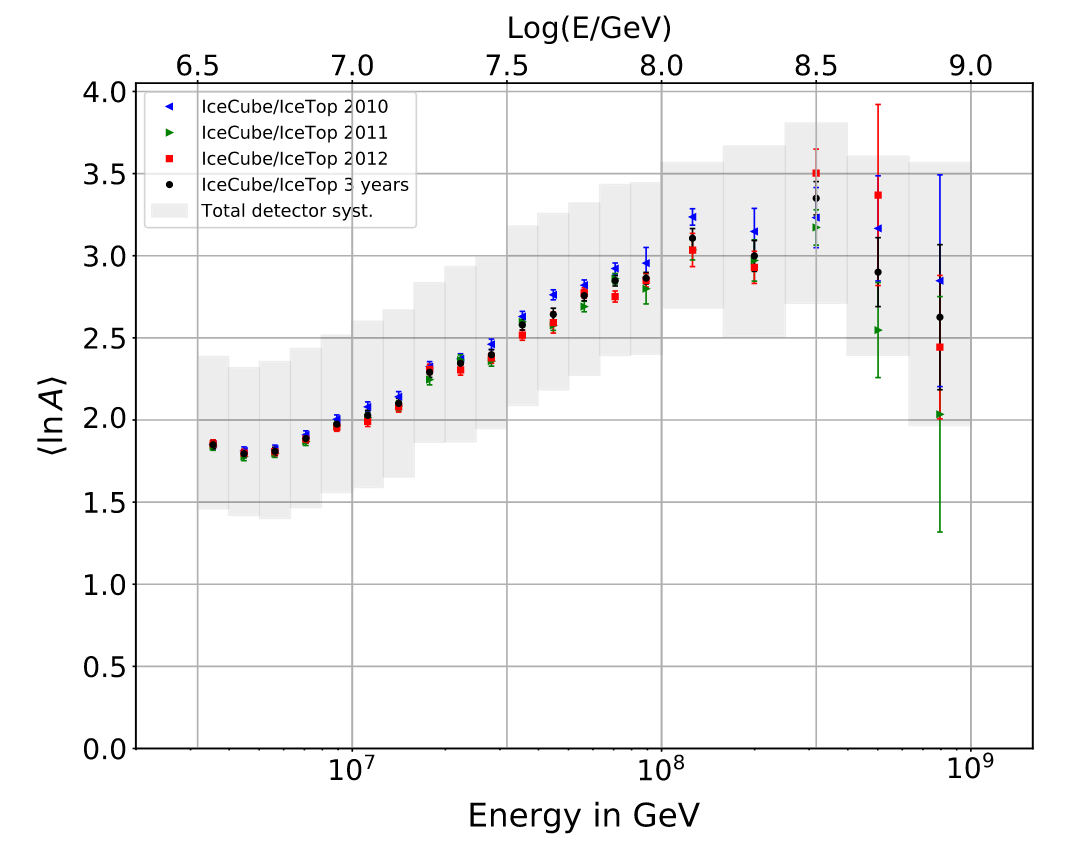
Figure 8 shows the mean logarithmic mass , which is derived from the individual fractions. The gray band represents the total coincident detector uncertainties from both the IceTop and in-ice detectors, where the largest systematic contribution is from in-ice light yield of 10%. The distribution of the mean logarithmic mass shows a clear trend toward heavy nuclei with increasing energy.
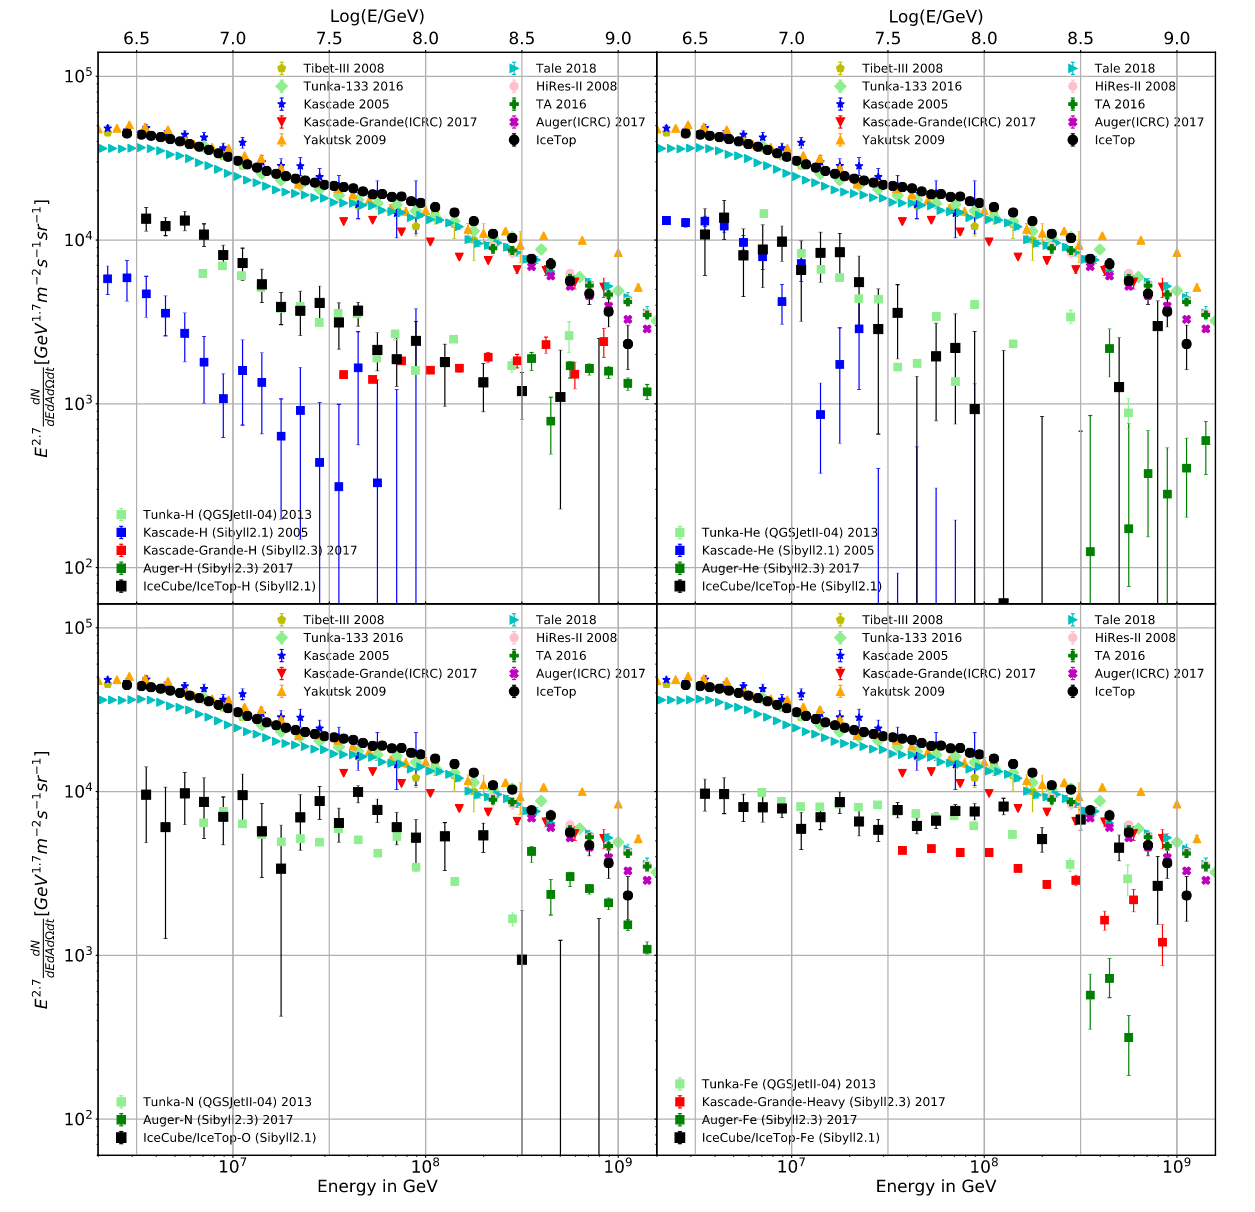
Figure 9 presents the individual spectra in comparison with the results from previous experiments for proton, helium, oxygen and iron primaries. Each of the four individual fractions from the neural network mass output is translated into an individual spectrum, which can be compared with flux models. The individual elemental fluxes cover a wide range in energy, and the individual knees of the elemental energy spectra are increasing as charge increases. Composition becomes heavier with increasing energy up to eV.
Overall the composition spectra from different experiments agree with each other, except the proton spectrum between IceTop and KASCADE (Antoni et al., 2005). This might be due to the different handling of the intermediate elements, which are strongly correlated with other mass groups. IceTop simulates four mass groups of H, He, O and Fe with Sibyll 2.1, whereas the KASCADE results use five elemental groups of H, He, CNO, Si and Fe. It may lead to the different relative abundance of cosmic ray nuclei. An additional effect might be the energy calibration, even if both experiments use the same hadronic interaction model of Sibyll 2.1. They have a different observation level: IceTop is located at 2832 m a.s.l. which is closer to the shower maximum, while KASCADE is at an altitude of 110 m a.s.l. The features of an air shower’s development can be described differently at distinct atmospheric depths. It is important to note that differences in how different experiments handle intermediate elements may lead to some small systematic differences in the flux measurements. However, a general agreement of our composition results with those from other experiments within systematic uncertainties is obtained.
5 GeV muons
In addition to the high-energy (TeV) muons detected in the in-ice detector, muons with GeV energies detected at the surface are also important for identifying properties such as primary energy and mass. And similarly, their interpretation strongly relies on Monte Carlo simulations of the air-shower development and theoretical models. Recently, an excessive amount of muons in extensive air showers at ultra-high energies was observed (Albrecht et al., 2022). However, the observed number of muons is not described by means of any existing model of hadronic interactions. This phenomenon is referred to as the “muon puzzle”. Therefore, measurements of the GeV muon components in air showers can contribute to the solution of the muon puzzle in extensive air showers.
Signals near the shower axis are dominated by contributions from electromagnetic components, which allow us to infer the shower energy with comparatively small systematic uncertainty. Signals far from the core of the shower axis are dominated by muonic components with energies of GeV. The muon lateral distribution is obtained from GeV muons identified in surface signals in the periphery of the shower. TeV muons forming collimated particle bundles are the only air shower particles apart from atmospheric neutrinos which penetrate the ice shield and reach the deep detector.
For this analysis of surface muons, three years of data collected between May 2010 and May 2013 are used. After applying selection criteria, more than 18 million events with reconstructed energies higher than 1 PeV were collected during the total measuring time of about 947 days. This analysis used events with zenith angles . Detailed selection criteria can be found in Ref. (Abbasi et al., 2022).
The analysis relies on the different response of the detector to electrons and muons. In general, the electromagnetic component dominates close to the shower axis, while the muonic component dominates at large distance from the shower core. Therefore, if the tanks are sufficiently far from the shower axis, the deposited signals are dominated by single muons. For this analysis both Hard Local Coincidence (HLC) and Soft Local Coincidence (SLC) signals are used. The HLC signals occur when two tanks from the same station are triggered within a time window of 1 s, whereas the SLC signals do not have a triggered neighbor.
Figure 10 (top) illustrates the charge signal at a reference lateral distance of 646 m. A peak around 1 VEM () is pronounced at large lateral distance, which is mainly created by muons. This muon signal mainly comes from SLC signals, since a SLC signal is likely to occur at large distance due to its large trigger probability.
The number of muons is determined using a log-likelihood method to fit the signal distributions of all events at a fixed energy, zenith angle and lateral distance. Then the muon density is estimated by dividing it by the total number of tanks and the area of the tanks at a fixed distance from the shower axis.
The raw reconstructed muon densities measured in IceTop, , as a function of lateral distance for different energy bins is presented in the bottom of Fig. 10. The lines indicate the systematic uncertainty associated with the function used to distinguish signal muons from non-muons (Abbasi et al., 2022). Filled circles correspond to lateral distances where more than 80% of signals only have SLC signals, whereas open circles for less than 80% of the occurrence of the SLC signals.
The reconstructed muon distributions are corrected based on simulations which are evaluated in the same way as the experimental data, since the accuracy of the muon density reconstruction depends on various systematic assumptions. These assumptions include the detector response to muons, signal model of the electromagnetic distribution, effect of the absorption in the snow and finite resolution of the reconstructed parameter. The correction factor is derived by dividing the reconstructed muon density by the true muon density obtained directly from the output of CORSIKA (Heck et al., 1998). This procedure was performed using simulations based on three different hadronic interaction models: Sibyll 2.1 (Ahn et al., 2009), EPOS-LHC (Pierog et al., 2015) and QGSJet-II.04 (Ostapchenko et al., 2011). The inverse of the resulting ratio is used as a multiplicative factor to correct the reconstructed experimental data. This correction factor depends on the mass composition, but the real composition is unknown. Thus the average of the proton and iron factors is applied to the experimental data.
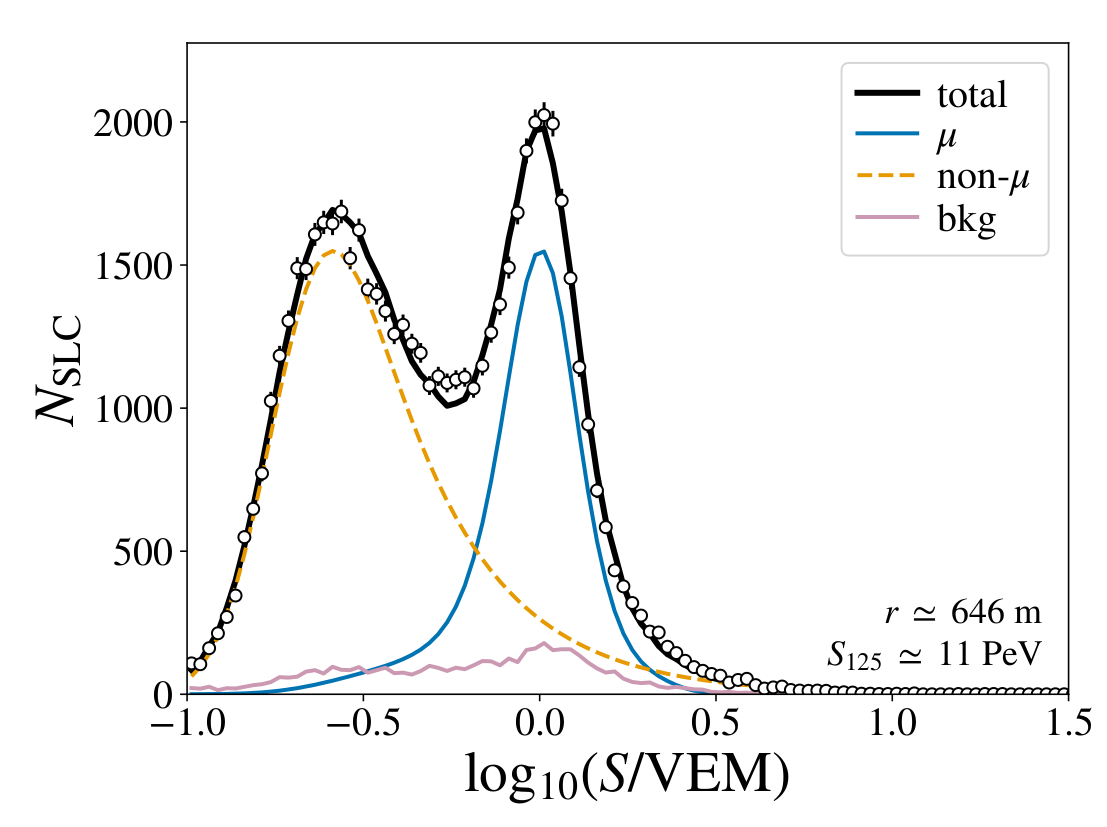
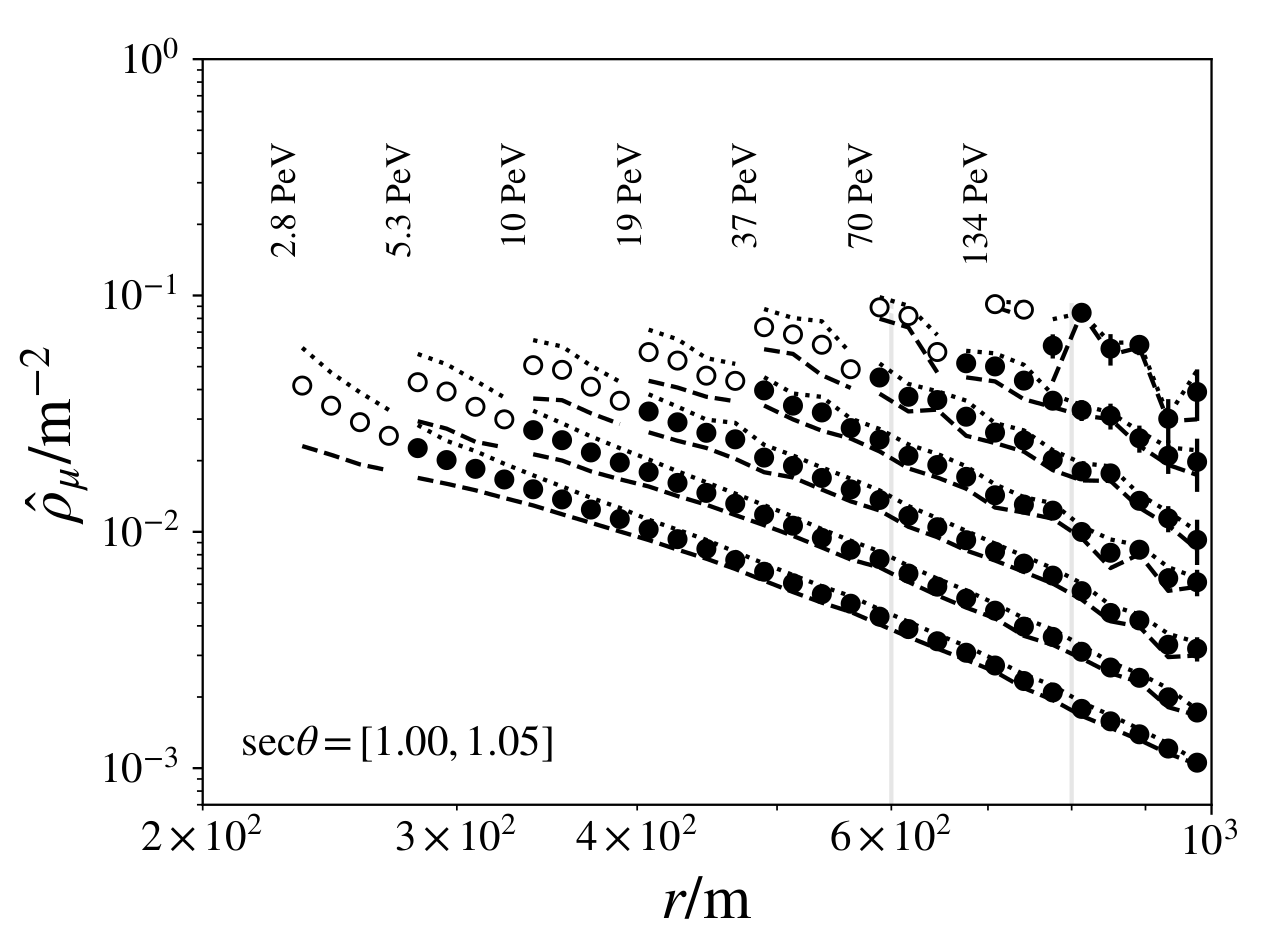
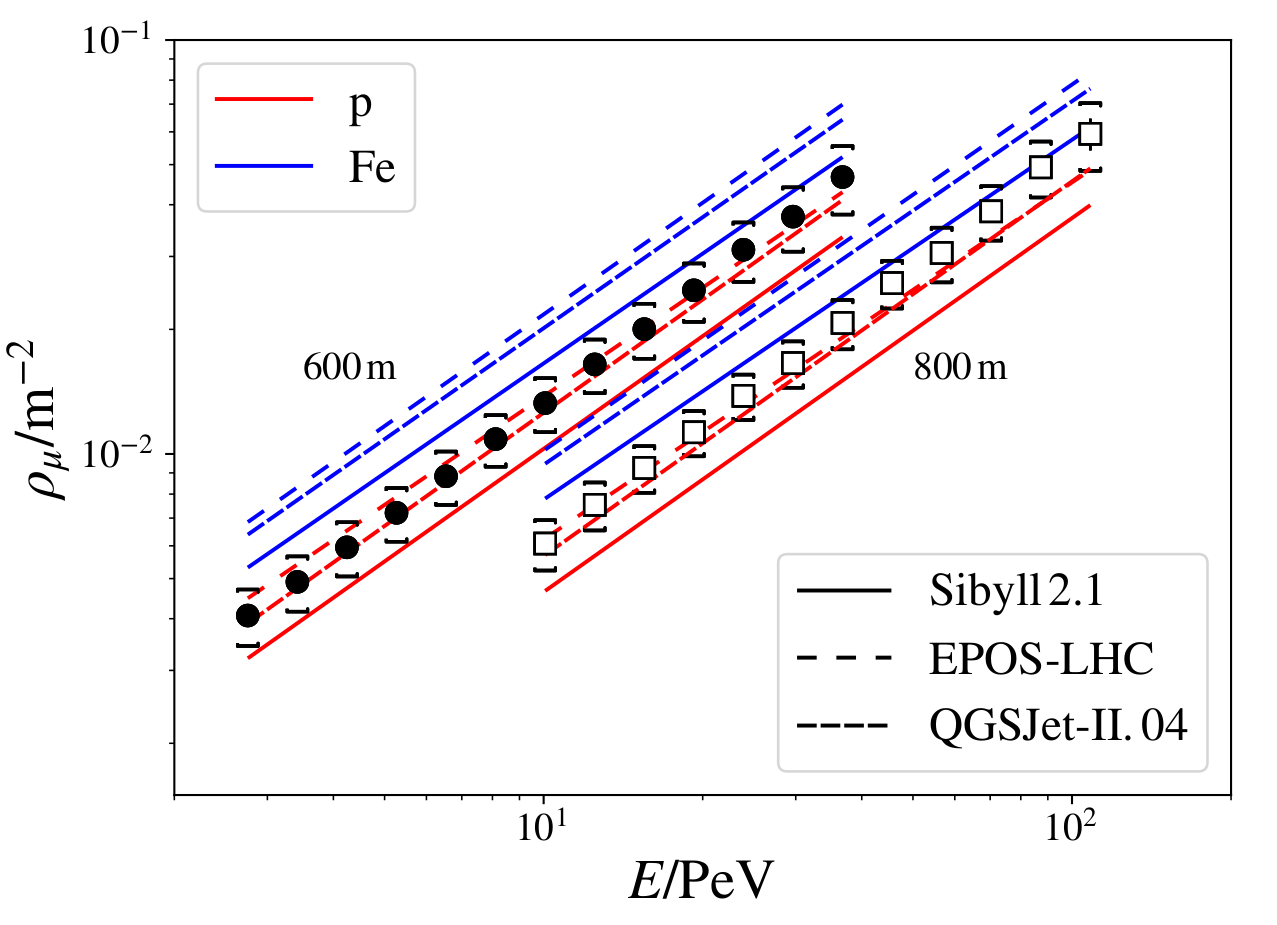
Figure 11 shows the measured mean muon density at 600 m (circles) and 800 m (squares) from the shower axis after applying the average correction. The reference distance of 600 m from the shower axis samples air shower energies between 2.5 PeV and 40 PeV, while the 800 m reference distance is for air showers with energies between 9 PeV and 120 PeV. Error bars indicate the statistical uncertainties, which are almost not visible over the whole energy range. The systematic uncertainty is shown with brackets. The main contributions to systematic uncertainties (around 5-10%) on the muon density measurement are the energy estimation, the electromagnetic signal model used and the uncertainties from the average correction factor. In addition, limited statistics of Monte Carlo simulations, the primary mass assumptions and hadronic model uncertainties contribute as well. The total systematic uncertainty is obtained by adding the individual uncertainties in quadrature and is included in the results shown in Fig. 11. The systematic shifts are up to about 10%. The result is compared with the corresponding simulated densities for proton (red) and iron (blue), respectively, using the hadronic interaction models Sibyll 2.1, EPOS-LHC and QGSJet-II.04. The distributions of the mean muon density qualitatively agree with the naive expectation that the mean mass of the primary cosmic rays becomes larger as the primary energy increases. Comparing different interaction model predictions for proton and iron primaries, the post-LHC models EPOS-LHC and QGSJet-II.04 yield higher muon densities than the pre-LHC model Sibyll 2.1.
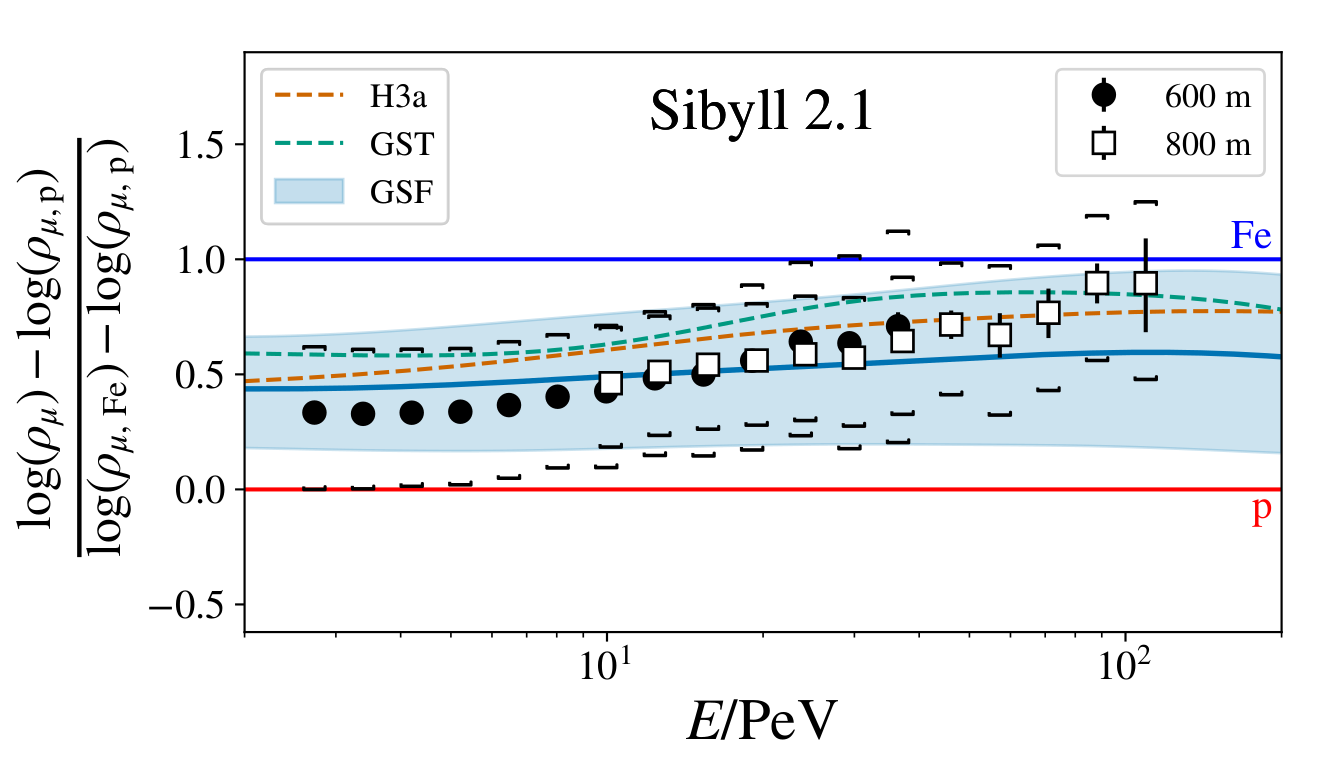
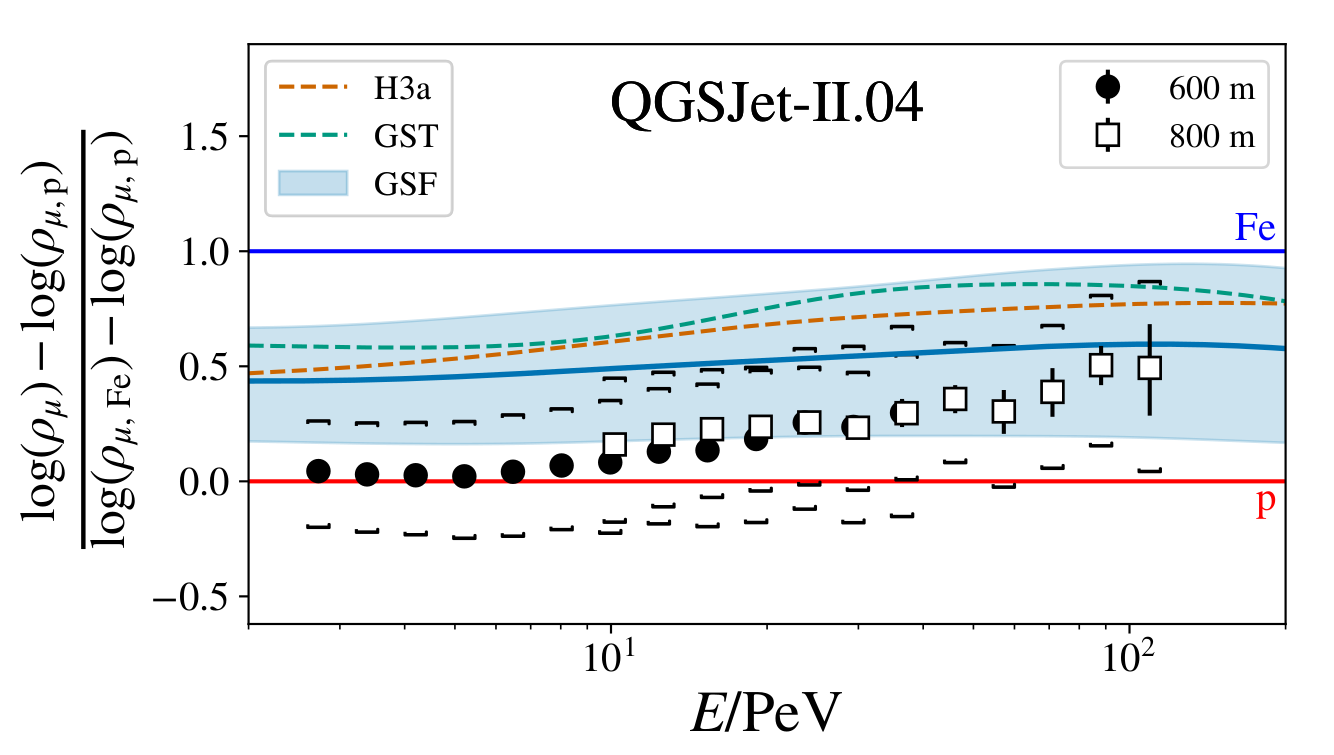
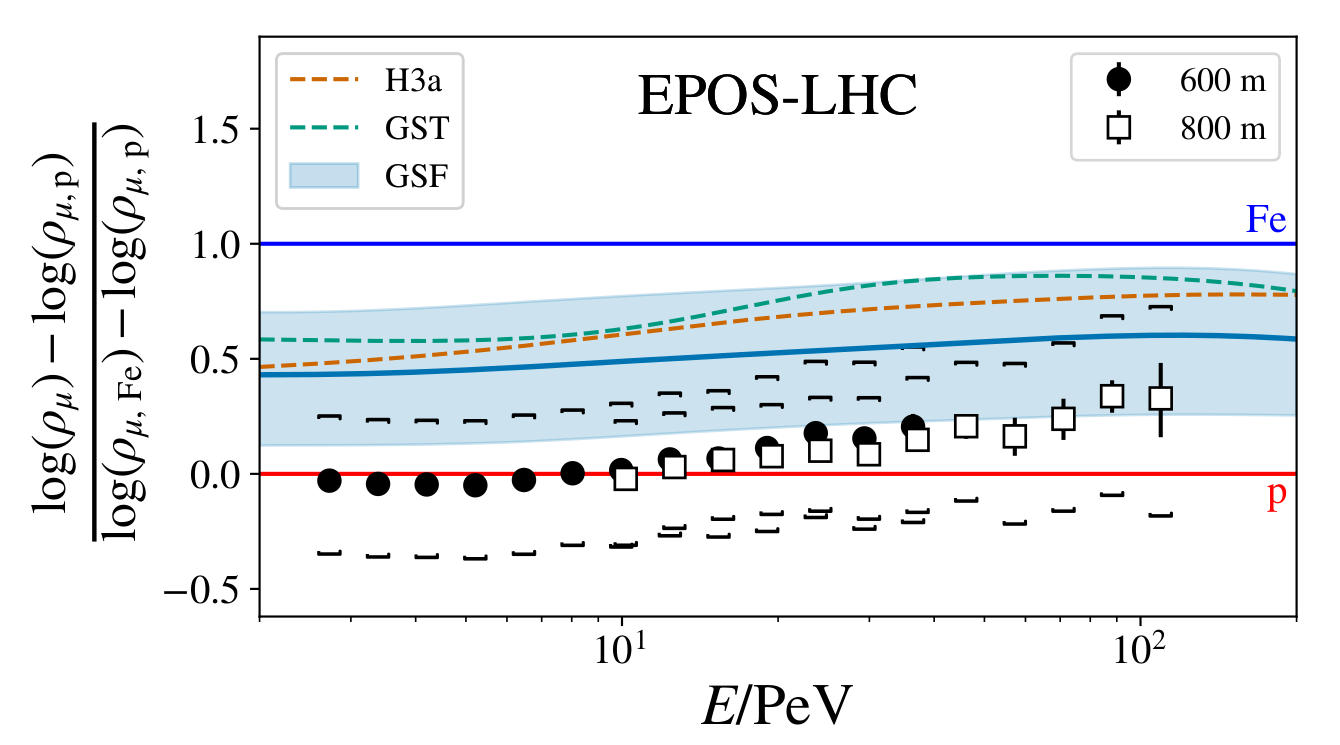
Fine details of the differences between hadronic interaction models can be investigated using the -value, which is the logarithm of the average muon densities normalized by that obtained from simulations with proton () and iron () primary assumptions:
| (3) |
where is the measured muon density. By definition, a pure proton -value is zero, and for pure iron it is 1.0. In Fig. 12, the measured muon densities are compared with different cosmic ray flux composition models of H3a (Gaisser, 2012), GST (Gaisser et al., 2013) and GSF (Dembinski et al., 2017), for three different interaction models. The blue band is the estimated uncertainty in the expected muon density for the GSF model. The shape of the measured and the predicted muon density distributions agree well with each other within systematic uncertainties, however, the difference between data and flux model expectations reflects differences in overall muon content. IceTop’s measurements match the baseline model of Sibyll 2.1 best. In contrast, post-LHC models expect a large number of muons in the energy range up to about 100 PeV. The large number of muons, i.e. large muon density, in the models yields light mass compositions when these models are used to interpret experimental data. The muon density is consistent with that of a mixed composition at around 100 PeV. Even though an inconsistency of the measured muon densities with predicted muon densities obtained from the hadronic interaction models is observed, the determination of the muon content of a shower on an event-by-event basis is promising for determining elemental mass composition in future analyses (Kang et al., 2021; Koundal et al., 2022).
Further studies of the mean muon density are performed using coincident measurements. In IceCube, low energy muons (GeV) are measured by the surface array IceTop, whereas high energy muons ( 400 GeV) can be measured in coincidence in the deep in-ice detector. Predictions of air shower observables based on simulations depend strongly on the hadronic interaction models. Therefore, a test of the interaction models is conducted by examining the consistency for different composition sensitive observables, both at the surface and at depth.
Similarly to the treatment of surface muon densities described above, the slope of the IceTop lateral distribution function (), and the energy loss at a slant depth of 1500 m, referred to as , are compared to predictions of the hadronic interaction models Sibyll 2.1, QGSJet-II.04 and EPOS-LHC. Figure 13 shows these two composition-sensitive observables, normalized similarly to the muon densities, with 0.0 representing pure protons and 1.0 representing pure iron. The data for the muon densities are also shown in this Figure. The error bars are statistical uncertainties, while the color bands represent the systematic uncertainties. Due to a limited statistics of high energy simulations, the results for QGSJet-II.04 and EPOS-LHC become unreliable in the hashed region of the figure.
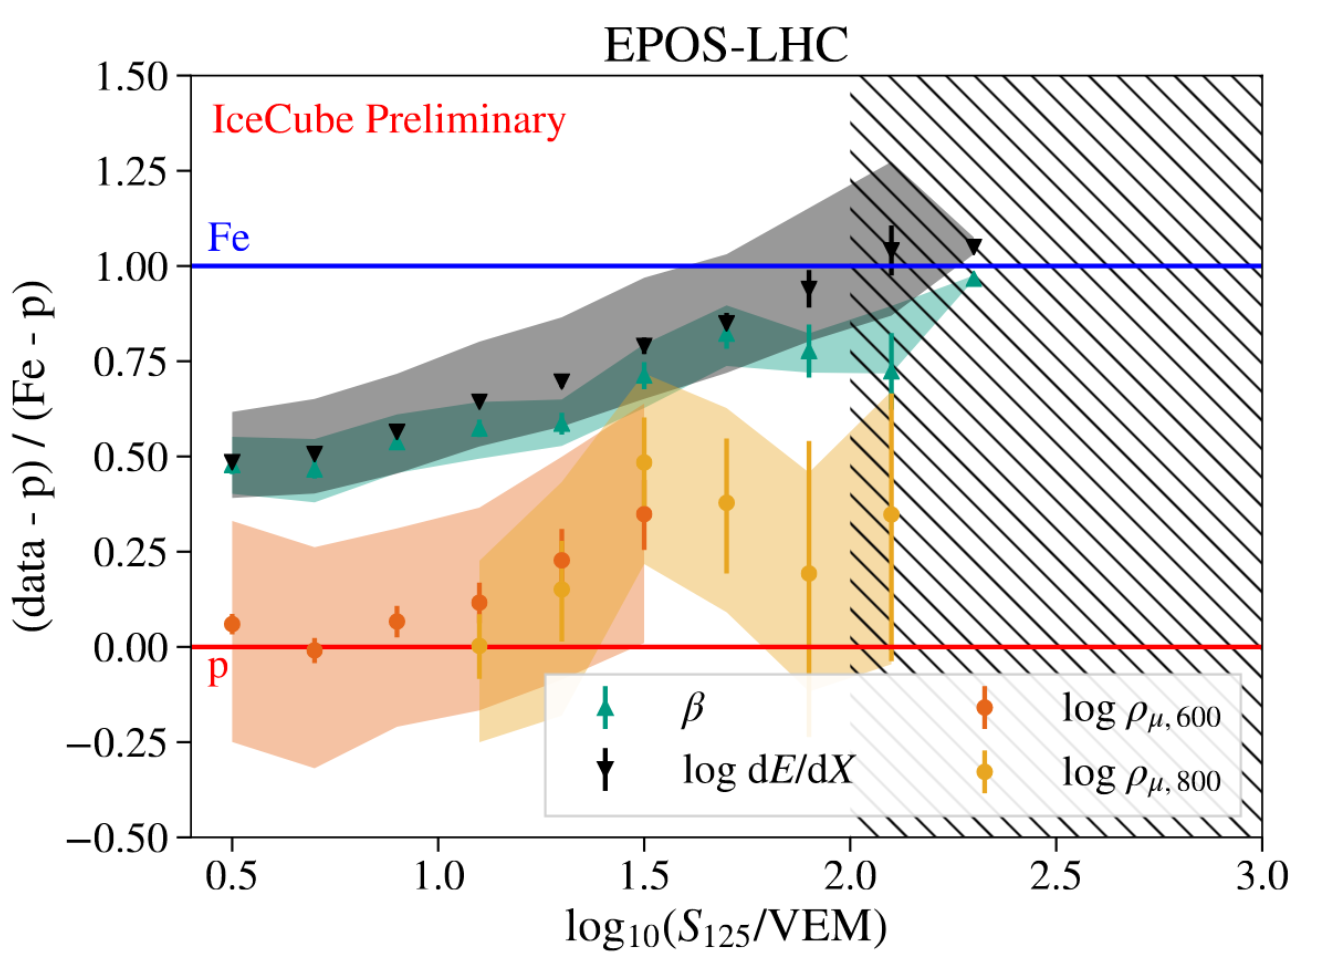
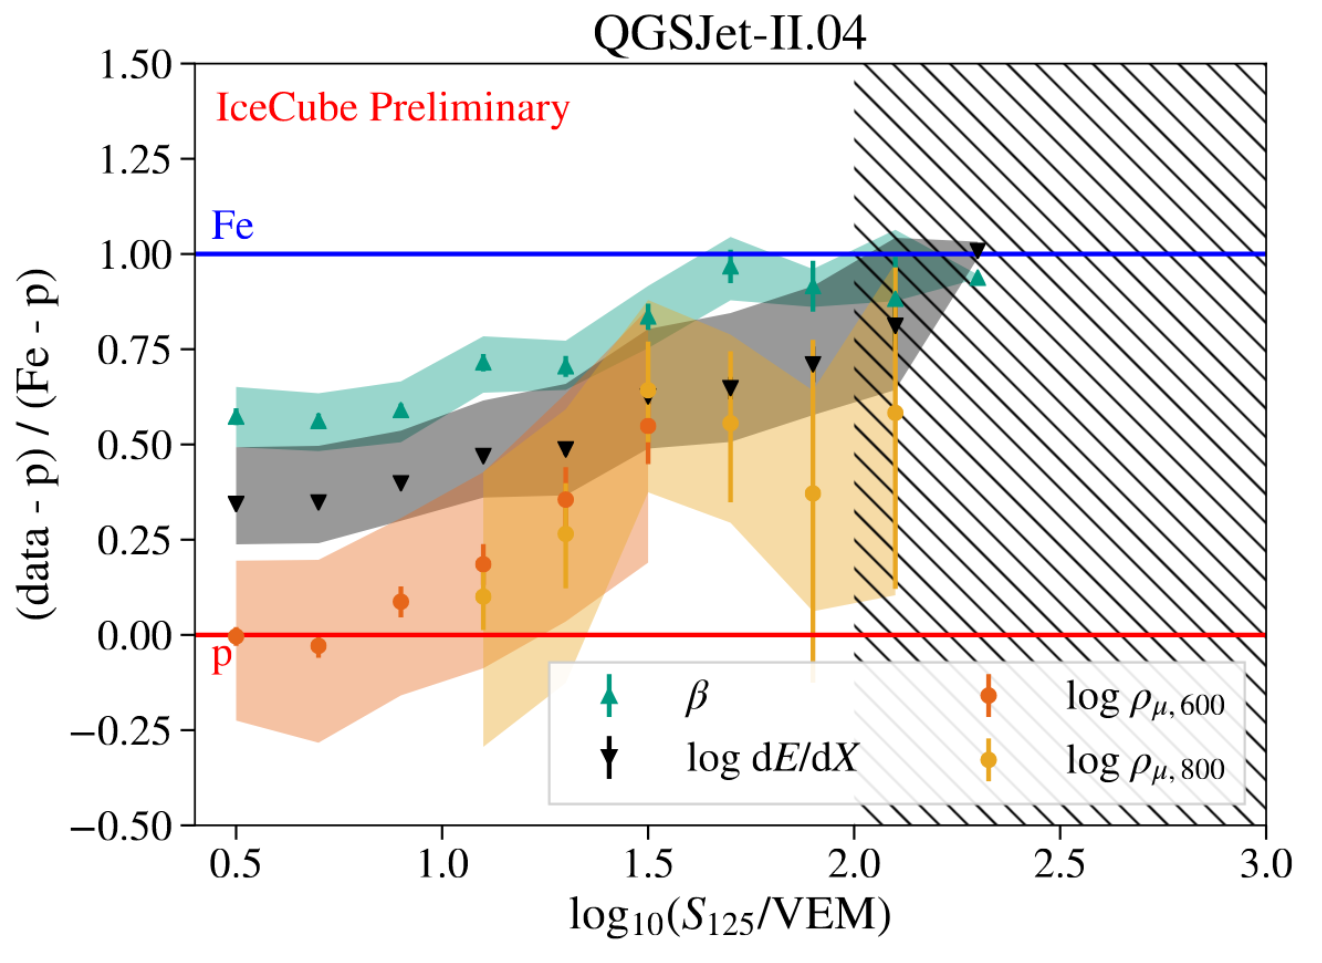
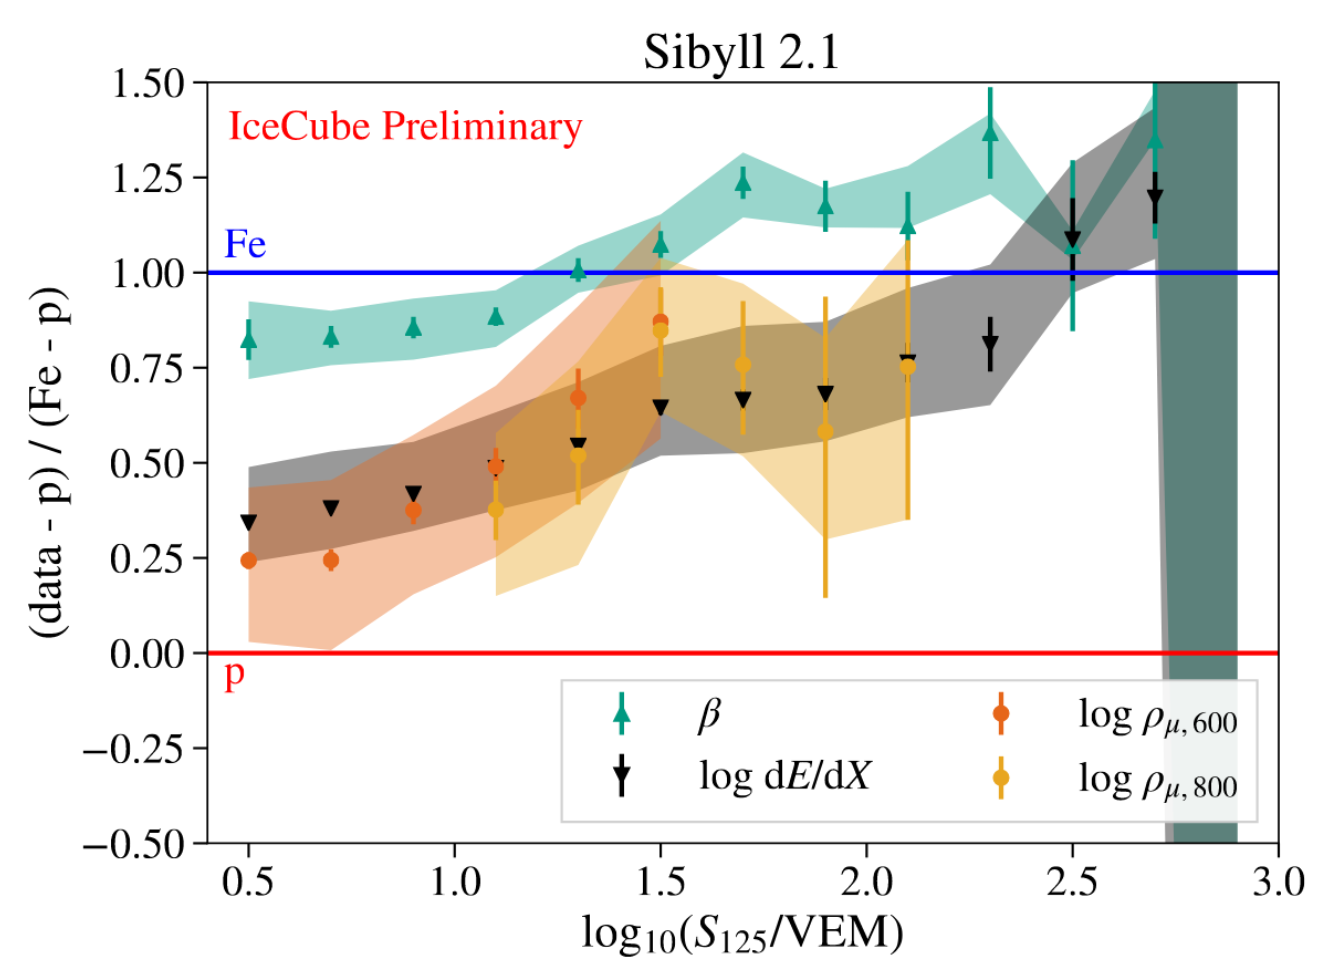
The mean values of the different parameters increase with increasing for all three models. This implies that the mass composition becomes heavier up to about 80 PeV. The general trend of increasing mass is present in all four observables. However, and sometimes indicate heavier composition than the muon density, depending on the model. The post-LHC models show that the measurements of muon densities are more likely to favour light composition, since the post-LHC models predict a larger number of muons. For EPOS-LHC, the variable of the energy loss () shifts up compared to Sibyll 2.1. Moreover, it shows a large inconsistency between GeV and TeV muon measurements, in comparison with the MC simulations.
If the simulations describe the distributions of these different variables in data correctly, the composition interpretation of all observables should be consistent. However, there is no model for which the different observables (, , and muon density) indicate a consistent composition. In particular, an inconsistency between the LDF slope and the low energy muons in all models is observed. Moreover, measurements between TeV and GeV muons are not consistent in post-LHC models. These results might be involved in a significant uncertainty in the estimation of the mass composition of cosmic rays.
6 IceCube surface array enhancement and IceCube-Gen2
IceTop is designed to measure cosmic rays in the energy range of PeV to EeV, where the transition from galactic to extragalactic sources occurs. However, the non-uniform snow accumulation on top of the Cherenkov tanks causes a non-uniform attenuation of electromagnetic components. It leads to changes in the IceTop energy threshold. Moreover, the uncertainty arising from the particle interactions inside the snow introduces additional systematic uncertainties to the air shower measurements. Thus, an enhancement of the IceTop surface array with scintillation detector panels and radio detectors is planned (Haungs, 2021; Schröder, 2021). The surface enhancement foresees the deployment of 32 stations with eight scintillation detector panels and 3 radio antennas each, along with a central data acquisition station for readout. Each scintillation detector has an active area of 1.5 m2. The antennas operate from 70 MHz to 350 MHz frequency bands. In addition, the possibility of adding air-Cherenkov telescopes (IceAct) (Schaufel et al., 2021) to the surface instrumentation is under consideration. It would measure the electromagnetic component, in particular, of lower energy air-showers, as another complementary constituent of a multi-detector IceTop enhancement.
The proposed detectors will pursue several science goals. The measurements of cosmic rays through different detection channels will improve the capabilities for studying mass composition of cosmic rays and improve the composition-dependent anisotropy studies (discussed in (McNally et al., 2021)) as well. The detectors are elevated to avoid snow accumulation, so that systematic uncertainties in the interpretation of the measurements can be improved.
In addition, the energy threshold for vetoing the background to detect astrophysical neutrinos will be lowered. Coincident measurements of the electromagnetic component of air showers on the surface array and muonic components in the in-ice array will allow us to improve calibration of the IceTop and the in-ice detector. A larger exposure and a larger energy range will improve the PeV gamma-ray search (Aartsen et al., 2020b). The detection of air showers by different detection channels will improve the understanding of hadronic interaction models. Furthermore, hybrid muon measurements will contribute to our understanding of the muon puzzle in extensive air showers.
A prototype of one station is deployed at the South Pole since 2020 and is performing well. The first coincidence signals of cosmic ray air showers were obtained using scintillation detectors, antennas, and IceTop. A detailed discussion on the prototype station and its performance can be found in Ref. (Dujmovic et al., 2021).
In the next-generation IceCube-Gen2 detector, the surface array will be extended to cover an area of about 6 km2 with approximately 160 stations in total. The baseline design of the surface array enhancement will be similar to that of the surface array instrumentation for IceCube-Gen2 with a larger spacing of about 240 m. The IceCube-Gen2 surface array will further improve the science capabilities of IceTop and its enhancement and enable additional scientific goals, since the acceptance for the coincident events measured by surface and in-ice arrays increases by a factor of about 30 compared to IceCube due to the larger area and the larger accessible angular range (Aartsen et al., 2021).
7 Conclusion
Using three years of measurements from IceTop and IceCube, the energy spectrum and the mass composition of the primary cosmic rays are simultaneously reconstructed. IceCube with its surface companion IceTop covers the large energy range from below 1 PeV to beyond 1 EeV. Moreover, the coincidence measurement of low-energy muons at the surface and high-energy muons in the deep detector offers to enable the study of muons as well as hadronic interaction models.
Further intriguing analyses are under investigation: more years of experimental data are available and more intermediate elements of cosmic rays will be simulated. Furthermore, an investigation of new composition-sensitive parameters is currently under development.
Lastly, the quality of surface measurements from IceTop will be enhanced by the deployment of a multi-detector array of scintillation detectors and radio antennas, where the accuracy and the sky coverage of IceTop will be significantly increased. An additional detection channel, the air-Cherenkov telescope, will extend IceCube’s sensitivity at energies around a few PeV and below.
The extension of the planned IceTop enhancement, IceCube-Gen2 surface array, will increase the exposure by an order of magnitude and will enable a better understanding of many open questions regarding the highest energy cosmic rays from our galaxy.
References
- Aab et al. (2017) Aab, A. et al. (Pierre Auger) (2017). Observation of a large-scale anisotropy in the arrival directions of cosmic rays above ev. Science, 357, 1266–1270.
- Aartsen et al. (2019) Aartsen, M. et al. (IceCube) (2019). Cosmic ray spectrum and composition from pev to eev using 3 years of data from icetop and icecube. Phys. Rev. D, 100, 082002.
- Aartsen et al. (2020a) Aartsen, M. et al. (IceCube) (2020a). Cosmic ray spectrum from 250 tev to 10 pev using icetop. Phys. Rev. D, 102, 122001.
- Aartsen et al. (2020b) Aartsen, M. et al. (IceCube) (2020b). Search for pev gamma-ray emission from the southern hemisphere with 5 yr of data from the icecube observatory. Astrophys. J., 891, 9.
- Aartsen et al. (2021) Aartsen, M. et al. (IceCube) (2021). Icecube-gen2: the window to the extreme universe. Journal of Physics G: Nuclear and Particle Physics, 48, 060501.
- Aartsen et al. (2017) Aartsen, M. G. et al. (IceCube) (2017). The icecube neutrino observatory: instrumentation and online systems. J. Instr., 12(03), P03012.
- Abbasi et al. (2013) Abbasi, R. et al. (IceCube) (2013). Icetop: The surface component of icecube. Nucl. Instr. and Meth. A, 700, 188–220.
- Abbasi et al. (2018) Abbasi, R. et al. (Telescope Array) (2018). The cosmic-ray energy spectrum between 2 pev and 2 eev observed with the tale detector in monocular mode. Astrophys. J., 865, 74.
- Abbasi et al. (2022) Abbasi, R. et al. (IceCube) (2022). Density of gev muons in air showers measured with icetop. Phys. Rev. D, 106, 032010.
- Abreu et al. (2021) Abreu, P. et al. (Pierre Auger) (2021). The energy spectrum of cosmic rays beyond the turn-down around ev as measured with the surface detector of the pierre auger observatory. Eur. Phys. J. C, 81, 966.
- Aglietta et al. (2004) Aglietta, M. et al. (ESA-TOP and MACRO) (2004). The cosmic ray primary composition between and ev from extensive air showers electromagnetic and tev muon data. Astroparticle Physics, 20, 641–652.
- Ahn et al. (2009) Ahn, E. et al. (2009). Cosmic ray interaction event generator sibyll 2.1. Phys. Rev. D, 80, 94003.
- Albrecht et al. (2022) Albrecht, J. et al. (2022). The muon puzzle in cosmic-ray induced air showers and its connection to the large hadron collider. Astrophys. Space Sci., 367, 27.
- Alfaro et al. (2017) Alfaro, R. et al. (HAWC) (2017). All-particle cosmic ray energy spectrum measured by the hawc experiment from 10 to 500 tev. Phys. Rev. D, 96, 122001.
- Amenomori et al. (2008) Amenomori, M. et al. (TIBET-III) (2008). The all-particle spectrum of primary cosmic rays in the wide energy range from 1014 ev to 1017 ev observed with the tibet-iii air-shower array. Astrophys. J., 678, 1165.
- Antoni et al. (2005) Antoni, T. et al. (KASCADE) (2005). Kascade measurements of energy spectra for elemental groups of cosmic rays: Results and open problems. Astropart. Phys., 24, 1–25.
- Apel et al. (2011) Apel, W. et al. (KASCADE-Grande) (2011). Kneelike structure in the spectrum of the heavy component of cosmic rays observed with kascade-grande. Phys. Rev. Lett., 107, 171104.
- Arteaga-Velázquez et al. (2018) Arteaga-Velázquez, J. et al. (KASCADE-Grande) (2018). Data-driven model of the cosmic-ray flux and mass composition from 10 gev to 1011 gev. In Proceedings, 35th International Cosmic Ray Conference (ICRC2017), Busan, Korea 2017 (p. PoS(ICRC2017)316).
- Bellido et al. (2018) Bellido, J. et al. (Pierre Auger) (2018). Depth of maximum of air-shower profiles at the pierre auger observatory: Measurements above 1017.2 ev and composition implications. In Proceedings, 35th International Cosmic Ray Conference (ICRC2017), Busan, Korea 2017 (p. PoS(ICRC2017)506).
- Blümer et al. (2009) Blümer, J. et al. (2009). Cosmic rays from the knee to the highest energies. Prog. Part. Nucl. Phys., 63, 293.
- Budnev et al. (2020) Budnev, N. et al. (TUNKA) (2020). The primary cosmic-ray energy spectrum measured with the tunka-133 array. Astropart.Phys., 117, 102406.
- D’Agostini (1995) D’Agostini, G. (1995). A multidimensional unfolding method based on bayes’ theorem. Nucl. Instrum. Methods Phys. Res., A 362, 487.
- Dembinski et al. (2017) Dembinski, H. et al. (2017). Data-driven model of the cosmic-ray flux and mass composition from 10 gev to 1011 gev. In Proceedings, 35th International Cosmic Ray Conference (ICRC2017), Busan, Korea 2017 (p. PoS(ICRC2017)533).
- Dujmovic et al. (2021) Dujmovic, H. et al. (IceCube) (2021). First air-shower measurements with the prototype station of the icecube surface enhancement. In Proceedings, 37th International Cosmic Ray Conference (ICRC2021), Online-Berlin, Germany 2021 (p. PoS(ICRC2021)314).
- Ferrari et al. (2005) Ferrari, A. et al. (2005). Fluka : A multi-particle transport code. In CERN-2005-10.
- Gaisser et al. (2013) Gaisser, K. et al. (2013). Cosmic ray energy spectrum from measurements of air showers. Front. Phys., 8, 748.
- Gaisser (2012) Gaisser, T. (2012). Spectrum of cosmic-ray nucleons, kaon production, and the atmospheric muon charge ratio. Astroparticle Physics, 35, 801.
- Haungs (2021) Haungs, A. (IceCube) (2021). Cosmic-ray studies with the surface instrumentation of icecube. In Proceedings, 37th International Cosmic Ray Conference (ICRC2021), Online-Berlin, Germany 2021 (p. PoS(ICRC2021)336).
- Heck et al. (1998) Heck, D. et al. (1998). Corsika: A monte carlo code to simulate extensive air showers. Forschungszentrum Karlsruhe Internal Report FZKA6019, .
- Hillas (2005) Hillas, A. (2005). Can diffusive shock acceleration in supernova remnants account for high-energy galactic cosmic rays? J. Phys. G: Nucl. Part. Phys., 31, R95.
- Ivanov et al. (2009) Ivanov, A. et al. (2009). Measuring extensive air showers with cherenkov light detectors of the yakutsk array: the energy spectrum of cosmic rays. New J. Phys., 11, 065008.
- Kang et al. (2021) Kang, D. et al. (IceCube) (2021). Studies of a muon-based mass sensitive parameter for the icetop surface array. In Proceedings, 37th International Cosmic Ray Conference (ICRC2021), Online-Berlin, Germany 2021 (p. PoS(ICRC2021)312).
- Koundal et al. (2022) Koundal, P. et al. (IceCube) (2022). Cosmic-ray composition analysis at icecube using graph neural networks. In 27th European Cosmic Ray Symposium - ECRS, Nijmegen, the Netherlands 2022 (p. PoS(ECRS)085).
- McNally et al. (2021) McNally, F. et al. (IceCube) (2021). Observation of cosmic ray anisotropy with nine years of icecube data. In Proceedings, 37th International Cosmic Ray Conference (ICRC2021), Online-Berlin, Germany 2021 (p. PoS(ICRC2021)320).
- Ostapchenko (2006) Ostapchenko, S. (2006). Qgsjet-ii: towards reliable description of very high energy hadronic interactions. Nucl. Phys. B, Proc. Suppl., 151, 143.
- Ostapchenko et al. (2011) Ostapchenko, S. et al. (2011). Qgsjet-ii: physics, recent improvements, and results for air showers. Phys. Rev. D, 83, 014018.
- Peters (1961) Peters, B. (1961). Primary cosmic radiation and extensive air showers. II Nuovo Cimento, 22, 800.
- Pierog et al. (2015) Pierog, T. et al. (2015). Epos lhc: Test of collective hadronization with data measured at the cern large hadron collider. Phys. Rev. C, 92, 034906.
- Rawlins (2013) Rawlins, K. (IceCube) (2013). The effect of snow accumulation on signals in icetop. In Proceedings, 33rd International Cosmic Ray Conference (ICRC2013), Rio de Janeiro 2013 (p. arXiv:1309.7006v2).
- Schaufel et al. (2021) Schaufel, M. et al. (IceCube) (2021). Hybrid cosmic ray measurements using the iceact telescopes in coincidence with the icecube and icetop detectors. In Proceedings, 37th International Cosmic Ray Conference (ICRC2021), Online-Berlin, Germany 2021 (p. PoS(ICRC2021)276).
- Schröder (2021) Schröder, F. (IceCube) (2021). The surface array planned for icecube-gen2. In Proceedings, 37th International Cosmic Ray Conference (ICRC2021), Online-Berlin, Germany 2021 (p. PoS(ICRC2021)407).
- Verpoest et al. (2021) Verpoest, S. et al. (IceCube) (2021). Testing hadronic interaction models with cosmic ray measurements at the icecube neutrino observatory. In Proceedings, 37th International Cosmic Ray Conference (ICRC2021), Online-Berlin, Germany 2021 (p. PoS(ICRC2021)357).
- Yoon et al. (2011) Yoon, Y. et al. (2011). Cosmic-ray proton and helium spectra from the first cream flight. The Astrophysical Journal, 728, 122.