The influence of metallic overlayers on ferromagnetism in LaMnO3
Abstract
LaMnO3 (LMO) thin films epitaxially grown on SrTiO3 (STO) usually exhibit ferromagnetism above a critical layer thickness. We report the use of scanning SQUID microscopy (SSM) to study the suppression of the ferromagnetism in STO/LMO/metal structures. By partially covering the LMO surface with a metallic layer, both covered and uncovered LMO regions can be studied simultaneously. While Au does not significantly influence the ferromagnetic order of the underlying LMO film, a thin Ti layer induces a strong suppression of the ferromagnetism, over tens of nanometers, and a large change in the out-of-plane lattice parameter. We relate the suppression of the ferromagnetism to the scavenging of oxygen and diffusion of Ti approximately 5 nanometers deep into the film, which takes place at timescales of days. Furthermore, we demonstrate that by patterning Ti/Au overlayers, we can define ferromagnetic structures down to sub-micrometer scales.
Complex oxide thin films exhibit remarkable versatility, making them suitable for many potential applications in electronics, spintronics and catalysis, among other fields [1, 2, 3, 4]. Their tunability allows for precise control and manipulation of their properties, for example by the background pressure during growth [5, 6, 7], the incorporation of the oxide in a heterostructure [8, 9, 10, 11], the modulation of strain [12, 13], doping, or selecting the thickness [14, 15]. LaMnO3 (LMO) is a good example of such a complex oxide with versatile properties, in particular its magnetic properties. LMO is an antiferromagnetic insulator in the bulk, but becomes ferromagnetic when grown epitaxially on SrTiO3 (STO) under the right oxygen background conditions [6]. However, the ferromagnetism only arises above a critical thickness of 6 unit cells [15, 16].
For a thin film of a complex oxide, such as LMO, to be incorporated into an electronic device, it is imperative to contact it with conventional metals. When the electronic properties are studied, it is common to contact the complex oxides with a Ti/Au layer, where Ti serves as an adhesion layer [17, 18]. However, it is widely known that Ti has a high oxygen affinity, easily oxidizing in contact with oxygen from the environment [19, 17] or with oxygen-rich materials, in the right thermodynamic conditions [20, 21]. In spite of the importance, a systematic study about the interface between metals and complex oxides lacks. Which is quite surprising, considering that one may expect significant changes in oxide properties due to their tuneability and the chemical reactivity of elements like Ti, for instance.
In this work, we investigate the influence of the metallic overlayers Ti and Au on the magnetic, structural and chemical properties of LMO thin films grown on STO substrates. The technique of scanning SQUID microscopy (SSM) is used, as it is a powerful tool to image ferromagnetism with a micrometer-scale resolution [22, 23]. We find that the Ti layer suppresses the ferromagnetism in LMO and demonstrate a clear time dependency. Moreover, we report a significant change in the out-of-plane lattice parameters and in the stoichiometry for several nanometers deep at the interface. Finally, we show that by patterning the Ti layer we can locally modulate the magnetic properties and observe dipolar-like magnetic signals in sub-micrometer ferromagnetic structures.
For the experiments, metal layers of Ti and Au were sputtered in an inert Ar atmosphere on top of pulsed-laser deposited LMO on SrTiO3 substrates. Details on the sample fabrication are provided in the supplemental materials [24]. In order to have a clear measurement of the influence of the metallic overlayers on LMO, Ti and Au were deposited by means of photolithography and lift-off processing, and cover only one half of the LMO film. In this way it is possible to measure both covered and uncovered regions in the same SSM scan. The Au layer impedes the oxidation of the Ti film upon atmospheric exposure. Fig. 1(a) shows a scan over the border region, where in the right side of the picture, a 20 unit cell (u.c.) thick LMO film (approximately 7.9 nm) is covered by 4 nm of Ti and 60 nm of Au. On the left (uncovered) side, the magnetic field exhibits a pattern in line with previous SSM experiments on ferromagnetic LMO thin films performed in our group [15, 23]. It is presumed that the magnetism in the LMO is predominantly in-plane, with stray out-of-plane magnetic fields arising at domains walls. However, on the right side the signal is heavily suppressed, showing the effect of covering the LMO with the metal layers. Additional scans were performed entirely on the right side of the sample to show that no signal has actually been measured above the noise level of the SQUID. The SSM setup [25, 22, 15] has a sensitivity in the order of with a bandwidth of 1000 Hz, where is the magnetic flux quantum. For more details on the setup and SSM measurements see supplemental material Sec. S3 [24].
A control sample with no Ti layer, where only Au was sputtered using the exact same processing conditions as the Ti/Au samples, showed no significant decrease in the measured magnetic signal strength with respect to the uncovered LMO film, see Fig. S3(a). Therefore, it is concluded that the presence of the overlaying Au layer does not significantly affect the ferromagnetism in LMO, nor should the sputtering process itself be responsible for the suppression observed. On the other hand, a sample with only a Ti layer did show a significant suppression, see Fig. S3(b), so the Ti layer does play a dominant role in the effect.
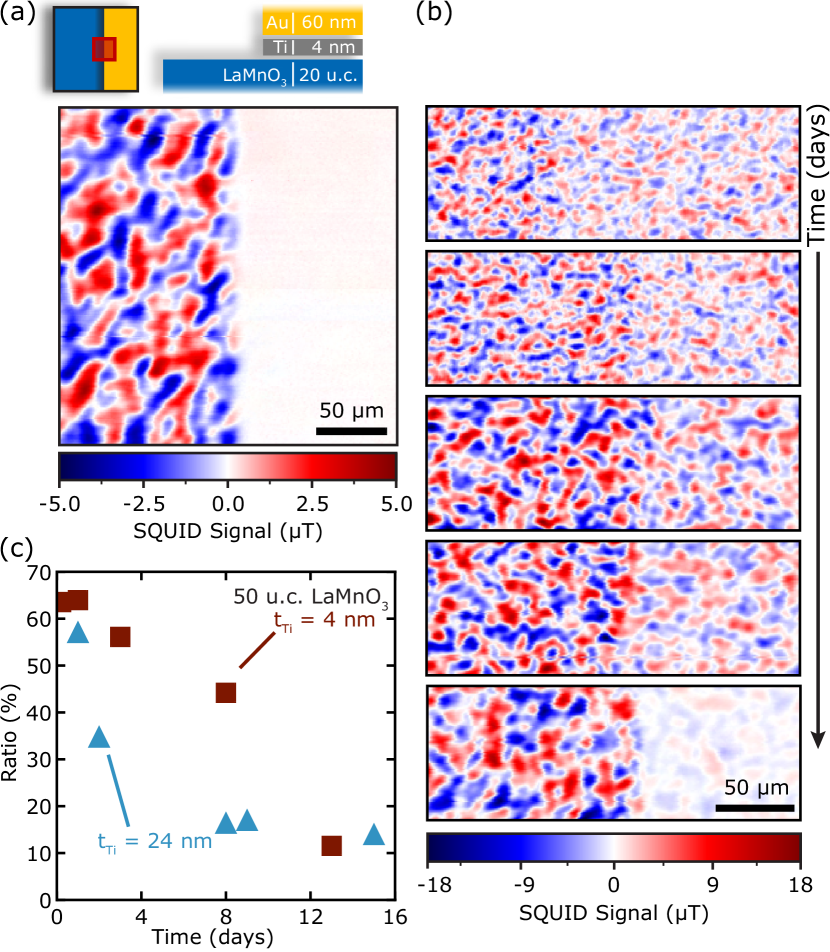
The ratio between the thickness of the LMO and Ti layers is important for the level of suppression of the ferromagnetic behavior. Experiments with a thicker LMO layer of 50 u.c. show that it is still possible to measure a significant stray magnetic field originating from the Ti-covered LMO for the same thickness of the Ti layer of 4 nm, although the suppression effect remains very clear. Again, a Au capping layer is used to impede oxidation of the Ti from the ambient environment. Fig. 1(b) shows a panel comprised of several scans on a sample of 50 u.c. thick LMO partially covered with 4 nm of Ti, performed at different moments in time after the deposition of the metal layers. Between the measurements the sample was stored at room temperature in a nitrogen flushed desiccator. Again, the left side of the scans shows the uncovered region, while the right side shows the Ti/Au-covered film. To enable a quantitative comparison of the ferromagnetic signal in both regions of the scans, the variance (root mean square value) of the SQUID voltage signal (V) in a defined area on each side of the border was calculated. The SQUID voltage is linearly dependent on the magnetic field as measured by the SQUID. This quantity can be used to estimate the variance of the strength of the measured magnetic field and can be used to compare between samples and when scanning parameters are changed [23]. Then, for each scan, a ratio is defined by . The panels in Fig. 1(b) show that the suppression of the ferromagnetism in the Ti-covered LMO film increases with time in a timescale of several days. After 13 days, is reduced to approximately 12 % compared to the uncovered region. It is also noteworthy that there must be at least two different rates of the decrease of , because there is an abrupt decrease immediately after the deposition of the Ti layer, as after a few hours the ratio is already down to approximately 64 %. Previous experimental studies dedicated to the oxidation of Ti thin films show that the oxidation process can be divided into two stages: a fast initial oxygen absorption step, taking place in a few minutes, followed by a slower process that can take hours to days [26, 27]. The occurrence of these different oxidation regimes is dependent on the Ti film thickness [28]. Our experiments corroborate this. Thus, this leads us to believe that after depositing Ti/Au, oxygen vacancies are created rapidly, which is sufficient to completely suppress the magnetism in 20 u.c. thick films but not in the 50 u.c. films. Here diffusion of the oxygen vacancies takes place on a longer time scale after the initial deposition, suppressing the ferromagnetic order further. Data on the diffusion of oxygen species in LMO is scarce, but recently a study gave indications for a high mobility of oxygen vacancies in LMO at moderate temperatures [29].
To study the dependence of the ferromagnetism suppression on the thickness of the Ti layer, several samples were fabricated while keeping the thickness of LMO to 50 u.c. and choosing different values of the Ti layer thickness. Fig. 1(c) shows the ratio as a function of time for two different thickness values of the Ti layer: 4 and 24 nm. The comparison of the time evolution of the ratio for these two samples shows that for the same time period since the deposition of Ti, the level of suppression is different, i.e. the Ti thickness seems to determine the rate of suppression of the ferromagnetism and possibly the final level of suppression.
Theoretically, the STO substrate induces the correct amount of strain in the LMO film to stabilize the ferromagnetic ground state via strain-induced orbital ordering [30]. In this model the two main prerequisites for ferromagnetism are: 1) crystallinity and 2) good stoichiometry, which is strongly tied to the oxygen content and Mn valency. This is also reflected by studies showing the dependence of the magnetic order on the oxygen background pressure during growth [6, 31, 32]. To get further insight into the possible mechanisms of the suppression, these two prerequisites are investigated by means of scanning transmission electron microscopy (STEM), electron energy loss spectroscopy (EELS) and X-ray diffraction (XRD).
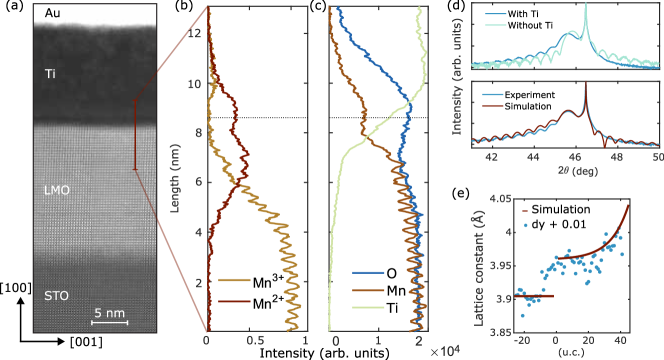
Fig. 2(a) shows a high-angle annular dark field (HAADF) STEM image of the STO/LMO/Ti/Au structure, where the LMO layer is approximately 50 u.c. thick, and the Ti and Au layers have a thickness of 12 and 60 nm, respectively. The image shows that the LMO film is grown epitaxially and crystalline on STO without any noticeable defects. Fig. 2(b) and (c) show a line cut of the corresponding EELS signal for the presence of Mn2+ and Mn3+ valency and the elements Mn, Ti and O as function of sample depth. The interface between the Ti and LMO is indicated with a black dashed line, which is estimated to be at half of the maximum Ti signal. Far above the interface there is mainly pure Ti present, but in a region of approximately 3 nm above the interface oxygen starts to become more present. This is accompanied by an evolution of the Ti valence state from Ti0 via Ti1+/Ti2+ to Ti3+ and finally to Ti4+ below the interface, see S5 for more details. In the region of 3 nm above the interface Mn is present with a valency of Mn2+. At the interface the presence of Ti drops rapidly, accompanied by a sudden increase of Mn. Interestingly, the oxygen content also drops for over a distance of 2 nm, after which it saturates. In the same region the Mn is predominately Mn2+, which reflects the presence of oxygen vacancies. After the steep drop of the Ti signal, it decays slowly over a length of 5 nm to eventually vanish. Simultaneously, the valency of the Mn becomes completely Mn3+. This shows that the interface region extends over approximately 8 nm and consist of Mn, Ti and O, with different valence states present. Focusing on the LMO, it is clear that for approximately 5 nm into the film from the interface the LMO is not stoichiometric due to a combination of oxygen scavenging and Ti interdiffusion.
Such a change of the LMO film on these length scales should also be observable in XRD. Fig. 2(d) shows 2 scans on a sample with and without a 24 nm-thick Ti layer (capped with Au). A clear STO 002 peak is visible in both scans accompanied by a LMO 002 peak with the corresponding Laue fringes. There is indeed a significant difference in the LMO 002 peak position between the Ti-covered and uncovered samples. This indicates a (local) change of the out-of-plane lattice parameter in the LMO film, in line with previous reports where the amount of oxygen vacancies in LMO was controlled by a difference in oxygen pressure during the growth [31, 32]. To quantify this change, the XRD pattern of a LMO film on a STO substrate was simulated, allowing for both the thickness of the LMO layer and the lattice parameter of the LMO to vary as function of film depth. This was performed with interactive XRD fitting [33]. Fig. 2(d) shows the experimental XRD data of the Ti/Au covered area together with the XRD simulated pattern where varies as function of the sample depth with an exponential decay towards the STO/LMO interface. The red line in Fig. 2(e) shows the variation of the lattice parameter that is used in the simulation. The best fit was obtained using an exponential dependence of the lattice parameter over a thickness of 45 LMO unit cells. Other models were also considered, where the lattice parameter is constant as function of sample depth or it has a step function-like behaviour, but these simulations deviated more from the experimental data. Fig. 2(e) also shows the extracted difference between the lattice planes as a function of sample depth from the HAADF image shown in Fig. 2(a). Here a sample depth of 0 corresponds to the STO/LMO interface. The STO substrate and the LMO film can be distinguished by their different lattice parameters. A small upturn is observed towards the LMO/Ti interface, which suggest an increase of the out of plane lattice parameter towards the LMO/Ti interface.
Here, the STEM image shows that the LMO film is still fully crystalline, but the addition of a Ti scavenging layer leads to the active removal of the oxygen from the LMO layer, several nanometers in depth. This is shown by the presence of Ti4+ (indicating the presence of Titanium on the Mn site in the LaMnO3 perovskite structure) and Mn2+ at the interface. The oxygen deficiency in LMO also leads to significant elongation of the lattice as observed by XRD, with an increase of the lattice parameter . The simulation in Fig. 2(e) further shows that this elongation occurs mostly at the interface, where the highest concentration of oxygen vacancies is expected. This all suggests that the change in stoichiometry is likely the cause of the ferromagnetic suppression.
The suppression of the ferromagnetism in LMO achieved by the coverage with a Ti layer can be exploited to selectively pattern ferromagnetic structures in LMO thin films. To showcase this possibility, micrometer-sized areas of the LMO thin films were left uncovered by the Ti/Au bilayer, by means of lithography and lift-off. Four examples of such patterns can be seen in Fig. 3. Areas where the SSM measures a distinct magnetic signal correspond to uncovered patches of the 20 u.c. LMO film, while in the regions covered by the metal layers the ferromagnetic signal is significantly suppressed.
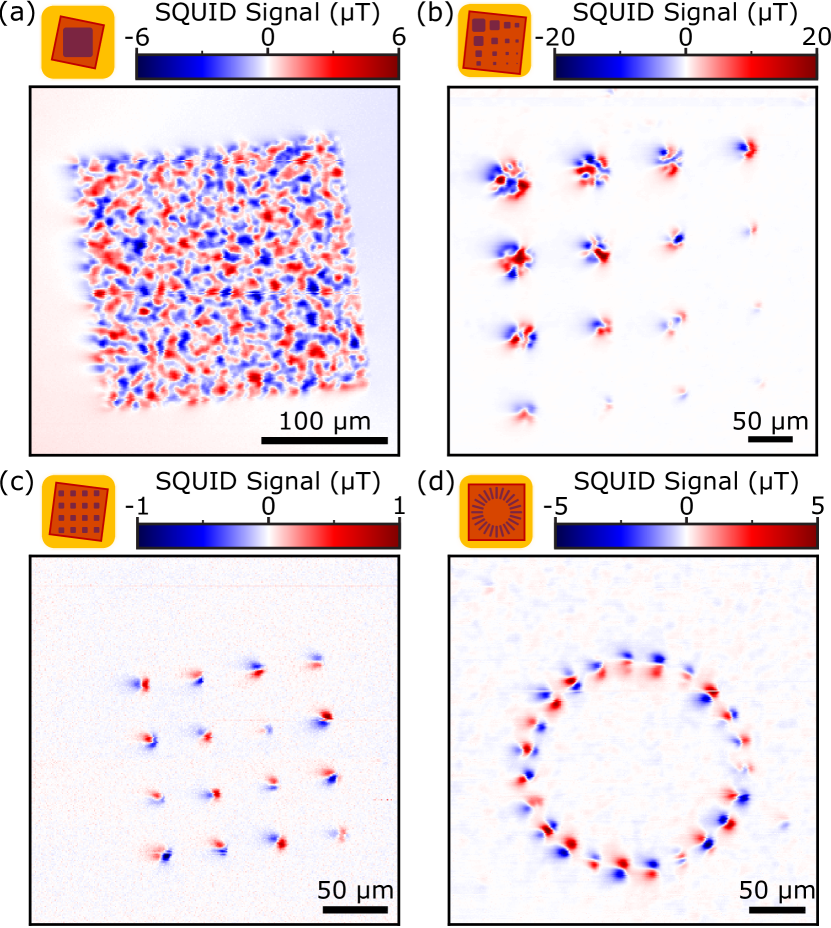
Fig. 3(a) shows the SQUID signal of a square. The magnitude of the measured SQUID signal is similar to that of an uncovered film, see for example Fig. 1(a). So, for patterns of this size, the size restrictions have no notable influence on the magnetism of the LMO underneath. Fig. 3(b) shows that as the size of the structure decreases, the measured SQUID signal is reduced. The smaller SQUID signal can be explained by the fact that the SQUID resolution limits the signal and that by decreasing the structure size there are less ferromagnetic domains under the sensor area that contribute to the measured flux. The difference in the magnitude between the SQUID signal in Figs. 3(a) and (b) is due to a different SQUID chip used in the measurements and a varying angle, for a more comprehensive explanation see the supplemental material [24].
Interestingly, Fig. 3(b) also reveals that as the structures get smaller, from squares with a side of to , the magnetic behaviour changes and becomes reminiscent of magnetic multipoles and eventually dipoles. This can also be seen in Fig. 3(c), where only squares with sides of are imaged. This is the expected behaviour of a single ferromagnetic domain with in-plane magnetization [23]. To lift the geometric symmetry of the squares, bars of were created and positioned radially inward on a circumference, as shown in Fig. 3(d). Here, the dipole-like field distribution almost perfectly aligns radially, evidencing a favoured orientation of the magnetic moments due to the lateral constriction of the bars.
These results raise the question whether the small patches of LMO are uniformly polarized and represent real dipoles, or that the magnetic structure in the LMO is more complex and the magnetic field at the height of the pickup loop only emerges as that of a dipole. Domain sizes in LMO have been reported to be in the order of 200 nm [34, 35], which is an order smaller than our patterns. Our pickup loop scans at a height of approximately , because this is an order of magnitude larger than the expected size of the domains, we don’t expect to distinguish domains of these sizes individually. Finally, a uniform magnetically polarized patch of LMO would result in a magnetic field, at the pickup loop height, several orders of magnitude higher than we measure. So, although our small ferromagnetic patterns emerge as dipoles, we don’t think that they are uniformly polarized. Rather we expect these LMO patches to posses more complex magnetic structures at length scales we can not resolve with our current experimental setup.
In summary, scanning SQUID microscopy studies of LMO thin films partially covered by a thin Ti layer show the suppression of the ferromagnetism in LMO. For a combination of 20 u.c. of LMO and 4 nm of Ti, there is no stray magnetic field originating from the LMO film underneath. For thicker LMO films, the same thickness of Ti suppresses only partially the ferromagnetic phase in LMO and the rate of suppression is on the order of several days. STEM, EELS and XRD reveal the creation of oxygen vacancies in the LMO layer due to oxygen scavenging from the Ti layer and Ti interdiffusion for approximately 5 nm deep into the film. This process first happens rapidly, resulting in immediate suppression in the 20 u.c. thick LMO samples. Further diffusion of oxygen vacancies deeper in the LMO films happens on timescales of days, resulting in a further suppression of ferromagnetism after initial Ti/Au deposition in 50 u.c. thick LMO samples. This suppression effect can be used to pattern the ferromagnetism in LMO thin films, as showcased by ferromagnetic (sub-)microstructures that were successfully fabricated in this way. Small structures show dipolar-like magnetic signatures, which raises questions about the effective domain size of the LMO and provides motivation for further research to study these structures with SQUID microscopes having higher spatial resolution.
The authors acknowledge support from the project ”TOPCORE” (project number OCENW.GROOT.2019.048) which is financed by the Dutch Research Council (NWO). The authors acknowledge the research program “Materials for the Quantum Age” (QuMat) for financial support. This program (registration number 024.005.006) is part of the Gravitation program financed by the Dutch Ministry of Education, Culture and Science (OCW). JV acknowledges The eBEAM project which is supported by the European Union’s Horizon 2020 research and innovation programme FETPROACT-EIC-07-2020: emerging paradigms and communities. The Hercules fund ’Direct electron detector for soft matter TEM’ from the Flemish Government.
References
- Bibes et al. [2011] M. Bibes, J. E. Villegas, and A. Barthélémy, Advances in Physics 60, 5 (2011).
- Trier et al. [2022] F. Trier, P. Noël, J. Kim, J. Attané, L. Vila, and M. Bibes, Nature Reviews Materials 7, 258 (2022).
- Freund and Pacchioni [2008] H. Freund and G. Pacchioni, Chemical Society Reviews 37, 2224 (2008).
- Coll et al. [2019] M. Coll, J. Fontcuberta, M. Althammer, M. Bibes, H. Boschker, A. Calleja, G. Cheng, M. Cuoco, R. Dittmann, B. Dkhil, I. El Baggari, M. Fanciulli, I. Fina, E. Fortunato, C. Frontera, S. Fujita, V. Garcia, S. T. B. Goennenwein, C.-G. Granqvist, J. Grollier, R. Gross, A. Hagfeldt, G. Herranz, K. Hono, E. Houwman, M. Huijben, A. Kalaboukhov, D. Keeble, G. Koster, L. Kourkoutis, J. Levy, M. Lira-Cantu, J. MacManus-Driscoll, J. Mannhart, R. Martins, S. Menzel, T. Mikolajick, M. Napari, M. Nguyen, G. Niklasson, C. Paillard, S. Panigrahi, G. Rijnders, F. Sánchez, P. Sanchis, S. Sanna, D. Schlom, U. Schroeder, K. Shen, A. Siemon, M. Spreitzer, H. Sukegawa, R. Tamayo, J. van den Brink, N. Pryds, and F. M. Granozio, Applied Surface Science 482, 1 (2019).
- Marton et al. [2010] Z. Marton, S. S. A. Seo, T. Egami, and H. N. Lee, Journal of Crystal Growth 312, 2923 (2010).
- Kim and Christen [2010] H. S. Kim and H. M. Christen, Journal of Physics Condensed Matter 22, 17 (2010).
- Koster et al. [2020] G. Koster, D. H. Blank, and G. A. Rijnders, Journal of superconductivity and novel magnetism 33, 205 (2020).
- Doennig et al. [2016] D. Doennig, S. Baidya, W. E. Pickett, and R. Pentcheva, Physical Review B 93, 165145 (2016).
- Zubko et al. [2011] P. Zubko, S. Gariglio, M. Gabay, P. Ghosez, and J.-M. Triscone, Annual Review of Condensed Matter Physics 2, 141 (2011).
- Huang et al. [2018] Z. Huang, Ariando, X. Renshaw Wang, A. Rusydi, J. Chen, H. Yang, and T. Venkatesan, Advanced Materials 30, 1802439 (2018).
- Liao et al. [2016] Z. Liao, M. Huijben, Z. Zhong, N. Gauquelin, S. Macke, R. Green, S. Van Aert, J. Verbeeck, G. Van Tendeloo, K. Held, et al., Nature materials 15, 425 (2016).
- Hwang et al. [2019] J. Hwang, Z. Feng, N. Charles, X. R. Wang, D. Lee, K. A. Stoerzinger, S. Muy, R. R. Rao, D. Lee, R. Jacobs, et al., Materials Today 31, 100 (2019).
- Xu et al. [2020] R. Xu, J. Huang, E. S. Barnard, S. S. Hong, P. Singh, E. K. Wong, T. Jansen, V. Harbola, J. Xiao, B. Y. Wang, et al., Nature communications 11, 3141 (2020).
- Shen et al. [2015] X. Shen, X. Qiu, D. Su, S. Zhou, A. Li, and D. Wu, Journal of Applied Physics 117, 015307 (2015).
- Wang et al. [2015] X. R. Wang, C. J. Li, W. M. Lü, T. R. Paudel, D. P. Leusink, M. Hoek, N. Poccia, A. Vailionis, T. Venkatesan, J. M. Coey, E. Y. Tsymbal, Ariando, and H. Hilgenkamp, Science 349, 716 (2015).
- Chen et al. [2017] Z. Chen, Z. Chen, Z. Q. Liu, M. E. Holtz, C. J. Li, X. R. Wang, W. M. Lü, M. Motapothula, L. S. Fan, J. A. Turcaud, L. R. Dedon, C. Frederick, R. J. Xu, R. Gao, A. T. N’Diaye, E. Arenholz, J. A. Mundy, T. Venkatesan, D. A. Muller, L.-W. Wang, J. Liu, and L. W. Martin, Physical Review Letters 119, 156801 (2017).
- Vogt et al. [1994] K. Vogt, P. Kohl, W. Carter, R. Bell, and L. Bottomley, Surface Science 301, 203 (1994).
- Todeschini et al. [2017] M. Todeschini, A. Bastos da Silva Fanta, F. Jensen, J. B. Wagner, and A. Han, ACS Applied Materials & Interfaces 9, 37374 (2017).
- Liu and Welsch [1988] Z. Liu and G. Welsch, Metallurgical Transactions A 19A, 1121 (1988).
- Kim et al. [2004] H. Kim, P. C. McIntyre, C. O. Chui, K. C. Saraswat, and S. Stemmer, Journal of Applied Physics 96, 3467 (2004).
- Guo and Robertson [2014] Y. Guo and J. Robertson, Applied Physics Letters 105, 223516 (2014).
- Kirtley and Wikswo [1999] J. R. Kirtley and J. P. Wikswo, Annual Review of Materials Science 29, 117 (1999).
- Reith et al. [2017] P. Reith, X. Renshaw Wang, and H. Hilgenkamp, Review of Scientific Instruments 88, 123706 (2017).
- [24] See Supplemental Material at insert link for details on the sample fabrication, structural characterization of LaMnO3, scanning SQUID microscopy setup and technique, extra SSM scans on covered LaMnO3, and the Ti valence state evolution.
- Kirtley et al. [1995] J. R. Kirtley, M. B. Ketchen, K. G. Stawiasz, J. Z. Sun, W. J. Gallagher, S. H. Blanton, and S. J. Wind, Applied Physics Letters 66, 1138 (1995).
- Martin et al. [1994] M. Martin, W. Mader, and E. Fromm, Thin Solid Films 250, 61 (1994).
- Passeggi et al. [2002] M. C. Passeggi, L. I. Vergara, S. M. Mendoza, and J. Ferrón, Surface Science 507, 825 (2002).
- Vaquila et al. [1997] I. Vaquila, M. Passeggi, and J. Ferrón, Physical Review B - Condensed Matter and Materials Physics 55, 13925 (1997).
- Rodriguez-Lamas et al. [2021] R. Rodriguez-Lamas, C. Pirovano, A. Stangl, D. Pla, R. Jónsson, L. Rapenne, E. Sarigiannidou, N. Nuns, H. Roussel, O. Chaix-Pluchery, M. Boudard, C. Jiménez, R.-N. Vannier, and M. Burriel, J. Mater. Chem. A 9, 12721 (2021).
- Hou et al. [2014] Y. S. Hou, H. J. Xiang, and X. G. Gong, Physical Review B 89, 064415 (2014).
- Roqueta et al. [2015] J. Roqueta, A. Pomar, L. Balcells, C. Frontera, S. Valencia, R. Abrudan, B. Bozzo, Z. Konstantinović, J. Santiso, and B. Martínez, Crystal Growth and Design 15, 5332 (2015).
- Liu et al. [2019] Y. K. Liu, H. F. Wong, K. K. Lam, C. L. Mak, and C. W. Leung, Journal of Magnetism and Magnetic Materials 481, 85 (2019).
- Lichtensteiger [2018] C. Lichtensteiger, Journal of Applied Crystallography 51, 1745 (2018).
- Anahory et al. [2016] Y. Anahory, L. Embon, C. J. Li, S. Banerjee, A. Meltzer, H. R. Naren, A. Yakovenko, J. Cuppens, Y. Myasoedov, M. L. Rappaport, et al., Nature Communications 7, 12566 (2016).
- Gao et al. [2011] T. Gao, S. Cao, Y. Liu, Y. Zhang, and J. Zhang, Rare Metals 30, 359 (2011).