Reduced-order models of endocardial shear stress patterns in the left atrial appendage from a data-augmented patient-specific database
Abstract
Background: Atrial fibrillation (AF) is the most common sustained cardiac arrhythmia, affecting over 1% of the population. It is usually triggered by irregular electrical impulses that cause the atria to contract irregularly and ineffectively. It increases blood stasis and the risk of thrombus formation within the left atrial appendage (LAA), and aggravates adverse atrial remodeling. Despite recent efforts, LAA flow patterns representative of AF conditions and their association with LAA stasis remain poorly characterized.
Aim: Our goal was to develop reduced-order data-driven models of LAA flow patterns to discriminate between AF and non-AF flow phenotypes and discover explainable determinants of LAA blood stasis.
Methods: We combined a geometric data augmentation process with projection of results from 180 CFD atrial simulations on the universal LAA coordinate (ULAAC) system. The projection approach enhances data visualization and facilitates direct comparison between different anatomical and functional states. ULAAC projections were used as input for a proper orthogonal decomposition (POD) algorithm to build reduced-order models of hemodynamic metrics, extracting flow characteristics associated with AF and non-AF patients.
Results: We verified that the ULAAC system provides an adequate representation to visualize data distributions on the LAA surface and to build POD-based reduced-order models. These models revealed significant differences in LAA flow patterns between patients with and without AF, which correlated with blood stasis. Together with anatomical morphing-based patient-specific data augmentation, this approach could help evaluate each patient’s current risk of LAA thrombosis and enable prediction of how atrial remodeling could modulate this future stroke risk. Such information could potentially be used to personalize anticoagulation therapy in AF patients.
keywords:
atrial fibrillation , universal left atrial appendage coordinates , computational fluid dynamics , atrial morphing , patient-specific modeling , proper orthogonal decomposition1 Introduction
Cardiovascular disease is the leading cause of death worldwide. Of these, atrial fibrillation (AF) is the most common cardiac arrhythmia, affecting more than 35 million people worldwide [1]. More than 20 % of the 18 million yearly ischemic strokes are estimated to be caused by thrombi that originate in the left atrium (LA) during an episode of AF. Furthermore, another 30 % of ischemic strokes is suspected to originate in the atrium in patients with subclinical AF or sinus rhythm [2].
Atrial fibrillation usually begins with a dysfunction in electrical impulses, which generates a weak and irregular pattern of atrial contraction and relaxation. These episodes cause blood stasis in the left atrial appendage (LAA), promoting thrombosis. Consequently, the risk of stroke is five times higher in patients diagnosed with AF compared to those without AF [3]. When occurring over periods of months or years, AF episodes can trigger adverse atrial remodeling, a variety of tissue alterations that disrupt the biomechanical and electrical function of the myocardium. This remodeling exacerbates the arrhythmogenic substrate for AF and the hemodynamic substrate for thrombosis [4].
The LAA is the most frequent site of atrial thrombosis. It is a protruding cavity inside the LA, a residue of the embryonic developmental stage [5]. The morphology of LAA is highly variable, varying both in shape and size from patient to patient [6]. Recent work hypothesized that LAA might play an important role in circulatory system homeostasis and hemodynamics [7, 8]. It also acts as a contractile reservoir or decompression chamber, depending on the phase of the cardiac cycle [9]. This effect worsens with time due to atrial remodeling, which tends to increase its volume and reduce its contractility.
In recent years, computational fluid dynamics (CFD) models of increasing complexity have been developed to study flow patterns within the heart. These include models of the whole left heart [10], models of two-cavity including LA and LV [11, 12, 13], and models of one-cavity that usually include LA or LV [14, 11, 15]. Of the latter, most have focused on flow patterns in the LV [16, 17], although there has recently been an increasing number of studies focusing on LA hemodynamics, specifically studying stasis within the LAA [18, 19, 20, 21, 22, 14, 23, 24, 25]. These were motivated by clinical evidence of the relationship between LAA morphology and the risk of thrombosis in patients with AF [26, 27]. These studies have focused on finding the relationship between LAA morphology and stasis [19, 24, 20], proposing new metrics to quantify this stasis [28, 29, 23], or contrasting common modeling assumptions in fluid-dynamic simulations of the LA [30, 31, 25, 21]. Recently, multiphysics models integrating fluid-structure interaction together with electrophysiological or biomechanical mechanisms related to AF are being proposed [13, 32, 31, 23].
The aforementioned studies have shed light on the mechanisms of AF and informed us about proper model generation, boundary conditions, and numerics to accurately reproduce LA flow dynamics. However, blood flow and thrombosis within the LAA are multifactorial processes [4], and existing CFD studies have yet to produce a predictive understanding of their anatomical and functional determinants. A particularly limiting factor is that the diversity of LAA morphologies makes it difficult to compare simulation results from different patients or, even for the same patient, between different cardiac conditions [33].
Taking into account these challenges, we propose a new approach to study how geometric and flow parameters affect hemodynamics in LAA, and the flow differences produced by atrial remodeling between subjects with and without AF. For this purpose, we used the atrial morphing methodology proposed by Dueñas-Pamplona et al. [28] with a new framework that allowed us to compare hemodynamic variables between different patients and cardiac conditions. Following the ideas proposed by [34] for the left ventricle, we employ proper orthogonal decomposition (POD) to reduce flow dimensionality, identify distinct flow patterns associated with different phenotypes, and classify patients according to their LAA flow patterns.
To facilitate this process [35], we map the LAA surface onto a unified coordinate system (Universal Left Atrial Appendage Coordinates, or ULAAC), which is an extension of the Universal Atrial Coordinate (UAC) system developed by Roney et al. [36]. To illustrate this approach, we apply it to patient-specific CFD flow fields from two groups of patients with and without AF, obtaining the hemodynamic signature of AF in LAA flow, which, to the best of our knowledge, has not been done before.
Moreover, as this approach can offer direct insight into the relationship between the different geometric and flow parameters, we quantified and compared the influence of different variables such as LAA volume, ostium area, cardiac output, etc. on the stasis patterns within the LAA for patients with and without AF. Finding a suitable and general criterion to predict stasis risk for a particular patient would provide clinicians with a useful tool to identify patient groups and select the optimal therapy, as current medical procedures to estimate ischemic stroke risk are based on demographic and clinical factors and do not consider patient-specific information about LA hemodynamics.
2 Methods
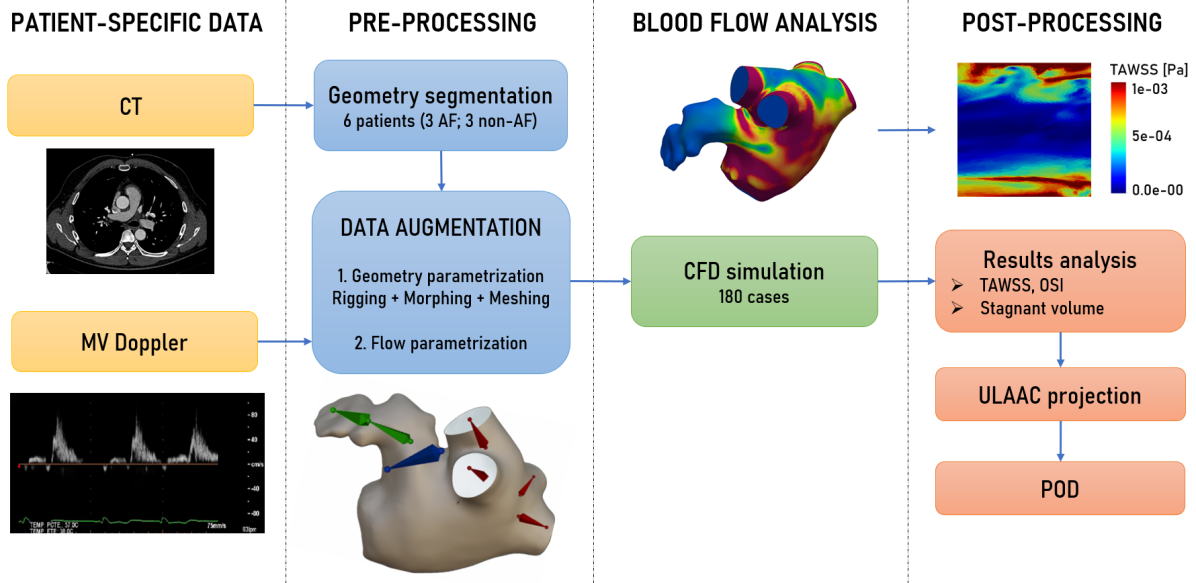
We imaged six human subjects by computed tomography (CT) covering the LA and LAA. Subsequently, we performed image segmentation, LAA morphing to augment the subject database, and CFD simulations on the augmented database. The simulation results were projected in universal left atrial appendage coordinates (ULAAC) to feed a proper orthogonal decomposition algorithm (POD). We leveraged the POD results to generate a reduced order model to elucidate representative flow patterns and cluster patients. This workflow is summarized in Figure 1.
2.1 Medical imaging
We retrospectively studied 6 patients: CT imaging of three patients with AF was provided by the Cardiology Service of the University Hospital of Badajoz (Spain), while CT imaging of three other cardiac patients without AF or thromboembolic history was provided by the Cardiology Service of the Puerta de Hierro Hospital (Spain). The imaging was performed following standard clinical protocols in each participating center and data collection was approved by the Ethics Committee of each hospital.
The images were acquired with two different scanner models: three cardiac images were acquired with a Light Speed VCT General Electric Medical Systems (Milwaukee,WI, USA) by the University Hospital of Badajoz, while the other three were obtained by a SIEMENS Sensation scanner by the Puerta de Hierro Hospital. Both scanners were 64 detector devices equipped with snapshot segment mode technology to obtain cardiac images without losing clarity. For each patient, a contrast dose was injected according to standard clinical protocols. Images were taken during fibrillation for patients with AF and during sinus rhythm for patients without AF.
DICOM files were reconstructed from cardiac images using standard manufacturer algorithms, which were processed using open source software 3D-Slicer to obtain semiautomatic 3D segmentations of the endocardial surface based on signal intensity thresholding [21]. The resulting segmentation was cleaned with MeshMixer (Autodesk), removing the pulmonary veins (PV) geometry beyond the first bifurcation to obtain the LA/LAA geometry for each patient. The movement of the atrial wall was almost negligible for patients with AF, so only the geometry at a time instant was selected for analysis; while for patients without AF, both the systole and diastole geometries were considered. This procedure was carefully supervised and validated by a radiologist to obtain six CFD-ready 3D models.
2.2 Atrial model rigging and morphing
The 3D segmented models were rigged and skinned to parameterize the atrial surface as previously described [28], allowing us to apply scaling, rotations and displacements to different parts of the models. To this end, we used Blender, an open-source 3D suite with full modeling, rigging, and morphing capabilities. The first step was the rigging process, which provided each 3D endocardial model with an armature constituted of different bones. Each bone controlled the mesh vertices belonging to its zone of influence: scaling, rotating, etc. We applied the envelope technique, which calculates the influence of each bone on its surrounding points based on its distance by applying the bone heat algorithm. Finally, these influences were assigned as weights in the vertex groups.
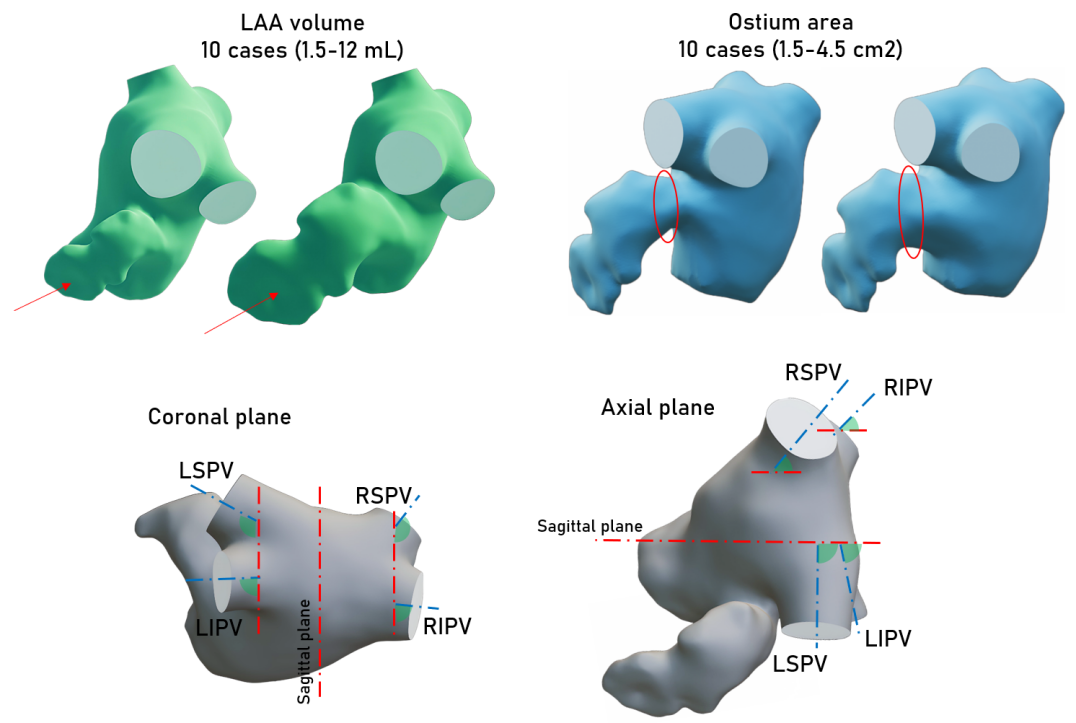
For each anatomical model, we define the following bones: left superior PV (lspv), left inferior PV (lipv), right superior PV (rspv), right inferior PV (ripv), ostium and LAA. Each bone allowed manipulation of position, length scaling, and rotation, transferring these transformations to the mesh nodes under its influence. We used this approach to modify the geometrical factors recognized to affect LAA blood stasis: area of the ostium, LAA volume, and PV orientations. Figure 2 illustrates the LAA bones in our six patient-specific LA segmentations.
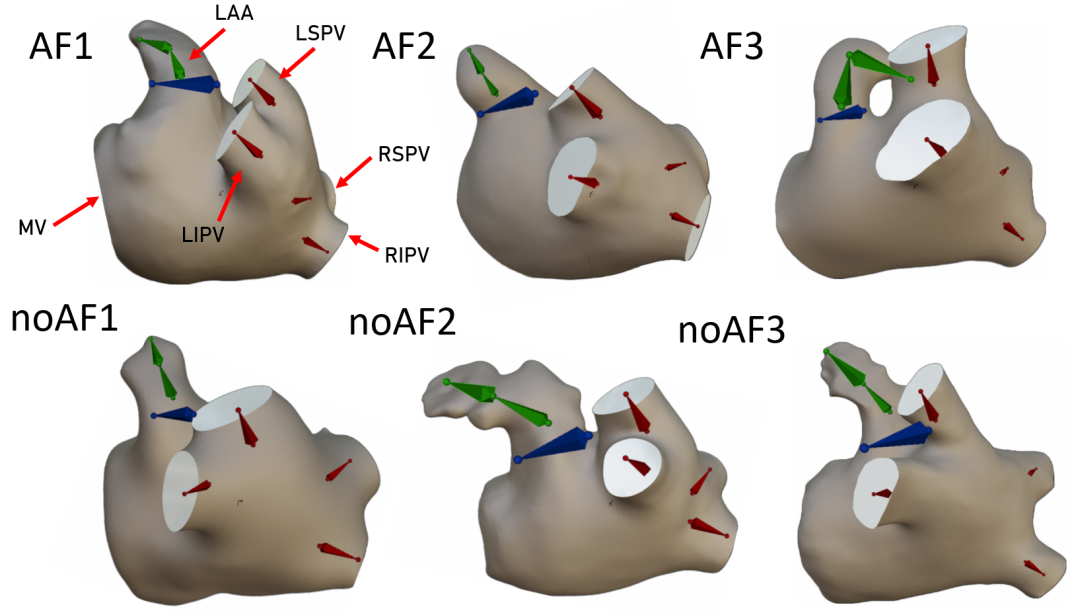
Since we previously found that LAA volume and ostium area significantly influence the generation of stagnant volume within the LAA [28], we morphed our patient-specific segmentations to vary these variables. We generated 10 different cases for each geometric model by scaling the LAA bones to vary the LAA volume from 1.5 to 12 ml, and 10 more cases by scaling the ostium bone to vary its area from 1.5 to . This means 20 different models for each of the six patient-specific segmentations, ie a total of 120 different atrial models. These values are within the physiological range [37], increased by adverse atrial remodeling. The PV were modified to obtain the same orientations for all cases, removing the bias between different patients that this variable can introduce in the analysis. This was achieved by keeping the projective angles constant [38, 39]. That is, keeping the angle between the coronal and axial projections of each PV bone and the sagittal plane constant throughout the 120 different cases. The graphical definition of each projective angle can be seen in Figure 3.
2.3 Atrial CFD simulations
We used OpenFOAM open source software to run CFD simulations. The simulation used the OpenFOAM pimplefoam application, a transient and incompressible method combining the PISO and SIMPLE algorithms. An implicit Euler time integration scheme was used, while the spatial discretization employed a cell-limited Gaussian linear gradient scheme and a linear upwind divergence scheme. A preconditioned biconjugate gradient solver (PBiCGStab) was used to solve the velocity field and the passive scalars, with a convergence criterion of for the residuals.
The fluid was considered to have the same density and viscosity as blood, i.e. and respectively [40], and it was assumed to behave as a Newtonian fluid. The flow was computed by solving the continuity and Navier-Stokes equations (Equations 1 and 2, respectively) where v is the velocity vector and is the pressure,
| (1) |
| (2) |
A tetrahedral mesh was constructed for each of the cases using the OpenFOAM tetMesh application. For each case, a residual and mesh independence analysis was performed to validate the flow and to verify that the velocities and pressures converged and did not depend on the mesh size. Each final mesh consisted of approximately 800k cells, varying slightly from case to case. The atrial walls were held fixed during the simulation for all cases, which facilitated imposing similar boundary conditions regardless of the variations in the parameters. A single geometry was taken for patients with AF, while a geometry was taken at maximum volume for patients without AF. Diastolic segmentation was chosen because it is more critical than systole in terms of stasis within the LAA: At equal cardiac output, stasis while performing a rigid-wall simulation with diastole geometry is higher because the LA/LAA volume is larger at this point of the cycle.
Each cardiac cycle lasted s and the time step was adjusted to keep the CFL number below 0.1. A time convergence analysis demonstrated that the simulation lost memory of the initial condition after four simulation cycles, so the results presented in the following section are based on the fifth simulated cycle.
The patient-specific transmitral flow profile used in [28] was scaled to vary cardiac output from 2.5 to 7.5 L/min. This profile did not have the typical A-wave of atrial contraction to replicate the AF conditions [18]. This total transmitral flow rate was evenly distributed among the four PVs to establish the inflow boundary conditions. A constant pressure equal to zero was established as the boundary condition of the outlet [21]. Together with the 20 cases per segmentation obtained by rigging and morphing, the 10 additional cases obtained by varying the flow rate led to a total of 180 simulations for the six patient-specific segmentations. This procedure allowed us to study parametrically how each of these selected variables affects LA flow and LAA stasis for each patient-specific geometry. All variables present in parameterization and their ranges of variation can be seen in Table 1.
| Parameter | Range | N cases |
|---|---|---|
| LAA volume | 1.5- | 10 variations x 6 patients = 60 cases |
| Ostium area | 1.5- | 10 variations x 6 patients = 60 cases |
| Cardiac output | 2.5- | 10 variations x 6 patients = 60 cases |
| TOTAL: 180 cases |
2.4 Hemodynamic indices
We analyze blood age moments [41] to determine stagnant regions with a high residence time (RT). Similar to our previous works, [21, 28], we define the -th age moment as
| (3) |
where is the age distribution of the blood and is simulation time. The moment equations of the age distribution were integrated into the solver by including a set of scalarTransport functions in the OpenFOAM case-control dictionary.
We computed the first moment of the distribution function (), that is, is the RT of the fluid, as well as its standard deviation . We then used these variables to define the normalized first moment
| (4) |
which has a bimodal distribution inside the LAA [21]. This bimodality allows for automatically selecting a patient-specific threshold to delineate stagnant volumes, that is, the value of corresponding to its minimum probability valley between the two modes.
We also calculated wall shear-based indicators, such as the time-averaged wall shear stress (TAWSS) and the oscillatory shear index (OSI). The formal definition of TAWSS is
| (5) |
This hemodynamic indicator is commonly used since low TAWSS values are associated with endothelial cell damage that activates the extrinsic coagulation cascade [42]. On the other hand, the OSI is a dimensionless indicator between 0 and 0.5 which captures the wall-shear direction oscillations and which definition is:
| (6) |
2.5 Universal left atrial appendage coordinate projection
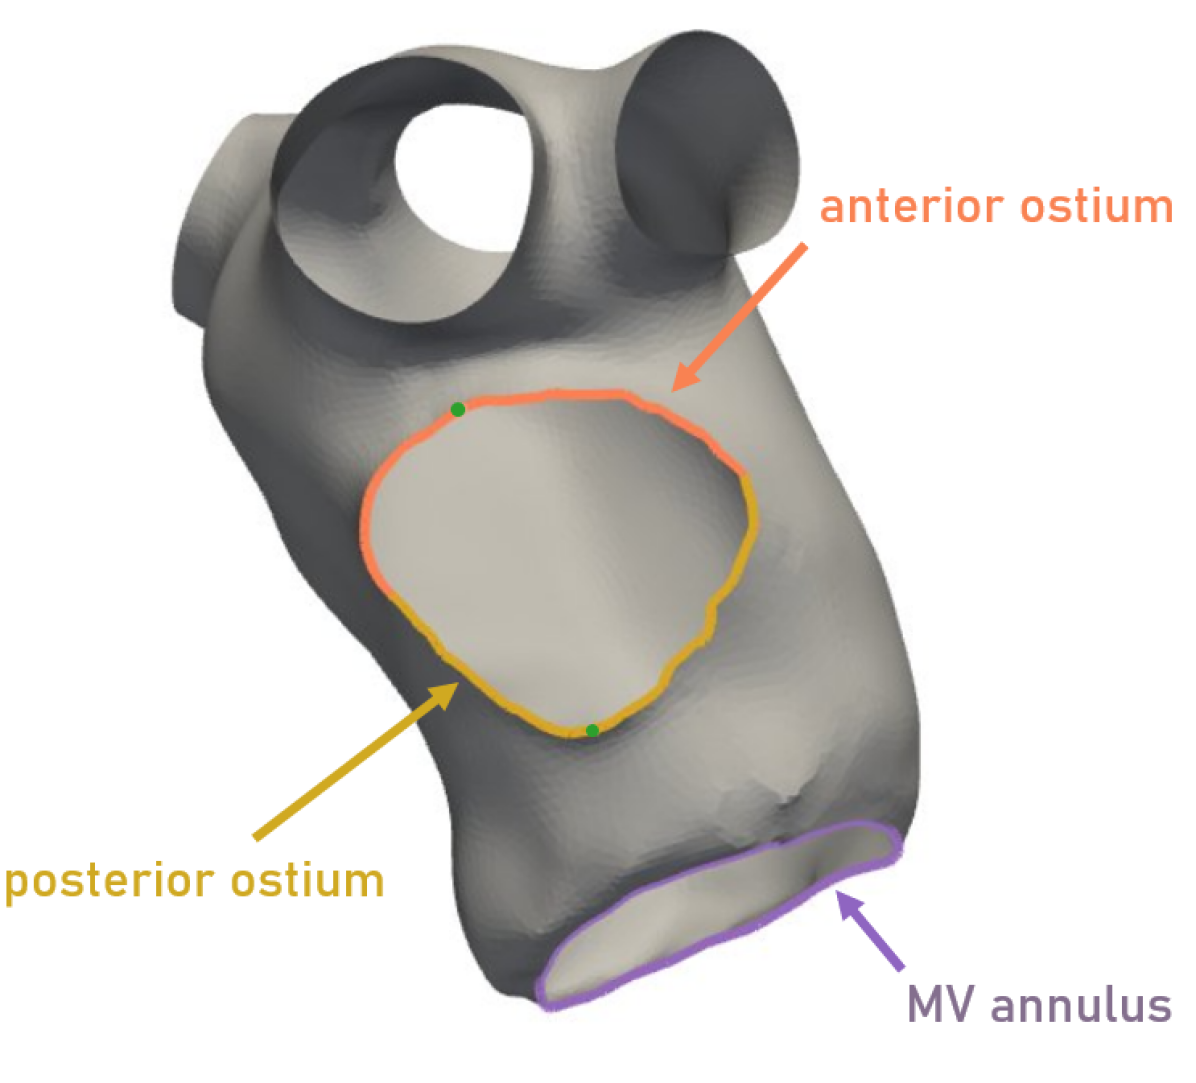
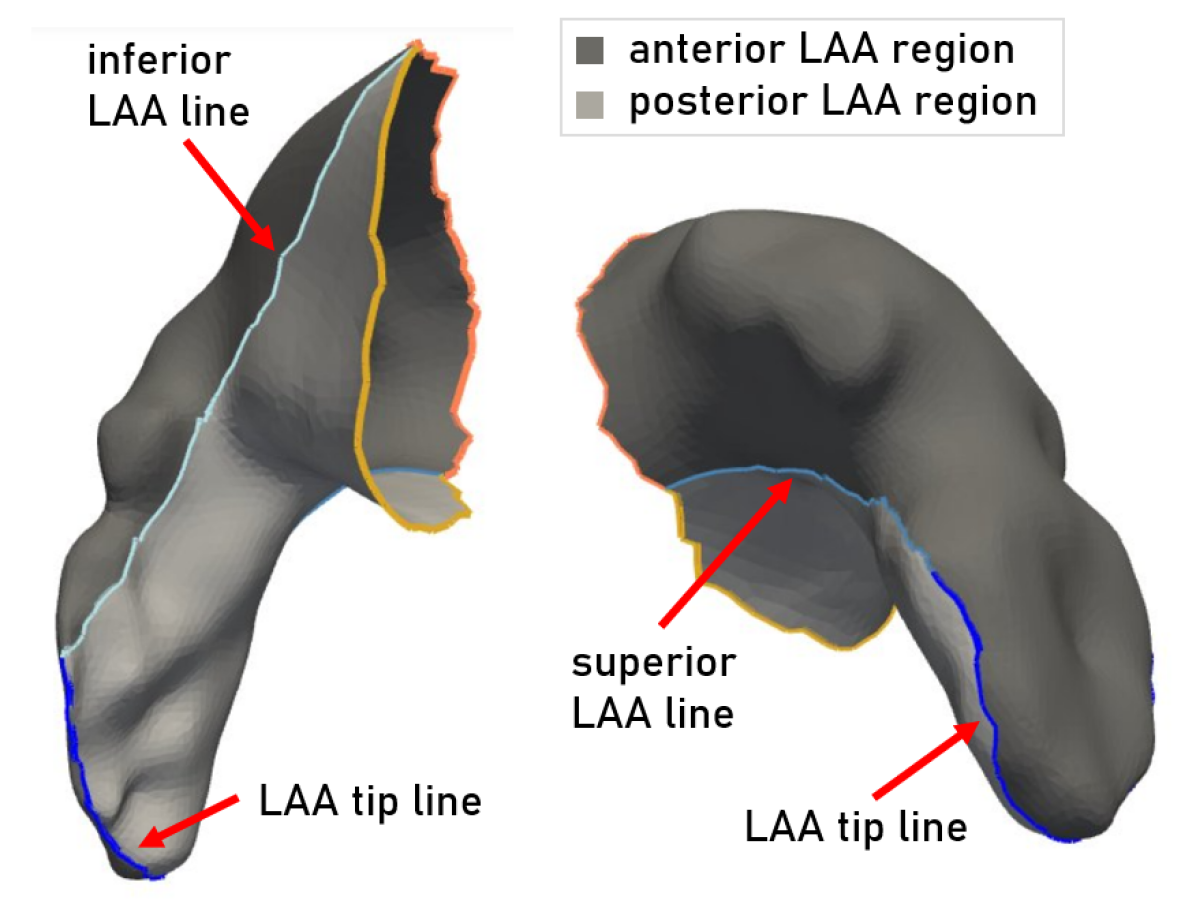
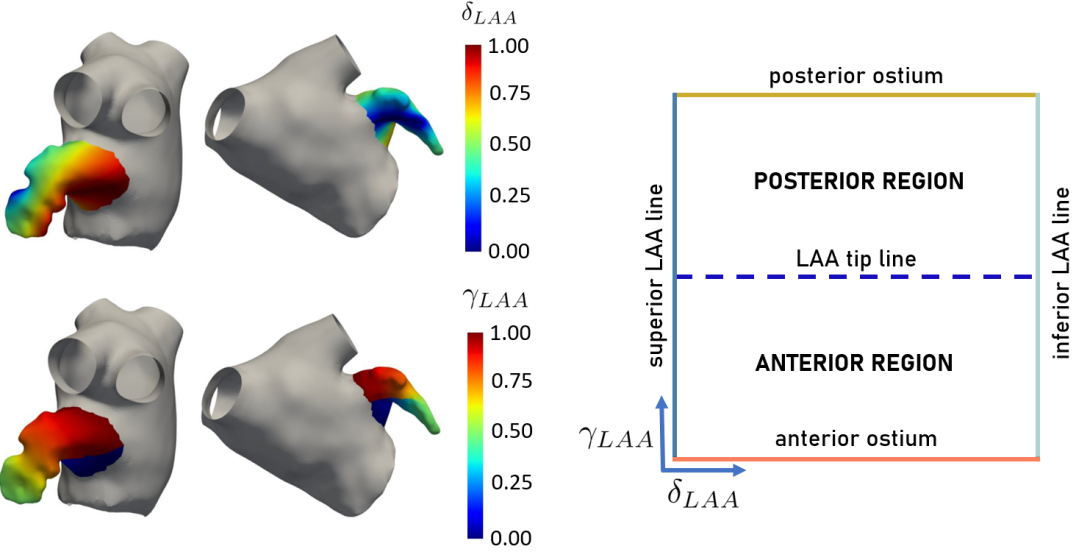
We developed a universal left atrial appendage coordinate (ULAAC) system that mapped different LAA surfaces onto a common plane domain to facilitate data visualization and compare simulation results from different anatomical models. The mapping was inspired by the universal atrial coordinate (UAC) system developed by Roney et al. [36], which was preceded by the universal ventricular coordinates (UVC) by Bayer et al. [43]. Following a similar strategy, we solved the Laplace equation for two coordinates and on each LAA surface. We prescribe zero and unit Dirichlet boundary conditions for and along two pairs of lines corresponding to LAA anatomical landmarks, effectively mapping all LAA shapes into the unit square. To ensure that the and isolines were approximately orthogonal on the LAA surface, the chosen boundary lines were the contour of the LAA ostium and the LAA tip line, and the LAA lines superior and inferior (Figure 4). Thus, and indicated anterio-posterior and infero-superior positions, respectively.
To define the boundary conditions for the LAA infero-superior coordinate , a user selected the ostium line and the LAA tip line that run from the superior to the inferior LAA. Then, the superior and inferior lines of the LAA region were automatically defined as can be seen in Figure 4. The MV annulus was identified as the largest connected edge list. The minimum geodesic distance [44] was then calculated between each node belonging to the ostium line and the nearest node belonging to the MV annulus. The nearest and farthest ostium points from the MV annulus were used to divide the ostium line into two segments. The midpoints of these segments were used to divide the ostium into anterior and posterior ostium segments (Figure 4(a)). Finally, the LAA lines superior and inferior were defined as the shortest geodesic path between the intersection of these ostium segments and the ends of the LAA tip line (Figure 4(b)).
The anteroposterior coordinate was constructed between the previously defined ostium and the LAA tip lines of the LAA region. In this case, it was necessary to identify the anterior and posterior LAA regions to divide the mesh after solving the Laplacian equation. For this purpose, the anterior LAA region was defined as the surface mesh contained by the following connected path: the superior LAA line, the tip line, the inferior LAA line, and the anterior ostium. Similarly, the posterior LAA region was defined as the surface mesh contained by the connected path formed by the superior LAA line, the tip line, the inferior LAA line, and the posterior ostium. These regions are shown in Figure 4(b).
The Laplace problems were solved using Python LaPy [45, 46]. Finally, to ensure a bijective correspondence between each pair of coordinates and each point on the LAA surface, the anteroposterior coordinate obtained by solving the Laplace equation was rescaled by a factor of 2 and unwrapped around 0.5 so that it ranged between 0 and 0.5 in the anterior LAA region (from the anterior ostium to the tip) and between 0.5 and 1 in the posterior LAA region (from the tip to the posterior ostium). Figure 5 shows an example of the fields represented in a patient-specific anatomical model.
2.6 Proper orthogonal decomposition
We used the snapshot method [47] to compute the proper orthogonal decomposition (also known as principal component analysis) of hemodynamic indices in the reference system , using 100 grid points in each direction. Calculations were carried out with the LAPACK routine gesdd, which computes the singular value decomposition of the snapshot matrix where was the number of spatial grid points and the number of simulations.
POD allows for expressing each patient’s hemodynamic variables, e.g., TAWSS or OSI, as
where is mode rank, the coefficient indicates each modes’ contribution to the dataset variance, and encodes the mode’s spatial structure. One of the main advantages of POD is that decays strongly with , making this decomposition suitable for dimensionality reduction. In our database, the first four modes accounted of the variance, so we considered reduced-order models with four modes.
In this work, we hypothesized that it is possible to differentiate between patients with and without AF according to each patient’s projection on the POD modes. Therefore, the POD modes were calculated using as input the 180 snapshots obtained from anatomical models, that is, . Subsequently, all cases were projected on these modes and the coefficient distributions were compared.
3 Results
3.1 Stagnant LAA blood volumes in AF and non-AF patients
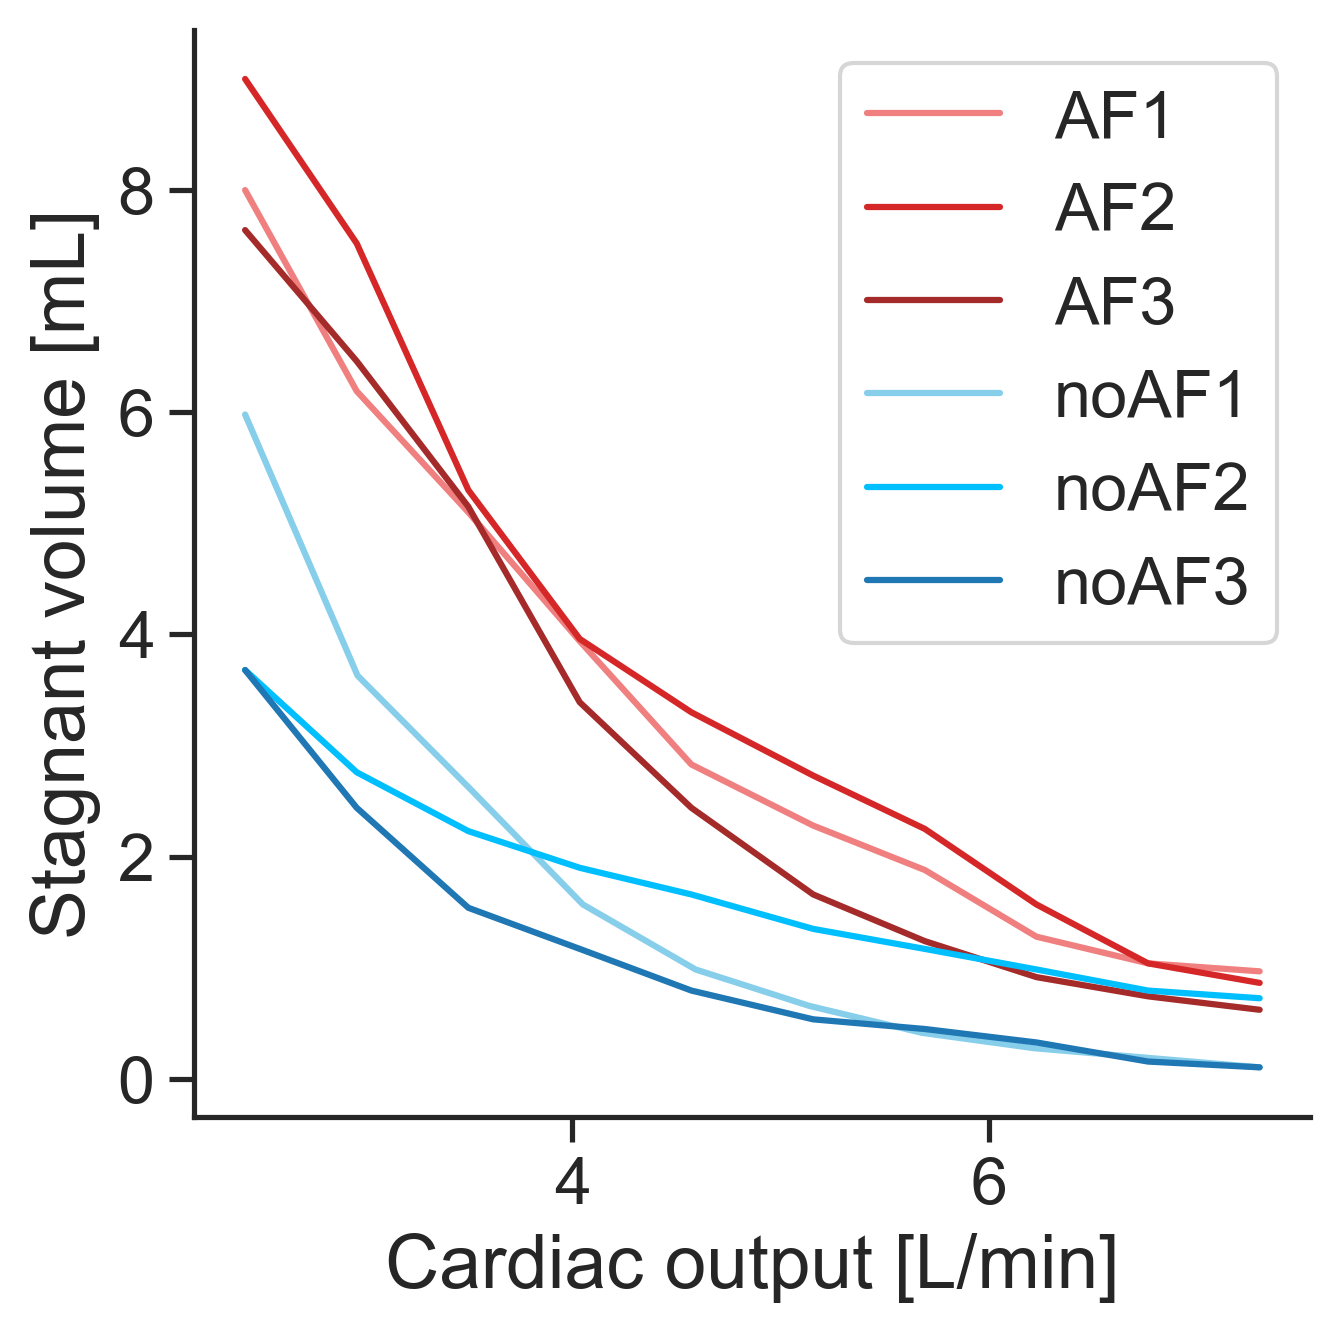
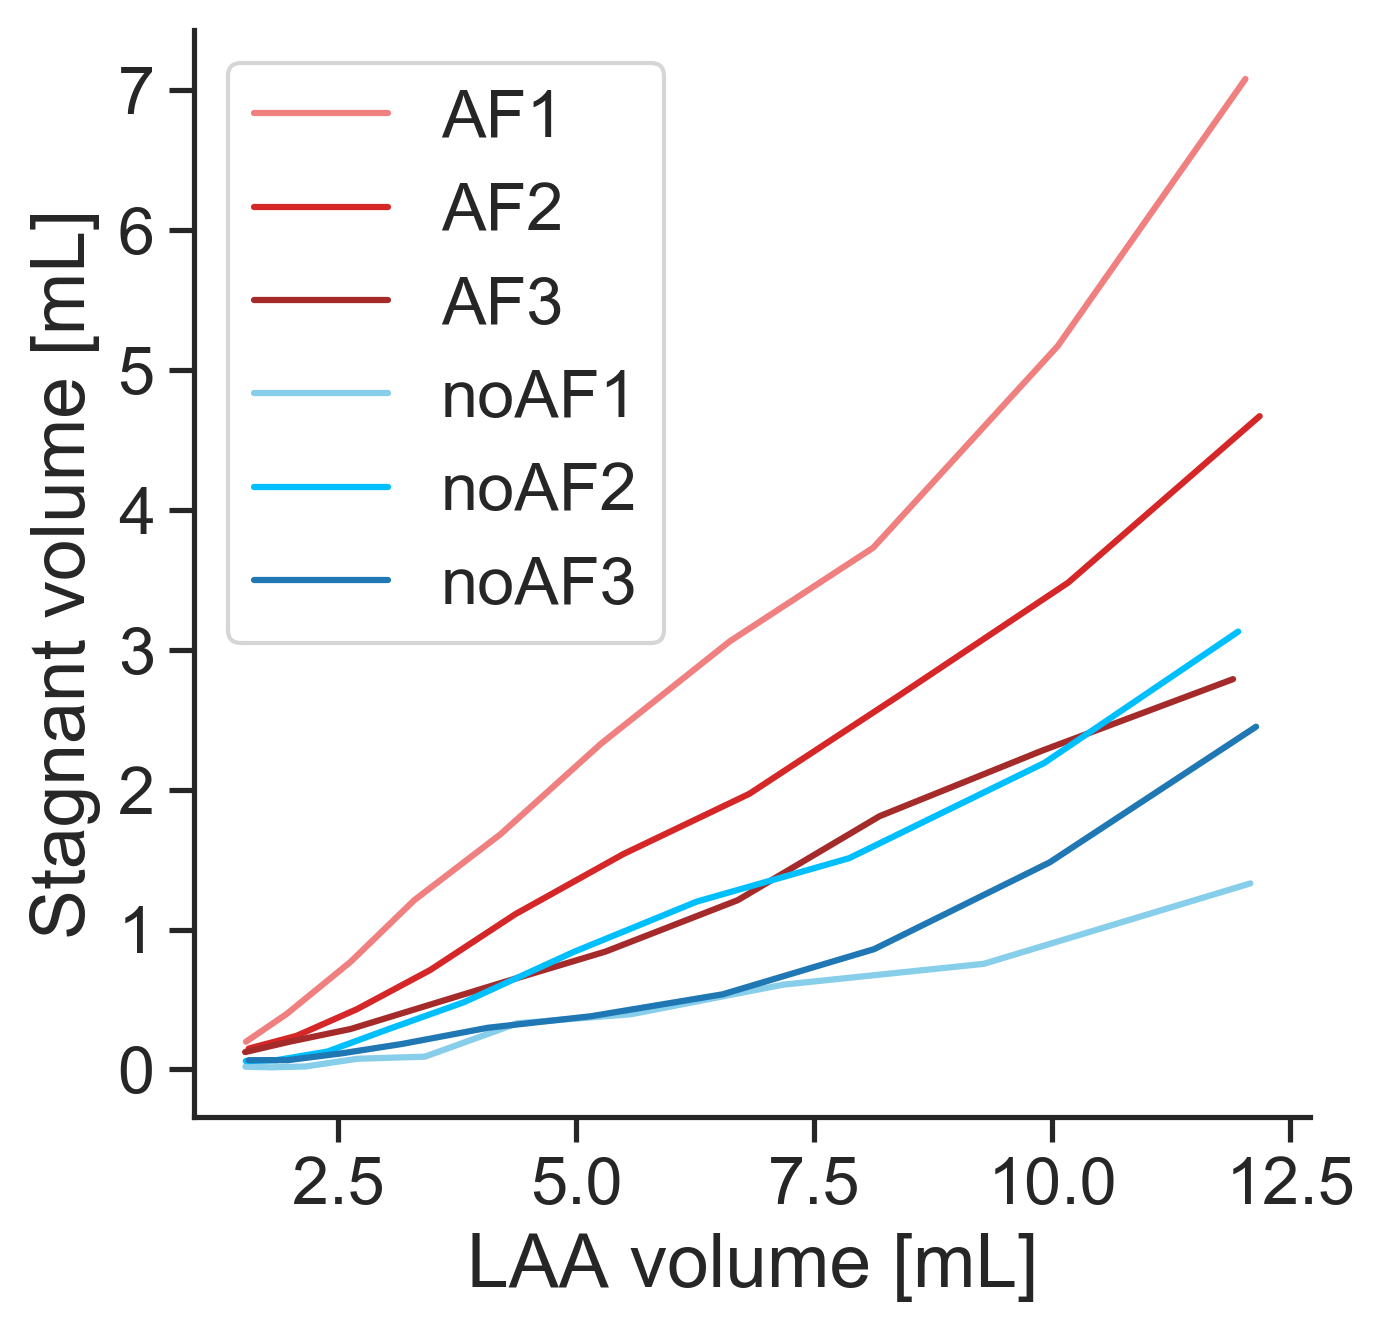
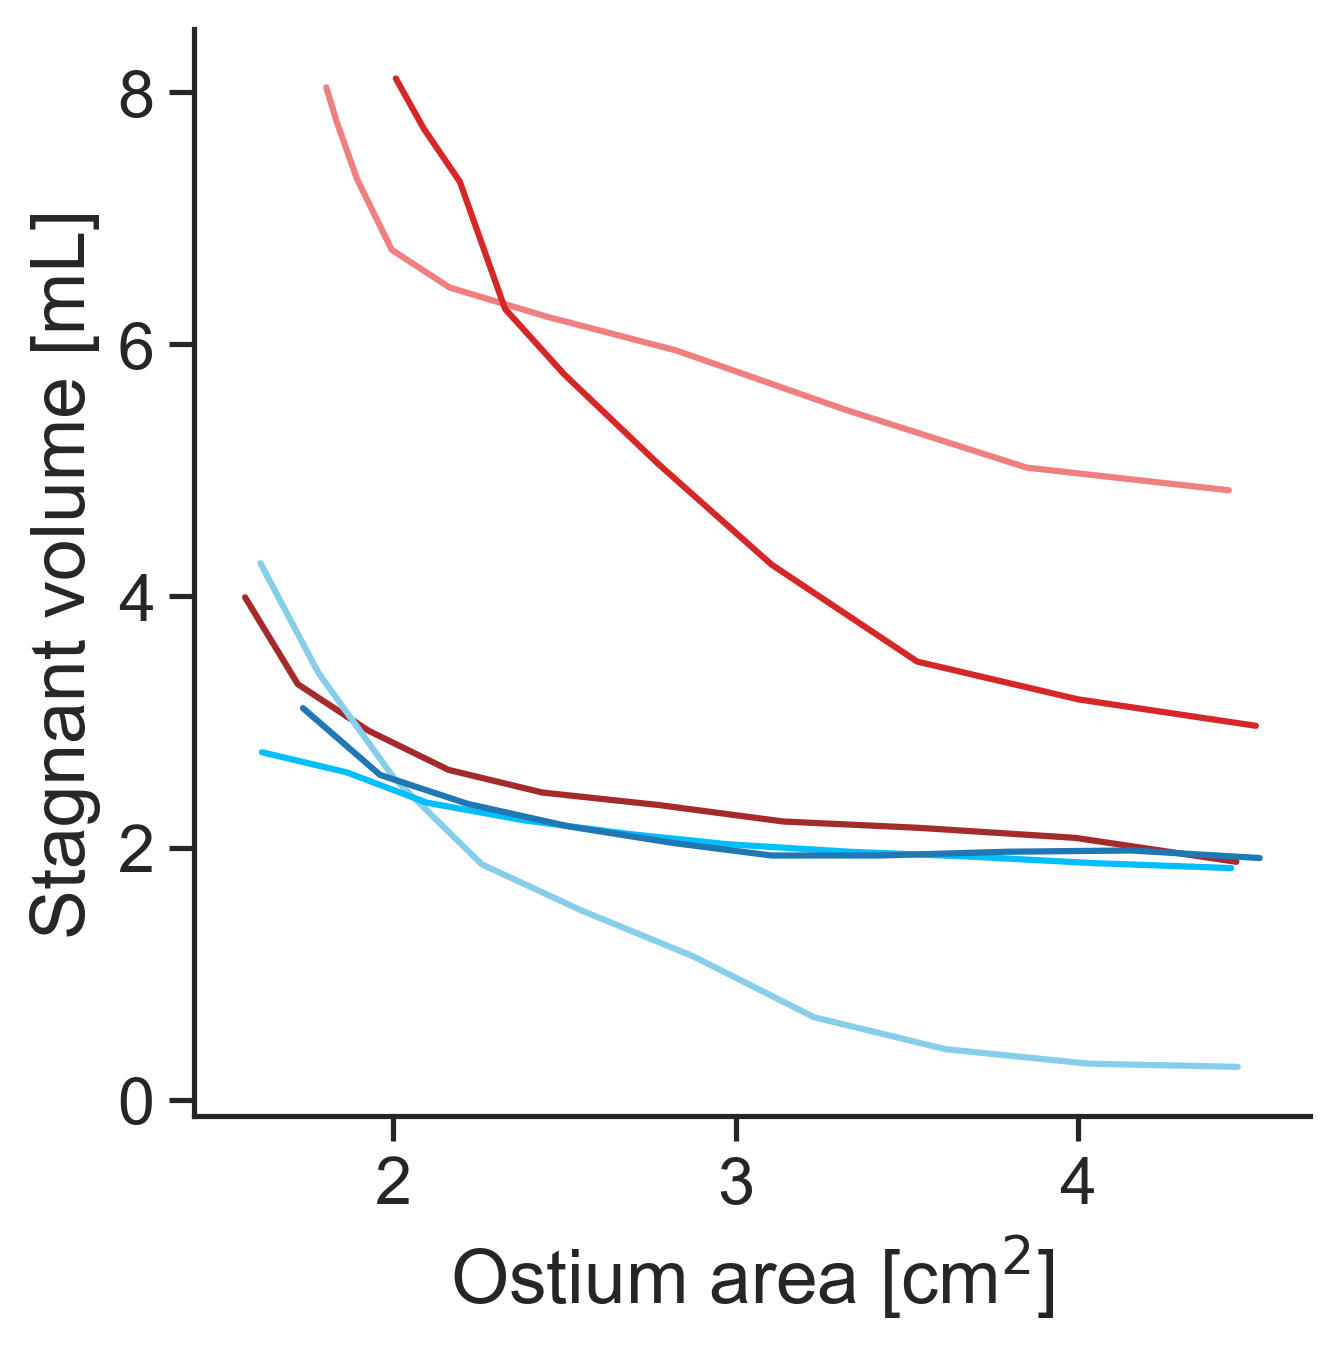
We computed the stagnant volume of the 180 simulated LAAs after 5 cardiac cycles as described above and plotted their dependence on cardiac output, LAA volume, and ostium area (Figure 6). The stagnant volume of LAA decreased dramatically with cardiac output, and patients with AF were more sensitive to changes in this parameter than non-AF patients (Figure 6(a)). Figure 6(b) shows that the stagnant volume of LAA increased with the volume of LAA for all patients and that while this growth was overall more pronounced in patients with AF than in patients without AF, there was some overlap between the two groups. Finally, Figure 6(c) shows that the stagnant volume of LAA decreased appreciably with the area of the ostium in half of our patients (AF1, AF2 and non-AF1) while it was relatively insensitive to it in the other half (AF3, non-AF2 and non-AF3).
In general, the intra-patient parametric sensitivity of LAA stagnant volume and its overlapping values between AF and non-AF patients highlight the inherent limitations of global hemodynamic metrics to classify patient phenotypes. The following sections illustrate how reduced-order models that capture the spatial features of hemodynamic metrics could contribute to discriminating patients.
3.2 Wall shear stress maps in the universal LAA coordinate system
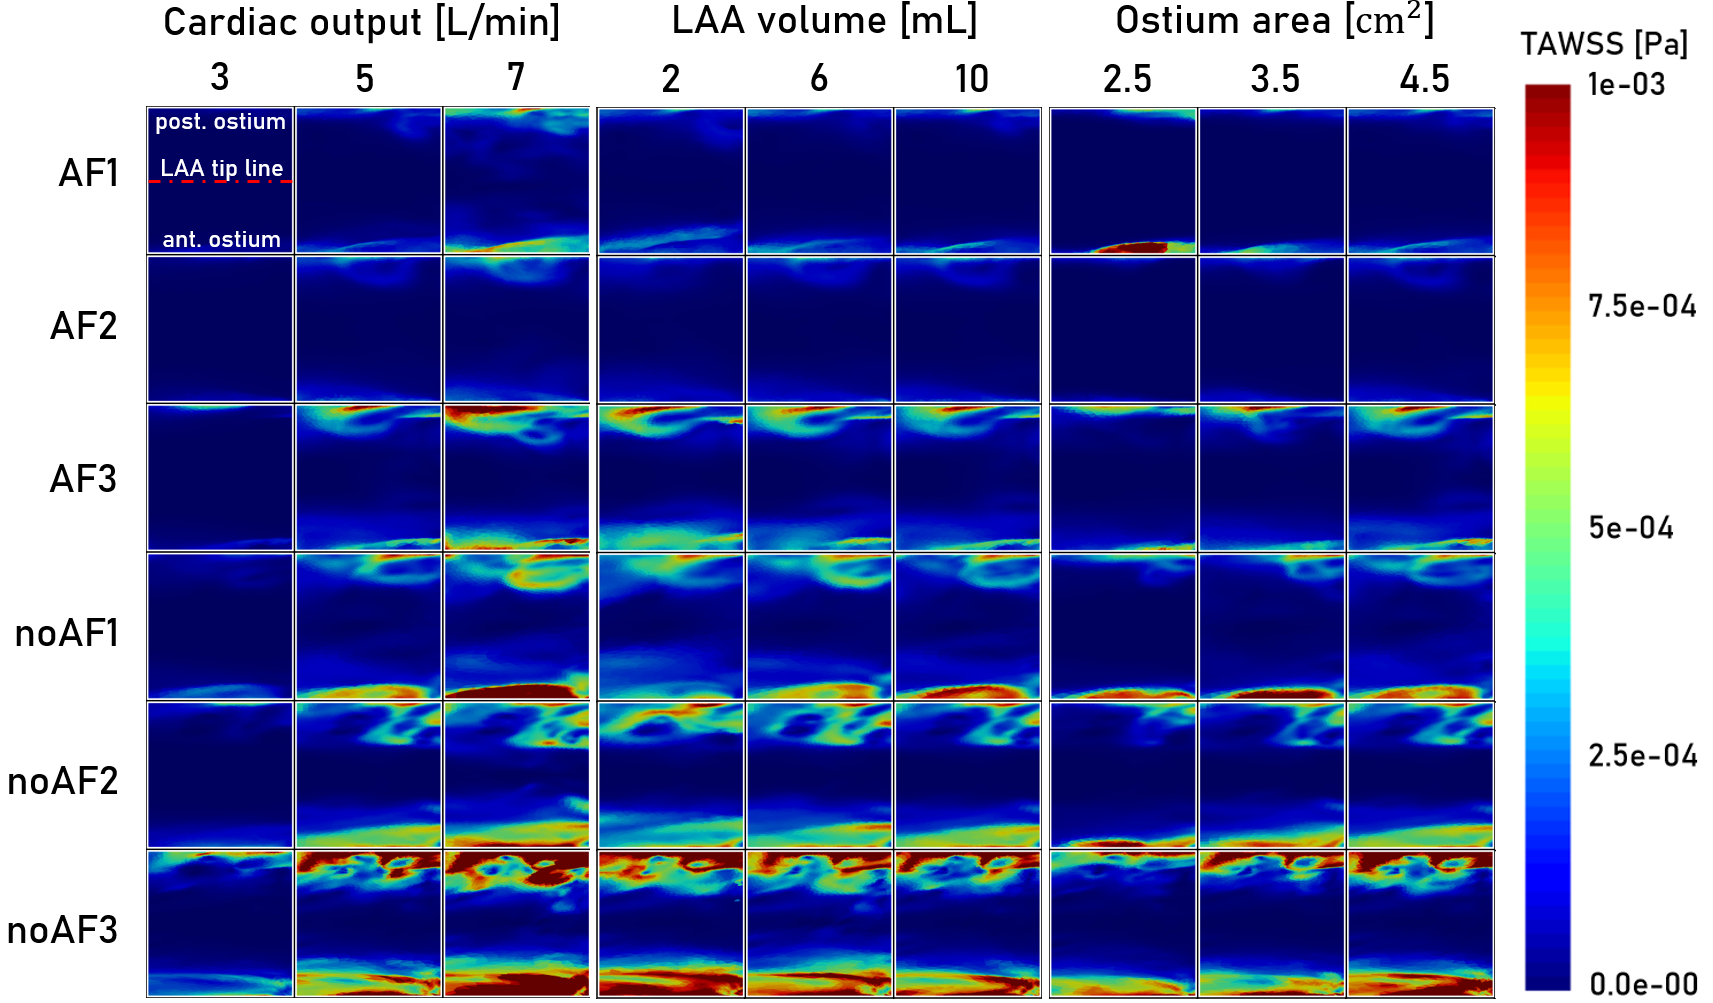
The spatial distributions of the TAWSS and OSI were mapped in the ULAAC system to facilitate their visualization and standardize the comparison of different simulations. Figure 7 shows the projected TAWSS maps, each panel representing a unique combination of baseline patient-specific segmentation (rows) and cardiac output, LAA volume, or ostium area (columns). These data indicate that patients with AF tend to have lower TAWSS values than patients without AF. More important, each patient has a characteristic TAWSS pattern that is altered by changes in simulation parameters. Although subtle, these changes are noticeable and could help distinguish patients. For example, patients AF3 and non-AF1 have roughly similar peak TAWSS values, but the peaks have different locations in the ULAAC system. Varying cardiac output, LAA chamber volume, or ostium area altered the TAWSS map of each patient. However, as seen in Figure 7, these changes were overall less significant than interpatient differences, and each patient had a distinctive TAWSS spatial signature.
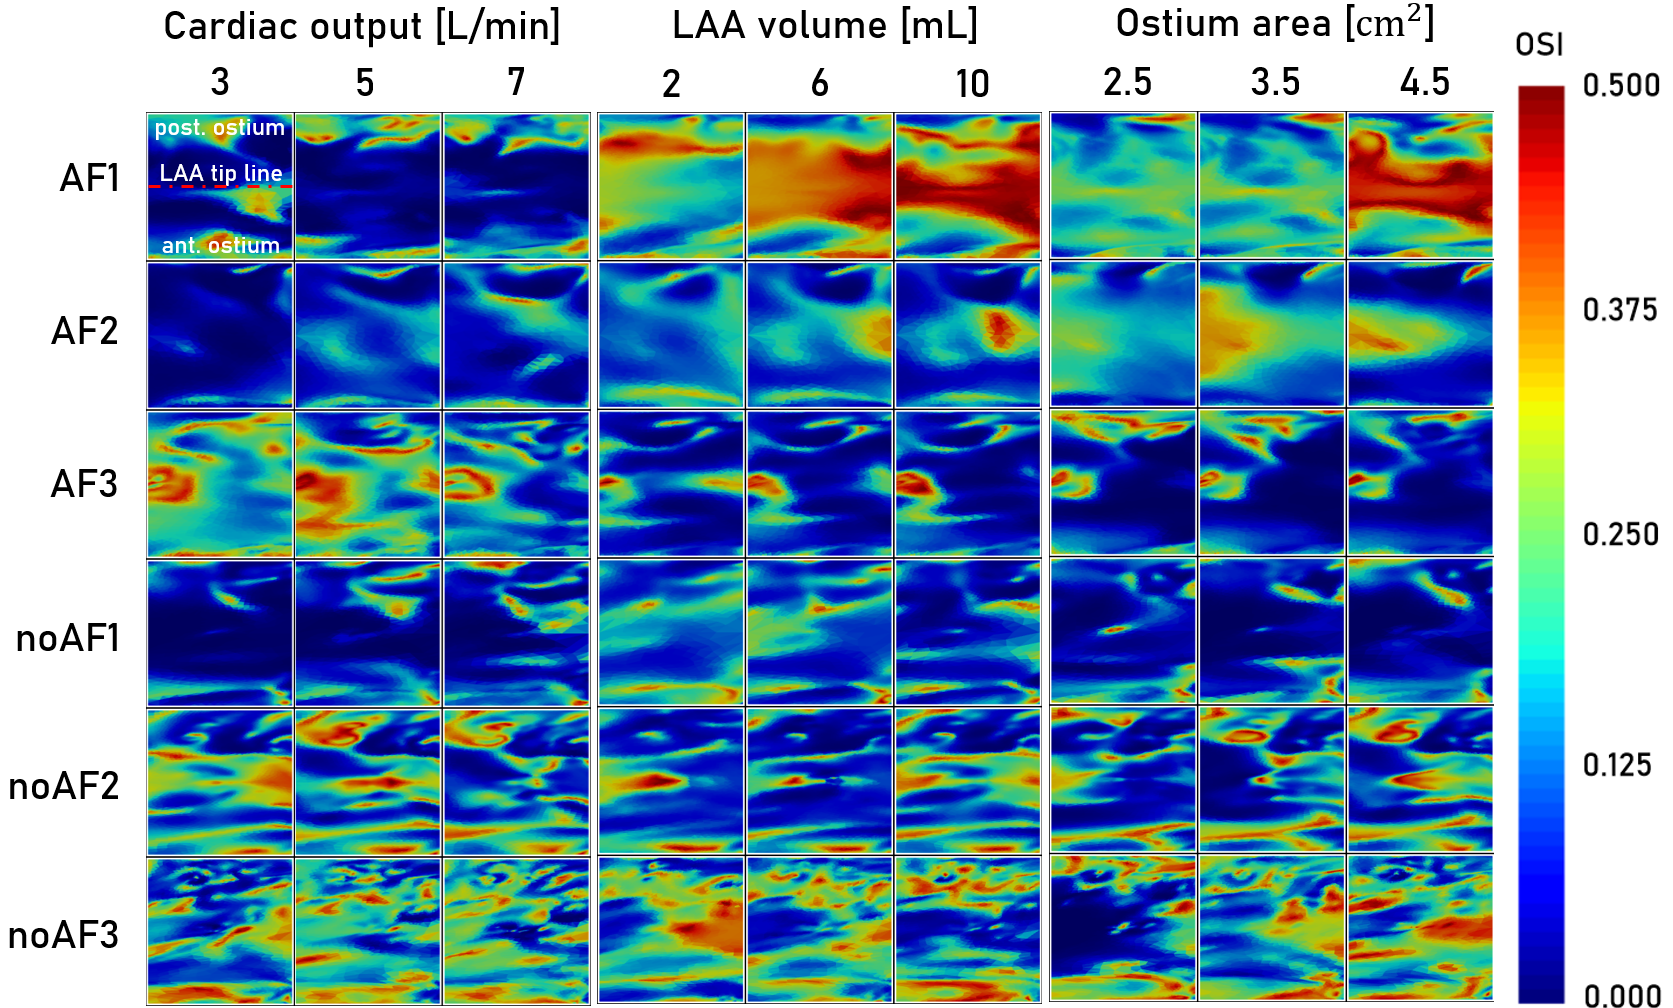
A similar analysis was performed on the OSI maps, revealing that this hemodynamic metric had a more intricate spatial organization that was also more sensitive to varying simulation parameters (Figure 8). Consequently, it was harder to observe a patient-specific spatial signature using OSI. In the next section, we present a systematic analysis pipeline to build reduced-order models to investigate whether the spatial features of the TAWSS and OSI maps in the ULAAC system could be used to discriminate between AF and non-AF patients.
3.3 Reduced-order model of LAA wall shear stress patterns
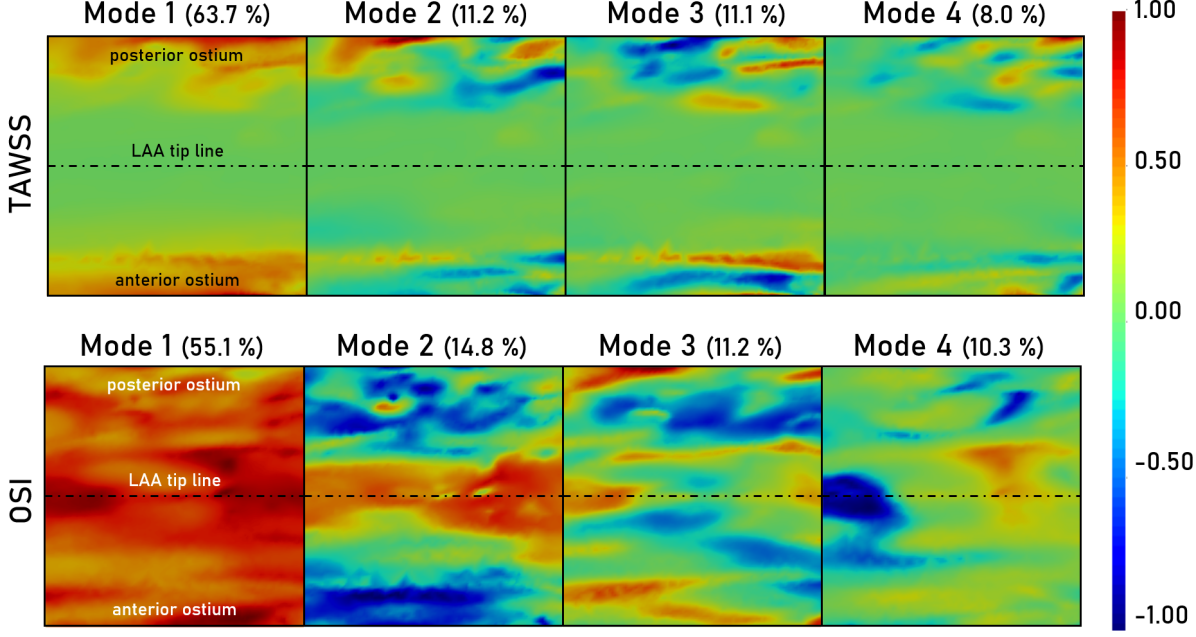
Taking advantage of the structured way to represent the wall data provided by the ULAAC system, we performed POD on the TAWSS and OSI data using the methods described in §2. Decomposition was performed using the 180 simulation snapshots generated by rigging and morphing the six AF and non-AF patient-specific segmentations and varying the cardiac output. Subsequently, we represented each particular dataset as where labels the specific dataset, denotes POD mode rank, and the functions are the POD eigenmodes. Thus, measures the projection of the TAWSS map from the dataset into the eigenmode of the POD of the full cohort.
The four highest-ranked POD modes, shown in Figure 9(a), account for of the variance of TAWSS and OSI in the plane. The first TAWSS mode, containing the mean field value, has near-zero magnitude along a wide band centered at the LAA tip line , progressively increasing to reach a constant value as we move toward the ostium ( or ). Modes 2-4 also have low values near the LAA tip and encode spatial fluctuations of progressively increasing complexity near the ostium. The first OSI mode is roughly uniform, although it shows some fluctuations that could be due to our relatively low sample size of . The second mode has a banded structure with a peak along the LAA tip line and valleys along the ostium lines. The third and fourth OSI modes encode relatively broken patterns of varying lengths and widths that are more difficult to interpret.
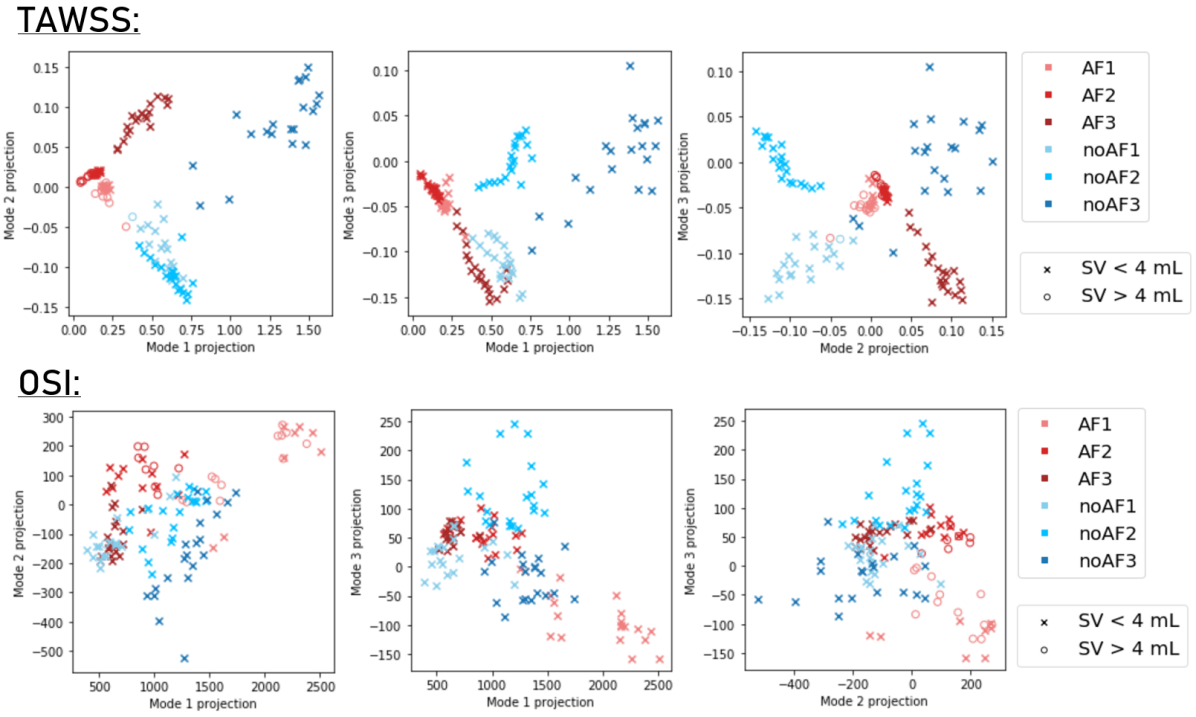
Finally, we plotted vs. , vs. , and vs. for (Figure 9(b), two bottom rows). These scatter plots suggest that the AF and non-AF cases can be segregated by jointly considering the value of two coefficients, i.e., a two-dimensional reduced order model based on POD. Interestingly, the point clouds of coefficients corresponding to each patient cluster together, supporting the idea that each patient has a distinct signature of TAWSS in his LAA that was not too sensitive to variations in cardiac output or geometric remodeling. However, the point clouds obtained from the POD of the OSI overlap significantly, indicating that a higher-dimensional, reduced-order model would be required to separate AF cases from non-AF ones using this hemodynamic variable. This difference is consistent with the more intricate spatial structure of OSI maps and their higher patient-to-patient variability (Figure 8).
The stagnant volume variable was also contrasted with the previously calculated POD projections, so Figure 9(b) shows with different markers the cases with a stagnant volume of less than 4 mL versus those with a higher stagnant volume. In the case of TAWSS, the cases with higher stagnant volumes tend to have lower absolute values of , , and than the cases with lower stagnant volumes, allowing us to see how this variable is also related to the features extracted from the POD. On the other hand, the information that can be extracted by contrasting the stagnant volume variable with the POD projections of the OSI does not present an easily interpretable pattern.
4 Discussion
Computational fluid dynamics (CFD) analyses of left atrial (LA) blood flow in patient-specific anatomical models are gaining recognition as a tool to investigate the hemodynamic substrate for ischemic stroke in patients with atrial fibrillation (AF) [22, 14, 29, 31, 23, 24, 21, 13, 32, 25]. For each prescribed combination of inflow/outflow boundary conditions and motion of the atrial wall, CFD analysis produces a faithful 4D (3D, time-resolved) representation of flow through the atrium, which allows computing surrogate metrics of thrombosis risk, for example, blood residence time, or modeling the coagulation cascade. Special attention is devoted to metrics of left atrial appendage (LAA) stasis because the LAA is the most common site of atrial thrombosis [26, 27]. However, these metrics are sensitive to parameters such as LA wall kinetics [24, 21], PV flow split [25], or cardiac output [28], which can vary significantly over the course of the day for a given patient. They are also sensitive to geometrical factors such as LAA volume, ostium area, or LAA morphology, which can vary over the course of months due to adverse remodeling in patients with AF [48, 4]. Furthermore, the diversity of LAA morphologies makes it difficult to interpret and compare data from CFD analyzes performed on different patient-specific anatomies. Despite notable efforts, these uncertainties have made it difficult to derive a generalizable understanding of the determinants of LAA stasis [49, 50].
To address the challenges described above, this manuscript introduces two methodological advances. First, in an effort to model the potential effects of AF-associated atrial remodeling, we obtain patient-specific atrial anatomical models and rig and morph these models to vary the volume of LAA and the area of the ostium [28]. As a result, we digitally expand our patient database to run 180 CFD simulations on six patients, gaining knowledge of how atrial remodeling exacerbates each patient’s hemodynamic substrate for LAA thrombosis.
Our results indicate that decreasing cardiac output accentuates LAA stasis, consistent with the existing literature [51, 52, 28]. Likewise, we find that LAA stasis increases with LAA volume and decreases with ostium area, also as noted in previous studies [19, 28, 53]. These trends are strong since, in general, once one can expect blood clearance to be slower for larger LAAs and faster for larger LAA orifices. However, there is significant interpatient variability in these dependencies, which limits their applicability to clinical decision support. While it has long been recognized that anatomical factors such as LAA morphology [26, 54] and atrial body sphericity [55] affect the risk of ischemic stroke in patients with AF, there is a lack of systematic approaches to evaluate these effects. On the other hand, it has been suggested that since secondary flows are the only flows present in the LAA during an episode of AF, this makes patients with AF more generally sensitive to changes in geometrical and flow parameters [31, 25]. The proposed simulation framework based on rigging and morphing can help assess each patient’s susceptibility to LAA thrombosis due to atrial remodeling. Furthermore, by quantifying the effect of different variables independently, we can make some generalizable observations. For example, one can expect both LAA volume and the area of the ostium to increase with time with adverse atrial remodeling. However, while increasing the volume of LAA seems to increase LAA stasis indefinitely, the effect of the ostium area saturates rapidly, producing little benefit in lowering LAA stasis for areas larger than 3 cm2. These data suggest that sufficiently adverse atrial remodeling will inevitably increase LAA stasis.
The second methodological innovation of this work is a framework for building reduced-order models of hemodynamic metrics in a universal LAA coordinate system (ULAAC). We apply this framework to derive interpretable quantitative criteria to discriminate flow phenotypes of AF and non-AF and identify determinants of LAA blood stasis. Although there have been ML models to infer LAA blood stasis from LAA geometry [56, 57], it is necessary to improve the interpretability of these predictive models.
The ULAAC coordinates are defined by solving two Laplace-Beltrami equations on the LAA surface with different boundary conditions. Roney et al. [36] previously used this method to define a universal whole-atrium coordinate system, but in that representation, the LAA typically occupies a very small area that varies from patient to patient. By restricting our mapping to the LAA and prescribing fixed boundary conditions at the ostium and the LAA tip line, we map every patient’s LAA into a unit square. This procedure helps to visualize and compare the spatial distribution of hemodynamic metrics in the LAA, the most likely site of thrombus formation.
To illustrate our methodology, we analyze TAWSS and OSI, two metrics associated with mean and temporal fluctuations of wall shear stress. Patient-specific TAWSS maps in the ULAAC system revealed a relatively common pattern of high TAWSS values near the ostium and much lower values in the distal LAA. This pattern was robust with respect to changes in cardiac output, LAA volume, and ostium area, despite variations in fine-scale features. There is a trend for TAWSS to increase with cardiac output, consistent with the effect of this parameter on LAA stagnant volume. However, it is harder to deduce the effects of the other two parameters and the presence of AF by mere visual inspection of patient-specific TAWSS maps, and this problem is exacerbated in OSI maps, which have a more intricate spatial structure with higher patient-to-patient variability.
It is our working hypothesis that applying POD to the TAWSS and OSI maps in the ULAAC coordinate system allows capturing the underlying patterns in these metrics and evaluating whether these patterns are distinct in LAAs with large stagnant volumes. We restricted our analysis to the first four POD modes because they represent more than of the variance of TAWSS and OSI. The POD eigenvectors describe the spatial organization of the TAWSS and OSI fields, whereas the eigenvalues measure the weight of each mode. Regarding the TAWSS, these weights tend to cluster near zero for AF cases, especially those with large LAA stagnant volume, implying that the overall magnitude of TAWSS is lower throughout the appendage in these cases. The OSI eigenvalues show less clear segregation, although there is an appreciable trend for mode 2 to have higher positive weights in cases of AF with significant LAA stasis. The spatial organization of this mode, showing positive values along the LAA tip line and negative values along the ostium, helps interpret this result. Overall, the TAWSS and OSI POD data imply that LAA blood stasis is more likely in appendages with low wall shear stresses, especially in those where the stresses oscillate significantly near the LAA tip.
4.1 Limitations and Future Work
We simulate flow through rigid atria to reflect impaired wall kinetics associated with AF. Fixed-wall CFD simulations of LA flow differ less substantially from moving-wall simulations in atria with impaired kinetics [24, 21]. In this regard, our non-AF simulations are informative about anatomy but not function. While this is a limitation, it allows the isolation of atrial remodeling effects from wall kinetics, as well as facilitates running the 180 atrial simulations presented in this manuscript. Along the same lines, a MV model was not considered in the atrium outflow, similar to most previous CFD investigations of LAA flow. This choice is justified by simulations of the whole left heart, suggesting that the LA flow patterns are not affected by the MV movement [12].
We assumed blood to behave as a Newtonian fluid, even if non-Newtonian effects could be significant in LAAs with low shear stress and stasis [31]. Furthermore, we imposed equal flow rates at the four PV atrial inlets. Although LAA stasis has been shown to vary with PV flow rate split, particularly in patients with AF [25], the even flow split approximation is widely used when there is no available patient-specific data on this parameter [15]. Keeping this and other patient-specific parameters constant throughout our simulations (wall kinetics, blood viscosity, heart rate, PV orientations, etc.) allowed us to isolate the effects of specific variables on LAA stasis.
Despite leveraging a relatively large database of CFD models, the baseline patient-specific segmentations for these models come from only 6 subjects. Our results show that the 30 simulations of each patient tend to cluster together in the POD eigenvalue space, especially for TAWSS, suggesting that these simulations are not independent of each other. Consequently, this work should be viewed as a first effort toward applying modal decomposition to hemodynamic metrics to identify and interpret the determinants of LAA thrombosis, rather than as an exhaustive demonstration of this idea. More atrial geometries are needed to confirm and generalize the results obtained here and to fully characterize how atrial remodeling affects LAA stasis. Nonwithstanding these limitations, the notion that hemodynamic metrics of each patient leave a distinct low-dimensional footprint that withstands variations in geometrical parameters and cardiac output is compelling and deserves further investigation.
Acknowledgments
This work was supported by Ministerio de Ciencia, Innovación y Universidades of Spain under projects DPI 2017-83911-R and PID 2019-107279RB-I00, by Junta de Castilla y León under project “Proyecto de apoyo a GIR 2018” with reference VA081G18, by Junta de Extremadura and FEDER funds under project IB20105, and by the US National Institutes of Health under projects 1R01HL160024 and 1R01HL158667. We thank the Programa Propio - Universidad Politécnica de Madrid, and the Ayuda Primeros Proyectos de Investigación ETSII-UPM. We also thank Programa de Excelencia para el Profesorado Universitario de la Comunidad de Madrid for its financial support and the CeSViMa UPM project for its computational resources.
Conflict of interest
The authors declare that they have no conflict of interest.
References
- [1] E. J. Benjamin, P. Muntner, A. Alonso, M. S. Bittencourt, C. W. Callaway, A. P. Carson, A. M. Chamberlain, A. R. Chang, S. Cheng, S. R. Das, et al., Heart disease and stroke statistics—2019 update: a report from the american heart association, Circulation 139 (10) (2019) e56–e528.
- [2] H. Kamel, P. M. Okin, M. S. Elkind, C. Iadecola, Atrial fibrillation and mechanisms of stroke: time for a new model, Stroke 47 (3) (2016) 895–900.
- [3] P. A. Wolf, R. D. Abbott, W. B. Kannel, Atrial fibrillation as an independent risk factor for stroke: The framingham study, Stroke 22 (8) (1991) 983–988. doi:10.1161/01.STR.22.8.983.
- [4] P. M. Boyle, J. C. Del Álamo, N. Akoum, Fibrosis, atrial fibrillation and stroke: clinical updates and emerging mechanistic models, Heart 107 (2) (2021) 99–105.
- [5] N. M. Al-Saady, O. A. Obel, A. J. Camm, Left atrial appendage: Structure, function, and role in thromboembolism, Heart 82 (5) (1999) 547–554. doi:10.1136/hrt.82.5.547.
- [6] F. Lupercio, J. C. Ruiz, D. F. Briceno, J. Romero, P. A. Villablanca, C. Berardi, R. Faillace, A. Krumerman, J. D. Fisher, K. Ferrick, et al., Left atrial appendage morphology assessment for risk stratification of embolic stroke in patients with atrial fibrillation: a meta-analysis, Heart Rhythm 13 (7) (2016) 1402–1409.
- [7] G. Murtaza, B. Yarlagadda, K. Akella, D. G. Della Rocca, R. Gopinathannair, A. Natale, D. Lakkireddy, Role of the left atrial appendage in systemic homeostasis, arrhythmogenesis, and beyond, Cardiac Electrophysiology Clinics 12 (1) (2020) 21–28.
- [8] D. Lakkireddy, M. Turagam, M. R. Afzal, J. Rajasingh, D. Atkins, B. Dawn, L. Di Biase, K. Bartus, S. Kar, A. Natale, et al., Left atrial appendage closure and systemic homeostasis: the laa homeostasis study, Journal of the American College of Cardiology 71 (2) (2018) 135–144.
- [9] B. D. Hoit, Left atrial size and function: role in prognosis, Journal of the American College of Cardiology 63 (6) (2014) 493–505.
- [10] V. Mihalef, R. I. Ionasec, P. Sharma, B. Georgescu, I. Voigt, M. Suehling, D. Comaniciu, Patient-specific modelling of whole heart anatomy, dynamics and haemodynamics from four-dimensional cardiac ct images, Interface Focus 1 (3) (2011) 286–296.
- [11] C. Chnafa, S. Mendez, F. Nicoud, Image-based large-eddy simulation in a realistic left heart, Computers & Fluids 94 (2014) 173–187.
- [12] V. Vedula, R. George, L. Younes, R. Mittal, Hemodynamics in the left atrium and its effect on ventricular flow patterns, Journal of Biomechanical Engineering 137 (11) (2015) 1–8. doi:10.1115/1.4031487.
- [13] M. Bucelli, A. Zingaro, P. C. Africa, I. Fumagalli, L. Dede’, A. Quarteroni, A mathematical model that integrates cardiac electrophysiology, mechanics and fluid dynamics: application to the human left heart, International Journal for Numerical Methods in Biomedical Engineering (2022) e3678.
- [14] T. Otani, A. Al-Issa, A. Pourmorteza, E. R. McVeigh, S. Wada, H. Ashikaga, A Computational Framework for Personalized Blood Flow Analysis in the Human Left Atrium, Annals of Biomedical Engineering 44 (11) (2016) 3284–3294. doi:10.1007/s10439-016-1590-x.
- [15] J. Lantz, V. Gupta, L. Henriksson, M. Karlsson, A. Persson, C. J. Carlhäll, T. Ebbers, Impact of Pulmonary Venous Inflow on Cardiac Flow Simulations: Comparison with In Vivo 4D Flow MRI, Annals of Biomedical Engineering 47 (2) (2019) 413–424. doi:10.1007/s10439-018-02153-5.
- [16] J. H. Seo, V. Vedula, T. Abraham, A. C. Lardo, F. Dawoud, H. Luo, R. Mittal, Effect of the mitral valve on diastolic flow patterns, Physics of fluids 26 (12) (2014) 121901.
- [17] V. Vedula, J.-H. Seo, A. C. Lardo, R. Mittal, Effect of trabeculae and papillary muscles on the hemodynamics of the left ventricle, Theoretical and Computational Fluid Dynamics 30 (2016) 3–21.
- [18] G. M. Bosi, A. Cook, R. Rai, L. J. Menezes, S. Schievano, R. Torii, G. Burriesci, Computational Fluid Dynamic Analysis of the Left Atrial Appendage to Predict Thrombosis Risk, Frontiers in Cardiovascular Medicine 5 (April) (2018) 1–8. doi:10.3389/fcvm.2018.00034.
- [19] G. García-Isla, A. L. Olivares, E. Silva, M. Nuñez-Garcia, C. Butakoff, D. Sanchez-Quintana, H. G. Morales, X. Freixa, J. Noailly, T. De Potter, O. Camara, Sensitivity analysis of geometrical parameters to study haemodynamics and thrombus formation in the left atrial appendage, International Journal for Numerical Methods in Biomedical Engineering 34 (8) (2018) 1–14. doi:10.1002/cnm.3100.
- [20] A. Masci, L. Barone, L. Dedè, M. Fedele, C. Tomasi, A. Quarteroni, C. Corsi, The impact of left atrium appendage morphology on stroke risk assessment in atrial fibrillation: A computational fluid dynamics study, Frontiers in Physiology 9 (January) (2019) 1–11. doi:10.3389/fphys.2018.01938.
- [21] J. Dueñas-Pamplona, J. G. García, J. Sierra-Pallares, C. Ferrera, R. Agujetas, J. R. Lopez-Minguez, A comprehensive comparison of various patient-specific cfd models of the left atrium for atrial fibrillation patients, Computers in Biology and Medicine 133 (2021) 104423.
- [22] R. Koizumi, K. Funamoto, T. Hayase, Y. Kanke, M. Shibata, Y. Shiraishi, T. Yambe, Numerical analysis of hemodynamic changes in the left atrium due to atrial fibrillation, Journal of Biomechanics 48 (3) (2015) 472–478. doi:10.1016/j.jbiomech.2014.12.025.
- [23] M. Corti, A. Zingaro, A. M. Quarteroni, et al., Impact of atrial fibrillation on left atrium haemodynamics: A computational fluid dynamics study, Computers in Biology and Medicine 150 (2022) 106143.
- [24] M. García-Villalba, L. Rossini, A. Gonzalo, D. Vigneault, P. Martinez-Legazpi, E. Durán, O. Flores, J. Bermejo, E. McVeigh, A. M. Kahn, et al., Demonstration of patient-specific simulations to assess left atrial appendage thrombogenesis risk, Frontiers in physiology 12 (2021) 596596.
- [25] E. Durán, M. García-Villalba, P. Martínez-Legazpi, A. Gonzalo, E. McVeigh, A. M. Kahn, J. Bermejo, O. Flores, J. C. Del Álamo, Pulmonary vein flow split effects in patient-specific simulations of left atrial flow, Computers in Biology and Medicine (2023) 107128.
- [26] L. Di Biase, P. Santangeli, M. Anselmino, P. Mohanty, I. Salvetti, S. Gili, R. Horton, J. E. Sanchez, R. Bai, S. Mohanty, A. Pump, M. Cereceda Brantes, G. J. Gallinghouse, J. D. Burkhardt, F. Cesarani, M. Scaglione, A. Natale, F. Gaita, Does the left atrial appendage morphology correlate with the risk of stroke in patients with atrial fibrillation? Results from a multicenter study, Journal of the American College of Cardiology 60 (6) (2012) 531–538. doi:10.1016/j.jacc.2012.04.032.
- [27] M. Yamamoto, Y. Seo, N. Kawamatsu, K. Sato, A. Sugano, T. Machino-Ohtsuka, R. Kawamura, H. Nakajima, M. Igarashi, Y. Sekiguchi, et al., Complex left atrial appendage morphology and left atrial appendage thrombus formation in patients with atrial fibrillation, Circulation: Cardiovascular Imaging 7 (2) (2014) 337–343.
- [28] J. Dueñas-Pamplona, J. G. Garcia, F. Castro, J. Munoz-Paniagua, J. Goicolea, J. Sierra-Pallares, Morphing the left atrium geometry: A deeper insight into blood stasis within the left atrial appendage, Applied Mathematical Modelling 108 (2022) 27–45.
- [29] J. Mill, A. L. Olivares, D. Arzamendi, V. Agudelo, A. Regueiro, O. Camara, X. Freixa, Impact of Flow Dynamics on Device-Related Thrombosis After Left Atrial Appendage Occlusion, Canadian Journal of Cardiology 36 (6) (2020) 968.e13–968.e14. doi:10.1016/j.cjca.2019.12.036.
- [30] J. Dueñas-Pamplona, J. Sierra-Pallares, J. García, F. Castro, J. Munoz-Paniagua, Boundary-condition analysis of an idealized left atrium model, Annals of Biomedical Engineering 49 (6) (2021) 1507–1520. doi:10.1007/s10439-020-02702-x.
- [31] A. Gonzalo, M. García-Villalba, L. Rossini, E. Durán, D. Vigneault, P. Martínez-Legazpi, O. Flores, J. Bermejo, E. McVeigh, A. M. Kahn, et al., Non-newtonian blood rheology impacts left atrial stasis in patient-specific simulations, International Journal for Numerical Methods in Biomedical Engineering 38 (6) (2022) e3597.
- [32] L. Feng, H. Gao, B. Griffith, S. Niederer, X. Luo, Analysis of a coupled fluid-structure interaction model of the left atrium and mitral valve, International journal for numerical methods in biomedical engineering 35 (11) (2019) e3254.
- [33] S. F. Bifulco, G. D. Scott, S. Sarairah, Z. Birjandian, C. H. Roney, S. A. Niederer, C. Mahnkopf, P. Kuhnlein, M. Mitlacher, D. Tirschwell, et al., Computational modeling identifies embolic stroke of undetermined source patients with potential arrhythmic substrate, Elife 10 (2021) e64213.
- [34] M. G. Borja, A. M. Khan, P. Martinez-Legazpi, C. Chazo, J. Bermejo, J. C. Del Alamo, Automatic classification of pathological left ventricular flows based on modal decomposition, in: APS Division of Fluid Dynamics Meeting Abstracts, 2020, pp. W07–018.
- [35] C. Acebes, X. Morales, O. Camara, A cartesian grid representation of left atrial appendages for a deep learning estimation of thrombogenic risk predictors, in: Statistical Atlases and Computational Models of the Heart. M&Ms and EMIDEC Challenges: 11th International Workshop, STACOM 2020, Held in Conjunction with MICCAI 2020, Lima, Peru, October 4, 2020, Revised Selected Papers 11, Springer, 2021, pp. 35–43.
- [36] C. H. Roney, A. Pashaei, M. Meo, R. Dubois, P. M. Boyle, N. A. Trayanova, H. Cochet, S. A. Niederer, E. J. Vigmond, Universal atrial coordinates applied to visualisation, registration and construction of patient specific meshes, Medical image analysis 55 (2019) 65–75.
- [37] G. Ernst, C. Stöllberger, F. Abzieher, W. Veit-Dirscherl, E. Bonner, B. Bibus, B. Schneider, J. Slany, Morphology of the left atrial appendage, The Anatomical Record 242 (4) (1995) 553–561.
- [38] W. Jue, Z. Zhaoqi, Y. Wei, M. Cuilian, Y. Zixu, Z. Yike, A study of images of projective angles of pulmonary veins, European journal of radiology 71 (3) (2009) 474–479.
- [39] T. J. Buist, P. Gal, J. P. Ottervanger, J. J. J. Smit, A. R. R. Misier, P. P. H. Delnoy, A. Adiyaman, P. L. Jager, A. Elvan, Association between pulmonary vein orientation and ablation outcome in patients undergoing multi-electrode ablation for atrial fibrillation, Journal of cardiovascular computed tomography 10 (3) (2016) 251–257.
- [40] J. Dueñas-Pamplona, J. García, F. Castro, J. Muñoz-Paniagua, J. Sierra-Pallares, Estimation of degradation velocity of biocompatible damaged stents due to blood flow, IEEE Transactions on Biomedical Engineering 68 (12) (2021) 3525–3533.
- [41] J. Sierra-Pallares, C. Méndez, P. García-Carrascal, F. Castro, Spatial distribution of mean age and higher moments of unsteady and reactive tracers: Reconstruction of residence time distributions, Applied Mathematical Modelling 46 (2017) 312–327.
- [42] J.-J. Chiu, S. Chien, Effects of disturbed flow on vascular endothelium: pathophysiological basis and clinical perspectives, Physiological reviews 91 (1) (2011) 327–387.
- [43] J. Bayer, A. J. Prassl, A. Pashaei, J. F. Gomez, A. Frontera, A. Neic, G. Plank, E. J. Vigmond, Universal ventricular coordinates: A generic framework for describing position within the heart and transferring data, Medical image analysis 45 (2018) 83–93.
- [44] K. Crane, C. Weischedel, M. Wardetzky, Geodesics in heat: A new approach to computing distance based on heat flow, ACM Transactions on Graphics (TOG) 32 (5) (2013) 1–11.
- [45] M. Reuter, F.-E. Wolter, N. Peinecke, Laplace–beltrami spectra as ‘shape-dna’of surfaces and solids, Computer-Aided Design 38 (4) (2006) 342–366.
- [46] C. Wachinger, P. Golland, W. Kremen, B. Fischl, M. Reuter, A. D. N. Initiative, et al., Brainprint: A discriminative characterization of brain morphology, NeuroImage 109 (2015) 232–248.
- [47] P. Krysl, S. Lall, J. E. Marsden, Dimensional model reduction in non-linear finite element dynamics of solids and structures, International Journal for numerical methods in engineering 51 (4) (2001) 479–504.
- [48] S. Levy, P. Sbragia, Remodelling in atrial fibrillation, Archives des Maladies du Coeur et des Vaisseaux 98 (4) (2005) 308–312.
- [49] X. Morales Ferez, J. Mill, K. A. Juhl, C. Acebes, X. Iriart, B. Legghe, H. Cochet, O. De Backer, R. R. Paulsen, O. Camara, Deep learning framework for real-time estimation of in-silico thrombotic risk indices in the left atrial appendage, Frontiers in Physiology 12 (2021) 694945.
-
[50]
Y. Chahine, M. J. Magoon, B. Maidu, J. C. del Álamo, P. M. Boyle, N. Akoum,
Machine learning and the
conundrum of stroke risk prediction, Arrhythmia & Electrophysiology Review
2023;12:e07. (2023).
doi:10.15420/aer.2022.34.
URL https://doi.org/10.15420/aer.2022.34 - [51] J. H. Seo, T. Abd, R. T. George, R. Mittal, A coupled chemo-fluidic computational model for thrombogenesis in infarcted left ventricles, American Journal of Physiology-Heart and Circulatory Physiology 310 (11) (2016) H1567–H1582.
- [52] J. M. Lee, J.-B. Kim, J.-S. Uhm, H.-N. Pak, M.-H. Lee, B. Joung, Additional value of left atrial appendage geometry and hemodynamics when considering anticoagulation strategy in patients with atrial fibrillation with low cha2ds2-vasc scores, Heart Rhythm 14 (9) (2017) 1297–1301.
- [53] S. Yaghi, C. Song, W. A. Gray, K. L. Furie, M. S. Elkind, H. Kamel, Left atrial appendage function and stroke risk, Stroke 46 (12) (2015) 3554–3559.
- [54] I. M. Khurram, J. Dewire, M. Mager, F. Maqbool, S. L. Zimmerman, V. Zipunnikov, R. Beinart, J. E. Marine, D. D. Spragg, R. D. Berger, et al., Relationship between left atrial appendage morphology and stroke in patients with atrial fibrillation, Heart rhythm 10 (12) (2013) 1843–1849.
- [55] F. Bisbal, E. Guiu, N. Calvo, D. Marin, A. Berruezo, E. Arbelo, J. Ortiz-Pérez, T. M. De Caralt, J. M. Tolosana, R. Borràs, et al., Left atrial sphericity: a new method to assess atrial remodeling. impact on the outcome of atrial fibrillation ablation, Journal of cardiovascular electrophysiology 24 (7) (2013) 752–759.
- [56] M. Saiz-Vivó, J. Mill, J. Harrison, G. Jimenez-Pérez, B. Legghe, X. Iriart, H. Cochet, G. Piella, M. Sermesant, O. Camara, Unsupervised machine learning exploration of morphological and haemodynamic indices to predict thrombus formation in the left atrial appendage, in: International Workshop on Statistical Atlases and Computational Models of the Heart, Springer, 2022, pp. 200–210.
- [57] M. I. Pons, J. Mill, A. Fernandez-Quilez, A. L. Olivares, E. Silva, T. De Potter, O. Camara, et al., Joint analysis of morphological parameters and in silico haemodynamics of the left atrial appendage for thrombogenic risk assessment, Journal of Interventional Cardiology 2022 (2022).