Low-Latency Video Conferencing System for Geo-Distributed Data Centers
Abstract
In the face of rising global demand for audio/video meetings, managing traffic across geographically distributed (geo-distributed) data centers presents a significant challenge due to the dynamic and limited nature of inter-DC network performance. Facing these issues, this paper introduces two novel techniques, VCRoute and WMJitter, to optimize the performance of geo-distributed video conferencing systems. VCRoute is a routing method designed for video conferencing data packets. It treats the routing problem as a Multi-Armed Bandit issue, and utilizes a tailored Thompson Sampling algorithm for resolution. Unlike traditional approaches, VCRoute uses predicted end-to-end latency as the routing selection reward for each packet, enabling effective and timely end-to-end latency optimization. In conjunction with VCRoute, we present WMJitter, a watermark-based mechanism for managing network jitter. Leveraging a window-based statistic method, WMJitter enables real-time network jitter estimation, leading to significant reductions in end-to-end delay and an improved balance between latency and loss rate. Evaluations based on real geo-distributed network performance demonstrate the effectiveness and scalability of VCRoute and WMJitter, offering robust solutions for optimizing video conferencing systems in geo-distributed settings.
I Introduction
Due to the outbreak of the COVID-19 pandemic, the need for video conferencing increases dramatically throughout the world. According to Zoom statistics, the annual Zoom meeting minutes have increased by 3300% from October 2019 to October 2020 and the number continues to grow [1]. With the large number of businesses requiring global cooperation and communication, video conferencing systems such as Zoom and VooV have been commonly used in a geographically distributed (geo-distributed) manner, where global participants join an online meeting session from local clients to send and receive audio and video messages. Users’ Quality of Experience (QoE) is heavily dependent on how well video conferencing systems transfer and process the messages between clients.
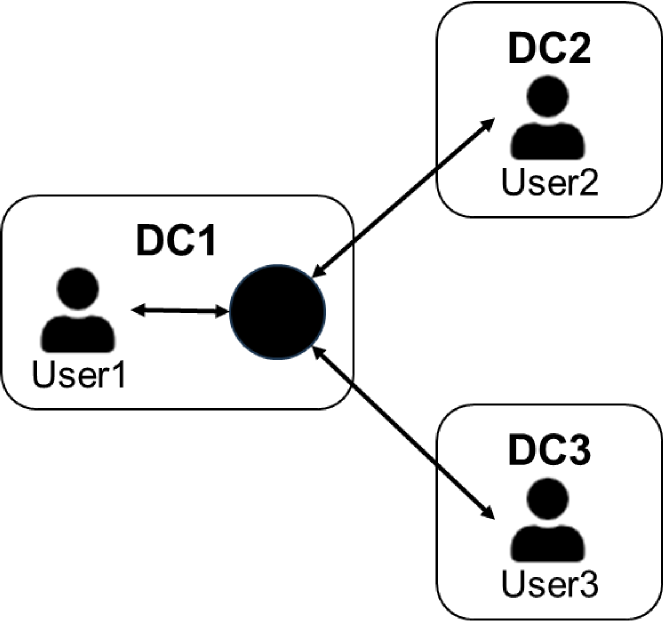
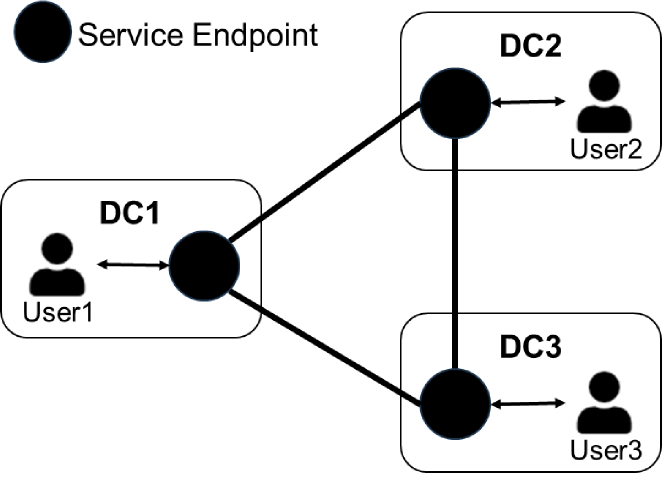
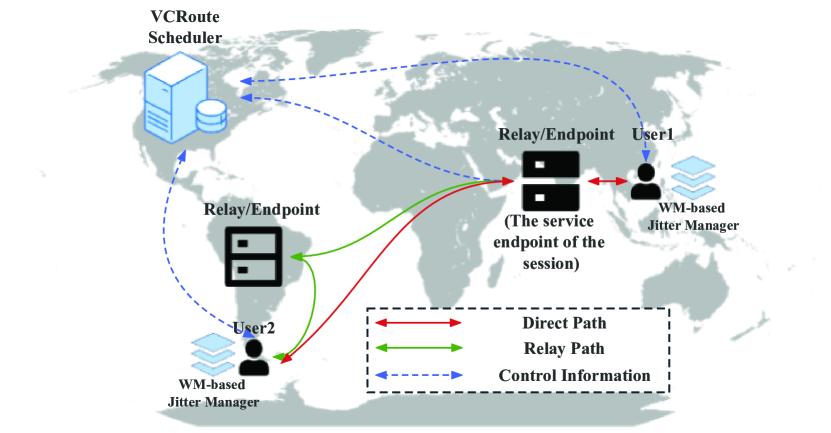
Due to the global distribution of users, most video conferencing systems are also architected and deployed globally to achieve good scalability and low latency. For example, Zoom has 19 interconnected data centers (DCs) spread across the world and can also scale to public clouds when needed [2]. Existing video conferencing systems may have different architectures. For example, Figure 1 shows two service architectures adopted by popular video conferencing systems [3, 4]. For both architectures, large amounts of data are transferred across geo-distributed data centers, either between endpoints and users (Figure 1(a)) or between multiple endpoints (Figure 1(b)). Our study of the geo-distributed network performance on real cloud show that, the inter-DC network latency can be over 10X higher than that of intra-DC network (see Section II-A). The high variance of inter-DC network performance also cause high jitter, which leads to challenges when reducing the end-to-end latency of geo-distributed video conferencing. We summarize the challenges faced by existing video conferencing systems as follows.
First, geo-distributed overlay networks provide a number of relay paths for video conferencing systems to select the best paths to transmit packets between different service endpoints and user pairs. Existing studies have proposed various offline [5] or adaptive [6] algorithms to find the best routing for video conferencing applications. However, when making the routing decisions, existing methods mainly focus on minimizing the packet transmitting latency from source to target, while in video conferencing applications, the end-to-end latency of a packet contains not only the data transmitting time but also packet reordering time sensitive to network jitter (i.e., Figure 3). Due to the dynamic and heterogeneous network performance in geo-distributed DCs, it is highly possible that the routing decisions which lead to the minimum packet transmitting latency do not guarantee the lowest end-to-end latency. For example, the existing routing method [5] which performs a great deal of exploration to find good routing decisions may cause higher network jitter and thus lead to higher packet reordering latency. To provide low-latency video conferencing in geo-distributed DCs, we need to redesign the packet routing approach in existing video conferencing systems considering the special application features.
Second, inter-DC network latency varies greatly overtime. This is especially true on public Internet paths [7] with the fastly increasing video conferencing traffic [8]. Higher network dynamics lead to higher jitter, hence causing more packets to arrive at the destination out-of-order. Packets that are arriving too late will be discarded which results in packet loss to data streams. Existing systems mostly adopt jitter buffers [9, 10] to handle the out-of-order problem, where the buffer size is an important parameter to balance between packet reordering latency and loss rate. By analyzing the jitter management in existing systems, we found that the buffer-based methods are essentially in-order-processing (IOP) methods and can cause unnecessary delay for packets in the buffer when there are stragglers. Due to the highly dynamic feature of geo-distributed networks, the IOP-based jitter buffer methods will inevitably cause more latency waste.
In this paper, we tackle two critical challenges in improving the quality of video conferencing in geo-distributed DCs by proposing two novel techniques: VCRoute and WMJitter.
First, VCRoute is a packet routing method specifically designed for video conferencing systems. VCRoute treats the routing problem as a Multi-Armed Bandit problem and applies a custom version of Thompson Sampling to solve it. In contrast to the conventional approaches [5], our method leverages the Bayesian framework inherent in Thompson Sampling to derive probability distributions for individual arms. This innovative approach allows us to effectively tackle the highly dynamic nature of geo-distributed network performance. Moreover, we innovate by using predicted end-to-end latency as the reward for the routing selection of each packet. Due to the high-latency of geo-distributed network, it is impractical to wait for the reward of a current packet’s routing choice to be sent back from the receiver’s side. To address this issue, we employ a DNN-based online regression model to accurately predict the end-to-end latency for packets. This ensures that the selection probability for each arm can be updated promptly. Furthermore, to maintain good scalability, we have implemented two strategies to minimize the overhead of VCRoute.
Second, we propose WMJitter, a watermark-based Out-Of-Order (OOP) processing mechanism to handle network jitter. WMJitter leverages the advantages of using watermarks in streaming processing systems, enabling a significant reduction in end-to-end delay. We incorporate a window-based statistic method for real-time network jitter estimation, facilitating timely and accurate adjustments to the watermark. This efficient buffering management provided by WMJitter significantly reduces end-to-end latency, thus enhancing the overall system performance by striking a balance between latency and loss rate. These two methods, VCRoute and WMJitter, offer a comprehensive and scalable solution to address the challenges of performance optimization for video conferencing systems in geo-distributed environments.
We evaluate our techniques on two sets of real-world geo-distributed environments with complementary features. By comparing to state-of-the-art routing and jitter managing approaches, we found that 1) VCRoute greatly outperforms existing approaches when the inter-DC network performance is highly heterogeneous (Section VI-C2); 2) watermark-based jitter management has shown great improvement on average end-to-end latency when the inter-DC network performance is highly dynamic (Section VI-C1). In summary, we make the following contributions:
-
•
To the best of our knowledge, we are the first to jointly consider packet transmitting latency and jitter during packet routing, which is important to reduce the end-to-end latency for data packets in video conferencing systems.
-
•
Existing video conferencing systems adopt buffer-based jitter handling, which may lead to unnecessary packet delay. We are the first to introduce watermark-based Out-of-Order-Processing (OOP) into the jitter management of video conferencing systems, which further reduced the end-to-end latency for data packets.
-
•
We extensively evaluated our design on two sets of geo-distributed environments with complementary features. Evaluation results have shown that our design can effectively reduce the end-to-end latency of packets by up to 44% compared to the state-of-the-art. We believe the results are insightful for video conferencing service providers from different businesses (clouds, ISPs, etc.).
The remainder of this paper is organized as follows. We introduce the background and motivation in Section II, present the system overview in Section III, unfold design details in Section IV and Section V, introduce our evaluation in Section VI, present the related literature in Section VII and finally conclude the paper in Section VIII.
II Background and Motivation
II-A Geo-Distributed Network Features
Geo-distributed data communications go through the Wide Area Network (WAN), which is much different from intra-DC network due to its high latency and high dynamicity [11]. We have the following observations from measuring inter-DC network performance on the real cloud.
| Shanghai | Guangzhou | Tokyo | Moscow | |
|---|---|---|---|---|
| Shanghai | (0,0) | (29,0.06%) | (90,10.96%) | (280,6.53%) |
| Guangzhou | (29,0.07%) | (0,0) | (79,6.23%) | (245,0.68%) |
| Tokyo | (90,10.89%) | (78,6.13%) | (0,0) | (153,0.02%) |
| Moscow | (280,6.38%) | (245,0.75%) | (154,0.03%) | (0,0) |
First, the inter-DC network latency is much higher than that of intra-DC network. For example, Table I shows the round trip time (RTT) and packet loss rate measured between Tencent cloud instances located in different geo-distributed DCs [12]. When two DCs are far from each other (e.g., Shanghai and Moscow), the network latency between the DCs can reach several hundreds of milliseconds and hence lead to non-negligible delay to inter-DC data communications.
Second, it is sometimes more preferable to transfer data between DCs through relay paths than direct paths considering data communication latency and quality. For example, according to Table I, the round trip delay between Shanghai and Moscow is 280ms, while it can be reduced to 243ms if the data is first transferred from Shanghai to Tokyo and then from Tokyo to Moscow. Similarly, the packet loss rate of direct data transmission from Shanghai to Moscow is 6.53%, while it can be reduced to 0.70% aggregated if the data is relayed via Guangzhou.
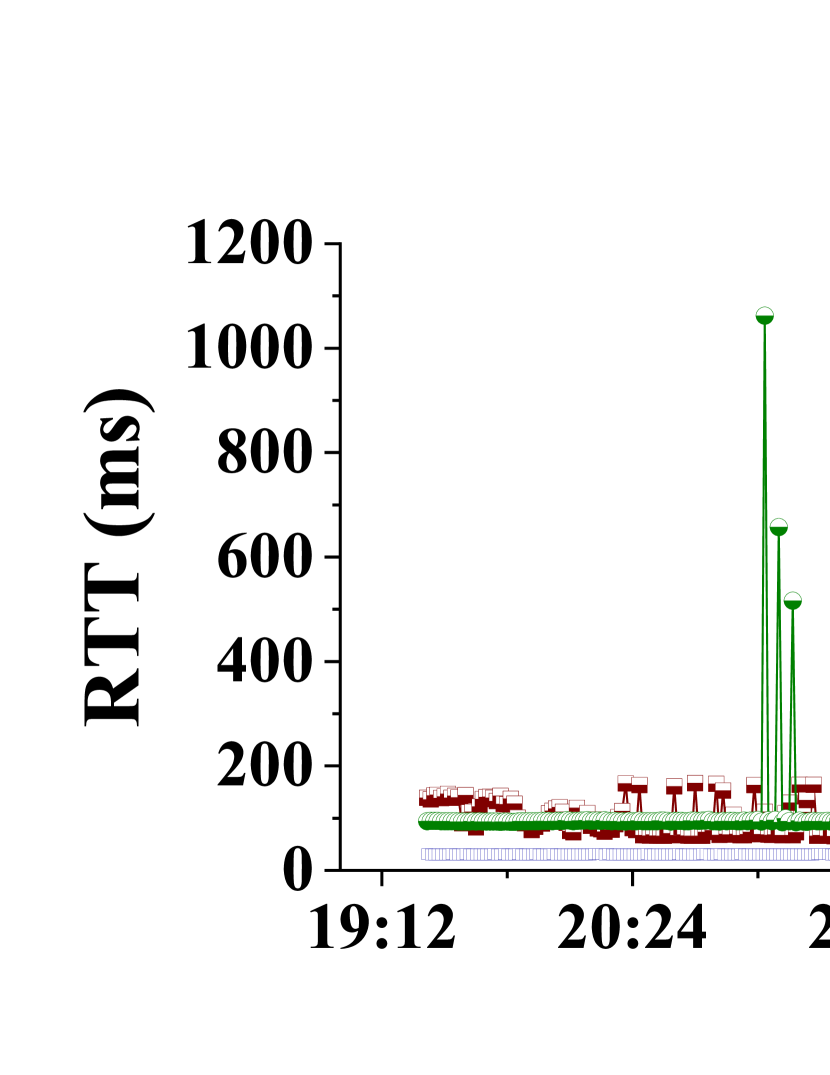
Third, inter-DC network latency can vary greatly over time. We measure the RTT between two instances located in different Tencent cloud DCs for a few hours and plot the variation of RTT along time in Figure 2. The highest RTT between Guangzhou and Tokyo can be over ten times larger than the average. There are also inter-DC links with low performance variations, such as that between Shanghai and Guangzhou. This may depend on the distance between two DCs as well as the traffic on the link.
The dynamicity of network latency in the geo-distributed network can lead to jitter problem, which refers to the variation in the delay of packets as they traverse a network. Jitter can be caused by a variety of factors, including network congestion, packet queuing, and routing issues. High levels of jitter can result in poor network performance and may cause problems for real-time applications such as voice and video conferencing.
II-B Video Conferencing Systems
In the past few years, especially since the outbreak of COVID-19 pandemic, video conferencing systems have played an important role in our day-to-day communications. Optimizing the quality of video/audio calls is urgent considering the large number of end users distributed globally. Existing studies have revealed the relationship between call quality and network performance [5], which shows that network metrics such as RTT and jitter can be used to accurately measure the quality of video/audio calls. That is, any improvement in RTT or jitter is likely to improve the call quality [5]. However, the special network features in geo-distributed DCs (e.g., high RTT, heterogeneous relay paths and high jitter) make it especially challenging to obtain good optimizations.
Many popular video conferencing systems such as Zoom and Webex adopt the single service endpoint architecture shown in Figure 1(a) [3], where a single service endpoint is scheduled for each meeting session and all participants communicate with the same endpoint for video streaming. The endpoint is used to select and forward video/audio streams. Due to the high latency of inter-DC network, this can clearly lead to large delay for users far from the endpoint if without any routing optimizations. As discussed in the last subsection, using other service nodes as relays and providing efficient routing policy between endpoint and users may be able to reduce the delay for packets. However, since data packets in the same stream are routed individually, they may take different paths and encounter varying network latency, hence leading to higher jitter.
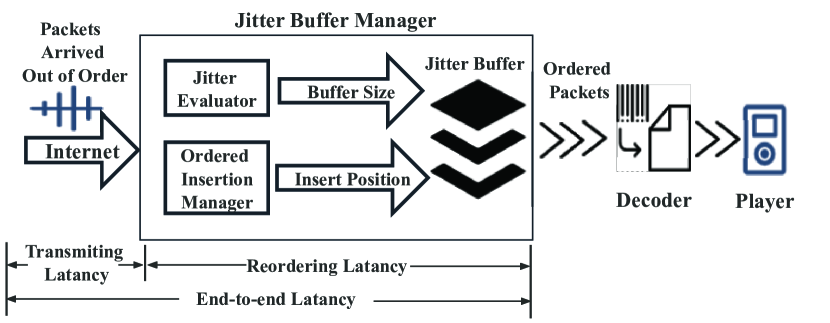
Existing network communication systems usually adopt jitter buffers to compensate for the quality degradation caused by jitter. For example, Figure 3 shows the jitter buffer management in webRTC [10], a popular open-source framework for creating video conferencing systems. Data packets travel through the Internet and arrive at users’ end. A jitter buffer at the user’s end temporarily stores incoming packets which are usually out-of-order, and then plays them back by reordering the packets according to their timestamps of generation. Packets arriving too late will be discarded. Jitter buffer absorbs the variability in packet arrival times, allowing the communication system to maintain a consistent quality of service. The buffer size is typically configurable. A larger buffer can provide better jitter compensation, at the expense of increased delay, while a smaller buffer may cause more packets being discarded due to out-of-order. Existing studies [13, 14] have proposed various methods to adapt the buffer size according to network jitter.
II-C Motivations
With the global pandemic of COVID-19, some ISPs have reported a more than 300% increase on video conferencing traffic from February to October 2020 [8]. As a result, the network congestion and variation will cause more severe impact on the performance of video conferencing systems.
Existing studies optimize the performance of video conferencing systems by reducing the end-to-end latency of data streams. As shown in Figure 3, the end-to-end latency of a data stream is composed of two parts, including the time for transmitting a packet through the Internet (i.e., transmitting latency) and the lag that a packet stays in the jitter buffer (i.e., reordering latency). Existing studies tried to reduce the transmitting latency and reordering latency individually through finding good dissemination paths [5] or designing smart buffering schemes [15]. However, we found that optimizing the two components individually does not guarantee good overall performance for video conferencing systems.
In a global video conferencing session, data streams are transmitted through WAN composed of multiple autonomous systems. Data packets in a stream are routed individually and thus may end up with different paths. Existing routing methods such as Via [5] mainly focus on selecting the best relay paths for packets in geo-distributed overlay networks [16] to minimize packet transmitting time. However, this does not guarantee low end-to-end latency for packets, due to ignorance of packet reordering lag.
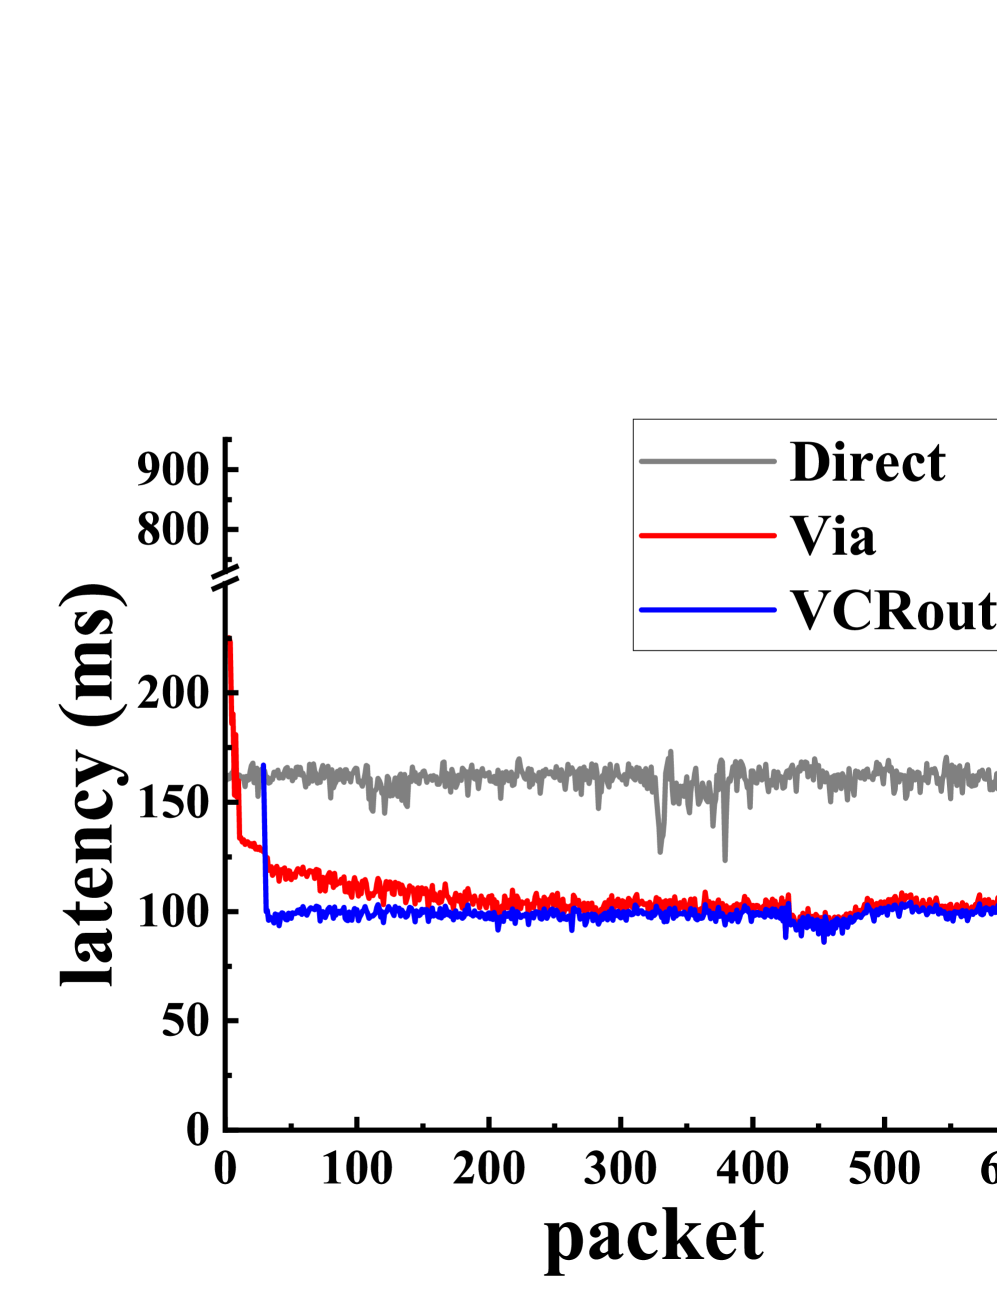
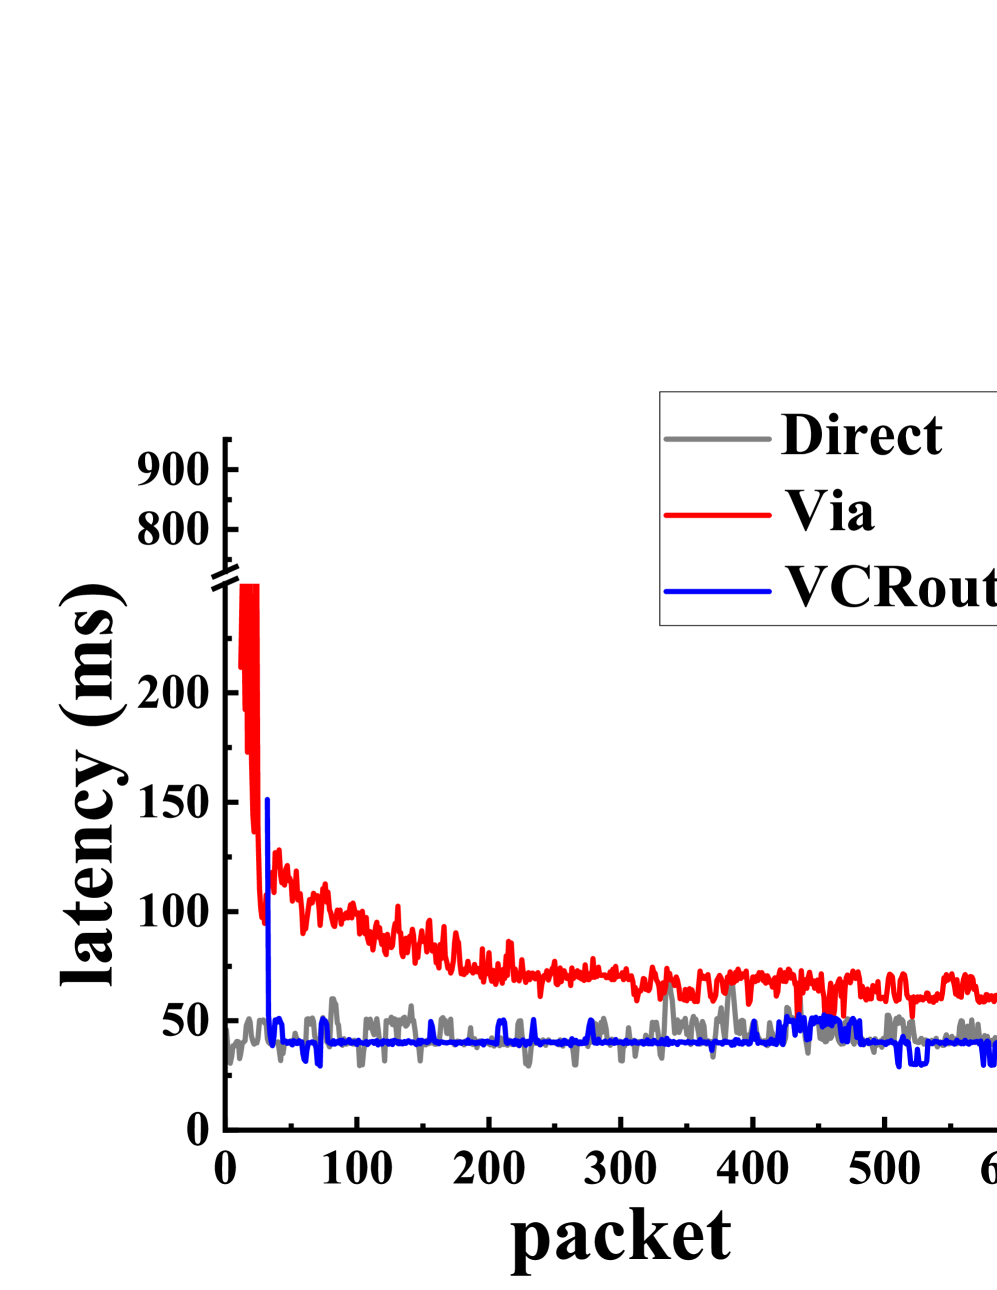
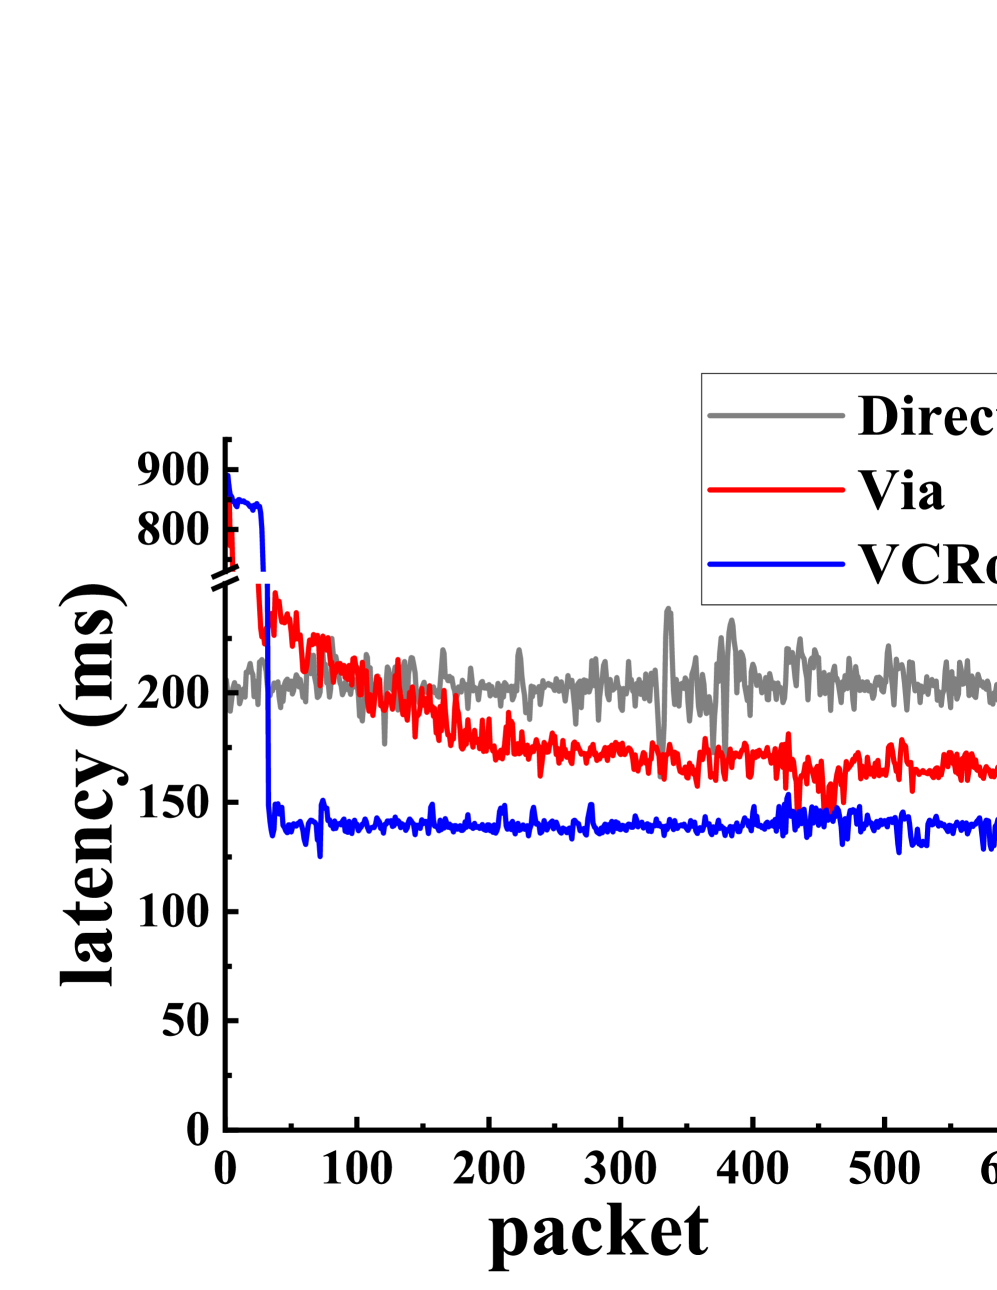
Consider a simple example with two communicating ends and four relay nodes (17 paths between the two ends considering only direct paths and indirect paths with one or two relays). The network performance between each pair of nodes are adopted from real measurements in Tencent cloud. Consider a stream of 30,000 packets sent from one end to the other (emulating a 5min call). We adopt three different ways to make routing decisions for each packet in the stream, including Direct, Via [5] and VCRoute. The same packet reordering approach is used for all comparisons. As shown in Figure 4(a), both Via and VCRoute can find relay paths leading to much lower data transmitting time than directly communicating between the two ends (i.e., Direct). However, due to ignorance of the packet reordering lag, Via tend to explore different routes to find paths with lower transmitting latency, thus leading to higher jitter. As a result, Via has the highest packet reordering latency among the three as shown in Figure 4(b). By jointly considering packet transmitting and reordering, VCRoute obtains the lowest end-to-end latency.
The above results have shown the necessity to jointly consider network latency and jitter during packet routing in video conferencing systems. This is especially important for geo-distributed video conferencing, where the time-variation and heterogeneity of WAN performance gets more significant.
Data packets transmitted through the WAN are usually out-of-order and need to be reordered for good user experience. Existing studies mostly adopt jitter buffer to reorder packets at the receivers’ end [17]. Although one can dynamically change buffer size to adapt system latency to different network variations, jitter buffer is essentially an in-order-processing (IOP) method. The buffering mechanism inevitably causes latency penalty for all packets as they wait for stragglers to arrive [18]. However, the processing stage that comes after packet reordering (e.g., decoding) does not necessarily require all packets to be strictly in-order.
In this paper, we found that it is possible to leverage out-of-order processing (OOP) paradigm to further reduce the latency of video conferencing systems. OOP is an architecture commonly used in streaming processing for flexible and efficient execution of stream queries [19]. Compared to the conventional jitter buffer based approach, OOP allows more packets to come out of the reordering operation in time while ensuring the required order, resulting in a reduction in latency.
In summary, special features of geo-distributed network require revisiting the routing and jitter handling in current video conferencing systems to optimize end-to-end latency.
III System Overview
Motivated by the deficiencies of existing work, this paper aims at proposing a low-latency video conferencing system for geo-distributed DCs. We make two efforts to achieve this goal. First, we designed an application-aware routing mechanism named VCRoute, which jointly considers the network latency and jitter during routing to reduce the end-to-end latency for data packets. Second, we designed a novel jitter manager named WMJitter at the users’ end, which utilizes the Watermark-based OOP mechanism to make sure packets come out of the jitter manager in the correct order under low latency. Figure 5 gives an overview of our system.
Application-aware packet routing. Existing routing studies mainly focus on reducing the time that a packet travels on the route, and thus do not guarantee low end-to-end latency for video conferencing applications. In this paper, we propose VCRoute, which is a centralized packet scheduler specifically designed for optimizing the performance of video conferencing systems. As shown in Figure 5, VCRoute aims at selecting the best relay path for each packet travelling between the endpoint and the end user.
We formulate the routing problem as a Multi-Armed Bandit (MAB) problem, where each available path in the geo-distributed environment is an arm of the bandit. Different from existing studies [5], we calculate the reward using the end-to-end latency of a packet rather than the transmitting latency (as motivated by Figure 4). However, due to the high latency of inter-DC network, it could take several hundreds of milliseconds for the accurate reward value to be transferred back, which causes delay to our packet-level routing control. Further, the high dynamicity of inter-DC network latency leads to high variance in the rewards, which can significantly impact the performance and effectiveness of traditional MAB algorithms. To address the above challenges, we carefully adapt the Thompson Sampling algorithm [20] to our MAB problem. Thompson Sampling is a probabilistic algorithm that can effectively handle uncertainty and high variance in the rewards of arms. To overcome the challenge of late feedback of reward, we proposed a DNN-based online regression model to quickly and accurately predict the end-to-end latency of a selected path to feedback the reward in a timely manner. This ensures that the selection probability of each arm can be updated promptly and accurately.
Low-latency jitter management. Network jitter determines the degree of disorder of the packets. The purpose of jitter management is to absorb the impact of jitter as much as possible, under a low latency. As mentioned above, existing buffer-based jitter management is essentially doing in-order processing and thus can cause unnecessary delay of packets in the buffer. In this paper, we propose watermark-based jitter management [18] at users’ end. Watermarks are quantitative markers associated with a stream, indicating that no events in the stream will have a timestamp preceding that of the watermark. Thus, we can use watermarks to safely determine when to emit packets and keep track of the progress of packet handling. No extra latency will be introduced due to stragglers.
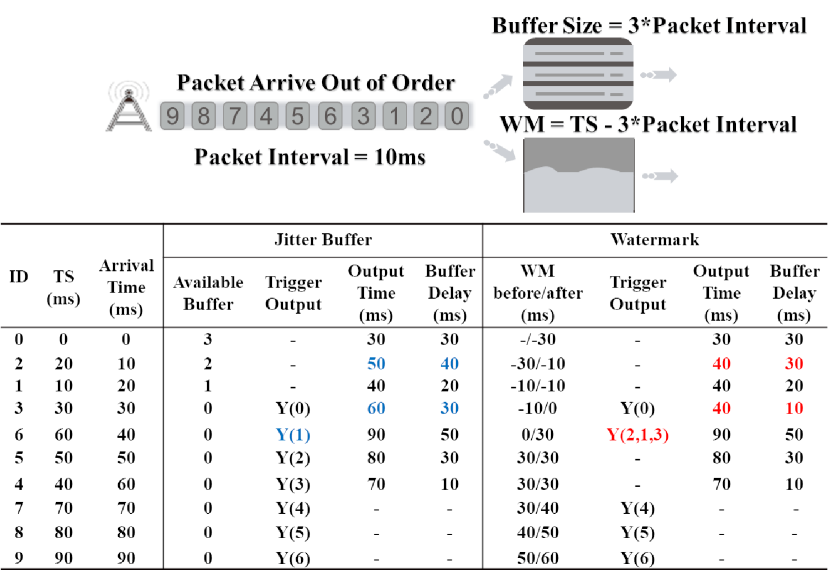
Figure 6 gives an example to show the differences between the buffer-based and watermark-based jitter management. Consider ten packets arriving at the receiver’s side out-of-order. TS means the generated timestamp of a packet and arrival time indicates when the packet arrives at the receiver. When using jitter buffer to handle out-of-order packets, we start to output packets after the buffer gets full. For example, packet 0 is out at timestamp 30ms when the fourth packet (ID=3) arrives. Packet 2 is the second arrived packet, but since it has to wait for packet 1 to emit first to keep the right order, it waits for 10ms extra in the buffer and emits at timestamp 50ms. Thus, packet 1 can be considered as a straggler to packet 2. On the contrary, if we use watermarks, packet 2 can be immediately output at timestamp 40ms. This is because, when packet 6 arrives at timestamp 40ms, the watermark is updated to 30ms, meaning that no packets will arrive in the future with a TS30ms. Thus, we are safe to output all preceding packets with TSms, namely packet 2, 1 and 3. Packet 2 is no longer blocked by the straggler packet 1. The buffer delay, namely the duration that a packet stays in the buffer, shows that watermarks-based jitter manager is more efficient than jitter buffer. In the following, we introduce how watermarks are maintained and updated for video streams (Section V).
IV VCRoute Scheduler
VCRoute provides a centralized routing scheduler for each packet in the video streams, so that the end-to-end latency of the packets can be minimized. To achieve this goal, VCRoute needs to answer the following questions:
-
•
First, as VCRoute is designed to be centralized, how can we mitigate the system overhead introduced by transmitting scheduling decisions to users and endpoints? (Section IV-A)
-
•
Second, given the high latency and dynamicity of inter-DC network performance, how can VCRoute find a good path for each packet in a timely manner? (Section IV-B)
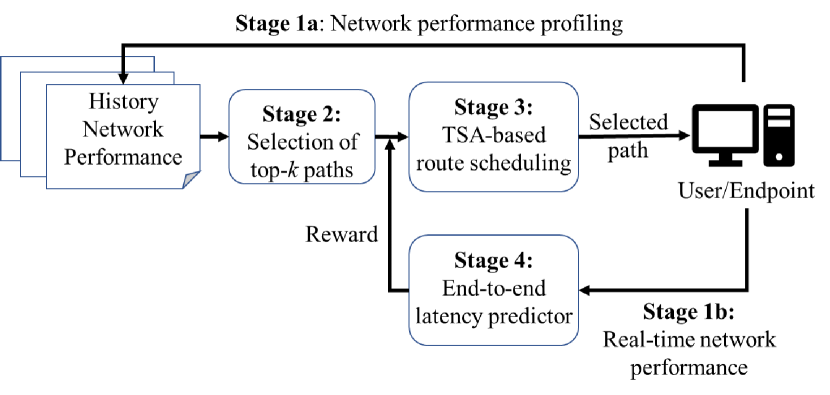
We have carefully designed VCRoute to solve the above questions. Figure 7 gives an overview of VCRoute.
IV-A Reducing overhead
Many existing routing algorithms such as Via make one routing plan for an entire call at offline time. Thus, the scheduling overhead is not a major concern. However, this is not good enough for our problem due to the highly dynamic and heterogeneous network performance in geo-distributed video conferencing. For example, in Figure 4, the Direct method which uses a fixed routing plan for an entire stream leads to high packet transmitting time. On the other hand, making different routing plans for each individual packet leads to high scheduling overhead. We address the overhead issue from two aspects.
First, for each communicating endpoint, user pair, we set a default routing plan. All packets in the stream are scheduled according to the default plan. VCRoute updates the default routing plan according to real-time network performance. Thus, we only need to transmit the routing decisions when they are updated. As a result, we are able to greatly reduce the overhead of the centralized scheduler. For example, in Figure 4, VCRoute transmits only 447 times of routing plans for 30,000 packets, resulting in a 1.5% extra overhead compared to a decentralized design. Further, we found that among the 447 times of routing plan updates, only 4 paths out of 17 were selected. This motivates our second optimization of selecting the top-k low-latency paths from all relay paths to reduce the solution space (Stage 2 of Figure 7). The top-k paths are obtained based on the analysis of long-term network performance history. Similar to Via [5], the k value is dynamically decided based on confidence bounds for each relay on a specific endpoint, user pair (refer to [5] for more details). By using these confidence bounds to dynamically decide the top-k relaying options, it ensures that any relay option not included in the top-k is worse than any that is with a high degree of confidence. Given the pruned set of relay paths, VCRoute selects the path that results in the best end-to-end latency at runtime, with a much lower overhead.
IV-B Making good routing decisions
Given the top-k paths, we design an online routing method to dynamically select the best path for each packet (Stage 3 of Figure 7). As mentioned previously, selecting the best path from the k options can be defined as a classic MAB problem. Each path can be considered as an arm of the bandit, and the end-to-end latency of the path is used as the reward of the arm. The MAB problem has been extensively studied. However, the high-variance and dynamically changing reward distributions of the bandits make it hard if not impossible for traditional MAB algorithms such as UCB1 [21, 5] to converge.
IV-B1 Thompson Sampling algorithm
In this paper, we carefully adapt the Thompson Sampling algorithm (TSA) [20] to solve our MAB problem. TSA uses a Bayesian framework to model the uncertainty in reward distributions of arms. It starts from a guess that the rewards follow a prior distribution. When getting more evidence (real rewards), the TSA iteratively updates the hyperparameters of the prior and use them to maintain a posterior distribution following the same parametric form as the prior distribution. In our problem, we assume that the likelihood of the reward of each arm (i.e., end-to-end latency of each path) follows a Normal distribution with known variance. The variance can be calculated using historical calls collected offline. Then, according to Bayesian probability theory, the prior and posterior probability distributions both follow the Normal distribution with hyperparameters mean and variance . We use the observed rewards to update the hyperparameters for the posterior distribution.
Below we introduce how the hyperparameters are updated. For simplicity, we use precision () instead of the variance to update the posterior distribution. According to Bayesian probability theory, we have:
| (1) |
| (2) |
where is the precision of calculated using historical end-to-end latency traces, is the number of times the arm has been tested and is the end-to-end latency received at the -th test of the arm.
At each time step, TSA samples reward from the posterior predictive normal distribution of each arm and select the arm with the highest returned value. As a start, we initialize and in order to explore every arm at the first stage of the process. TSA transparently combines both exploration and exploitation. Once an arm is tested and a reward is obtained, the belief in the likelihood of the reward of that arm is modified. By employing sampling strategies based on posterior probabilities associated with the optimality of different actions, the algorithm ensures continued exploration of all actions that hold plausible optimality potential while reducing sampling emphasis on actions deemed less likely to be optimal. Throughout the iterative process, the algorithm effectively explores promising actions and incrementally dismisses those believed to have lower performance capabilities.
IV-B2 End-to-end latency prediction
The reward is crucial to the effectiveness of our TSA-based routing algorithm. We proposed a DNN-based online regression model to quickly and accurately predict the end-to-end latency of each selected path to feedback the reward in a timely manner (Stage 4 of Figure 7).
Recall that the end-to-end latency of a packet is composed of two parts, namely the packet transmitting latency and packet reordering latency. Theoretically, the first part is correlated to network latency and the second part is correlated to network jitter. Thus, we build a DNN-based prediction model for end-to-end latency with respect to network latency and jitter. Prior to selecting DNN as our prediction model, we conducted an empirical investigation involving alternative algorithms, such as LSTM [22] and Linear Regression [23]. However, these models are not suitable for our specific problem. Notably, we observed that the end-to-end latency for each packet exhibited relative independence. The impact of transmitting latency and jitter on end-to-end latency was found to be non-linear, with the influence being contingent upon the packet processing at the user’s end (e.g., watermark or jitter buffer). As a result, the LSTM and Linear Regression models failed to yield superior outcomes compared to DNN.
We build a five-layer fully connected DNN model. The input layer is used to encode the input feature. The input feature is a two-dimensional vector , where and represent the transmitting latency and jitter experienced by a packet, respectively. The output of the model is the predicted end-to-end latency of the given packet. We use three hidden layers to improve the robustness of the prediction model. Each hidden layer has 64 neurons and uses as its activation function.
-
•
Model training. Denote the training dataset as , where includes a set of for different (source, destination) pairs and includes the returned end-to-end latency of packets. We collect the data from multiple meeting sessions at different periods of time with different sources and destinations. The values are measured using the round-trip-time of Ping while the is calculated and returned by the receiver using Algorithm 2. The total size of the dataset is 356,186 and we use 80% of the dataset for training and 20% for testing.
-
•
Model inference. Given a packet, we use the trained DNN model to predict the expected end-to-end latency of the packet. We use the real-time network latency fed back by the destination as the input to the prediction model. For the data, we use the jitter calculated from the transmit latency of packets sent from the source in the past.
To verify the accuracy of our prediction model, we report the root mean squared error (RMSE) and R-squared (R2) values obtained using the test dataset. The lower the RMSE, the better a model fits the dataset. The R2 value ranges from 0 to 1 and the higher the R2, the better the model. The actual end-to-end latency in the test dataset ranges from 84.1ms to 1640ms, with a mean value of 603ms and standard deviation of 358. As a result, the RMSE value of the test dataset is 43.6 and the R2 value is 0.985, both of which indicate that our DNN-based prediction model can accurately predict the end-to-end latency.
V Watermark-based Jitter Manager
The jitter manager sits on packet receivers’ side to ensure ordered emit of packets. To achieve low-latency video streaming, we propose a novel jitter management method named WMJitter using the watermark-based OOP mechanism. We mainly address the following challenges:
-
•
First, no existing studies have considered watermarks for jitter management in video conferencing systems. How can we use watermarks to handle disorder packets with low latency? (Section V-A)
-
•
Second, existing buffer-based jitter management adapt buffer size to trade-off buffering delay and packet loss. How can we achieve the same goal using watermarks? (Section V-B)
V-A Incorporating Watermarks in Jitter Management
We propose the integration of watermarks to provide precise indications of streaming packet progress. Specifically, any newly arriving packet with a timestamp greater than the watermark is deemed timely, while packets arriving later are considered tardy and subsequently discarded. Timely packets are retained in the buffer, awaiting output. Upon updating the watermark, packets in the buffer that possess timestamps lower than the new watermark are sorted and output collectively. Our watermark-based OOP method effectively reduces the reordering time and waiting time compared to the conventional approach of selecting the packet with the smallest timestamp when the buffer reaches its capacity.
Algorithm 1 shows the main process of WMJitter. Specifically, when a packet arrives at the receiver, the jitter manager first estimates the jitter of the packet transmitting lag (Line 6) and updates the watermark accordingly (Line 7). It then determines which packets can safely be sorted and output by comparing the updated watermark and the timestamps of the packets that have not yet been output (Line 8-11). In this way, WMJitter can guarantee ordered delivery of packets.
V-B Balancing Latency with Packet Loss
To dynamically strike a balance between latency and packet loss rate, we propose a novel event-driven watermark generation method (i.e., the function in Algorithm 1) that adapts to the changing network conditions.
The function uses an adaptive watermark generation algorithm to indicate the progress of data streams affected by network jitter. Upon the arrival of a new packet, we calculate an alternative watermark by subtracting the timestamp with a designated lag, subsequently selecting the larger value between the alternative watermark and the current watermark as the updated watermark. Formally, we have:
| (3) |
where (last published watermark) represents the watermark before the update, represents the timestamp of the new packet, and represents the tolerated delay for late data due to network fluctuations. The max operation in the equation ensures that the watermark is non-decreasing, indicating that packets are progressing with time.
: store network jitter for packets in a time window;
: maintain the probability distribution of accumulated jitter in ; : the size of each packet.
The is a key parameter that directly impacts the balance between buffering delay and loss rate. A larger lag leads to increased buffering delay and reduced loss rate, while a smaller lag leads to an opposite scenario. Intuitively, a lag value that closely approximates the real-time jitter of transmitting latency optimizes the balance between buffer delay and loss rate. Thus, it is necessary to accurately evaluate the transmitting latency jitter to enable adaptive and timely watermark adjustment in Equation 3. To ensure precise evaluation of the jitter of transmitting latency, we employ a statistical method as shown in Algorithm 2.
Our approach utilizes a sliding window (typically set at 2 seconds) to retain the most recent arrival packets with their timestamps, enabling the calculation of jitter between the packets within the window. This is because packets with timestamps close to the current data packet are the most important for accurately estimating the network jitter. The algorithm employs two arrays and , where maintains the jitter values of all data packets within a timestamp window and maintains the probability distribution of all accumulated jitter values obtained in history in the form of a histogram. The algorithm first determines if the current packet is out-of-order, and in the event of an in-order packet, it calculates the estimated network jitter as the value corresponding to a certain percentile (e.g., the 95th percentile) of the array and assigns it to (Lines 7-8). Conversely, for out-of-order packets, the estimated network jitter is derived by identifying the value that minimizes a designated cost function (Lines 10-11).
The cost function (Line 10) considers both buffer delay and packet loss rate. The first term of the function indicates the influence of the estimated jitter on the packet’s delay in the buffer: the smaller the estimated network jitter, the lower the buffer delay. The second operator represents the effect of estimated jitter on the cost of packet loss: as the estimated network jitter approaches higher percentiles in the histogram, the probability of packet loss decreases and the expected cost of packet loss decreases. When the jitter value minimizes the cost function, it means that the lowest buffer delay is achieved while ensuring no packet loss.
This method ensures an accurate and real-time jitter assessment, which, in turn, informs the watermark updates to adapt to the dynamic network performance effectively.
VI Evaluation
To evaluate the effectiveness of our design on reducing the end-to-end latency of video conferencing systems, we perform experiments using network performance traces from real geo-distributed environments. Our trace-driven simulator is implemented based on WebRTC [10].
VI-A Experimental Setup
| Provider | Endpoint Location | User Location |
|---|---|---|
| Tencent cloud | Tokyo, Guangzhou, Singapore, Frankfurt, Sao Paulo | Shenzhen, Singapore, Hong Kong |
| Wonder Proxy | Brazil, Australia, Singapore, South Africa, Greece | Argentina, Indonesia, Uganda, United States, Lithuania |
Geo-distributed setting. We perform our experiments based on the network performance traces collected from Tencent cloud [12] and WonderProxy [24], as shown in Table II.
With Tencent cloud, we select five data centers as the geo-distributed environment. One S5.Medium2 instance is launched in each data center as the endpoint/relay point. Three users are setup locally using servers located in Shenzhen, Hong Kong and Singapore (outside of Tencent cloud). To measure the network performance, we send one packet every 10ms between each pair of servers and record the round trip time (RTT). Each measurement lasts for 100 minutes.
WonderProxy provides a global network of 250 servers for businesses to simulate web traffic from different countries and regions. We adopt five servers as endpoints/relays and five servers as users, as shown in the table. The latency between each pair of servers are adopted from the one day measurement using Ping, open-sourced by the provider [24].
Compared approaches. To show the superiority of our methods, we adopt three routing methods and two jitter management approaches for comparison. End-to-end latency is the main evaluation metrics for comparing different approaches.
We evaluate the following routing methods:
-
•
Direct is the baseline routing method that transmits a packet directly from the source to target (DRT for short).
-
•
Via [5] is an online routing algorithm which selects the best overlay path for each meeting session to minimize the data transmitting latency. For fair comparison, we use it to make the best routing decision for each packet. Via is considered as the state-of-the-art comparison.
-
•
VCRoute is the routing method proposed in this paper that minimizes the end-to-end latency for each single packet (VCR for short).
We consider the following jitter management approaches:
-
•
Jitter Buffer represents the standard jitter buffer algorithm used in the NetEQ module of WebRTC [10]. The buffer size is dynamically changed to accommodate the varying jitter conditions (BF for short).
-
•
WMJitter is the watermark-based jitter management method proposed in this paper (WM for short).
Putting it all together, we compare five different system solutions, namely DRT-BF, DRT-WM, VIA-BF, VIA-WM and VCR-WM. VCR-WM stands for the optimized video conferencing system of this paper.
Configurations. For each geo-distributed setting, we simulate five meeting sessions hosted on the five endpoint servers. When one endpoint is selected to host a meeting, the other four endpoints are adopted as relays. As we only consider relay routes with less than two hops, there are 17 possible paths for each endpoint, user pair. For each meeting, 600,000 packets are sent between each endpoint, user pair to simulate a meeting session of 100 minutes long. During the packet handling, some late packets are dropped and cause packet loss. We report the loss rate and the end-to-end latency of successful packets as the evaluation metrics for all compared algorithms.

VI-B Network Characteristics
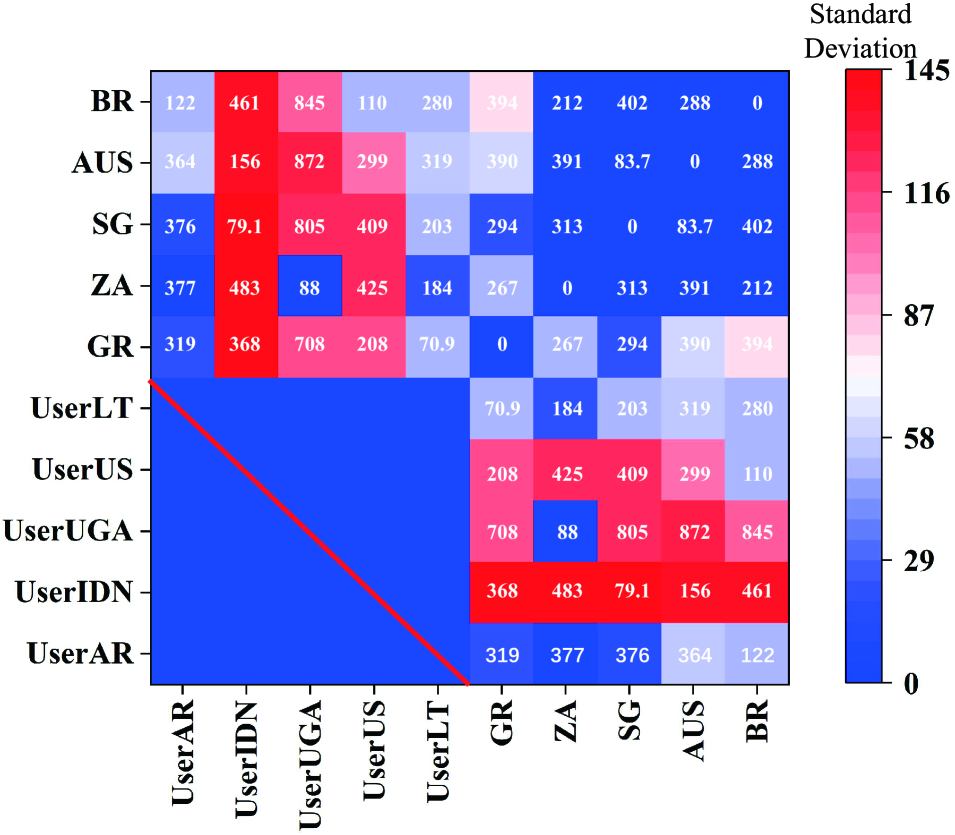
We first study the characteristics of the two geo-distributed environments. As shown in Figure 8, which illustrates the average network performance and variance, the two platforms have very different features. First, the network performance between WonderProxy servers are highly dynamic, probably because there are many users utilizing the proxy services at the same time. In contrary, network performance between Tencent cloud servers and servers to clients are more stable, making the performance of relay routes more predictable. Second, comparing the average network latency between endpoint-endpoint and endpoint-user pairs, we found that there are some routes in Tencent cloud with extremely low latency. For example, the latency between GZ, UserSZ is only 6ms, which is 1/50 of the latency between GZ, UserSG. In contrary, the network latency between different source, destination pairs are less heterogeneous. The highest latency (i.e., 877ms) is around ten times as big as the lowest latency (i.e., 71ms).
Since the two platforms differ a lot on the network features, we believe our trace-driven evaluation results are representative to show the effectiveness of our proposed algorithms.


VI-C Trace-Driven Evaluation Results
VI-C1 End-to-end latency on WonderProxy
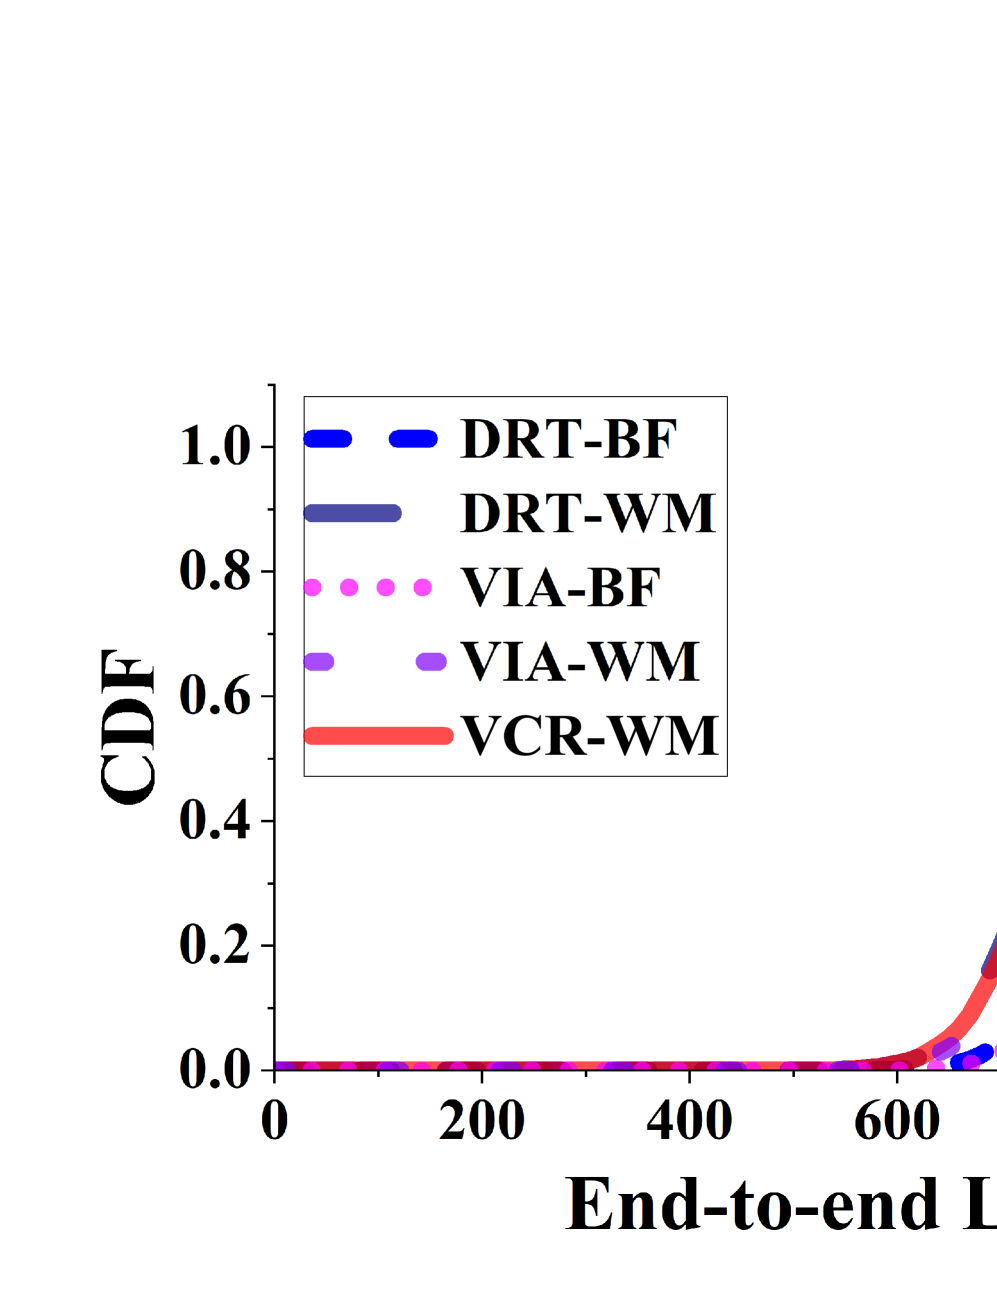
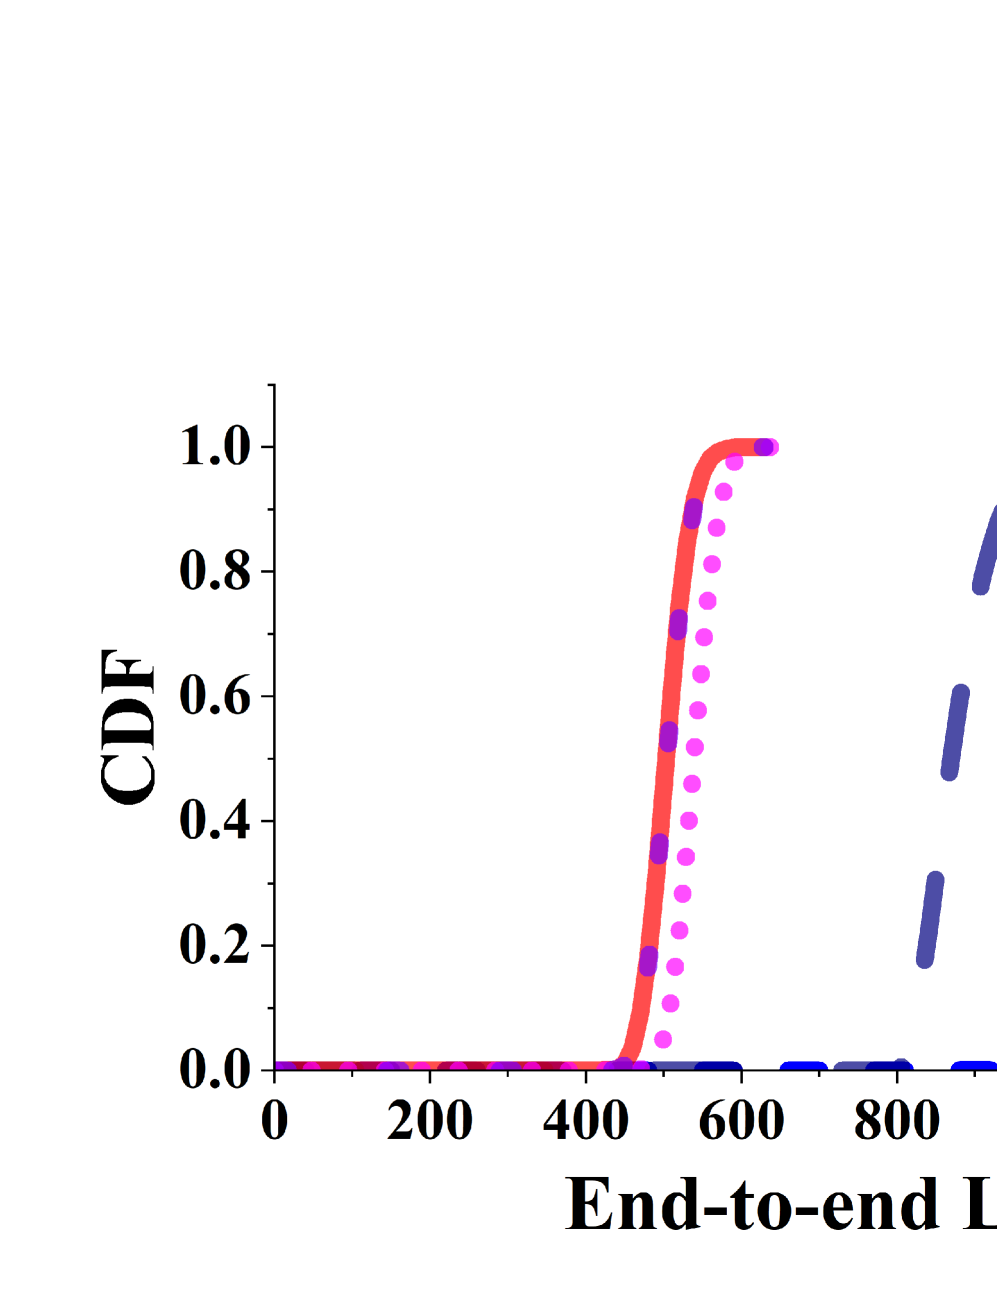
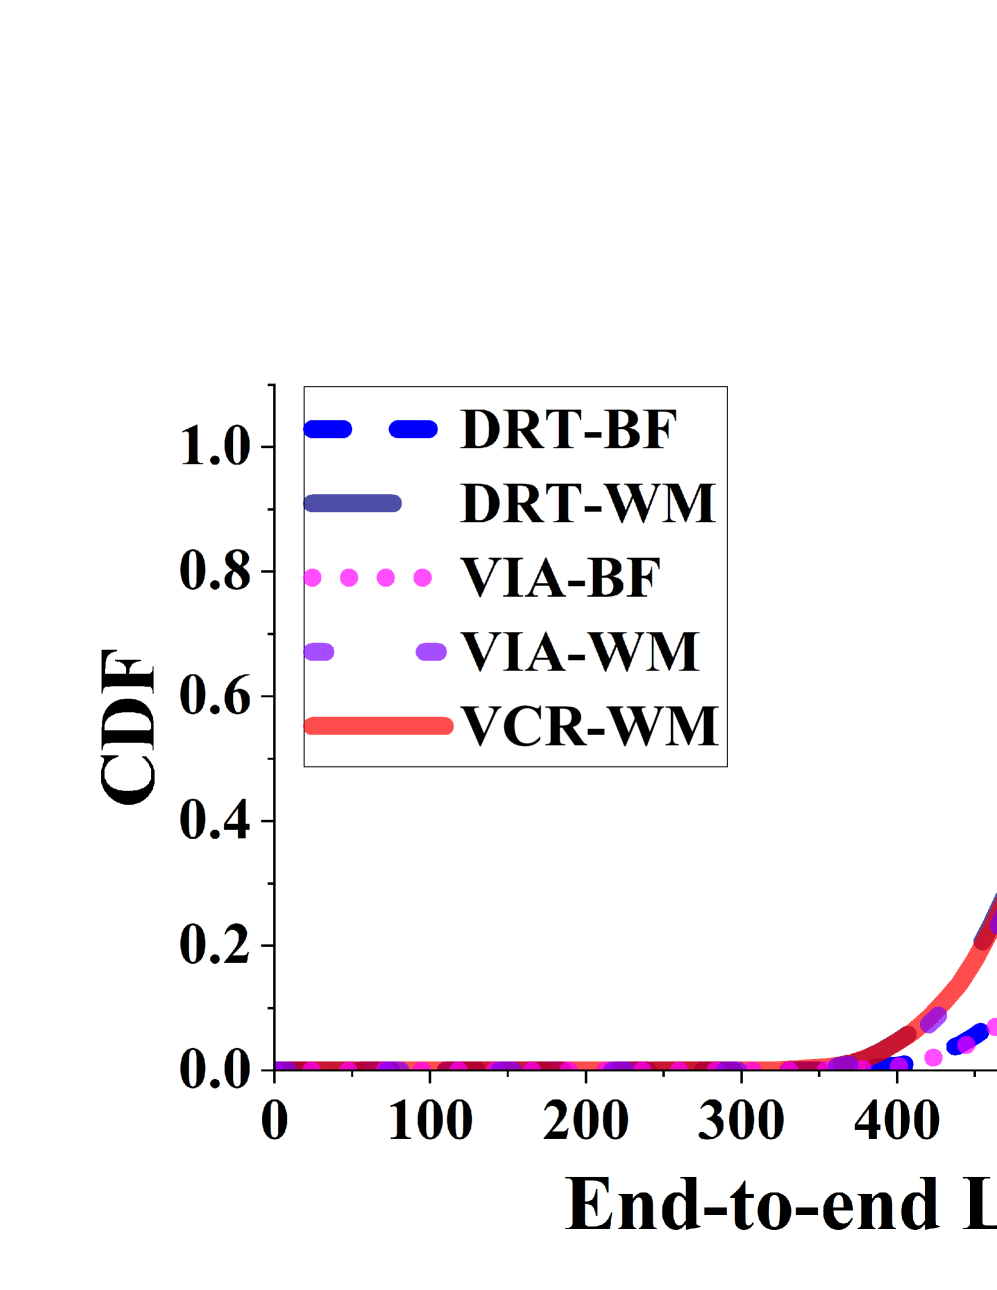
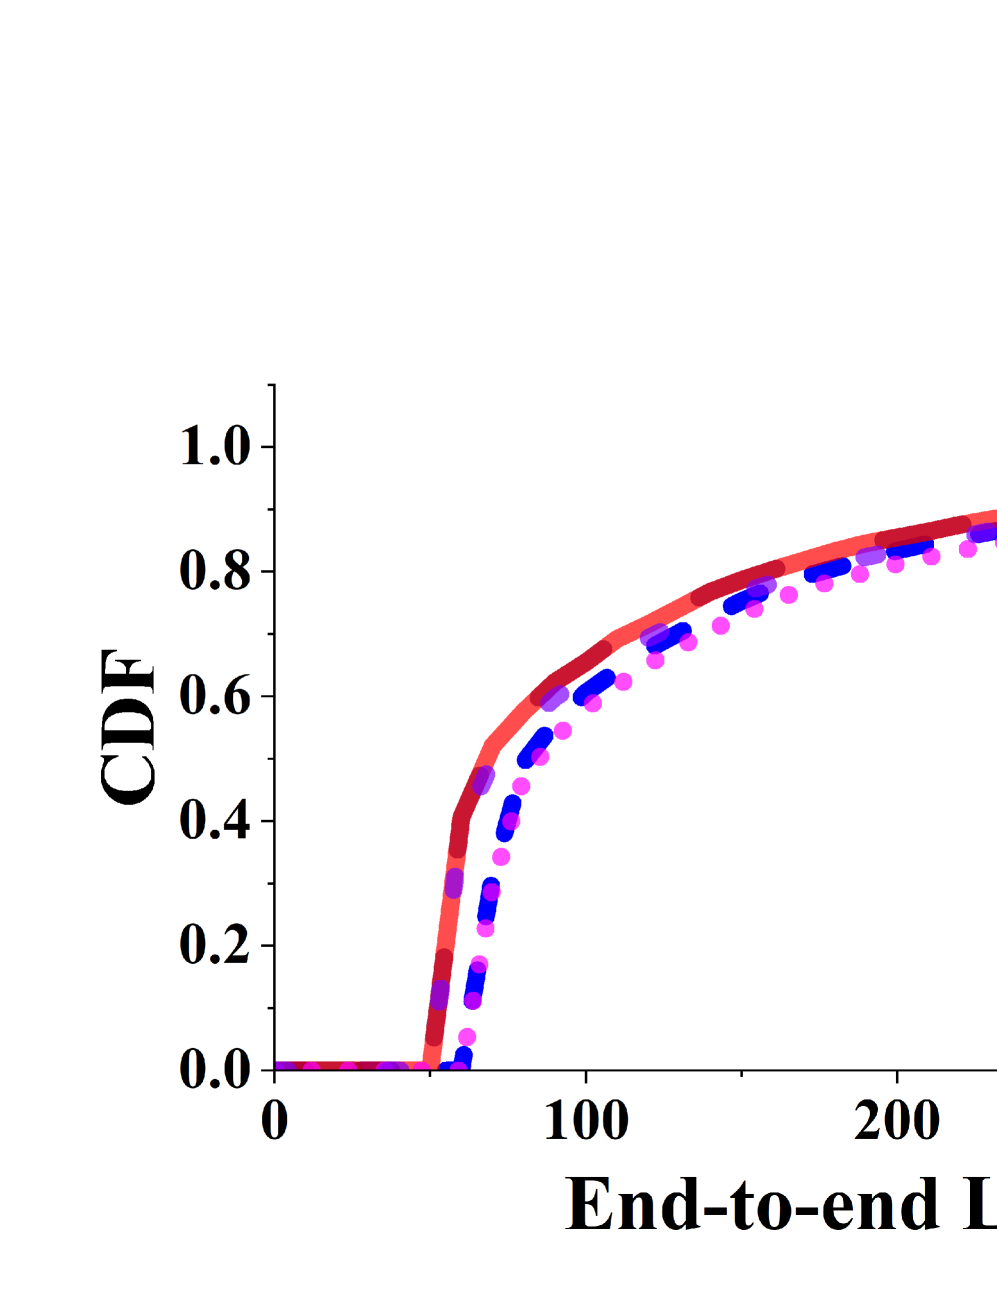
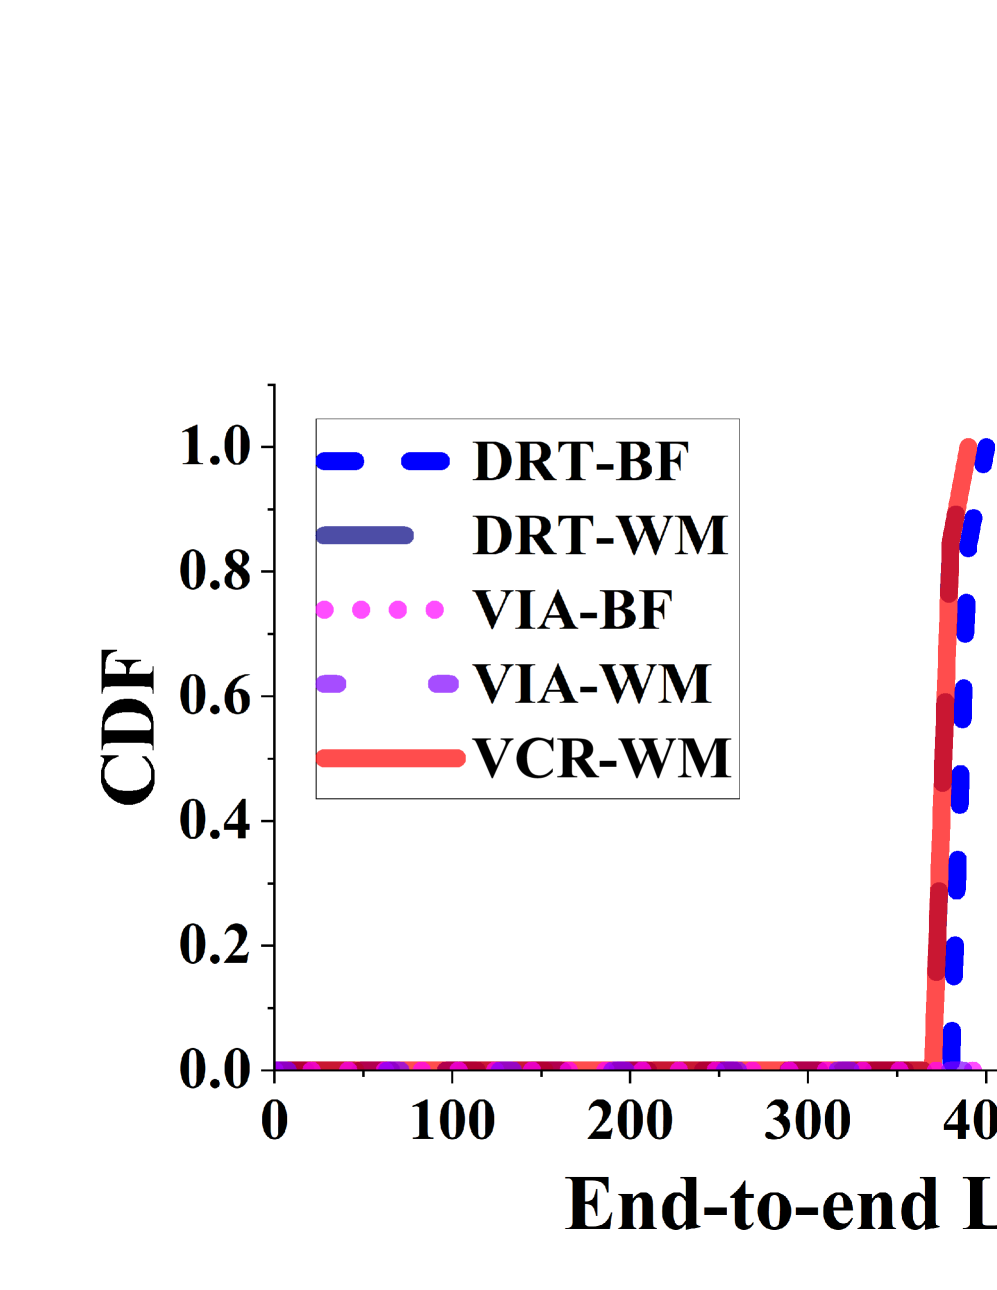
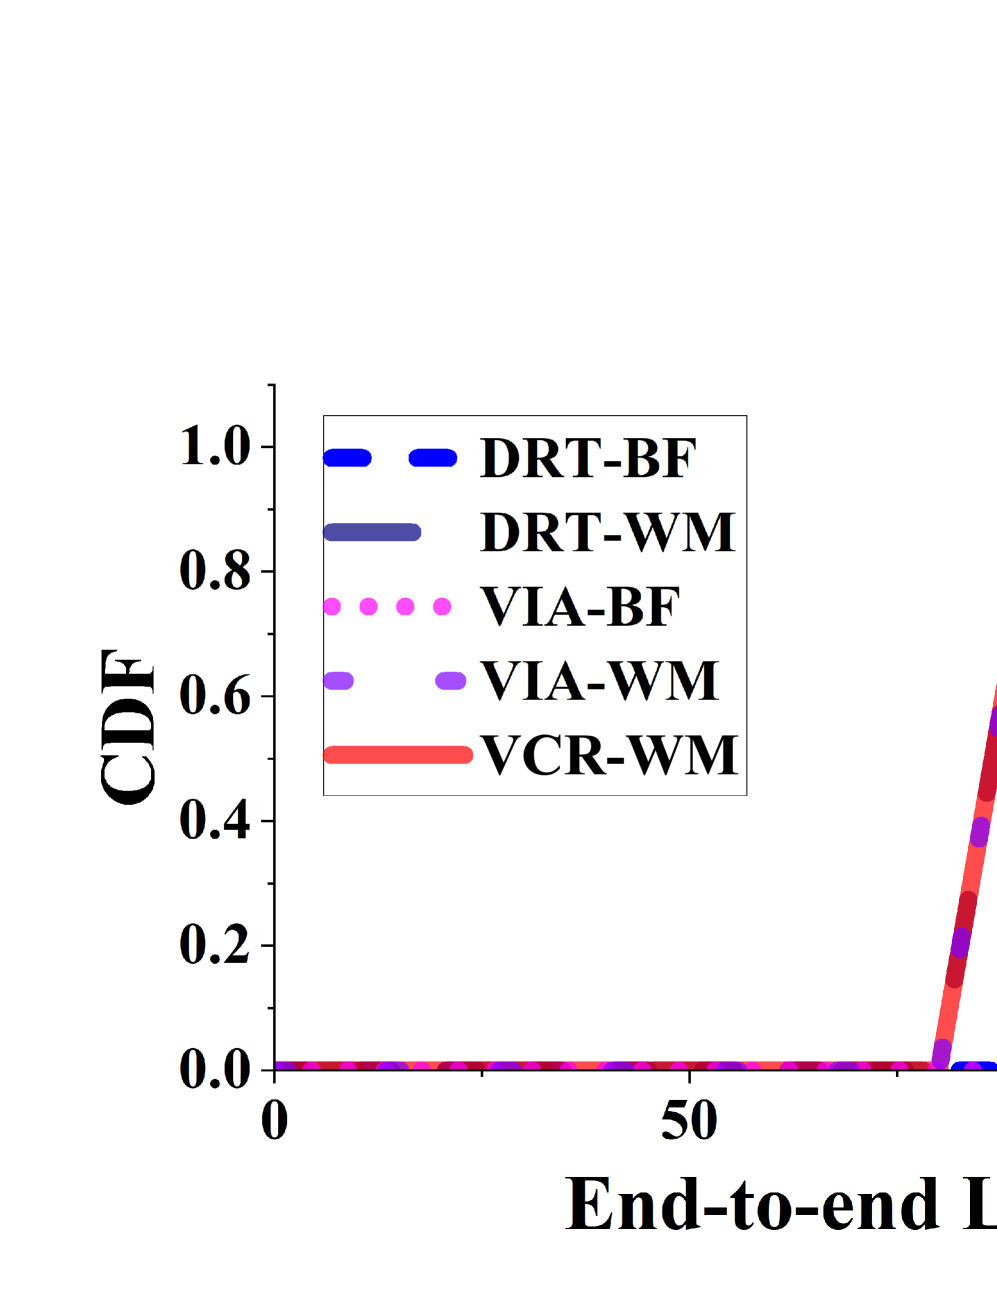
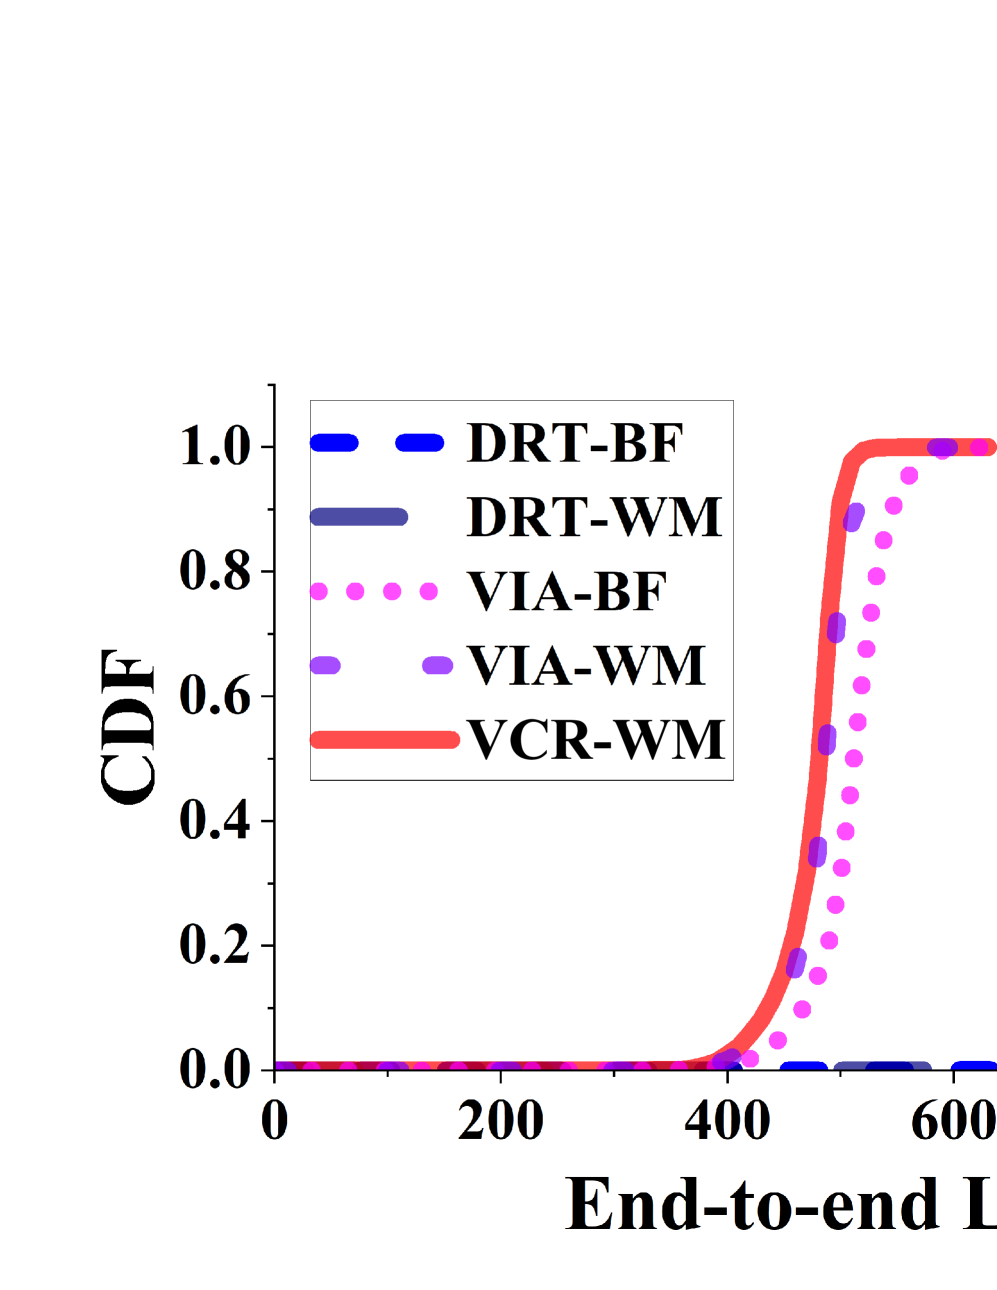
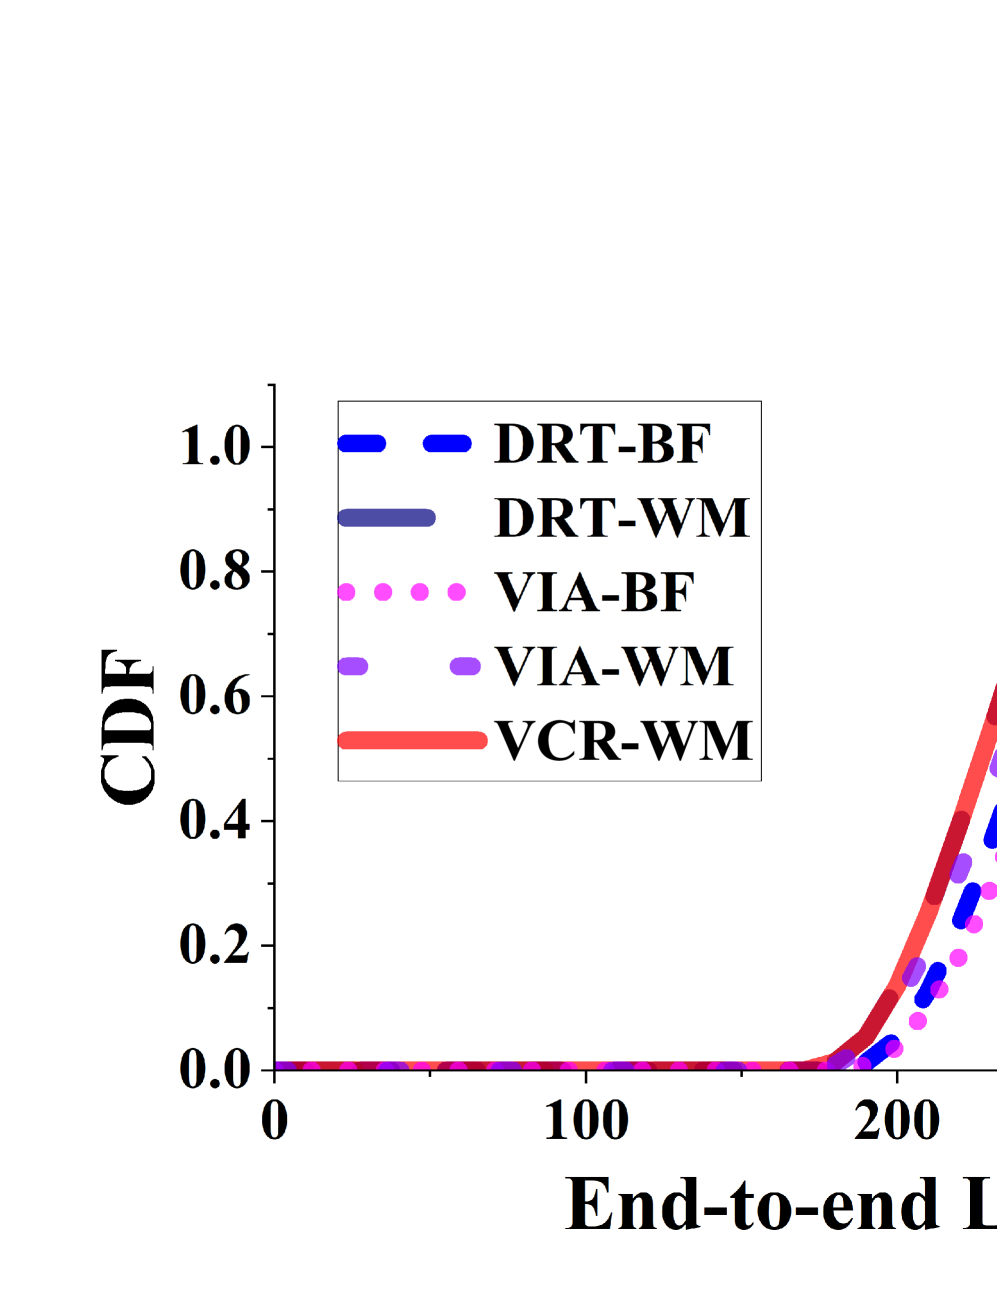
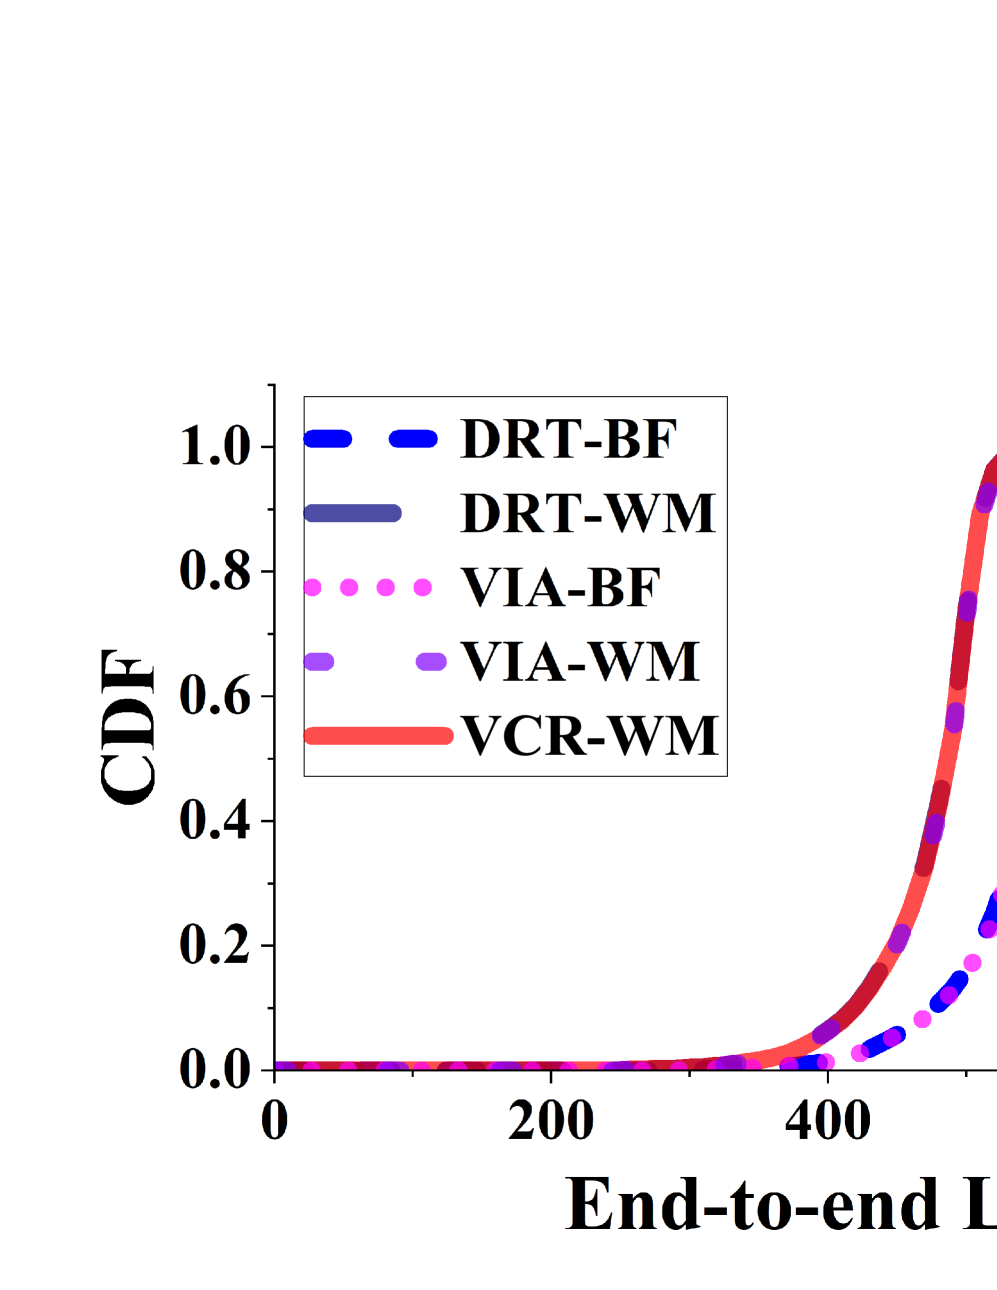
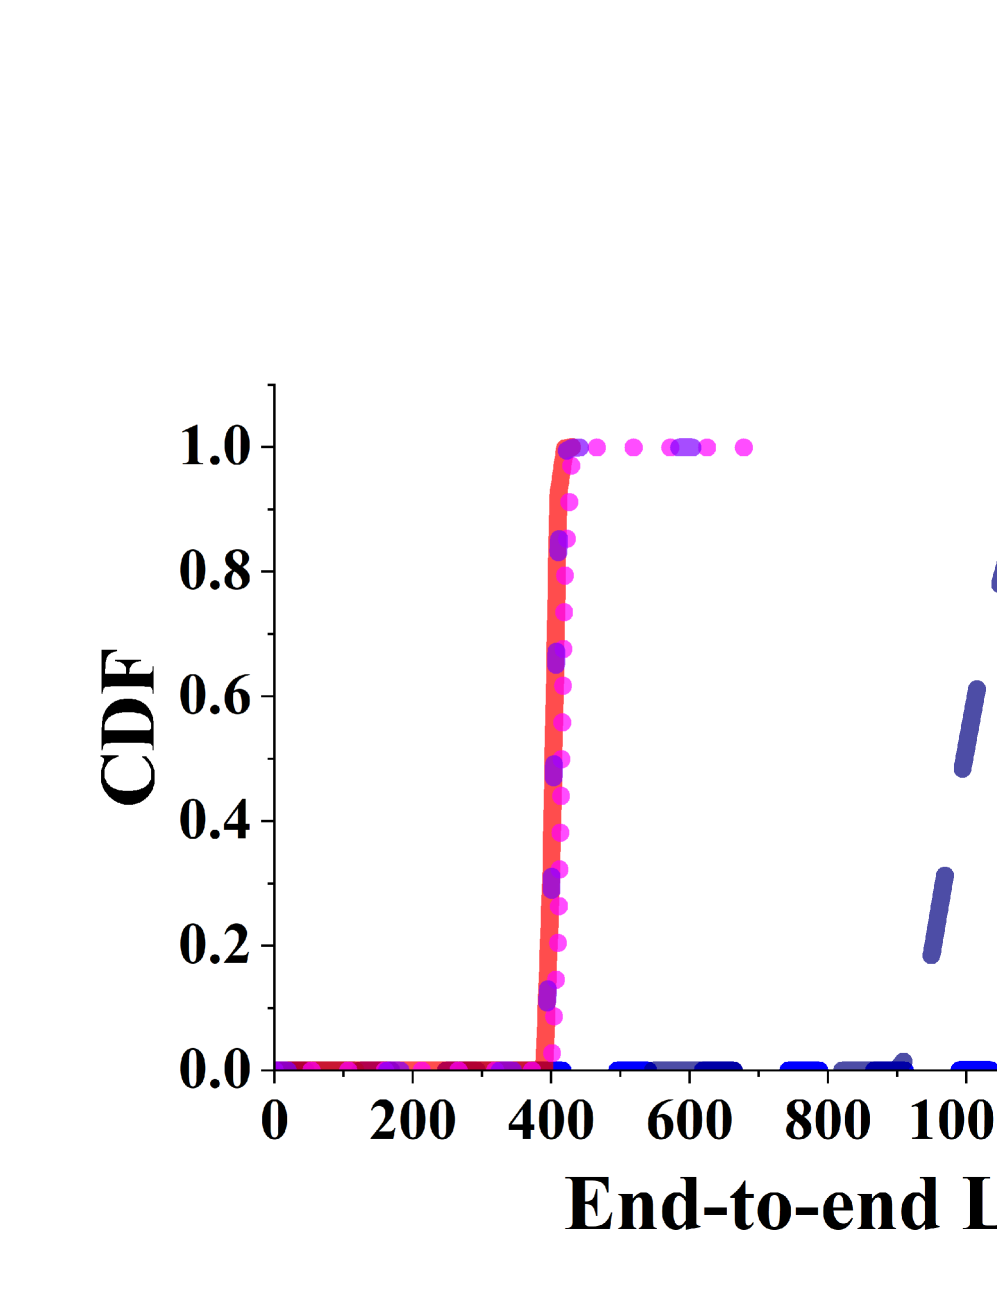
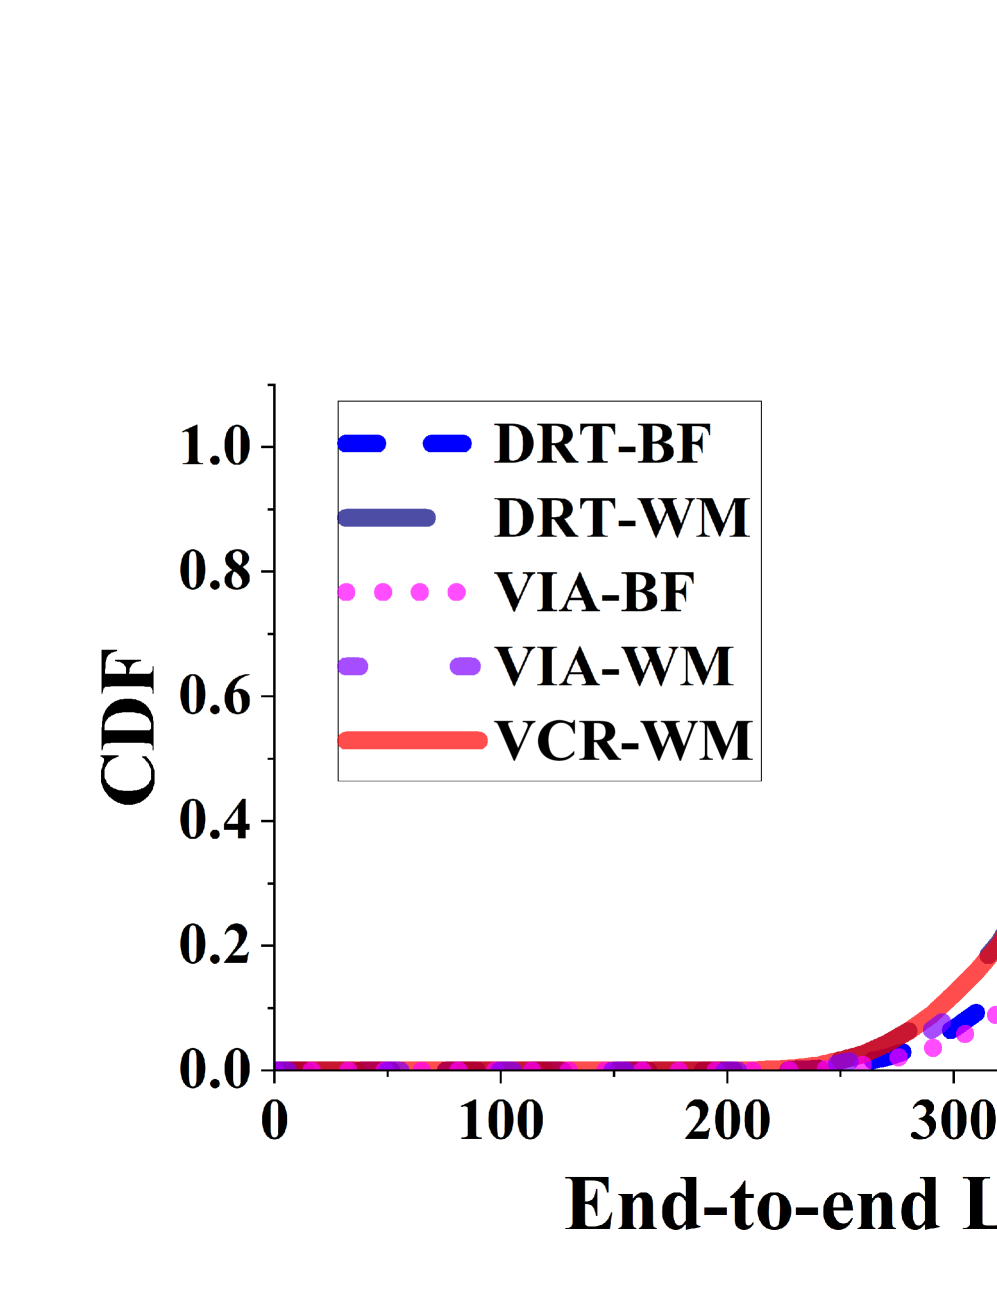
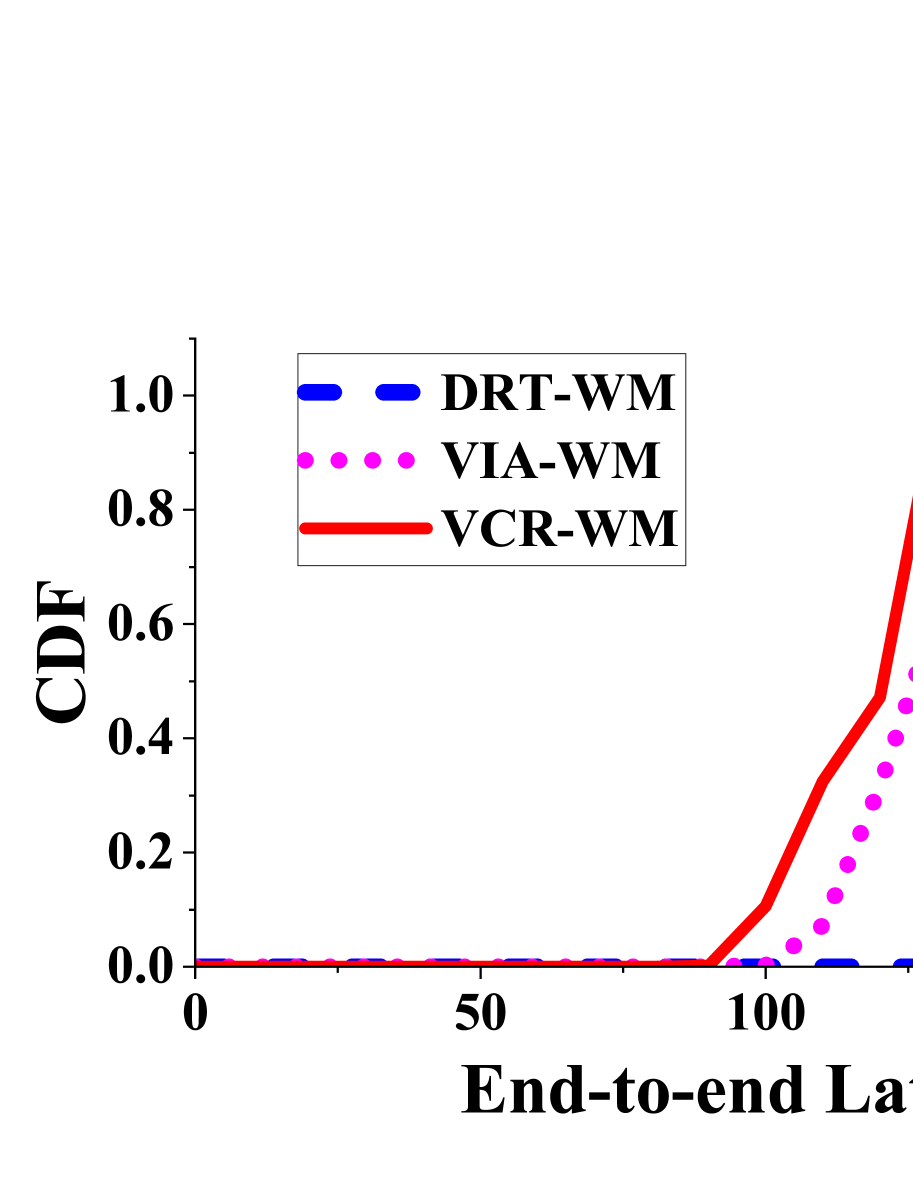
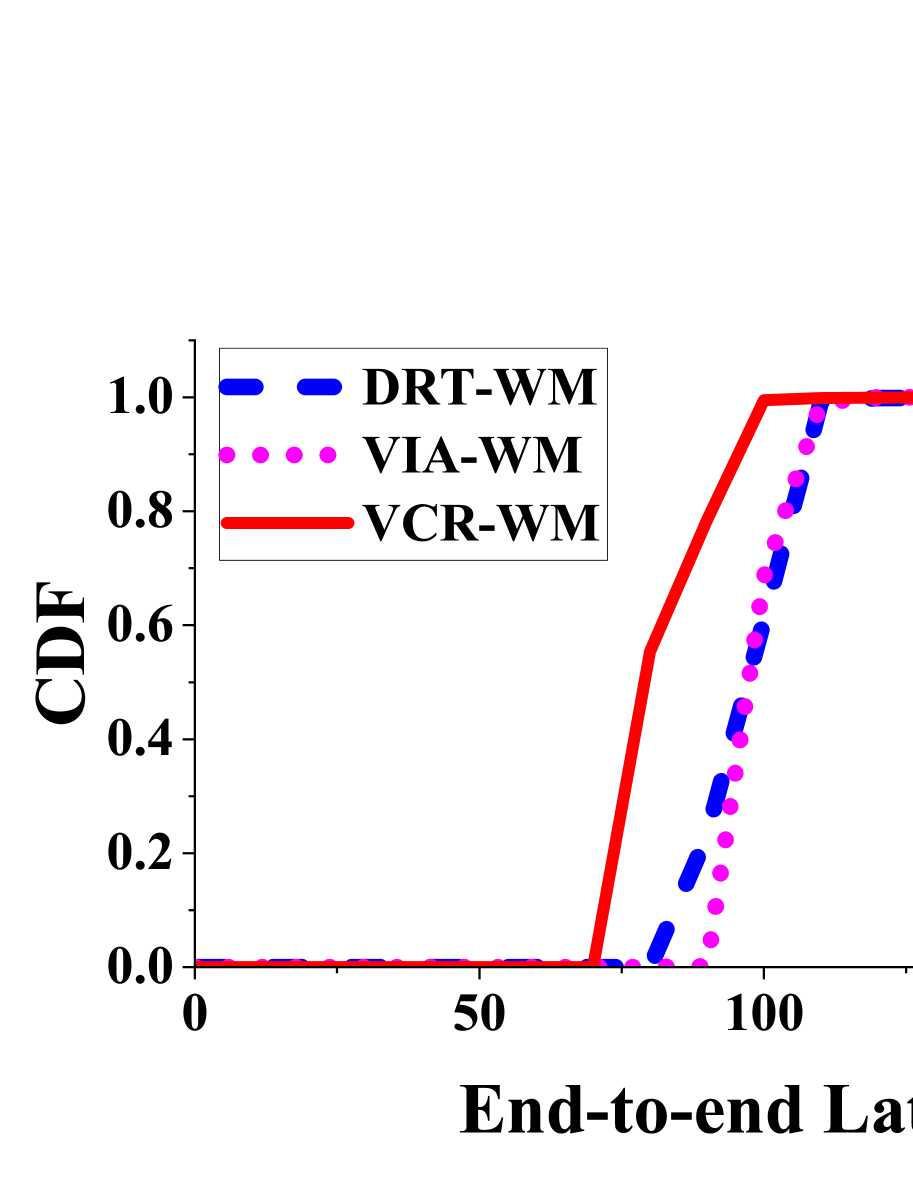
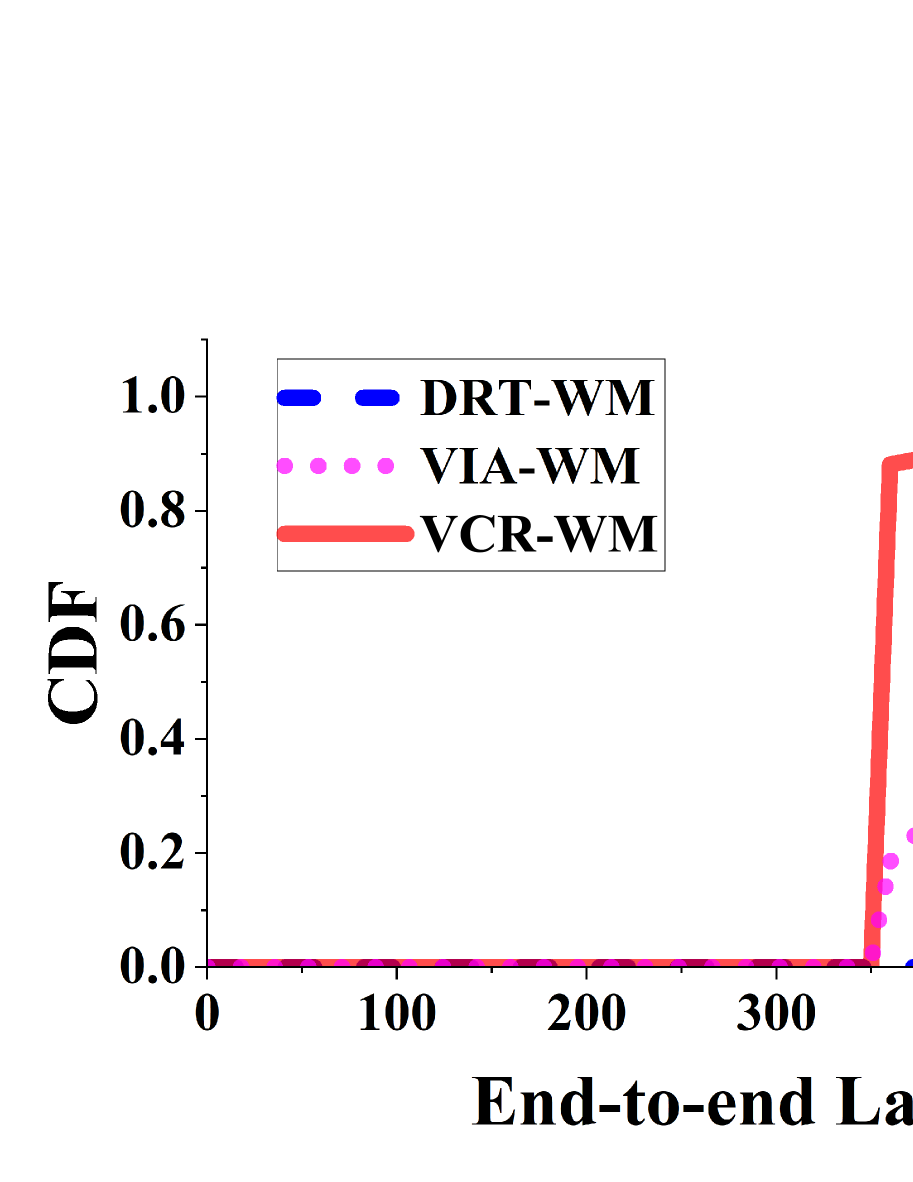
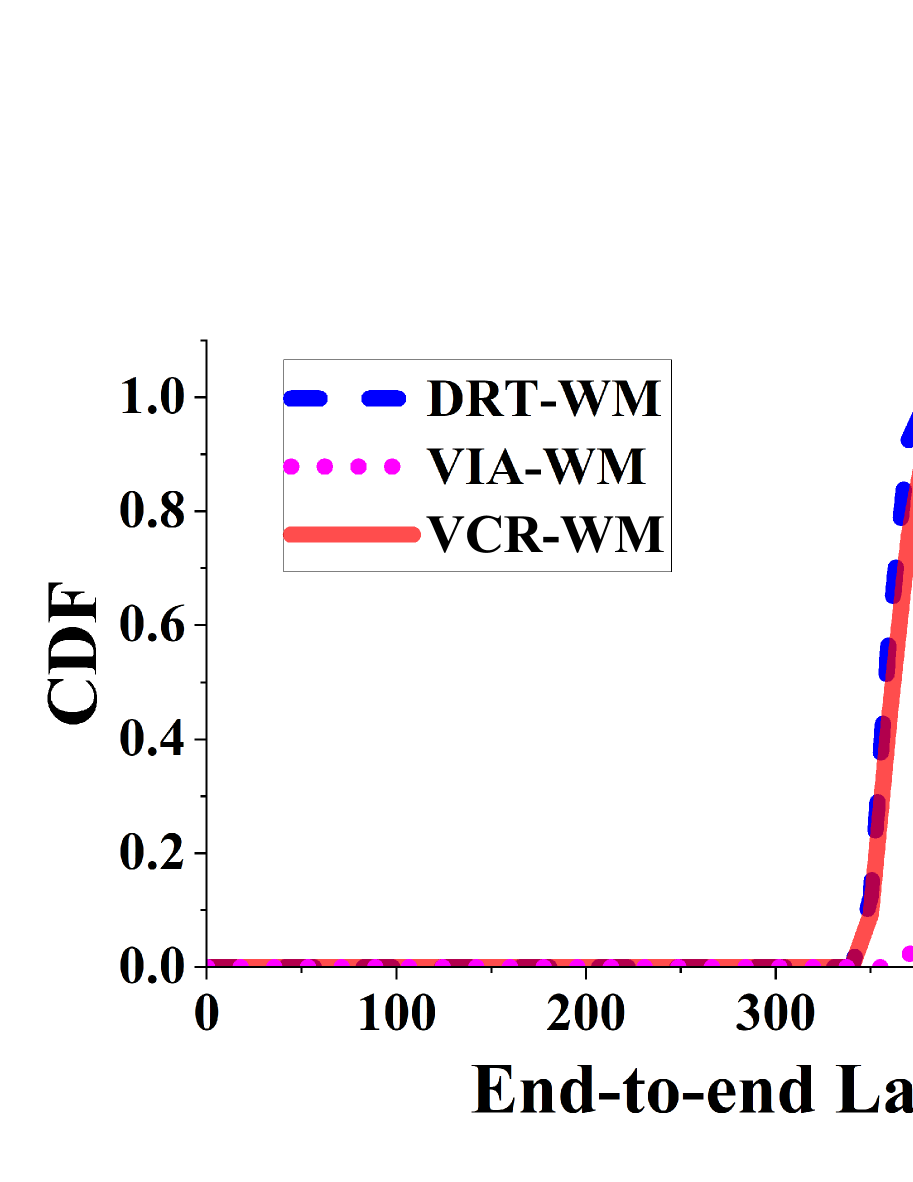
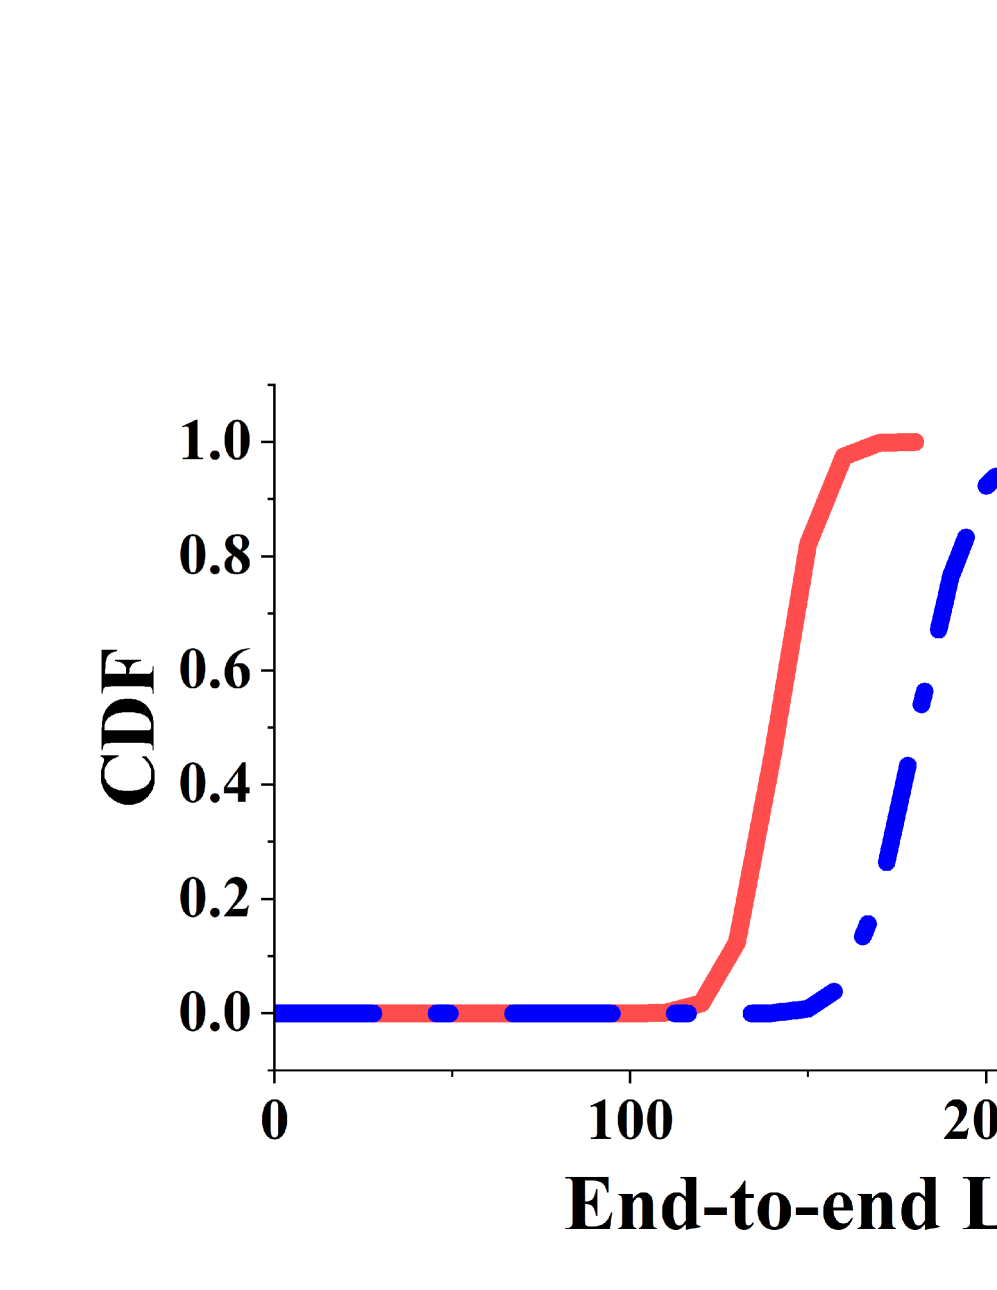
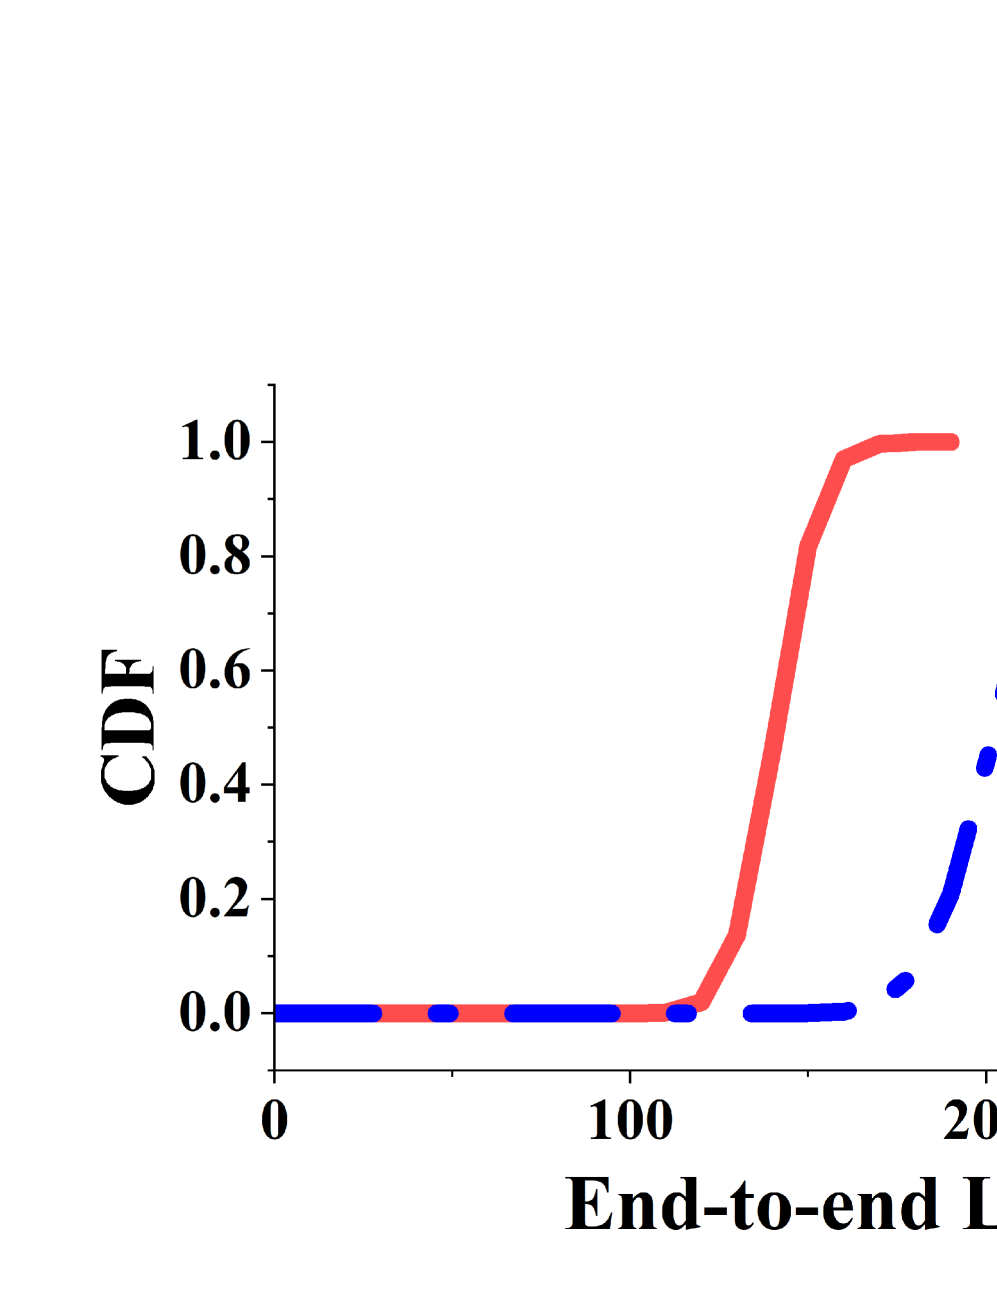
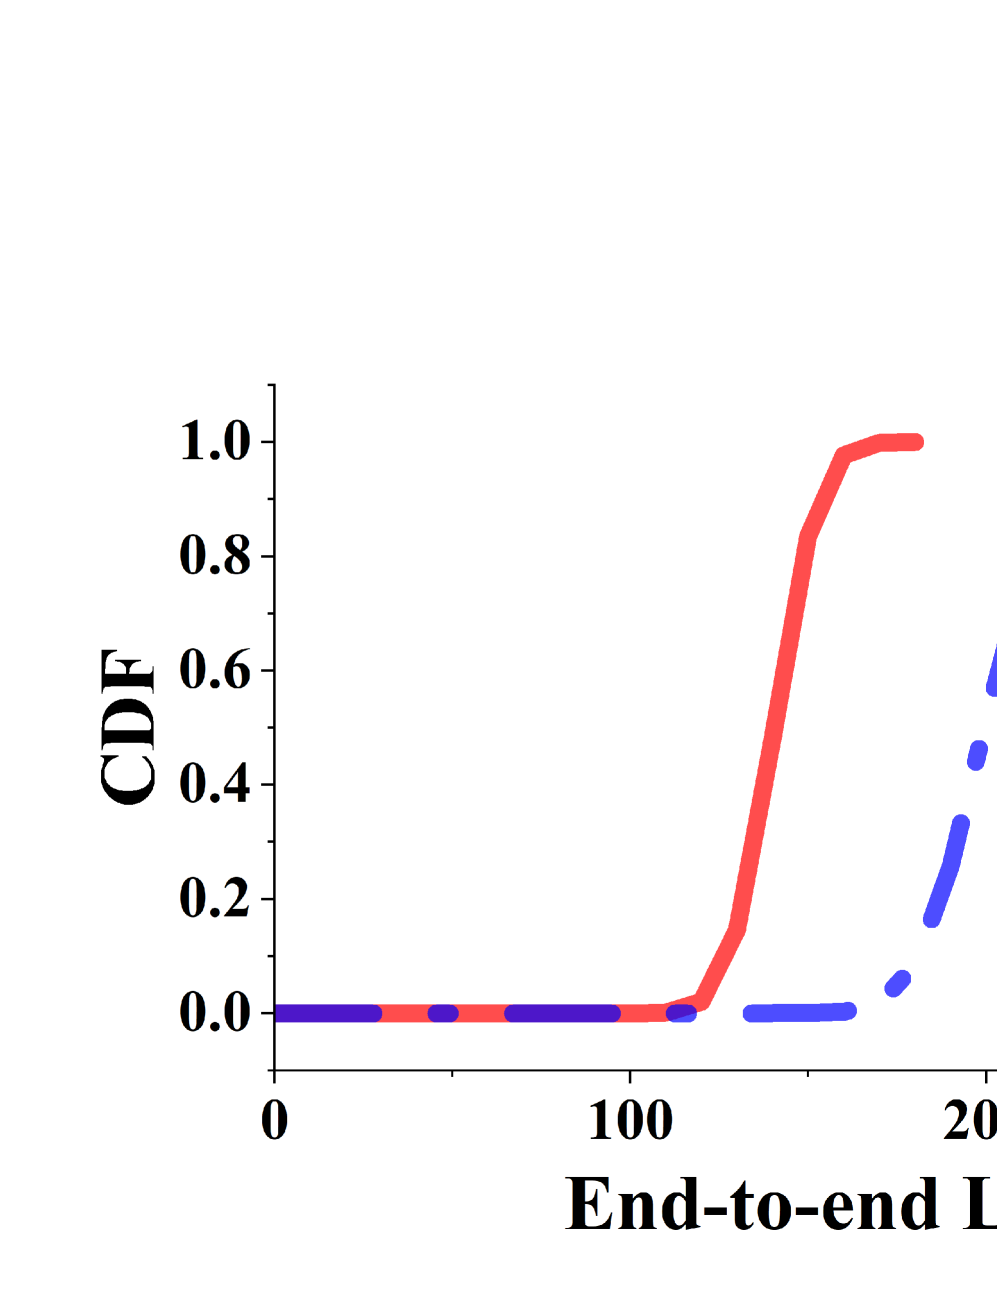
To compare the end-to-end latency results obtained by different methods, we plot the CDFs of streaming lag experienced by clients in Figures 9-10. Results of meeting sessions hosted on the Brazil and Australia endpoints are similar to those shown in the figures, and thus are not plotted. We have the following observations.
First, across all the meeting sessions hosted in different data centers, VCR-WM obtains the best end-to-end latency for all users distributed globally, while DRT-BF obtains the worst results in most cases. Take the results of Greece endpoint as an example. Figures 9(c) shows that, VCR-WM guarantees all packets to arrive within 640ms for users located in Uganda, which is even lower than the shortest end-to-end latency results obtained by DRT-BF. Compared to VIA-BF, VCR-WM reduces the average end-to-end latency by 4%-13%. Comparing different users in the same meeting session, VCR-WM guarantees that 50% of the packets experience a lag less than 375ms, 730ms, 500ms, 502ms and 72ms for clients located in Argentina, Indonesia, Uganda, United States and Lithuania, respectively. That is, users closer to the endpoint are more likely to obtain better video conferencing experiences. For example, Lithuania, which is also in Europe as Greece, is geographically the closest to the endpoint and thus has the lowest average end-to-end latency among all users. What’s more, all compared methods work similarly for Lithuania, since the direct route has much lower transmitting latency compared to the other relay routes. As a result, Direct, Via and VCRoute all select the same direct path. This further increases the stability of packet latency and reduces jitter.
Second, to study the effectiveness of WMJitter, we compare the results of DRT-BF with those of DRT-WM and the results of VIA-BF with those of VIA-WM. As shown in Figure 8(a), the network performance between endpoints and users IDN, UGA and US are much more dynamic than the other two users. As a result, we have observed much higher improvement of the watermark-based jitter management methods compared to the buffer-based method on reducing the end-to-end latency. For example, DRT-WM reduces the end-to-end latency by 8%-12%, 9%-16% and 10%-16% compared to DRT-BF for clients in IDN, UGA and US, respectively, across the three meeting sessions. Similarly, VIA-WM reduces the end-to-end latency by 8%-13%, 2%-9% and 5%-10% compared to VIA-BF for clients in IDN, UGA and US, respectively, across the three meeting sessions. The above results have shown the effectiveness of our watermark-based jitter management.
Finally, comparing VCR-WM with DRT-WM and VIA-WM, different routing methods did not lead to much difference on the end-to-end latency results. This is mainly because that the network performance has low heterogeneity in WonderProxy. Thus, when selecting different routes, the resulted transmitting latency does not differ much. This is especially true when users are UserAR (Argentina) and UserLT (Lithuania), which have relatively lower endpoint-user network performance variances as shown in Figure 8(a). This explains the similar performance of different algorithms in Figures 9-11 when users are AR and LT. VCR-WM performs much better than DRT-WM for the meeting session in Greece when the user is UGA (Uganda), as shown in Figure 9(c). This is because the latency of the direct route between GR, UserUGA is high (708ms) while there is a much lower relay route via ZA server, namely GR, ZA, UserUGA, that can effectively reduce the average transmitting latency to 355ms. This shows that VCRoute is smart enough to find good relay routes. Similar observation can also be found in Figure 11(c).
VI-C2 End-to-end latency on Tencent Cloud
The evaluation results on Tencent cloud has shown some similar observations as those obtained from WonderProxy. Below we will only discuss the differences between Tencent cloud and WonderProxy.
Figure 12 and 13 show the CDFs of end-to-end latency results of users obtained by VCR-WM, DRT-WM and VIA-WM when meetings are hosted on the Tokyo and Sao Paulo servers. We deliberately removed the results of DRT-BF and VIA-BF from the figures since they performed very closely to DRT-WM and VIA-WM due to the low variances of the network performances. Different from the results on WonderProxy, VCR-WM obtains much lower end-to-end latency compared to VIA-WM and DRT-WM. For example, the 50%-percentile latency of VCR-WM is 0%-16% and 6%-18% lower than those of DRT-WM and VIA-WM, respectively. This demonstrates the effectiveness of VCRoute on finding better routes than other state-of-the-art routing schedulers for video conferencing systems.
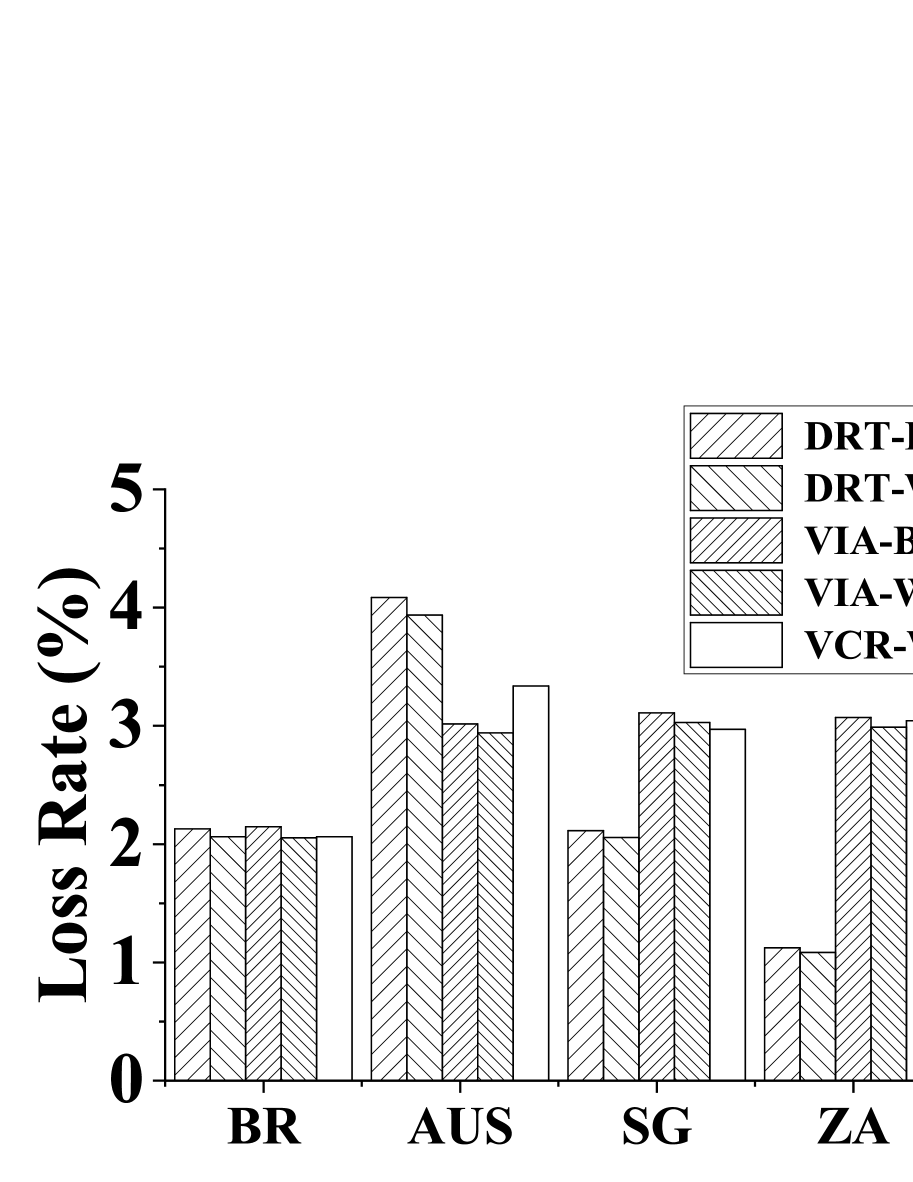
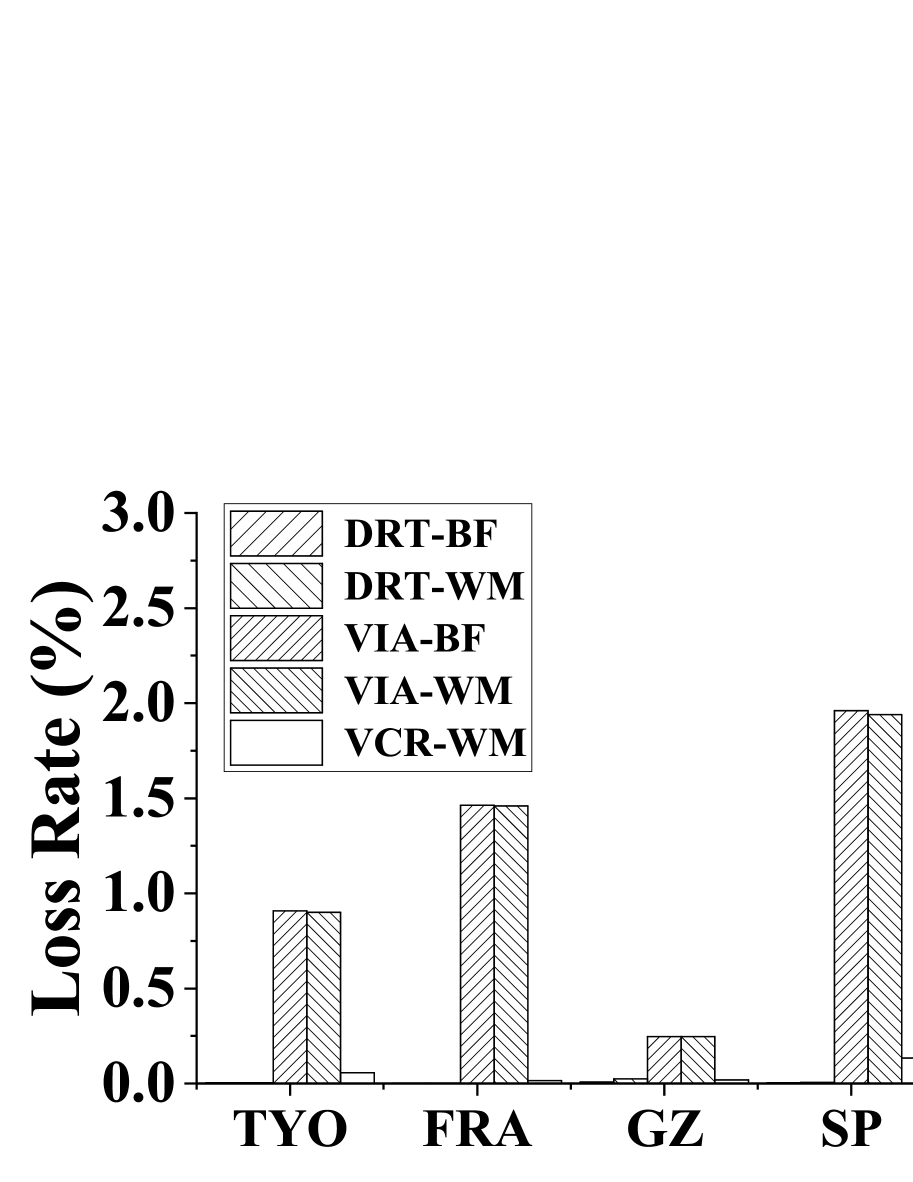
VI-C3 Loss rate results
We further study the loss rate of video streams resulted from different comparisons. Figure 15 shows the loss rate results per meeting session on both WonderProxy and Tencent cloud. As expected, the loss rate on WonderProxy is in general much larger than that on Tencent cloud, due to the much higher network performance variances on WonderProxy. The loss rates of meeting sessions using Direct routing on Tencent cloud are almost zero since there’s no significant jitter on the route. Thus no packet arrives too late to be dropped. In contrary, the loss rate is high even on direct routes on WonderProxy due to the high network performance variances. Further, watermark-based jitter management method can slightly reduce the loss rate compared to buffer-based methods. For example, DRT-WM and VIA-WM reduce the loss rate by 2%-3% and 2%-4% compared to DRT-BF and VIA-BF, respectively, on WonderProxy. The Via routing method (i.e., VIA-BF and VIA-WM) generated much higher loss rates on Tencent cloud than the other methods, due to its tendency to explore which leads to more path changes. For example, there are 34,020 times of path changes with Via for the Tokyo, Shenzhen data stream with 600,000 packets. Although VCRoute also explores during the search for a good route, it deliberately reduces the number of path changes to reduce network jitter. In all cases, VCR-WM yields lower or comparable packet loss rates compared to the other methods, while providing much lower end-to-end latency.
| UserAR | UserIDN | UserUGA | UserUS | UserLT | |
|---|---|---|---|---|---|
| GR | 23(383) | 126(755) | 57(514) | 95(510) | 76(123) |
| ZA | 57(474) | 135(796) | 3(98) | 159(738) | 15(239) |
| SG | 14(426) | 134(481) | 4(412) | 84(661) | 45(362) |
| UserSZ | UserSG | |
|---|---|---|
| TYO | 1(137) | 12(97) |
| SP | 0.5(353) | 10(362) |
VI-C4 Accuracy of end-to-end latency prediction
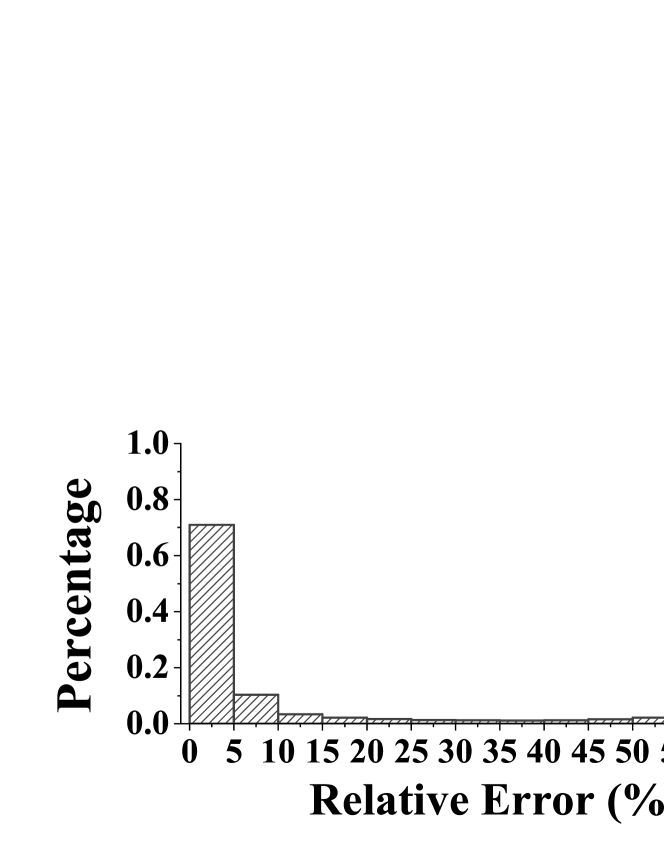
To show how our DNN-based prediction model helps to obtain the low end-to-end latency results on both clouds, we present the RMSE values of predicted latency of packets between different pairs of DCs in Table III and IV. Values in brackets represent the mean values of actual end-to-end latency results. Overall, the prediction error on Tencent is much lower than that on WonderProxy. This is because the network performance is highly dynamic on WonderProxy. When inferring the end-to-end latency using our prediction model, the input data (i.e., transmitting latency and jitter) are the latest measurements from the system and can be largely different from the real network performance experienced by the current packet. Nevertheless, although the average error looks big for highly dynamic paths (e.g., RMSE=135 for ZA,UserIDN), our model generates good prediction in most cases. For example, Figure 14 shows the relative error distribution of end-to-end latency prediction for packets between ZA and UserIDN. Over 80% of the predictions have relative error below 10%.
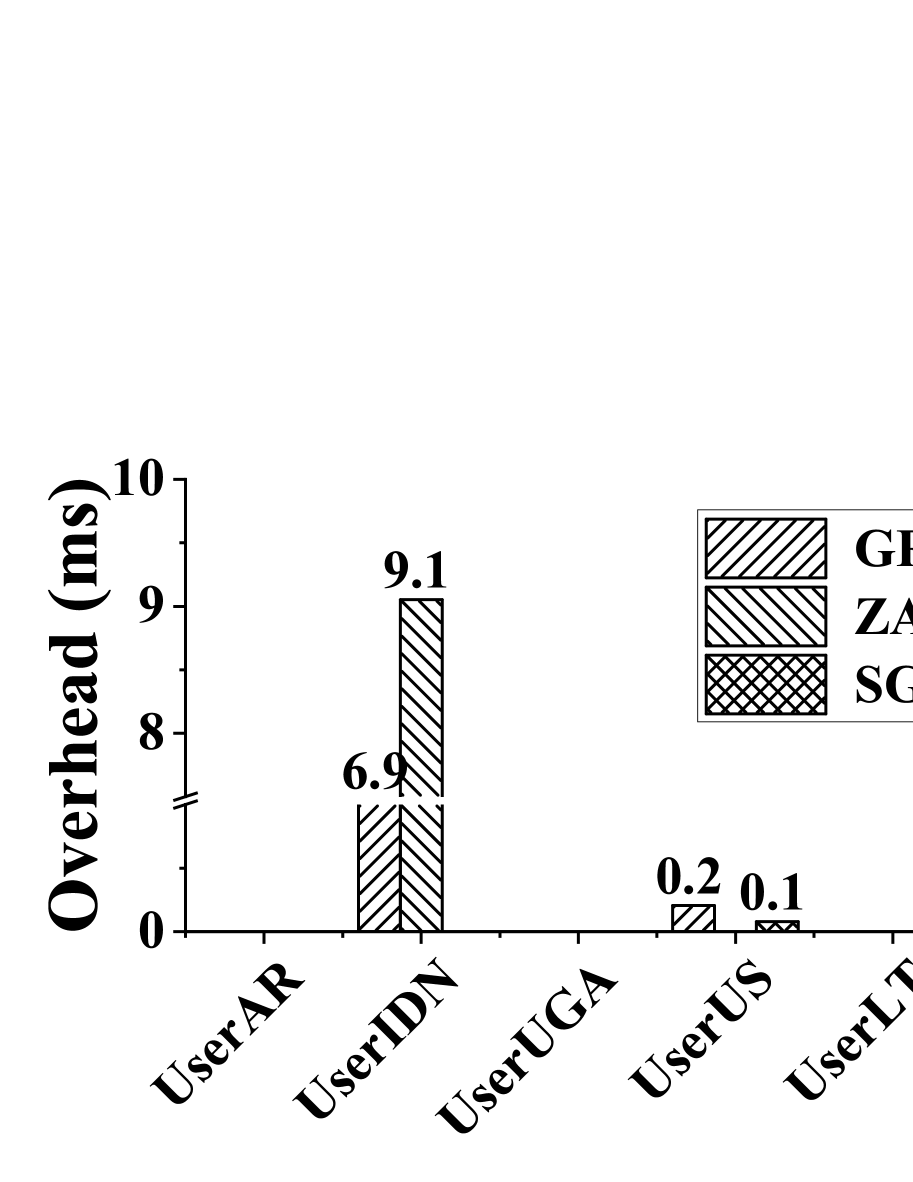
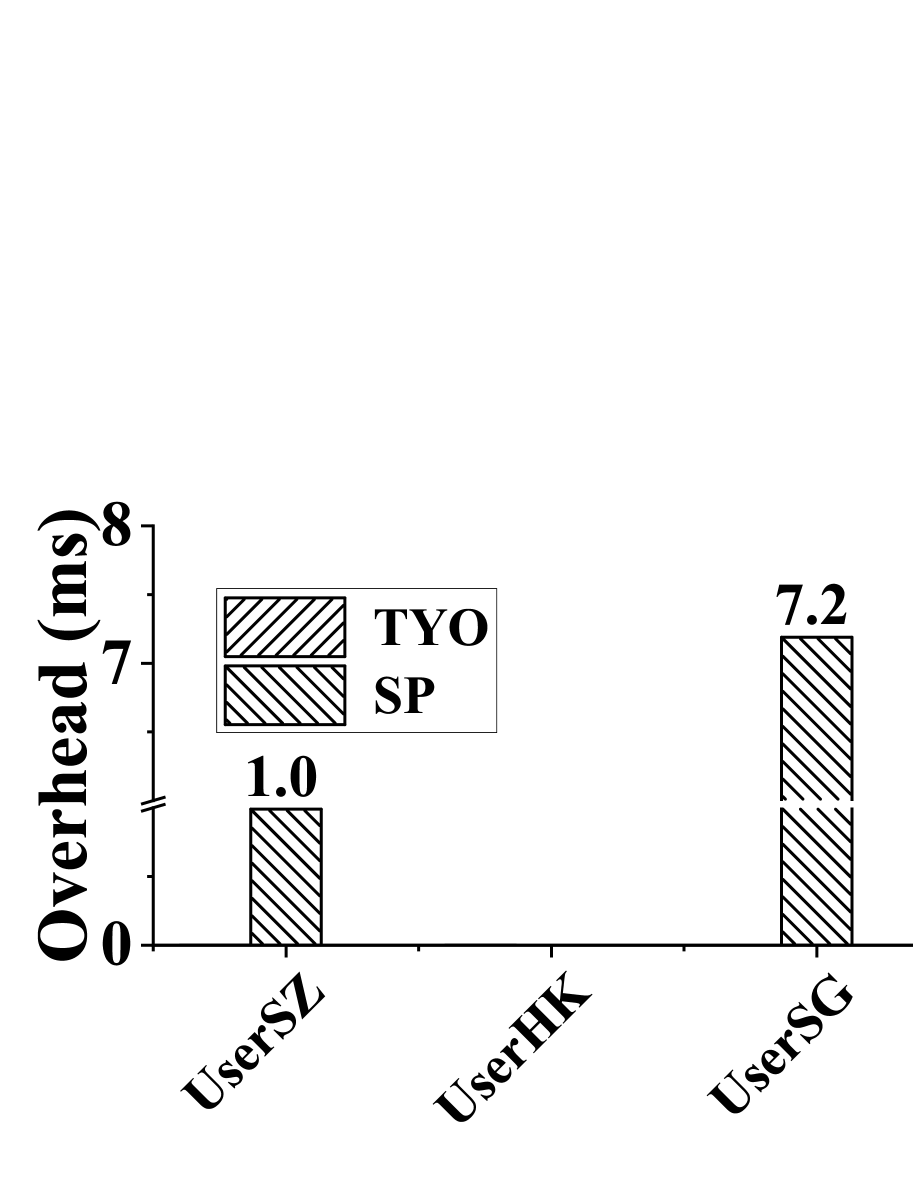
VI-C5 System overhead
With our top-k pruning, the overhead of VCRoute searching for the best route is very low ( 0.3ms for each packet). Due to the centralized design of VCRoute, the main overhead introduced by our system to video streams comes from the extra time needed to transfer routing decisions from endpoints to users. Figure 16 shows the additional overhead per packet caused by transmitting routing decisions for each meeting session hosted on different endpoints in WonderProxy and Tencent. Similar to our observations above, the additional overhead is larger for users with higher network variances (e.g., UserIDN on WonderProxy and UserSG on Tencent). The largest overhead for UserIDN is 9.1ms, which is neglectable compared to the end-to-end latency per packet as shown in Figure 10(b). The results show that, our design introduces an additional overhead less than 1% of the average end-to-end latency for each packet.
VI-D Scalability Study
To study the effectiveness of our system under larger geo-distributed environments, we constructed three synthetic network environments with one user communicating with one endpoint, and there are 9, 90 and 900 relay paths between them. For each path, we set the average latency to a random number between [100ms, 200ms]. One third of the paths have standard deviation of 10, one third have 20 and the rest have 30. Compared to the state-of-the-art VIA-BF, VCR-WM reduces the average end-to-end latency by 27%, 29% and 29% at scale 9, 90 and 900, respectively. This demonstrates that VCR-WM can achieve good optimization effectiveness even under a larger system scale. Figure 17 shows the CDFs of the end-to-end latency results.
VI-E Discussions
The above results show that our proposed methods are effective and efficient to different geo-distributed environments.
-
•
VCRoute is effective for networks with highly heterogeneous networks, as demonstrated by the results on Tencent cloud.
-
•
The WM-based jitter manager is effective for highly dynamic network environments (i.e., high jitter) as demonstrated by the results on WonderProxy.
-
•
Our methods introduces an additional overhead less than 1% of the average end-to-end latency and can scale well with the increase of network sizes.
VII Related Work
VII-A Conferencing Systems
Wu et al. [15] presented a conferencing system vSkyConf, which use decentralized routing algorithm to reduce streaming latency. vSkyConf also adapt streaming rate according to the bandwidth limitation, and utilize buffer fro streaming synchronization. Fouladi et al. [17] proposed to achieve low-latency video streaming by integrating video codec and transport protocol. Yan et al. [25] used a neural network to predict the transfer time of a chunk in a video, which is used for decision of bit rate selection for video streaming. Fang et al. [26] also choose to control the sending rate of video streaming based on the bandwidth evaluation on the receiver. It used a RL-based method to change the sending rate. Zhang et al. [27] also proposed to adapt transport protocol and video codec based on network dynamics. It proposed to train a RL-based model online, and used it to predict network dynamics. Chang et al. [3] presented a detailed measurement study which compares Zoom, Webex and Google Meet. They found that users in different regions can have big difference streaming lag. Hu et al. [28] proposed to enhancing video quality at the endpoint without changing the transmitting condition of the video. Although these studies shed some lights on how to model video conferencing systems, none of them have addressed the latency issues studied in this paper.
VII-B Data Stream Processing
Data stream processing research has delved into parallelism, synchronization, and resource optimization. Zhang et al. [29] introduced BriskStream, a NUMA-aware in-memory system for shared-memory multicore architectures. Mencagli et al. [30] developed a framework for parallel continuous preference queries on out-of-order, bursty data streams. Traub et al. [31] presented Scotty, a high-throughput operator for streaming window aggregation, while Miao et al. [32] established StreamBox, an engine for out-of-order record processing on multicore servers. Zhang et al. [33] developed TStream, supporting efficient concurrent state access with dynamic restructuring execution. Distinguishing our work, we introduce watermark-based jitter management, departing from traditional buffer-based approaches, enabling more efficient data processing and further reducing latency in geo-distributed environments.
VII-C Geo-distributed Stream Processing
Network optimizations for geo-distributed stream processing have aimed to minimize communication costs, balance resource utilization, and adapt to bandwidth capacities. Gu et al. [34] developed a framework for communication cost minimization using VM placement and flow balancing. Rabkin et al. [35] created JetStream, a wide-area data analysis system addressing bandwidth limitations. Zhang et al. [36] presented AWStream, offering low latency and high accuracy in bandwidth-constrained operations. Liu et al. [37] designed Bellini, a system for rapid prototyping of inter-datacenter protocols and efficient VM resource utilization. Xu and Li [38] optimized joint request mapping and response routing for distributed data centers. Zhao et al. [39] designed HPS+, a coordinated task scheduling and routing system. Mostafaei et al. [40] devised SNR, a worker node placement approach balancing bandwidth, latency, and cost. Li et al. [41] extended Spark Streaming for optimal task scheduling and data flow routing. Zoom [42] ensures optimized connection paths through geo-distributed infrastructure. Our work advance state-of-the-art through application-aware network routing and watermark-based low-latency jitter management, offering new strategies for optimizing low-latency systems, focusing on video conferencing applications in geo-distributed environments.
VIII Conclusion
In this paper, we have addressed two significant challenges in optimizing video conferencing systems across geo-distributed data centers. First, we identified the limitations of existing routing methods that primarily focus on minimizing packet transmitting latency, which doesn’t necessarily translate to low end-to-end latency. In response, we introduced VCRoute, an application-specific packet routing technique. VCRoute incorporates both network transmission time and packet reordering time, effectively reducing the end-to-end latency. Second, we observed that the inter-DC network latency can drastically fluctuate, resulting in high jitter detrimental to video conferencing applications. Traditional buffer-based jitter management methods often introduce unnecessary delays, especially when handling stragglers. To overcome this, we proposed WMJitter, a watermark-based Out-Of-Order processing mechanism tailored to manage jitter at the users’ end. Our experimental evaluation, conducted in two distinct real-world geo-distributed environments, demonstrates the efficacy and viability of our proposed solutions, VCRoute and WMJitter, for enhancing the performance of video conferencing systems in such complex settings.
References
- [1] B. Dean, “Zoom User Stats: How Many People Use Zoom in 2022?” https://backlinko.com/zoom-users, 2022.
- [2] J. Novet, “Zoom CFO explains how the company is grappling with increased demand,” https://www.cnbc.com/2020/03/18/zoom-cfo-explains-how-the-company-is-grappling-with-increased-demand.html, 2020.
- [3] H. Chang, M. Varvello, F. Hao, and S. Mukherjee, “Can you see me now? a measurement study of zoom, webex, and meet,” in Proceedings of the 21st ACM Internet Measurement Conference. New York, NY, USA: Association for Computing Machinery, 2021, p. 216–228.
- [4] K. MacMillan, T. Mangla, J. Saxon, and N. Feamster, “Measuring the performance and network utilization of popular video conferencing applications,” in Proceedings of the 21st ACM Internet Measurement Conference. New York, NY, USA: Association for Computing Machinery, 2021, p. 229–244.
- [5] J. Jiang, R. Das, G. Ananthanarayanan, P. A. Chou, V. Padmanabhan, V. Sekar, E. Dominique, M. Goliszewski, D. Kukoleca, R. Vafin, and H. Zhang, “Via: Improving internet telephony call quality using predictive relay selection,” in Proceedings of the 2016 ACM SIGCOMM Conference, ser. SIGCOMM ’16, 2016, p. 286–299.
- [6] M. H. Hajiesmaili, L. T. Mak, Z. Wang, C. Wu, M. Chen, and A. Khonsari, “Cost-effective low-delay cloud video conferencing,” in 2015 IEEE 35th International Conference on Distributed Computing Systems, 2015, pp. 103–112.
- [7] O. Haq, M. Raja, and F. R. Dogar, “Measuring and improving the reliability of wide-area cloud paths,” in Proceedings of the 26th International Conference on World Wide Web, ser. WWW ’17, 2017, p. 253–262.
- [8] Bitag, “2020 pandemic network performance,” https://bitag.org/documents/bitag_report.pdf, 2021.
- [9] T.-Y. Huang, R. Johari, N. McKeown, M. Trunnell, and M. Watson, “A buffer-based approach to rate adaptation: Evidence from a large video streaming service,” in Proceedings of the 2014 ACM Conference on SIGCOMM, ser. SIGCOMM ’14, 2014, p. 187–198.
- [10] J. Uberti and C. Jennings, “Webrtc: Real-time communication between browsers,” RFC 7478, 2013. [Online]. Available: https://tools.ietf.org/html/rfc7478
- [11] R. Zhu, B. Liu, D. Niu, Z. Li, and H. V. Zhao, “Network latency estimation for personal devices: A matrix completion approach,” IEEE/ACM Transactions on Networking, vol. 25, no. 2, pp. 724–737, 2017.
- [12] zartbot, “Interconnection Test of Public Cloud,” https://mp.weixin.qq.com/s/rEO6ICeNvWIIBUIEHYewIg, 2020.
- [13] T.-Y. Huang, R. Johari, N. McKeown, M. Trunnell, and M. Watson, “A buffer-based approach to rate adaptation: Evidence from a large video streaming service,” SIGCOMM Comput. Commun. Rev., vol. 44, no. 4, p. 187–198, aug 2014.
- [14] B. Briscoe, A. Brunstrom, A. Petlund, D. Hayes, D. Ros, I.-J. Tsang, S. Gjessing, G. Fairhurst, C. Griwodz, and M. Welzl, “Reducing internet latency: A survey of techniques and their merits,” IEEE Communications Surveys and Tutorials, vol. 18, no. 3, pp. 2149–2196, 2016.
- [15] Y. Wu, C. Wu, B. Li, and F. C. Lau, “Vskyconf: Cloud-assisted multi-party mobile video conferencing,” in Proceedings of the Second ACM SIGCOMM Workshop on Mobile Cloud Computing, ser. MCC ’13. New York, NY, USA: Association for Computing Machinery, 2013, p. 33–38.
- [16] B. Renl, D. Guo, G. Tang, W. Wang, L. Luo, and X. Fu, “Sruf: Low-latency path routing with srv6 underlay federation in wide area network,” in 2021 IEEE 41st International Conference on Distributed Computing Systems (ICDCS), 2021, pp. 910–920.
- [17] S. Fouladi, J. Emmons, E. Orbay, C. Wu, R. S. Wahby, and K. Winstein, “Salsify: Low-latency network video through tighter integration between a video codec and a transport protocol,” in Proceedings of the 15th USENIX Conference on Networked Systems Design and Implementation, ser. NSDI’18. USA: USENIX Association, 2018, p. 267–282.
- [18] T. Akidau, E. Begoli, S. Chernyak, F. Hueske, K. Knight, K. Knowles, D. Mills, and D. Sotolongo, “Watermarks in stream processing systems: Semantics and comparative analysis of apache flink and google cloud dataflow,” Proc. VLDB Endow., vol. 14, no. 12, p. 3135–3147, jul 2021.
- [19] J. Li, K. Tufte, V. Shkapenyuk, V. Papadimos, T. Johnson, and D. Maier, “Out-of-order processing: A new architecture for high-performance stream systems,” Proc. VLDB Endow., vol. 1, no. 1, p. 274–288, aug 2008.
- [20] O. Chapelle and L. Li, “An empirical evaluation of thompson sampling,” in Proceedings of the 24th International Conference on Neural Information Processing Systems, ser. NIPS’11, 2011, p. 2249–2257.
- [21] P. Auer, “Finite-time analysis of the multiarmed bandit problem,” in Advances in neural information processing systems, 2002, pp. 160–167.
- [22] S. Hochreiter and J. Schmidhuber, “Long short-term memory,” Neural computation, vol. 9, no. 8, pp. 1735–1780, 1997.
- [23] X. Su, X. Yan, and C.-L. Tsai, “Linear regression,” Wiley Interdisciplinary Reviews: Computational Statistics, vol. 4, no. 3, pp. 275–294, 2012.
- [24] “A day in the life of the internet,” https://wonderproxy.com/blog/a-day-in-the-life-of-the-internet/, accessed on April 5, 2023.
- [25] F. Y. Yan, H. Ayers, C. Zhu, S. Fouladi, J. Hong, K. Zhang, P. Levis, and K. Winstein, “Learning in situ: a randomized experiment in video streaming,” in 17th USENIX Symposium on Networked Systems Design and Implementation (NSDI 20). Santa Clara, CA: USENIX Association, feb 2020, pp. 495–511. [Online]. Available: https://www.usenix.org/conference/nsdi20/presentation/yan
- [26] J. Fang, M. Ellis, B. Li, S. Liu, Y. Hosseinkashi, M. Revow, A. P. Sadovnikov, Z. Liu, P. Cheng, S. Ashok, D. Zhao, R. Cutler, Y. Lu, and J. Gehrke, “Reinforcement learning for bandwidth estimation and congestion control in real-time communications,” ArXiv, vol. abs/1912.02222, 2019.
- [27] H. Zhang, A. Zhou, J. Lu, R. Ma, Y. Hu, C. Li, X. Zhang, H. Ma, and X. Chen, “Onrl: Improving mobile video telephony via online reinforcement learning,” in Proceedings of the 26th Annual International Conference on Mobile Computing and Networking, ser. MobiCom ’20, 2020.
- [28] P. Hu, R. Misra, and S. Katti, “Dejavu: Enhancing videoconferencing with prior knowledge,” in Proceedings of the 20th International Workshop on Mobile Computing Systems and Applications, ser. HotMobile ’19, 2019, p. 63–68.
- [29] S. Zhang, J. He, A. C. Zhou, and B. He, “Briskstream: Scaling data stream processing on shared-memory multicore architectures,” in Proceedings of the 2019 International Conference on Management of Data, 2019, pp. 705–722.
- [30] G. Mencagli, M. Torquati, M. Danelutto, and T. De Matteis, “Parallel continuous preference queries over out-of-order and bursty data streams,” IEEE Transactions on Parallel and Distributed Systems, vol. 28, no. 9, pp. 2608–2624, 2017.
- [31] J. Traub, P. M. Grulich, A. R. Cuellar, S. Breß, A. Katsifodimos, T. Rabl, and V. Markl, “Scotty: Efficient window aggregation for out-of-order stream processing,” in 2018 IEEE 34th International Conference on Data Engineering (ICDE), 2018, pp. 1300–1303.
- [32] H. Miao, H. Park, M. Jeon, G. Pekhimenko, K. S. McKinley, and F. X. Lin, “Streambox: Modern stream processing on a multicore machine,” in USENIX ATC ’17, 2017, pp. 617–629.
- [33] S. Zhang, Y. Wu, F. Zhang, and B. He, “Towards concurrent stateful stream processing on multicore processors,” in 2020 IEEE 36th International Conference on Data Engineering (ICDE), 2020, pp. 1537–1548.
- [34] L. Gu, D. Zeng, S. Guo, Y. Xiang, and J. Hu, “A general communication cost optimization framework for big data stream processing in geo-distributed data centers,” IEEE Transactions on Computers, vol. 65, no. 1, pp. 19–29, 2015.
- [35] A. Rabkin, M. Arye, S. Sen, V. S. Pai, and M. J. Freedman, “Aggregation and degradation in jetstream: Streaming analytics in the wide area,” in NSDI ’14, 2014, pp. 275–288.
- [36] B. Zhang, X. Jin, S. Ratnasamy, J. Wawrzynek, and E. A. Lee, “Awstream: Adaptive wide-area streaming analytics,” in Proceedings of the 2018 Conference of the ACM Special Interest Group on Data Communication, 2018, pp. 236–252.
- [37] Z. Liu, Y. Feng, and B. Li, “Bellini: Ferrying application traffic flows through geo-distributed datacenters in the cloud,” in 2013 IEEE Global Communications Conference (GLOBECOM), 2013, pp. 1753–1759.
- [38] H. Xu and B. Li, “Joint request mapping and response routing for geo-distributed cloud services,” in 2013 Proceedings IEEE INFOCOM, 2013, pp. 854–862.
- [39] L. Zhao, Y. Yang, A. Munir, A. X. Liu, Y. Li, and W. Qu, “Optimizing geo-distributed data analytics with coordinated task scheduling and routing,” IEEE Transactions on Parallel and Distributed Systems, vol. 31, no. 2, pp. 279–293, 2019.
- [40] H. Mostafaei, S. Afridi, and J. H. Abawajy, “Snr: Network-aware geo-distributed stream analytics,” in 2021 IEEE/ACM 21st International Symposium on Cluster, Cloud and Internet Computing (CCGrid), 2021, pp. 820–827.
- [41] W. Li, D. Niu, Y. Liu, S. Liu, and B. Li, “Wide-area spark streaming: Automated routing and batch sizing,” IEEE Transactions on Parallel and Distributed Systems, vol. 30, no. 6, pp. 1434–1448, 2018.
- [42] Z. V. C. Inc., “Zoom Connection Process White Paper,” https://bit.ly/3D1oeAw, 2021.