2022
[1]\fnmToma \surOregel-Chaumont
[1]\orgdivElectromagnetic Compatibility Laboratory, \orgnameEPFL, \orgaddress\street, \cityLausanne, \postcode1015, \stateVD, \countrySwitzerland
2]\orgdivDepartment of Engineering Sciences, \orgnameUppsala University, \orgaddress\street, \cityUppsala, \postcode751, \state, \countrySweden
3]\orgdivIICT, \orgnameHEIG-VD, \orgaddress\street, \cityYverdon-les-Bains, \postcode1401, \stateVD, \countrySwitzerland
Direct Observations of X-Rays Produced by Upward Positive Lightning
Abstract
X-rays have been observed in natural downward cloud-to-ground lightning for over twenty years and in rocket-triggered lightning for slightly less. In both cases, this energetic radiation has been detected during the stepped and dart leader phases of downward negative flashes. More recently, X-rays have also been reported during the dart leader phase of upward negative flashes. In this study, we present the observations of four upward positive lightning flashes from the Säntis Tower (2.5 km ASL) in Switzerland. These consist of the simultaneous records of electric current passing through the tower, and electric field strength and X-ray flux 20 meters from the tower base. One of the flashes was captured by a high-speed camera operating at 24,000 frames per second, stills from which are also presented. We detected X-rays during the initial phase of upward negative leader propagation, which can be associated with the leader-stepping process from electric field and current waveforms. To the best of our knowledge, this is the first time that such measurements are reported in the literature. The obtained time-synchronised data confirm that the X-ray emissions detected are associated with the initial steps of the upward negative leader. The frequency and energy of X-ray pulses appear to decrease as a function of time, with pulses disappearing altogether within the first millisecond of the leader initiation. The X-ray pulse energy appears to increase with the maximum current-derivative and the electric field change of its associated leader step. These observations contribute to improving the currently lackluster understanding of upward lightning, which is a primary source of damage to tall structures such as telecommunications towers and wind turbines, as well as airplanes during take-off and landing.
keywords:
lightning, X-rays, leaders, observations1 Introduction
The first unambiguous observation of X-ray generation from lightning flashes was made by Moore et al. 2001 moore_energetic_2001 , who recorded X-ray bursts with energies in excess of 1 MeV during the stepped-leader phase of three natural downward negative lightning flashes. This confirmed the relativistic runaway electron avalanche (RREA) model proposed by Gurevich et al. 1992 (gurevich_runaway_1992, ), which predicted the production of X-rays via the bremsstrahlung interaction of electrons with air. Since then, X-ray emissions have been measured in both natural and artificially-triggered cloud-to-ground (CG) lightning via a series of experiments conducted at Camp Blanding, Florida (dwyer_energetic_2003, ; dwyer_x-ray_2005, ; saleh_properties_2009, ; mallick_study_2012, ). Bursts of energetic radiation were detected during both the stepped-leader phase and dart leader–return stroke transition, with energies ranging from 100s of keV to 10s of MeV.
Measurements of X-ray emissions from natural upward lightning, however, were scanty until recently. Yoshida et al. 2008 yoshida_high_2008 observed increased counts associated with seven lightning flashes on their plastic and NaI scintillators designed for detecting high-energy electron and photon bursts, though the 1-ms sampling interval of their detectors did not permit precise identification of the emitting phase. Out of the seven, they reported results on two, an upward negative flash and an upward positive flash. Montanyà et al. 2014 montanya_registration_2014 made measurements of X-ray emissions from several upward lightning flashes from the mountaintop Eagle Nest tower located at 2537 m above sea-level (ASL) in the Pyrenées. They observed a 17 X-ray pulse burst (with an 806 keV maximum) during the stepped leader phase of a natural downward negative flash, but did not detect X-ray emissions during the 13 upward-initiated flashes reported. Hettiarachchi et al. 2018 hettiarachchi_x-ray_2018 were the first to directly measure X-ray emissions from upward-initiated lightning flashes: though either rare or very weak, they detected X-rays with energies up to 700 keV occurring both in bursts and as single events during the dart/dart-stepped leader phase of 3 natural upward negative flashes at Gaisberg Tower in Austria.
Herein we report, to the best of our knowledge, the first association of X-rays with the stepping of the upward negative leader in upward positive lightning flashes, as measured by the comprehensive Säntis lightning measurement system. The data consist of simultaneous records of lightning current and its derivative, near electric field (20 m), and high-speed camera (HSC) images. A summary of the data types analysed in this study and the aforementioned studies is presented in Table 1.
| Study | E-Field | Current | High-speed camera | Interfer -ometer | Scintillators |
| Moore et al. 2001 | YES | YES | NO | NO | 1 |
| Dwyer et al. 2003-5 | YES | YES | YES | NO | 12 |
| Yoshida et al. 2008 | YES | YES | NO | YES | 2 |
| Saleh et al. 2009 | YES | YES | NO | NO | 45 |
| Mallick et al. 2012 | YES | NO | NO | NO | 1 |
| Montanyà et al. 2014 | YES | NO | YES | NO | 1 |
| Hettiarachchi et al. 2018 | YES | YES | NO | NO | 2 |
| This study | YES | YES | YES | NO111Interferometric (IFM) data is available but not analysed in this study. | 2 |
| \botrule |
2 Methods
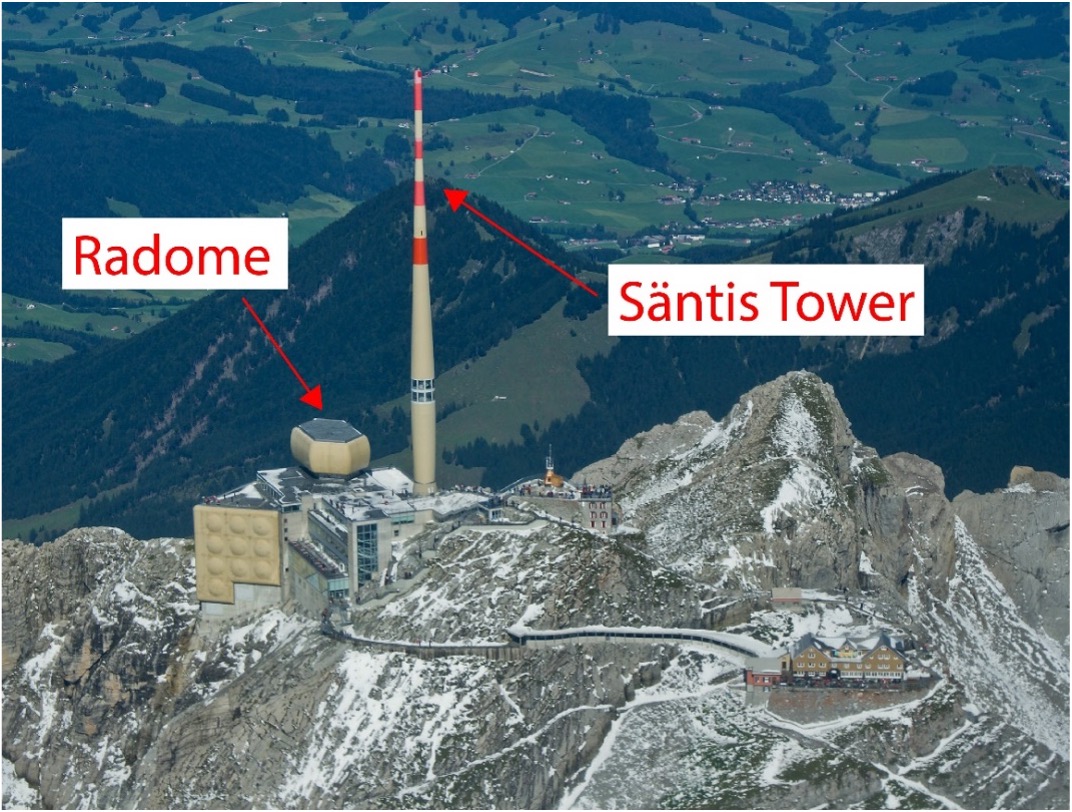
The Mt. Säntis Lightning Research Facility, shown in Figure 1, is situated at 2502 m ASL in the Appenzell Alps of northeastern Switzerland, and experiences 100 direct lightning strikes per year to its 124 meter-tall tower, which is equipped with a Rogowski coil – sensor pair at two different heights (24 and 82 meters above ground level), for measurement of the current and current derivative, respectively.222All four sensors operate with a sampling rate of 50 MHz. The nearby Radome houses a near E-field sensor and two X-ray detectors (described below), which have a common sampling rate of 20 MHz. Our Mélopée fast E-field probe has a frequency range of 1 kHz to 150 MHz and is described in more detail in Šunjerga et al. 2021 sunjerga_santis_2021 . Five kilometers away, atop Mt. Krönberg (1663 ASL), is a high-speed camera (HSC) operating at 24,000 fps, with an exposure time of 41 s. Electric field measurements are also taken 15 km away by a flat-plate antenna with line-of-site in Herisau, Switzerland, though this data is not presented herein. Additionally, during the Summer of 2021, when the flashes discussed below occurred, a University of New Mexico interferometer (IFM) was installed in Schwägalp, at the base of Mt. Säntis. These interferometric results will be the subject of a separate paper.
One of our two NaI X-ray detectors belong to Uppsala University and the other to the University of California – Santa Cruz (UCSC); the former records waveforms and is triggered by the tower current, whereas the latter records the peak energies of events and is working continuously. The Uppsala scintillator, whose data are presented in this report, has a measuring range of 10 keV to 2 MeV, a temporal resolution of 1/4 s, and is of the same design as that used by Hettiarachchi et al.; refer to their 2018 paper hettiarachchi_x-ray_2018 for a detailed description. This X-ray detector is connected to the same digitiser as our radome E-field probe and therefore by default synchronised; synchronisation of these two with the tower current and current derivative signals (which are themselves synchronised in the same manner) is done by aligning the time of the first E-field “step” with the time of the extremum associated with the first current pulse, as these tend to be the sharpest. The HSC and “far” E-field data are synchronised with the rest by GPS time-stamp if the antennae are functional at the time of the flash. If not, manual synchronisation can be carried out via waveform matching. More detailed information on the Säntis measurement system can be found in rachidi_santis_2022 .
All computational data analysis and presentation were carried out using the Python programming language, with the NumPy, SciPy and Matplotlib libraries in particular.
3 Results
| Flash |
Date
UTC |
Prior Activity | Current (& derivative) | High-speed camera | Interfer -ometer | E-field333Only near E-field waveforms are presented and analysed herein. (20-m & 15-km) |
| UP0 |
2021-06-28
23:26:53 |
YES | YES | NO | NO | YES |
| UP1 |
2021-07-24
16:06:07 |
NO | YES | NO | YES | YES |
| UP2 |
2021-07-24
16:24:03 |
NO | YES | YES | NO | YES |
| UP3 |
2021-07-30
18:00:10 |
YES | YES | NO | YES | YES |
| \botrule |
We analysed 4 upward positive and 8 upward negative flashes with associated X-ray emissions that occurred during the Summer 2021 thunderstorm season.444A comprehensive analysis of all 12 flashes will be the subject of a separate paper. The data available for the 4 upward positive flashes (UPFs) presented here are summarised in Table 2. In addition to tower current and electric field measurements, two (UP1 and UP3) were recorded by the interferometer (subject to a separate analysis), and one (UP2) was captured by the high-speed camera. UP0 and UP3 also saw preceding lightning activity in the vicinity (i.e. intra-cloud flashes); studies have shown that this may impact the formation of leaders from the strike object sunjerga_initiation_2021 . It should be noted that flashes UP1, UP2, and UP3 occurred during the Laser Lightning Rod project presented in Houard et al. 2023 houard_laser-guided_2023 (therein called L1, L2, and L3, respectively), while the laser was on, whereas flash UP0 did not.
Here, we define the initial continuous current (ICC) at the start of the leader, i.e., the first significant deviation from zero of the electric field, current and current-derivative. For the latter two, we have chosen the convention of a negative current corresponding to a positive charge transfer from cloud to ground. Each positive flash had between two and seven X-ray events associated with this “stepping” of the upward negative leader, also indicated by pulses in the current waveform.
| Flash | [s] | [kA] | [s] | || [] | [] | [s] | XRE [keV] |
| UP0 | 150.9 | 0.810.05 | 0.13 | 6.20.4 | 54555 | 0.15 | 63.40.9 |
| UP1 | 0.0 | 1.660.05 | 0.12 | 14.20.3 | 102540 | 0.20 | 259.30.7 |
| 89.5 | 2.01 | 0.24 | 8.2 | 885 | 0.30 | 85.1 | |
| 334.6 | 1.91 | 0.88 | 2.2 | 635 | 9.50 | 87.0 | |
| 345.7 | 2.89 | 0.79 | 3.7 | 635 | 9.50 | 123.8 | |
| 465.6 | 2.20 | 1.53 | 1.4 | 330 | 10.55 | 31.6 | |
| 554.1 | 2.80 | 1.36 | 2.1 | 590 | 17.10 | 79.8 | |
| 774.0 | 2.66 | 1.78 | 1.5 | 350 | 19.50 | 31.1 | |
| UP2 | 46.3 | 1.140.05 | 0.13 | 8.70.3 | 145040 | 0.20 | 54.60.7 |
| 267.5 | 0.41 | 0.31 | 1.3 | 280 | 11.05 | 44.1 | |
| UP3 | 118.0 | 2.440.05 | 0.47 | 5.20.3 | 72040 | 0.25 | 26.50.8 |
| 355.0 | 2.71 | 1.28 | 2.1 | 475 | 2.35 | 50.4 | |
| 483.0 | 1.82 | 1.08 | 1.7 | 175 | 6.70 | 53.0 | |
| 785.0 | 5.20 | 2.52 | 2.1 | 565 | 21.10 | 42.8 | |
| – | 2.191.11 | 0.900.71 | 4.33.7 | 620320 | 7.757.30 | 73.857.6 | |
| – | |||||||
| \botrule |
Table 3 presents the measured data for each pulse with correlated X-rays. The time (“stepped leader”) is measured from the onset of the ICC. represents the absolute value peak current of a given pulse, and || its maximum current derivative (slope). Together they make the minimum current rise-time, defined by Giri et al. 2009 giri_relationship_2009 as:
| (1) |
which has a temporal accuracy of 20 ns. The change in the electric field is given by and its 80% rise-time by (with a temporal resolution of 50 ns). Finally, XRE is the associated X-ray energy. The first row of each flash provides the error associated with sensor noise at that time, with the exception of the calculated , whose errors vary with measurement. The last two rows in the table provide the arithmetic and geometric means and standard deviations of each data set above. One can already see that all parameters except exhibit at least some degree of temporal variation, as will be confirmed later in Section 4.
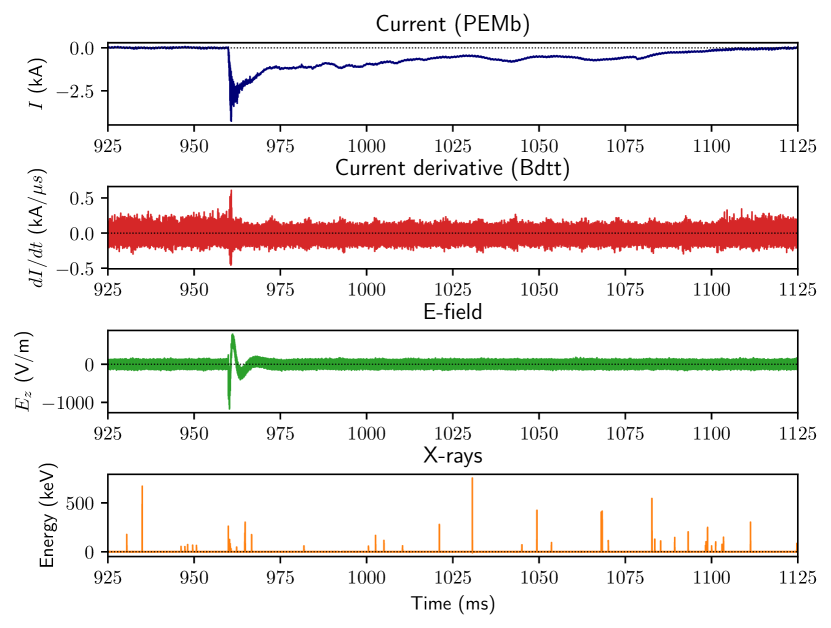
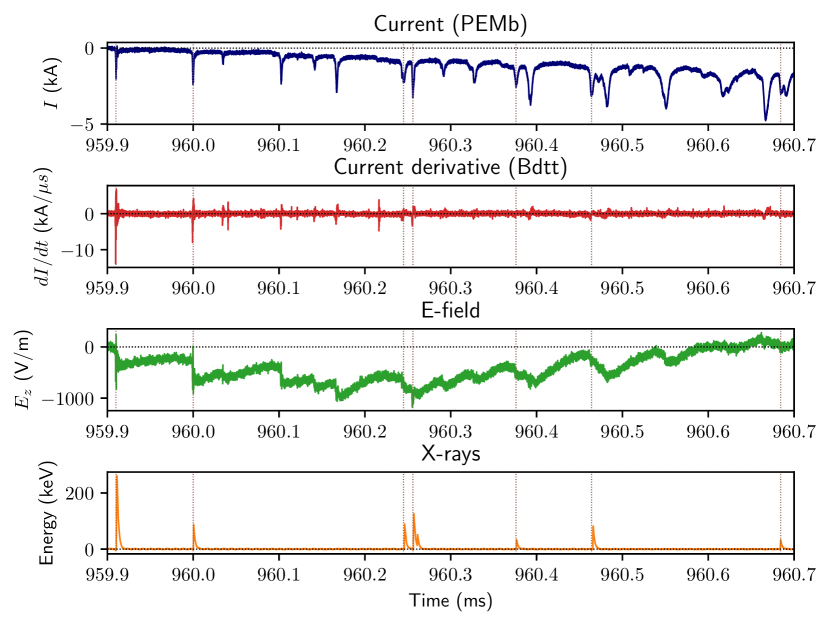
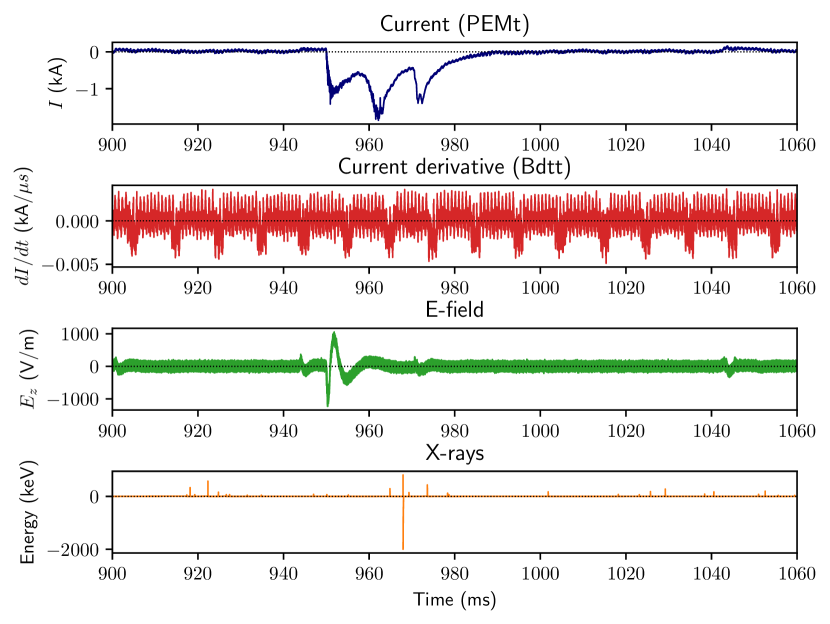
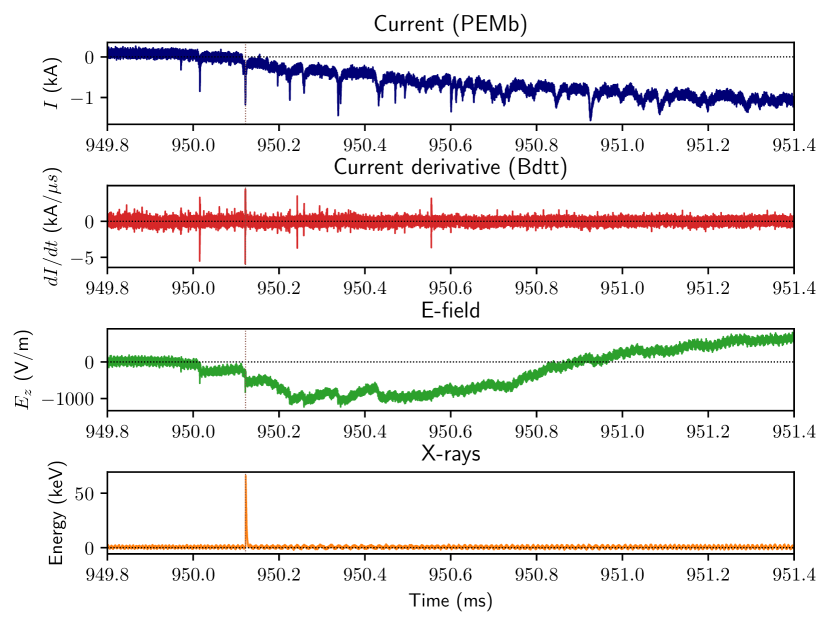
The current, , near E-field, and X-ray waveforms of UP1 are shown in Figure 2. It can be seen from Figure 2(a) that this was a Type 2 upward positive flash, as defined by Romero et al. 2013 romero_positive_2013 ; i.e., it lacks a return stroke–like main pulse following the stepped-leader phase. Figure 2(b) presents an expanded view of the initiation of the upward leader and its stepping. It clearly shows how steps in the electric field are associated with ICC pulses; 1/3 of which were associated with X-ray emissions. The 7 X-ray pulses have a median temporal separation on the order of 100 s, and median energy on the order of 80 keV. Note, however, the decrease in pulse peak energy as time goes on.
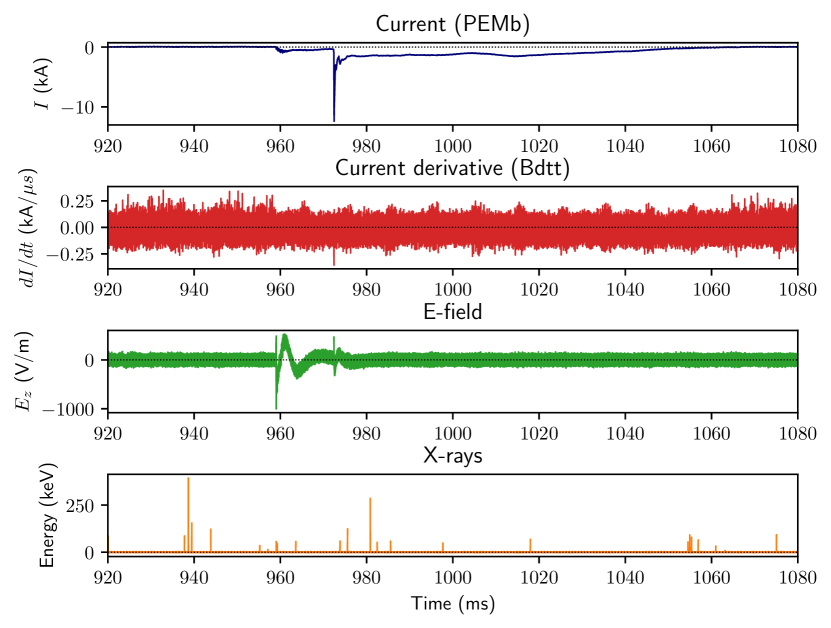
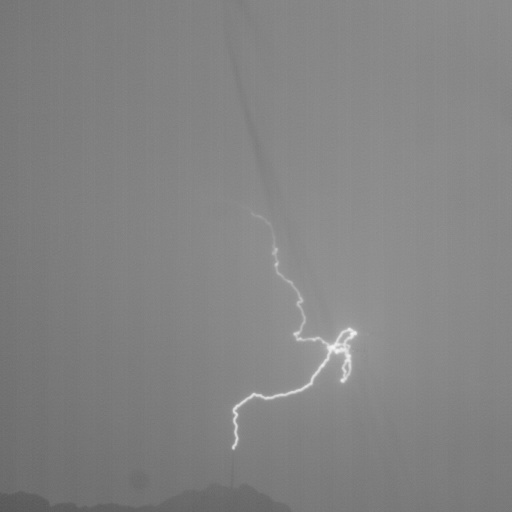
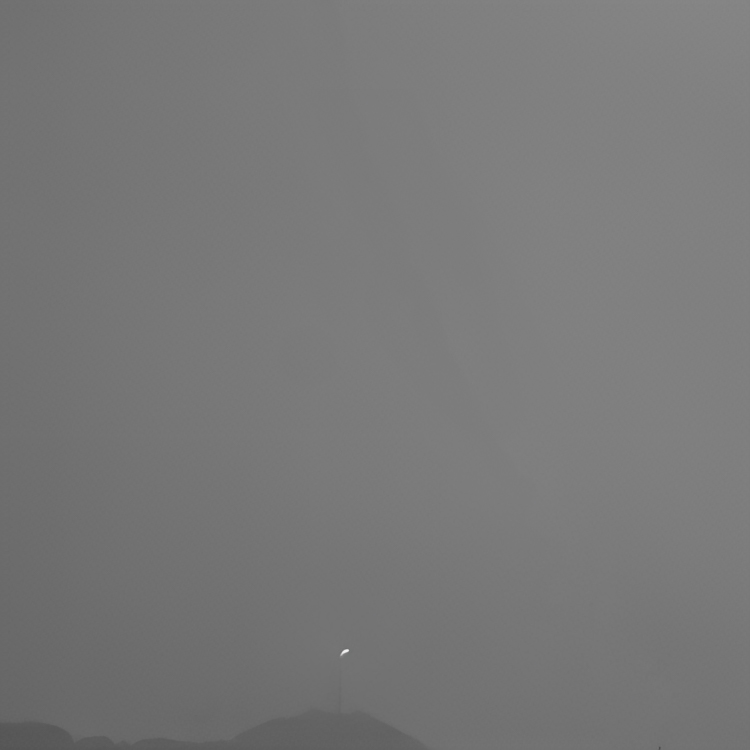
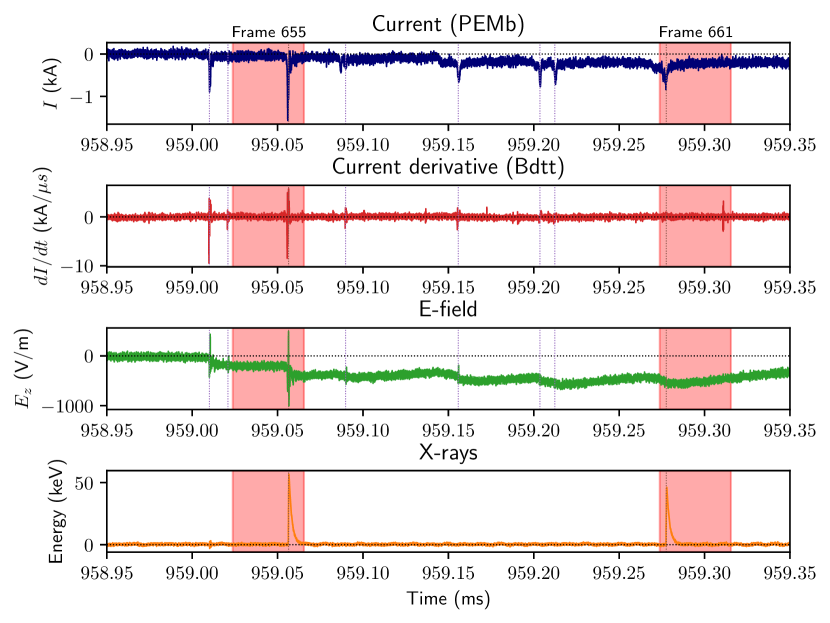
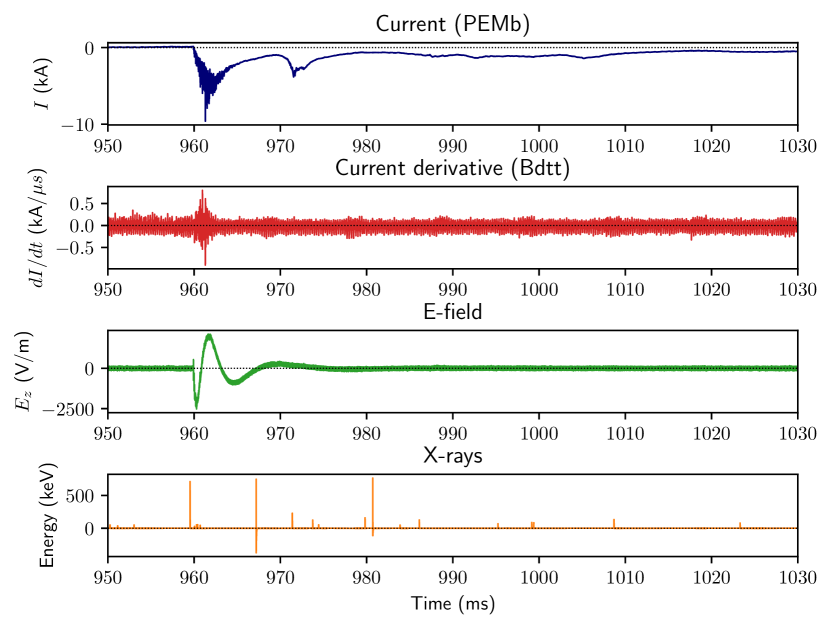
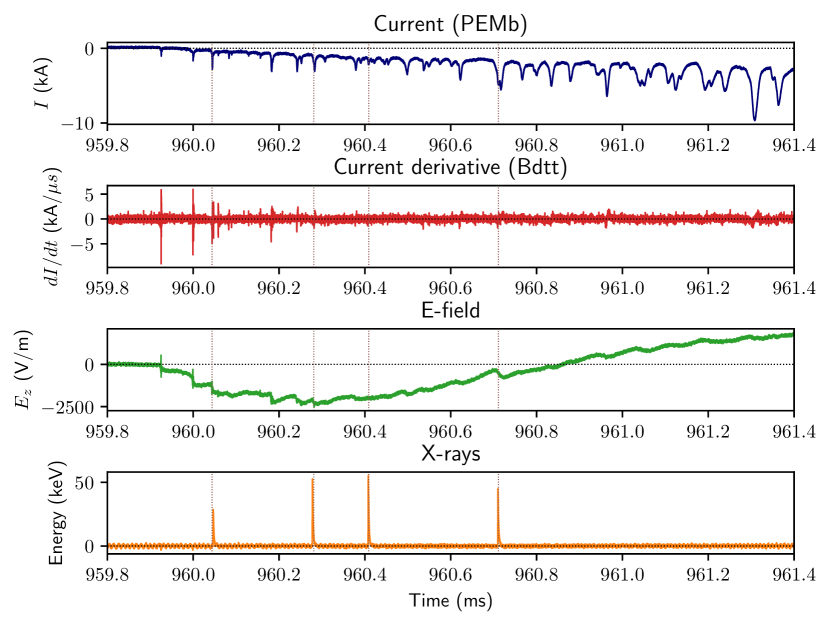
The whole flash waveforms and integrated HSC frames of UP2 are shown in Figure 3. This was clearly a Type 1 upward positive flash romero_positive_2013 , with a very obvious return stroke–like pulse after the upward-stepping leader. In the right-hand panel of the figure, one can make out the Säntis tower, from which the flash initiated, at the base of the rather tortuous plasma channel.555The faint black streak running diagonally across the integrated stills are raindrops streaming down the camera’s protective window pane. The plots at the bottom of Figure 4 provide a zoom on the beginning of the ICC, when the two X-ray pulses occurred and the top pictures are HSC stills containing these pulses, which occurred 221 s apart with an average energy of 49 keV. Once again, these are clearly associated with the leader-stepping process, though unlike the Type 2 UPFs, only 1/10 of the leader steps had accompanying X-rays detected.

UP3 was a Type 2 flash like UP1; its 4 X-ray pulses (about 1/6 of all ICC pulses) had a mean temporal separation of 220 s and an average energy of 43 keV. UP0 was likely a Type 1 flash like UP2; its singular X-ray pulse (5% of all ICC pulses) had an energy of 63 keV. These flashes’ waveforms are not depicted here for the sake of conciseness, though all their pulse data have been included in the following analysis. See Appendix Figures 7 & 8 for plots.
4 Discussion
Figure 5 shows how both X-ray count and energy decrease as a functions of time from the onset of the stepped leader, . Note how, in comparison with the X-ray pulse to non-X-ray pulse ratios presented in Section 3, ICC pulses with measured accompanying X-rays compose a steadily decreasing percentage of all measured pulses, starting at 29% during the first 200 s, and dropping to 0% after 800 s. Although one could argue that this count decrease observed in Figure 5(a) is simply due to the decrease in photon flux at the sensor location as the leader tip (where the X-rays are presumed to be emitted rakov_lightning_2003 ; moss_monte_2006 ) moves away, the same argument cannot be made for observed energy decrease in Figure 5(b), as the waveforms are indicative of single events, rather than photon-burst energy pile-ups (compare with Figure 4 of Saleh et al. 2009 saleh_properties_2009 ). The best-fit lines in this plot imply the existence of a finite time (1 ms) after which X-rays would no longer be generated and/or detected.
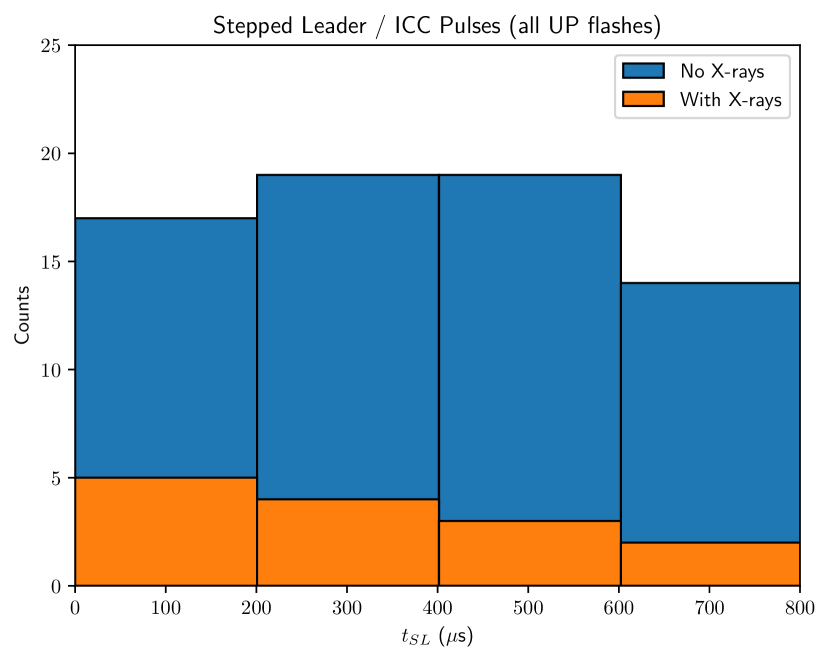
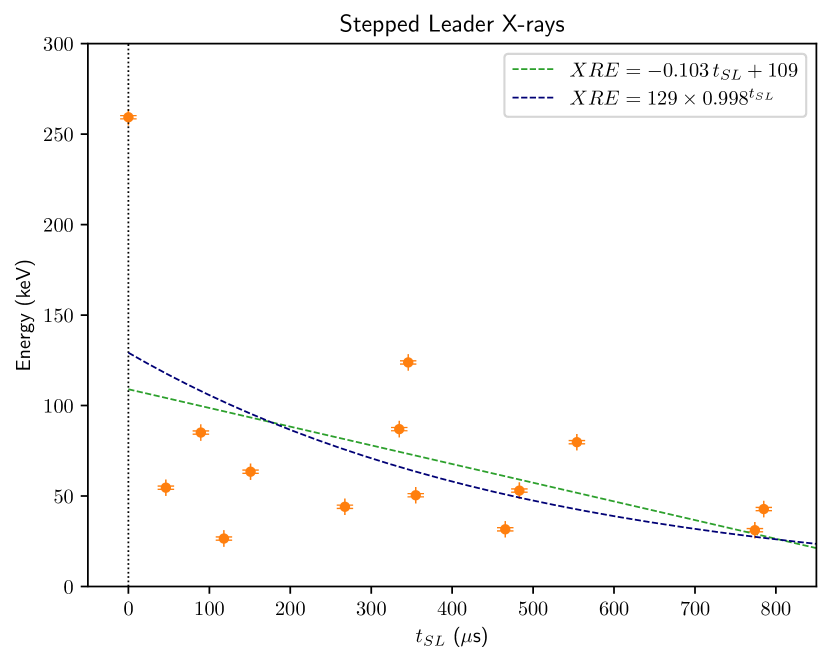
Figure 6(a) shows the scatter plot of X-ray energy versus maximum current derivative, ||max. It is clear from the color map that the latter also decreases as a function of time (alternatively, the pulse rise-time increases). The best fit lines show that the X-ray energy increases with ||max, either linearly or exponentially.
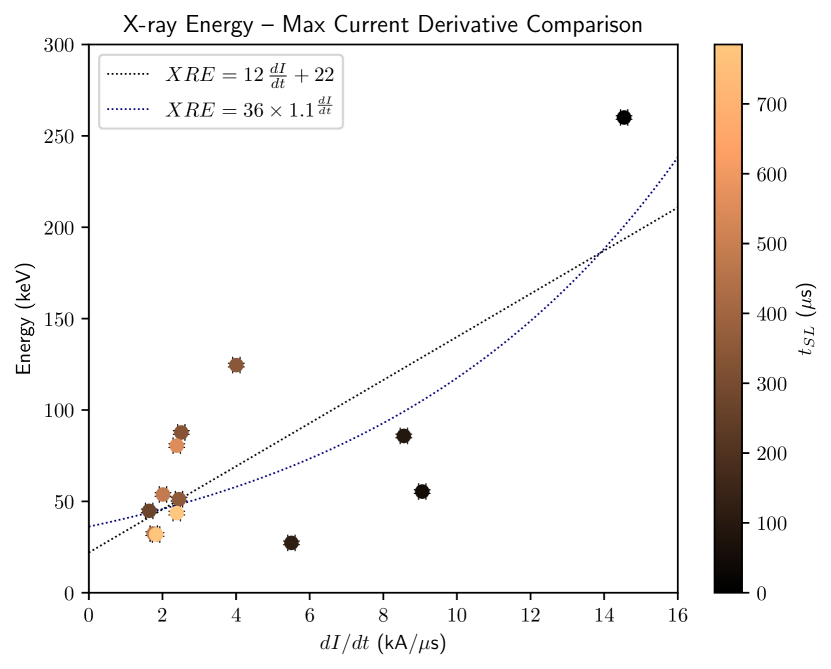
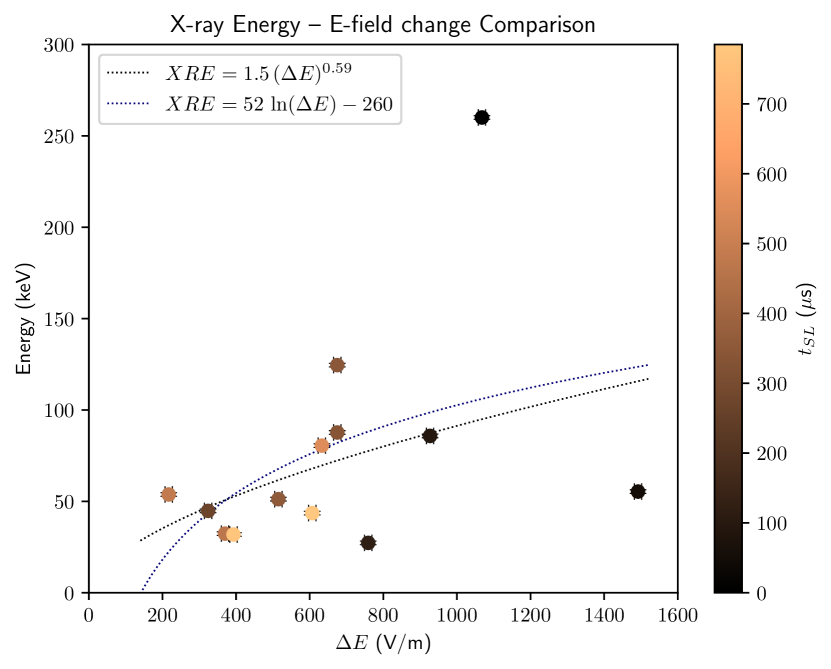
Figure 6(b) shows the scatter plot of X-ray energy versus electric field change, . It is clear from the color map that decreases as a function of time, as does the X-ray energy, albeit to a lesser extent (see Figure 5(b)). The former can be at least partly explained by the fact that our sensor measures only the vertical component of the electric field, and the leader tip is moving away from the tower. The best fit lines show how the X-ray energy increases with , possibly logarithmically or as a power-law. Note that, should a logarithmic relation be confirmed by further investigation, the x-intercept at V/m implies the existence of a minimum E-field change needed for X-rays to be produced.
As such, it has been suggested (e.g., dwyer_implications_2004 ; cooray_electric_2009 ) that the so-called “cold runaway electron mechanism”, as opposed to the RREA model, is active in X-ray emissions associated with lightning leaders. For the cold runaway mechanism to be active, it is necessary for the background electric field at atmospheric pressure to exceed about 20 MV/m moss_monte_2006 ; cooray_electric_2009 . If the electric field increases slowly in atmospheric air, as its value reaches around 3 MV/m the normal electrical breakdown process takes over and the resulting increase in conductivity of the discharge channel limits further increase of the electric field strength. The electric field will therefore be clamped to a value equal to or below this breakdown threshold.666If the pressure is below atmospheric, these mechanisms remain the same except that the threshold fields are scaled down linearly with pressure. Since a certain amount of time is needed for the completion of standard breakdown, in order to achieve the cold runaway mechanism the electric field has to increase very rapidly in a given region of space so that there isn’t sufficient time for the standard breakdown mechanism to take over and clamp the electric field at 3 MV/m. Thus, only very fast discharge processes (sub-microsecond scale) can generate the strong electric fields needed to push electrons into the cold runaway regime quickly enough cooray_electric_2009 . This is in agreement with the observation that X-ray emissions occur during discharge processes with rapidly changing currents, such as those seen in this study.
5 Conclusion
Herein we reported, to the best of our knowledge, the first measurements of X-rays produced by positive lightning flashes, specifically during the stepping of the upward negative leader. We presented the waveforms of the current, current derivative, electric field, and X-ray energy for the four flashes in question (two Type 2 upward positive flashes), as well as high-speed camera stills for one of them (a Type 1 upward positive flash). These time-synchronised data served to confirm that the X-ray emissions detected are associated with the initial steps of the upward negative leader. Further analysis of the parameters at play revealed three additional points of interest:
-
•
The frequency and energy of X-ray pulses appear to decrease as a functions of time, with pulses disappearing altogether within the first millisecond of leader initiation;
-
•
the Type 1 upward positive flashes exhibited the lowest percentages of pulses with accompanying X-rays, which also ended sooner;
-
•
X-ray pulse energy appears to increase with the maximum current-derivative and the electric field change of its associated leader step. This supports the cold runaway electron model as the active mechanism for lightning leader X-ray production.
These observations contribute to improving our understanding of upward lightning, and will soon be followed by a more comprehensive review, including X-ray–emitting upward negative flashes observed at the Säntis tower, and simultaneous interferometric data gathered during the summer 2021 experimental campaign.
Supplementary information
None.
Acknowledgments
This work was supported in part by the Swiss National Science Foundation (Project no. 200020_204235) and the European Union’s Horizon 2020 research and innovation program (grant agreement no. 737033-LLR). The authors would like to thank Florent Aviolat for developing a data-visualisation software that expedited the identification of events.
Declarations
Competing interests
None.
Data availability
All processed data analysed during this study are included in this published article (and its supplementary information files). Raw data sets generated during the current study are available from the corresponding author on reasonable request.
Code availability
Upon request from corresponding author.
Authors’ contributions
T.O.C. wrote the manuscript and completed the data analysis and processing begun by A.S., who also gathered the data alongside M.R. and F.R., heads of the Säntis Lightning Research Facility, during the summer 2021 experimental campaign. P.H. and V.C. designed and built the X-ray detector providing the data.
Appendix A Flashes UP0 & UP3
References
- \bibcommenthead
- (1) Moore, C.B., Eack, K.B., Aulich, G.D., Rison, W.: Energetic radiation associated with lightning stepped-leaders. Geophys. Res. Lett. 28(11), 2141–2144 (2001). https://doi.org/10.1029/2001GL013140. Accessed 2022-09-30
- (2) Gurevich, A.V., Milikh, G.M., Roussel-Dupre, R.: Runaway electron mechanism of air breakdown and preconditioning during a thunderstorm. Physics Letters A 165(5-6), 463–468 (1992). https://doi.org/%****␣sn-article.bbl␣Line␣75␣****10.1016/0375-9601(92)90348-P. Accessed 2023-03-22
- (3) Dwyer, J.R., Uman, M.A., Rassoul, H.K., Al-Dayeh, M., Caraway, L., Jerauld, J., Rakov, V.A., Jordan, D.M., Rambo, K.J., Corbin, V., Wright, B.: Energetic Radiation Produced During Rocket-Triggered Lightning. Science 299(5607), 694–697 (2003). https://doi.org/%****␣sn-article.bbl␣Line␣100␣****10.1126/science.1078940. Accessed 2022-10-06
- (4) Dwyer, J.R., Rassoul, H.K., Al-Dayeh, M., Caraway, L., Chrest, A., Wright, B., Kozak, E., Jerauld, J., Uman, M.A., Rakov, V.A., Jordan, D.M., Rambo, K.J.: X-ray bursts associated with leader steps in cloud-to-ground lightning. Geophys. Res. Lett. 32(1), 01803 (2005). https://doi.org/10.1029/2004GL021782. Accessed 2022-10-06
- (5) Saleh, Z., Dwyer, J., Howard, J., Uman, M., Bakhtiari, M., Concha, D., Stapleton, M., Hill, D., Biagi, C., Rassoul, H.: Properties of the X-ray emission from rocket-triggered lightning as measured by the Thunderstorm Energetic Radiation Array (TERA). J. Geophys. Res. 114(D17), 17210 (2009). https://doi.org/%****␣sn-article.bbl␣Line␣150␣****10.1029/2008JD011618. Accessed 2023-05-22
- (6) Mallick, S., Rakov, V.A., Dwyer, J.R.: A study of X-ray emissions from thunderstorms with emphasis on subsequent strokes in natural lightning: X-RAY EMISSIONS FROM NATURAL LIGHTNING. J. Geophys. Res. 117(D16), (2012). https://doi.org/10.1029/2012JD017555. Accessed 2023-05-22
- (7) Yoshida, S., Morimoto, T., Ushio, T., Kawasaki, Z.-I., Torii, T., Wang, D., Takagi, N., Watanabe, T.: High energy photon and electron bursts associated with upward lightning strokes: HIGH ENERGY PHOTON AND ELECTRON BURSTS. Geophys. Res. Lett. 35(10) (2008). https://doi.org/10.1029/2007GL032438. Accessed 2023-05-22
- (8) Montanyà, J., Fabró, F., van der Velde, O., Romero, D., Solà, G., Hermoso, J.R., Soula, S., Williams, E.R., Pineda, N.: Registration of X-rays at 2500 m altitude in association with lightning flashes and thunderstorms. J. Geophys. Res. Atmos. 119(3), 1492–1503 (2014). https://doi.org/10.1002/2013JD021011. Accessed 2022-09-30
- (9) Hettiarachchi, P., Cooray, V., Diendorfer, G., Pichler, H., Dwyer, J., Rahman, M.: X-ray Observations at Gaisberg Tower. Atmosphere 9(1), 20 (2018). https://doi.org/10.3390/atmos9010020. Accessed 2022-05-25
- (10) Sunjerga, A., Mostajabi, A., Paolone, M., Rachidi, F., Romero, C., Hettiarachchi, P., Cooray, V., Azadifar, M., Rubinstein, A., Rubinstein, M., Pavanello, D., Smith, D.: Säntis Lightning Research Facility Instrumentation. ICLP, 6 (2021)
- (11) Rachidi, F., Rubinstein, M.: Säntis lightning research facility: a summary of the first ten years and future outlook. Elektrotech. Inftech. 139(3), 379–394 (2022). https://doi.org/10.1007/s00502-022-01031-2. Accessed 2023-07-02
- (12) Sunjerga, A., Rubinstein, M., Rachidi, F., Cooray, V.: On the Initiation of Upward Negative Lightning by Nearby Lightning Activity: An Analytical Approach. Geophys Res Atmos 126(5) (2021). https://doi.org/10.1029/2020JD034043. Accessed 2022-05-16
- (13) Houard, A., Walch, P., Produit, T., Moreno, V., Mahieu, B., Sunjerga, A., Herkommer, C., Mostajabi, A., Andral, U., André, Y.-B., Lozano, M., Bizet, L., Schroeder, M.C., Schimmel, G., Moret, M., Stanley, M., Rison, W.A., Maurice, O., Esmiller, B., Michel, K., Haas, W., Metzger, T., Rubinstein, M., Rachidi, F., Cooray, V., Mysyrowicz, A., Kasparian, J., Wolf, J.-P.: Laser-guided lightning. Nat. Photon. 17(3), 231–235 (2023). https://doi.org/10.1038/s41566-022-01139-z. Accessed 2023-08-16
- (14) Giri, D.V., Prather, W.D., Baum, C.E.: The Relationship Between NEMP Standards and Simulator Performance Specifications. Sensor and Simulation Notes Note 538 (2009)
- (15) Romero, C., Rachidi, F., Rubinstein, M., Paolone, M., Rakov, V.A., Pavanello, D.: Positive lightning flashes recorded on the Säntis tower from May 2010 to January 2012: POSITIVE LIGHTNING SÄNTIS TOWER. J. Geophys. Res. Atmos. 118(23), 12879–12892 (2013). https://doi.org/10.1002/2013JD020242. Accessed 2023-05-01
- (16) Rakov, V.A., Uman, M.A.: Lightning: Physics and Effects. Cambridge University Press, Cambridge, U.K. ; New York (2003)
- (17) Moss, G.D., Pasko, V.P., Liu, N., Veronis, G.: Monte Carlo model for analysis of thermal runaway electrons in streamer tips in transient luminous events and streamer zones of lightning leaders. J. Geophys. Res. 111(A2), 02307 (2006). https://doi.org/10.1029/2005JA011350. Accessed 2023-05-22
- (18) Dwyer, J.R.: Implications of x-ray emission from lightning: IMPLICATIONS OF X-RAYS FROM LIGHTNING. Geophys. Res. Lett. 31(12), (2004). https://doi.org/10.1029/2004GL019795. Accessed 2023-04-27
- (19) Cooray, V., Becerra, M., Rakov, V.: On the electric field at the tip of dart leaders in lightning flashes. Journal of Atmospheric and Solar-Terrestrial Physics 71(12), 1397–1404 (2009). https://doi.org/10.1016/j.jastp.2009.06.002. Accessed 2023-09-26