Reliable Test-Time Adaptation via
Agreement-on-the-Line
Abstract
Test-time adaptation (TTA) methods aim to improve robustness to distribution shifts by adapting models using unlabeled data from the shifted test distribution. However, there remain unresolved challenges that undermine the reliability of TTA, which include difficulties in evaluating TTA performance, miscalibration after TTA, and unreliable hyperparameter tuning for adaptation. In this work, we make a notable and surprising observation that TTAed models strongly show the agreement-on-the-line phenomenon (Baek et al., 2022) across a wide range of distribution shifts. We find such linear trends occur consistently in a wide range of models adapted with various hyperparameters, and persist in distributions where the phenomenon fails to hold in vanilla models (i.e., before adaptation). We leverage these observations to make TTA methods more reliable in three perspectives: (i) estimating OOD accuracy (without labeled data) to determine when TTA helps and when it hurts, (ii) calibrating TTAed models without label information, and (iii) reliably determining hyperparameters for TTA without any labeled validation data. Through extensive experiments, we demonstrate that various TTA methods can be precisely evaluated, both in terms of their improvements and degradations. Moreover, our proposed methods on unsupervised calibration and hyperparameters tuning for TTA achieve results close to the ones assuming access to ground-truth labels, in terms of both OOD accuracy and calibration error.
1 Introduction
Machine learning models often fail to generalize to new distributions (Arjovsky et al., 2020; Gulrajani & Lopez-Paz, 2021; Sagawa et al., 2022) – so-called out-of-distribution (OOD) data — which differ from the one they were trained on, referred to as in-distribution (ID) data. This can lead to a significant degradation in their performance during test time. Recently, there has been a surge in research on test-time adaptation (TTA), a technique that adapts models to the target distribution using only unlabeled test data. These involve adaptation strategies including estimating test-time feature statistics (Schneider et al., 2020), self-supervision (Sun et al., 2020; Liu et al., 2021; Gandelsaman et al., 2022), entropy minimization (Liang et al., 2020; Wang et al., 2021; Zhang et al., 2022; Niu et al., 2022; 2023), and self-training with pseudo-labels (Liang et al., 2020; Rusak et al., 2022; Goyal et al., 2022). These efforts have aimed to enhance model robustness in the face of distribution shifts where labeled data is unavailable.
Despite the progress in TTA, several critical bottlenecks persist, undermining the reliable applications of such adaptation methods in practice. Firstly, TTA is not universally effective for all distribution shifts and can sometimes lead to performance degradation (Wang et al., 2021; Liu et al., 2021; Zhao et al., 2023). Moreover, the absence of labeled test data hinders the evaluation of model performance in practice, thereby making it unclear in advance whether these methods will work or not. Secondly, TTA methods often result in poorly calibrated models (Eastwood et al., 2022; Chen et al., 2022; Rusak et al., 2022), posing potential risks in safety-critical applications. Thirdly, TTA methods are often extremely sensitive to their hyperparameters during adaptation (Boudiaf et al., 2022; Zhao et al., 2023), and their tuning procedures lack clarity. Most of them often follow the same settings of the previous studies (Niu et al., 2022; 2023), or rely on some held-out labeled data (Iwasawa & Matsuo, 2021; Zhang et al., 2022; Goyal et al., 2022), which might be unavailable in practice. To our knowledge, there is little work addressing these shortcomings given no access to the labels during test time.
In a separate line of work, Baek et al. (2022) show that the ID and OOD agreement between classifiers (i.e., the average extent to which two classifiers make the same prediction on an unlabeled datasets) show a strong linear correlation, akin to the same phenomenon showed for ID vs. OOD accuracy, demonstrated by Miller et al. (2021). Taken together, these phenomena, the so-called agreement-on-the-line (AGL) and accuracy-on-the-line (ACL) present a method for assessing OOD accuracy without labeled data.
In this paper, we observe a noteworthy phenomenon: after applying TTA, AGL and ACL persist or even hold to a stronger degree than in their base counterparts. In other words, when we assess the accuracies and agreements of the models adapted to OOD data, the strong correlations in ID vs. OOD consistently hold across distribution shifts, including those where vanilla models do not exhibit such trends. Interestingly, these correlations occur not only when TTA improves OOD accuracy, but also when it fails to enhance or even negatively affects OOD accuracy, especially under real-world shifts. We observe such trends not just among the models with different architectures, but within those with same architecture but adapted with varying values of their adaptation hyperparameters, including learning rates, the number of adaptation steps, and others.
These findings, with strong AGL and ACL after TTA, lead to the enhancement of TTA methods for improved reliability. We can first predict the effectiveness of TTA methods, i.e., whether they succeed or fail and to what extent, across distribution shifts. Specifically, our approach uses the ALine-S and ALine-D techniques from Baek et al. (2022), and applies them to test-time adapted models. The result is that, without any labeled data at all, we can estimate the accuracy of TTAed models better than we can for vanilla models, especially for shifts where vanilla falls short (estimation error of in vanilla vs. after TENT (Wang et al., 2021) on CIFAR10-C Gaussian Noise). Such estimation results also enable the identification of shifts where TTA methods might potentially struggle to improve accuracy, such as in ImageNetV2 (Recht et al., 2019). Second, we introduce a novel variant of the temperature-scaling method, which achieves model calibration solely through estimated accuracy, representing an unsupervised approach that eliminates the need for labeled data as required by the original temperature scaling (Guo et al., 2017). We observe that it effectively reduces the expected calibration error (ECE) (Guo et al., 2017) close to the best achievable lower-bound using ground-truth labels. Finally, we introduce the reliable hyperparameter optimization strategy for adaptations without access to labels: selecting model with the highest ID accuracy. Across all TTA baselines we employ, the majority of models chosen through our approach exhibit performance comparable to those selected using ground-truth labels, with an accuracy gap of less than on CIFAR10-C.
To summarize our contributions:
-
•
We observe that AGL and ACL trends between TTAed models persist or can be stronger than those before adaptation, and such trends robustly occur across models with different architectures and TTA setups under both synthetic and real-world shift datasets.
-
•
By leveraging this phenomenon in TTA, we enhance TTA methods in OOD accuracy predictions, calibration, and reliable hyperparameter tuning—all without the need for labels. Our methods enhance OOD accuracy estimation for TTAed models across a broader range of shifts compared to those before adaptations, while also enabling the selection of highly accurate, well-calibrated models comparable to those using ground-truth labels.
2 Strong agreement-on-the-line after TTA
This section presents the motivating finding of the paper, an empirical study highlighting the fact that TTAed models often exhibit better AGL than their vanilla counterparts.
2.1 Experimental setup
Datasets and models.
We evaluate on both synthetic corruptions (CIFAR10-C, CIFAR100-C, ImageNet-C (Hendrycks & Dietterich, 2019)) with highest severity, datasets reproductions (CIFAR10.1 (Recht et al., 2018), CIFAR10.2 (Lu et al., 2020), ImageNetV2 (Recht et al., 2019)), and real-world shifts (ImageNet-R (Hendrycks et al., 2021), FMoW-WILDS (Christie et al., 2018; Sagawa et al., 2022)). We leverage a variety of different network architectures, which encompass ResNet (He et al., 2016; Zagoruyko & Komodakis, 2017), ResNext (Xie et al., 2016), VGG (Simonyan & Zisserman, 2015), GoogLeNet (Szegedy et al., 2014), DenseNet (Huang et al., 2017), and MobileNet (Sandler et al., 2018) with differing depths and widths. For evaluation on ImageNet and its shifts, we use pretrained weights publicly accessible from torchvision111https://pytorch.org/vision/stable/models.html, except for ConjPL, which require training with polylos (Leng et al., 2022). We train models for the other datasets.
Test-time adaptation baselines.
To gain generality, we test TTA methods that involve different update parameters (e.g., batch normalization (BN) layers, entire encoder parameters), objectives (e.g., entropy minimization, self-supervision task), and source-training objectives (e.g., cross-entropy loss, polyloss). These include BN_Adapt (Schneider et al., 2020), SHOT (Liang et al., 2020), TTT (Sun et al., 2020), TENT (Wang et al., 2021), ConjPL (Goyal et al., 2022), ETA (Niu et al., 2022), and SAR (Niu et al., 2023). We examine their key adaptation hyperparameters that are shared among all baselines, including learning rates, number of adapt steps, and batch size. We also test different checkpoints of the source-trained model as another possible hyperparameter to select.
Calculating agreement.
Given any pair of models that are tested on distribution , the expected agreement of the models is defined as
| (1) |
where and are final classification outputs of models and given data . Following Miller et al. (2021) and Baek et al. (2022), we apply the inverse of the cumulative density function of the standard Gaussian distribution, namely probit-transformation (), on the axes of accuracy and agreement, for a better linear fit.
Additional details on experimental setups are provided in appendix A.1.
2.2 Main observation
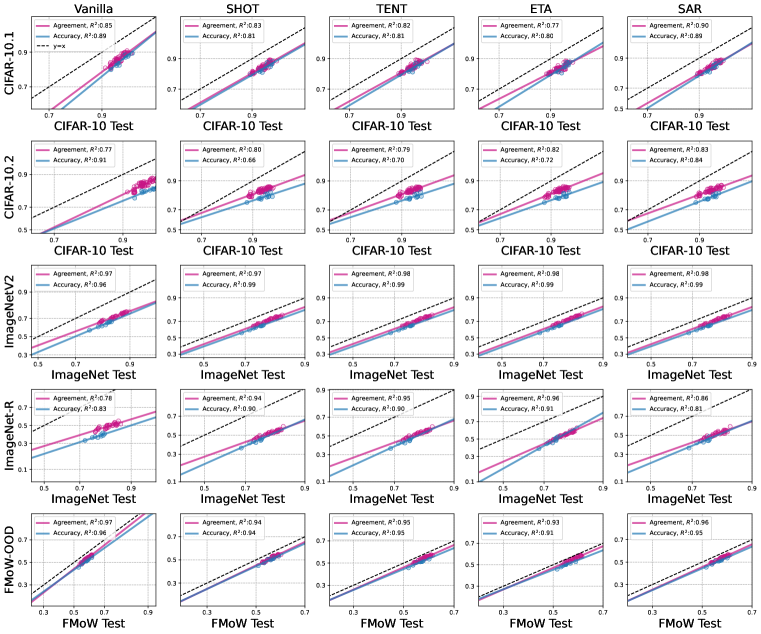
Agreement (and accuracy) on-the-line persists or holds stronger after TTA. We find that after TTA methods, there are strong correlations in agreement (and accuracy) between ID and OOD across both synthetic and real-world shifts. Most importantly, we notice that such trends become more persistent after adaptations, exhibiting strong correlations even across datasets where the models before adaptations have failed to have, as noted in Miller et al. (2021) and Baek et al. (2022).
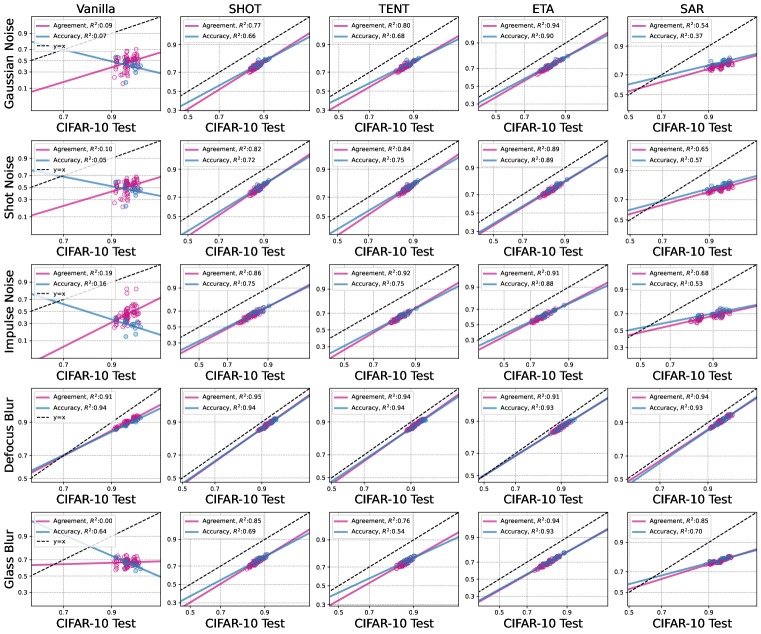
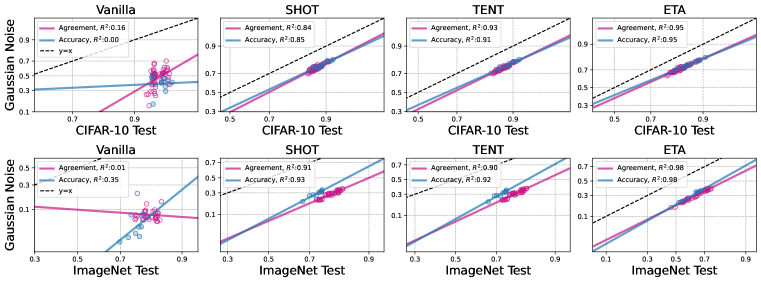
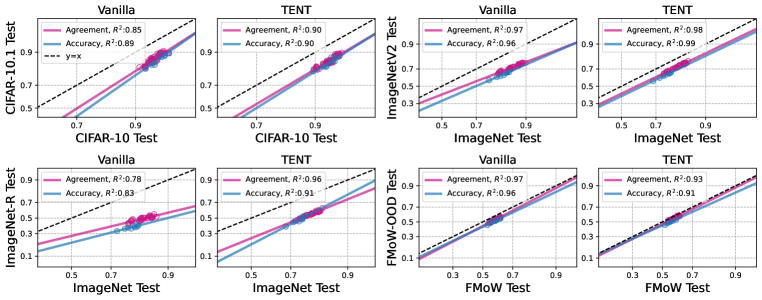
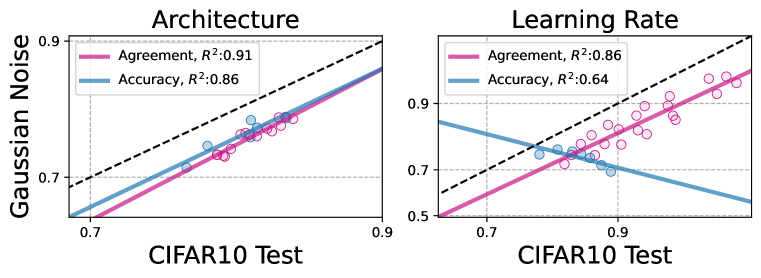
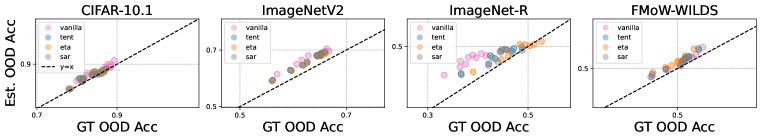
We show such phenomenon in Figure 1, when tested on CIFAR10 test vs. Gaussian Noise corruption, models with different architectures have weak correlations with their coefficients of determination () values being significantly low. After applying various TTA methods, SHOT, TENT, and ETA, these models consistently have much stronger AGL and ACL (e.g., improves after ETA), as well as the alignment between the lines. Furthermore, these linear trends also occur in real-world shifts, where TTA sometimes even fails to improve OOD accuracy, as shown in Figure 2. Here, we examine on CIFAR10.1, ImageNetV2, and ImageNet-R, and FMoW-WILDS, where models before and after TENT have similar linear trends and maintain high values. In particular, as seen in the plots of CIFAR10.1 and ImageNetV2, TENT does not improve generalization, or even results in degradation (Wang et al., 2021; Zhao et al., 2023). This highlights the consistent AGL and ACL trends across TTA methods, irrespective of TTA’s actual performance improvement across diverse distribution shifts where it may succeed or falter.
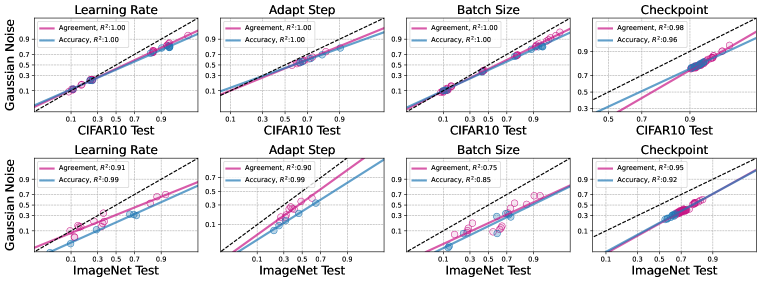
Such linear trends are also observed when varying TTA hyperparameters. We find that these trends in TTA can also be obtained by leveraging models adapted with varying values of certain hyperparameters. As mentioned in Section 2.1, we examine learning rates, the number of adaptation steps, batch size, and the checkpoints of the source-trained model.
Here we fix the model architecture while systematically varying specific hyperparameters within defined ranges (See appendix A.1). Figure 3 shows that models adapted with different hyperparameter values exhibit strong AGL trends among them, with their values close to , when tested on CIFAR10 and ImageNet against their Gaussian Noise corruptions. The resulting TTA performances vary according to the different hyperparameter values, and they seem sensitive particularly in terms of learning rates and batch sizes. Still, these results, improved or degraded, lie on the same positive correlation line in both agreement and accuracy. Such linear trends are of significant practical value in TTA. Specifically, leveraging models with different architectures necessitates the training of them separately in advance, while simply using different values of hyperparameters on a single model can eliminate such unnecessary prerequisites.
3 Reliable test-time adaptation
Based on these observations, we investigate the enhancement of existing TTA methods in three ways: (i) accurate estimation of OOD accuracy, (ii) calibration after TTA, and (iii) reliable hyperparameter optimization – all performed without assuming access to the labels.
3.1 Accuracy estimation
| Dataset | Method | ATC | DOC-feat | AC | Agreement | ALine-S | ALine-D |
|---|---|---|---|---|---|---|---|
| CIFAR10-C | Vanilla | 9.26 | 14.44 | 16.74 | 7.70 | 5.50 | 5.17 |
| SHOT | 2.91 | 5.32 | 9.94 | 1.48 | 0.73 | 0.56 | |
| TENT | 9.21 | 5.32 | 10.08 | 1.51 | 0.73 | 0.53 | |
| ETA | 10.18 | 5.10 | 11.02 | 1.50 | 0.71 | 0.56 | |
| SAR | 1.14 | 4.71 | 7.76 | 1.79 | 0.89 | 0.77 | |
| CIFAR100-C | Vanilla | 5.20 | 10.42 | 14.35 | 15.07 | 8.37 | 8.20 |
| SHOT | 4.49 | 6.57 | 18.34 | 4.87 | 0.84 | 0.69 | |
| TENT | 19.17 | 6.53 | 21.96 | 5.16 | 0.82 | 0.67 | |
| ETA | 25.40 | 4.10 | 28.32 | 6.18 | 0.70 | 1.07 | |
| SAR | 1.85 | 3.48 | 16.68 | 4.54 | 0.90 | 0.77 | |
| ImageNet-C | Vanilla | 4.27 | 13.47 | 17.76 | 22.28 | 5.87 | 5.87 |
| SHOT | 5.83 | 4.46 | 9.84 | 14.74 | 4.17 | 4.13 | |
| TENT | 10.92 | 6.30 | 20.25 | 13.74 | 4.16 | 4.18 | |
| ETA | 6.34 | 5.94 | 23.56 | 13.20 | 4.00 | 4.21 | |
| SAR | 7.04 | 3.86 | 11.00 | 12.27 | 4.31 | 5.25 | |
| ImageNet-R | Vanilla | 1.72 | 14.31 | 17.74 | 21.56 | 7.62 | 7.62 |
| SHOT | 5.29 | 12.91 | 17.85 | 17.92 | 3.22 | 3.22 | |
| TENT | 9.14 | 14.94 | 24.10 | 18.30 | 3.44 | 3.44 | |
| ETA | 11.71 | 12.61 | 34.12 | 17.49 | 2.33 | 2.17 | |
| SAR | 3.78 | 9.44 | 13.49 | 16.11 | 2.82 | 2.44 |
In this section, we illustrate how the strong AGL trend shown among TTAed models enables the precise accuracy estimation on target OOD data. We employ the estimation methods, ALine-S and ALine-D in Baek et al. (2022), but utilize them within the context of TTA models. Specifically, we leverage the stronger correlations and alignments in agreement and accuracy exhibited by TTAed models to enhance the effectiveness of these estimation methods. The details of our TTA accuracy estimation procedure are described in Algorithm 1. This approach yields improved accuracy estimation compared to vanilla models and other estimation baselines (Table 1). More importantly, we demonstrate the forecastability of TTAed models using the estimated accuracy, across various distribution shifts (Table 2). Details of ALine-S/D are provided in appendix A.2.
Strong ACL and AGL in TTA lead to precise accuracy estimation.
Table 1 reports the mean absolute error (MAE) between the actual and the estimated OOD accuracy for both vanilla and the adapted models using various TTA baselines. We evaluate them on widely used benchmarking distribution shifts in TTA literature, including CIFAR10-C, CIFAR100-C, ImageNet-C (averaged over corruptions), and ImageNet-R.
Of particular note is that, especially in CIFAR10-C and CIFAR100-C, applying ALine-S/D on TTAed models achieve substantially lower MAE compared to that of vanilla models (e.g., of ALine-D after TENT on CIFAR10-C). This suggests that application of ALine-S/D can be significantly more effective in estimating accuracy of the TTAed models, primarily attributed to their stronger AGL than vanilla models. We also compare them with other estimation baselines, such as average thresholded confidence (ATC) (Garg et al., 2021), difference of confidence (DOC)-feat (Guillory et al., 2021), average confidence (Hendrycks & Gimpel, 2017), and agreement (Jiang et al., 2022). We find that across different datasets, ALine-S and ALine-D consistently outperform existing baselines on estimating TTA performance.
| Dataset | SHOT | TENT | ETA | SAR | ||||
|---|---|---|---|---|---|---|---|---|
| GT | Est. | GT | Est. | GT | Est. | GT | Est. | |
| CIFAR10C-Snow | +3.94 | +4.32 | +4.09 | +4.45 | +4.51 | +4.69 | +2.54 | +2.80 |
| CIFAR100C-Bright | +6.59 | +8.28 | +6.79 | +8.24 | 7.55 | +8.72 | +7.34 | +8.29 |
| ImageNetC-Gauss | +24.53 | +13.45 | +25.79 | +14.64 | +30.25 | +22.82 | +31.28 | +22.19 |
| ImageNet-R | +6.94 | +2.70 | +6.19 | +2.52 | +10.35 | +5.30 | +8.9 | +2.44 |
| CIFAR10.1 | -2.30 | -1.51 | -2.10 | -1.68 | -2.25 | -1.33 | -2.30 | -1.56 |
| CIFAR10.2 | -1.70 | -1.64 | -1.80 | -1.65 | -1.40 | -0.66 | -1.90 | -1.44 |
| ImageNetV2 | -0.27 | -2.50 | -1.18 | -3.42 | -10.34 | -12.60 | -0.21 | -2.40 |
| FMoW-WILDS | -0.22 | -0.73 | +0.37 | +1.03 | +0.29 | +0.70 | +0.62 | +0.85 |
TTA effectiveness is forecastable given OOD datasets in the wild.
Here, we extend to various datasets that include common corruptions in CIFAR10-C, CIFAR100-C, ImageNet-C, and real-world shifts, such as ImageNet-R, CIFAR10.1, CIFAR10.2, ImageNetV2, and FMoW-WILDS. In Table 2, we present actual and estimated OOD accuracy improvement or degradation by each TTA baseline, including SHOT, TENT, ETA, and SAR, with respect to their base counterparts. Specifically, we first obtain the actual (by using ground-truth labels) and estimated OOD accuracy of both TTAed models and vanilla models, and calculate the differences between them.
We initially observe that TTA methods sometimes fail to enhance generalization under real-world shifts, e.g., CIFAR10.1, CIFAR10.2 and ImageNetV2, as shown as red in columns of “GT”, constrated with their effectiveness in synthetic datasets, denoted as green. Interestingly, the overall trend of such relative accuracy changes after TTA, represented by red or green, in estimated OOD accuracy in the “Est.” columns closely mirrors that of GT columns. For instance, the generalization trends of different TTA methods on FMoW-WILDS precisely align with those revealed in the estimated results, i.e., all TTA baselines except SHOT improve accuracy. This underscores the potential of our accuracy estimation on TTA, which offers practical guidance for selecting or determining the suitability of TTA methods in the face of distribution shifts from the wild, with no labeled data.
3.2 Unsupervised calibration
Proposed method. In this section, we introduce a variant of temperature-scaling (Guo et al., 2017) that calibrates models only with the estimated accuracy of the model, without any need for labeled data. Specifically, let denote the random variable for input data and be the logit output of the neural network given input X for classifying among categories. We define a simple root-finding problem that finds an optimal temperature value which scales the model’s averaged confidence to match the estimated accuracy . This can be written as
| (2) |
and we use Newton’s method to solve this problem. Once the optimal is found, we then temperature-scale the using this value to have final prediction probability.
Note that, instead of the negative log-likelihood loss used in the original temperature scaling method (Guo et al., 2017), our approach minimizes discrepancies between the model’s averaged confidence and accuracy over the entire test set. This formulation bears analogy to the definition of the ECE metric (Guo et al., 2017), which calculates (a weighted average of) such discrepancies but within multiple confidence intervals. Our method can be regarded as directly minimizing such calibration error metric but using a single bin that includes the entire samples. Furthermore, it is worth noting that the standard temperature scaling methods (Guo et al., 2017) rely on a held-out labeled validation set for calibration predictions on test data, while our method leverages unlabeled test data directly for calibration.
| Method | CIFAR10-C | CIFAR100-C | ImageNet-C | ||||||
| Uncalib. | Ours | Oracle | Uncalib. | Ours | Oracle | Uncalib. | Ours | Oracle | |
| Vanilla | 17.48 | 9.71 | 3.42 | 15.25 | 15.82 | 3.09 | 14.97 | 7.92 | 1.79 |
| BN_Adapt | 7.99 | 2.73 | 2.49 | 9.59 | 2.85 | 2.37 | 3.21 | 1.98 | 1.67 |
| TENT | 7.76 | 3.11 | 2.77 | 13.40 | 2.10 | 2.06 | 7.38 | 4.56 | 2.94 |
| ETA | 7.72 | 3.13 | 2.74 | 15.66 | 4.93 | 4.48 | 12.80 | 8.23 | 7.40 |
| 21.80 | 12.99 | 3.96 | 25.70 | 15.66 | 2.90 | 30.32 | 11.63 | 2.03 | |
| ConjPL | 11.89 | 4.43 | 3.56 | 25.48 | 3.01 | 3.00 | 17.13 | 5.50 | 3.84 |
Experimental results. In Table 3, we present a comparison of the calibration error between vanilla and adapted models using various TTA methods, including BN_Adapt, TENT, ETA, and ConjPL. In this experiment, we employ different checkpoints of a source-trained model, one of the hyperparameters we observed for having strong AGL and ACL (Figure 3). Note that for ConjPL, we use the pretrained model with polyloss (Leng et al., 2022), thus we have “Vanilla” and “” to differentiate models that are pretrained with cross-entropy and polyloss, respectively. For each model, we provide ECE values for (i) no calibration, (ii) calibration using our method, and (iii) calibration using an oracle approach. The “oracle” approach represents the lower-bound of the best achievable ECE through temperature scaling, where we sweep over the grids of temperature candidates and find that minimizes ECE using ground-truth labels.
The results first demonstrate that adaptations via minimizing entropy can result in worse calibration, as evidenced by the “Uncalib.” results for CIFAR100-C and ImageNet-C. In these cases, TENT, ETA, and ConjPL lead to an increase in ECE compared to that of BN_Adapt. This indicates that models make overconfident predictions, particularly on samples that are incorrectly classified. This is mainly attributed to entropy minimization employed in TENT, ETA, and ConjPL, applied across all samples regardless of their correctness (Prabhu et al., 2021; Rusak et al., 2022; Chen et al., 2022). After applying our calibration method, however, their calibration errors substantially decrease to levels close to the lower-bound achieved by the oracle in every dataset. Interestingly, when we apply our method to vanilla models, where the presence of AGL and ACL are less pronounced, a substantial disparity still remains in the calibration results between our method and the lower bound represented by the oracle. This emphasizes the effectiveness of our unsupervised calibration method specifically in the setting of TTA where we observe prominent AGL and ACL.
3.3 Reliable hyperparameter optimization
Given the ACL phenomena of TTAed models across varying hyperparameter values, as depicted in Figure 3, selecting the best-performing model on ID data emerges as a straightforward and effective strategy for model selection in OOD shifts. While this strategy has been acknowledged in a few prior studies (Miller et al., 2021; Wenzel et al., 2022), our contribution lies in its novel application for optimizing hyperparameters within the TTA framework. Notably, hyperparameter tuning has remained a significant challenge even in the most recent TTA studies (Boudiaf et al., 2022; Zhao et al., 2023), owing to the absence of OOD test data. To find the best hyperparameters, we first explore a wide range of hyperparameter candidates, by systematically sweeping through various values for each parameter. Then, we simply select the model that best performs in ID.
Table 4 reports the OOD accuracy gap between the models selected by our approach vs. best-performing in OOD using ground-truth labels, tested on CIFAR10-C. The results show that across different corruptions and TTA baselines, selecting the best-performing hyperparameters in ID consistently results in models with high OOD accuracy less than MAE compared to those selected with labeled data. Even for sensitive hyperparameters, such as learning rates and batch sizes, where incorrect selections can lead to significant performance degradation (as shown in Figure 3), our approach consistently identifies near-optimal parameters for different TTA baselines. Still, in TTT where we vary different learning rates, our method fails to select optimal hyperparameters, resulting in large MAE. This failure is primarily attributed to the absence of a strong ACL among models using varying learning rates, which is evidenced by Figure 4. We will discuss this failure case further in Section 5.
| HyperParameter | TTA Method | ||||||
|---|---|---|---|---|---|---|---|
| BN_Adapt | SHOT | TENT | ETA | ConjPL | SAR | TTT | |
| Learning Rate | – | 0.65 | 0.72 | 0.72 | 0.42 | 0.24 | 3.71 |
| Adapt Step | – | 0.23 | 0.23 | 0.24 | 0.12 | 0.43 | 0.04 |
| Architecture | 0.21 | 0.03 | 0.03 | 0.01 | 0.04 | 0.20 | 0.49 |
| Batch Size | 0.0 | 0.73 | 0.77 | 0.77 | 0.18 | 0.06 | – |
| Checkpoints | 0.0 | 0.07 | 0.05 | 0.01 | 0.11 | 0.01 | 0.48 |
4 Related Work
Test-time adaptation and its pitfalls of reliability
Test-time adaptation (TTA) enhances model robustness by adapting models to unlabeled test data. One research direction uses self-supervision tasks during both training and testing (Sun et al., 2020; Liu et al., 2021; Gandelsaman et al., 2022), while another explores “fully” test-time adaptations that require no specific pretraining procedures, relying on objectives such as entropy minimization (Wang et al., 2021; Niu et al., 2022; 2023), data augmentation invariance (Zhang et al., 2022; Chen et al., 2022), and self-training with pseudo-labels (Rusak et al., 2022; Goyal et al., 2022; Wang & Wibisono, 2023).
Some studies have extended their evaluation beyond corruptions to include more challenging shifts, such as datasets reproductions (Liu et al., 2021; Zhang et al., 2022), domain generalization benchmarks (Iwasawa & Matsuo, 2021; Zhao et al., 2023), and WILDS (Rusak et al., 2022). Yet, as pointed out in Zhao et al. (2023), TTA methods may not effectively address the full spectrum of distribution shifts in the wild. Another persistent issue is that TTA, especially those based on entropy minimization, can lead to overconfident predictions. Specifically, while Nado et al. (2021) showed that using test-time batch statistics enhances calibration under distribution shifts (Ovadia et al., 2019), several work (Rusak et al., 2022; Chen et al., 2022) observed that entropy minimization diminishes this effect. Moreover, the performance of TTA methods can be severely impacted by the negligent selection of hyperparameters such as learning rates (Boudiaf et al., 2022; Zhao et al., 2023), adaptation steps (Zhao et al., 2023), or batch sizes (Niu et al., 2023; Khurana et al., 2022). A recent study (Boudiaf et al., 2022) addresses this issue by adapting only the model’s outputs instead of its parameters. Our study leverages the remarkable observation of the agreement-on-the-line phenomena within TTA, offering promising solutions to these reliability issues.
Accuracy and agreement-on-the-line
As mentioned above, the basic accuracy-on-the-line and agreement-on-the-line phenomena were first identified in Miller et al. (2021) and Baek et al. (2022) respectively. However, the underlying reason for such phenomenon remain unclear, and certain datasets reveal weak accuracy and agreement-on-the-line trends, as observed in CIFAR10 test vs. Gaussian Noise corruption in CIFAR10-C. Recent work (Wenzel et al., 2022; Teney et al., 2023; Liang et al., 2023) have investigated the broader types of distribution shifts, identifying shifts that show different trends beyond the linear correlations. In this study, we investigate the impact of model adaptation on reinforcing (or maintaining) linear correlations, and identify novel conditions that lead to such trends–adapting with varying TTA hyperparameters.
5 Limitations
Even though we consistently observe the linear trends across various models and distribution shifts during TTA, we also find an exceptional case where such trends do not manifest. As shown in Figure 4 right, we empirically observe that varying learning rates in TTT (Sun et al., 2020) exhibits that the ID and OOD accuracies are negatively correlated, leading to a complete misalignment with the agreement line. While in other experimental setups, such as using different architectures, we still observe the strong AGL and ACL among the models, as shown in Figure 4 left. Such negative correlation results in the accuracy of the models selected using our method, i.e., best-performing ID accuracy, suffer significant deviation from the best-performing OOD accuracy, as shown in Table 4.
6 Conclusion and Discussions
In this work, we observe that adapting models during test time maintains or even reinforces the strong linear ID vs. OOD correlations in their accuracy and agreement, across models and distributions. Such observations motivate us to enhance the TTA methods’ reliability in surprisingly simple but effective ways, specifically in three perspectives: accurate performance estimation of TTA methods, calibration of confidence in TTAed models, and reliable hyperparameter tuning, all without need for labels. We conduct extensive experiments across distribution shifts, TTA baselines and their hyperparameters, and demonstrate the effective estimation of the TTAed models’ performances. We then forecast their successes (as well as their possible failures) of generalization under various shifts including real-world datasets. Moreover, we perform model calibration and reliable hyperparameter optimization, achieving results comparable to the level of those assuming access to the ground-truth labels.
Our results show that existing adaptation strategies under distribution shifts lead to strong AGL and ACL linear trends. This naturally raises questions about how to theoretically characterize the conditions under which adaptations enhance these linear trends. We believe this is a promising future research directions that can ascertain the reliable observations of AGL, leading to reliable TTA across any types of distribution shifts. Additionally, we recognize that, to observe AGL and ACL, access to ID test data (and its labels for ACL) is required. This might raise privacy concerns due to the potential inclusion of sensitive information, and also demand additional computational resources. Therefore, overcoming such dependencies on ID data and exploring “fully” test-time approach of observing AGL and ACL remain promising directions for future research.
Acknowledgments. Eungyeup Kim and Mingjie Sun are supported by funding from the Bosch Center for Artificial Intelligence. Aditi Raghunathan gratefully acknowledges support from Open Philanthropy, Google, Apple and Schmidt AI2050 Early Career Fellowship.
References
- Arjovsky et al. (2020) Martin Arjovsky, Léon Bottou, Ishaan Gulrajani, and David Lopez-Paz. Invariant risk minimization, 2020.
- Baek et al. (2022) Christina Baek, Yiding Jiang, Aditi Raghunathan, and J. Zico Kolter. Agreement-on-the-line: Predicting the performance of neural networks under distribution shift. In Advances in Neural Information Processing Systems, volume 35, pp. 19274–19289, 2022.
- Boudiaf et al. (2022) Malik Boudiaf, Romain Mueller, Ismail Ben Ayed, and Luca Bertinetto. Parameter-free online test-time adaptation. In Proceedings of the IEEE/CVF Conference on Computer Vision and Pattern Recognition (CVPR), pp. 8344–8353, June 2022.
- Chen et al. (2022) Dian Chen, Dequan Wang, Trevor Darrell, and Sayna Ebrahimi. Contrastive test-time adaptation. In CVPR, 2022.
- Christie et al. (2018) Gordon Christie, Neil Fendley, James Wilson, and Ryan Mukherjee. Functional map of the world. In CVPR, 2018.
- Eastwood et al. (2022) Cian Eastwood, Ian Mason, Christopher K. I. Williams, and Bernhard Schölkopf. Source-free adaptation to measurement shift via bottom-up feature restoration. In International Conference on Learning Representations, 2022.
- Foret et al. (2021) Pierre Foret, Ariel Kleiner, Hossein Mobahi, and Behnam Neyshabur. Sharpness-aware minimization for efficiently improving generalization. In International Conference on Learning Representations, 2021.
- Gandelsaman et al. (2022) Yossi Gandelsaman, Yu Sun, Xinlei Chen, and Alexei A. Efros. Test-time training with masked autoencoders. In Advances in Neural Information Processing Systems, 2022.
- Garg et al. (2021) Saurabh Garg, Sivaraman Balakrishnan, Zachary Chase Lipton, Behnam Neyshabur, and Hanie Sedghi. Leveraging unlabeled data to predict out-of-distribution performance. In NeurIPS 2021 Workshop on Distribution Shifts: Connecting Methods and Applications, 2021.
- Goyal et al. (2022) Sachin Goyal, Mingjie Sun, Aditi Raghunanthan, and Zico Kolter. Test-time adaptation via conjugate pseudo-labels. Advances in Neural Information Processing Systems, 2022.
- Guillory et al. (2021) Devin Guillory, Vaishaal Shankar, Sayna Ebrahimi, Trevor Darrell, and Ludwig Schmidt. Predicting with confidence on unseen distributions. In Proceedings of the IEEE/CVF International Conference on Computer Vision (ICCV), pp. 1134–1144, October 2021.
- Gulrajani & Lopez-Paz (2021) Ishaan Gulrajani and David Lopez-Paz. In search of lost domain generalization. In International Conference on Learning Representations, 2021.
- Guo et al. (2017) Chuan Guo, Geoff Pleiss, Yu Sun, and Kilian Q. Weinberger. On calibration of modern neural networks. In Proceedings of the 34th International Conference on Machine Learning, volume 70 of Proceedings of Machine Learning Research, pp. 1321–1330. PMLR, 06–11 Aug 2017.
- He et al. (2016) Kaiming He, Xiangyu Zhang, Shaoqing Ren, and Jian Sun. Deep Residual Learning for Image Recognition. In Proceedings of 2016 IEEE Conference on Computer Vision and Pattern Recognition, CVPR ’16, pp. 770–778. IEEE, June 2016. doi: 10.1109/CVPR.2016.90.
- Hendrycks & Dietterich (2019) Dan Hendrycks and Thomas Dietterich. Benchmarking neural network robustness to common corruptions and perturbations. Proceedings of the International Conference on Learning Representations, 2019.
- Hendrycks & Gimpel (2017) Dan Hendrycks and Kevin Gimpel. A baseline for detecting misclassified and out-of-distribution examples in neural networks. Proceedings of International Conference on Learning Representations, 2017.
- Hendrycks et al. (2021) Dan Hendrycks, Steven Basart, Norman Mu, Saurav Kadavath, Frank Wang, Evan Dorundo, Rahul Desai, Tyler Zhu, Samyak Parajuli, Mike Guo, Dawn Song, Jacob Steinhardt, and Justin Gilmer. The many faces of robustness: A critical analysis of out-of-distribution generalization. ICCV, 2021.
- Huang et al. (2017) Gao Huang, Zhuang Liu, Laurens van der Maaten, and Kilian Q Weinberger. Densely connected convolutional networks. In Proceedings of the IEEE Conference on Computer Vision and Pattern Recognition, 2017.
- Iwasawa & Matsuo (2021) Yusuke Iwasawa and Yutaka Matsuo. Test-time classifier adjustment module for model-agnostic domain generalization. In Advances in Neural Information Processing Systems, volume 34, pp. 2427–2440. Curran Associates, Inc., 2021.
- Jiang et al. (2022) Yiding Jiang, Vaishnavh Nagarajan, Christina Baek, and J Zico Kolter. Assessing generalization of SGD via disagreement. In International Conference on Learning Representations, 2022.
- Khurana et al. (2022) Ansh Khurana, Sujoy Paul, Piyush Rai, Soma Biswas, and Gaurav Aggarwal. Sita: Single image test-time adaptation, 2022.
- Leng et al. (2022) Zhaoqi Leng, Mingxing Tan, Chenxi Liu, Ekin Dogus Cubuk, Jay Shi, Shuyang Cheng, and Dragomir Anguelov. Polyloss: A polynomial expansion perspective of classification loss functions. In International Conference on Learning Representations, 2022.
- Liang et al. (2020) Jian Liang, Dapeng Hu, and Jiashi Feng. Do we really need to access the source data? source hypothesis transfer for unsupervised domain adaptation. In International Conference on Machine Learning (ICML), pp. 6028–6039, 2020.
- Liang et al. (2023) Weixin Liang, Yining Mao, Yongchan Kwon, Xinyu Yang, and James Zou. Accuracy on the curve: On the nonlinear correlation of ml performance between data subpopulations, 2023.
- Liu et al. (2021) Yuejiang Liu, Parth Kothari, Bastien Germain van Delft, Baptiste Bellot-Gurlet, Taylor Mordan, and Alexandre Alahi. Ttt++: When does self-supervised test-time training fail or thrive? In Thirty-Fifth Conference on Neural Information Processing Systems, 2021.
- Lu et al. (2020) Shangyun Lu, Bradley Nott, Aaron Olson, Alberto Todeschini, Hossein Vahabi, Yair Carmon, and Ludwig Schmidt. Harder or different? a closer look at distribution shift in dataset reproduction. In ICML Workshop on Uncertainty and Robustness in Deep Learning, 2020.
- Miller et al. (2021) John P Miller, Rohan Taori, Aditi Raghunathan, Shiori Sagawa, Pang Wei Koh, Vaishaal Shankar, Percy Liang, Yair Carmon, and Ludwig Schmidt. Accuracy on the line: on the strong correlation between out-of-distribution and in-distribution generalization. In Proceedings of the 38th International Conference on Machine Learning, volume 139 of Proceedings of Machine Learning Research, pp. 7721–7735. PMLR, 18–24 Jul 2021.
- Nado et al. (2021) Zachary Nado, Shreyas Padhy, D. Sculley, Alexander D’Amour, Balaji Lakshminarayanan, and Jasper Snoek. Evaluating prediction-time batch normalization for robustness under covariate shift, 2021.
- Niu et al. (2022) Shuaicheng Niu, Jiaxiang Wu, Yifan Zhang, Yaofo Chen, Shijian Zheng, Peilin Zhao, and Mingkui Tan. Efficient test-time model adaptation without forgetting. In The Internetional Conference on Machine Learning, 2022.
- Niu et al. (2023) Shuaicheng Niu, Jiaxiang Wu, Yifan Zhang, Zhiquan Wen, Yaofo Chen, Peilin Zhao, and Mingkui Tan. Towards stable test-time adaptation in dynamic wild world. In Internetional Conference on Learning Representations, 2023.
- Ovadia et al. (2019) Yaniv Ovadia, Emily Fertig, Jie Ren, Zachary Nado, D. Sculley, Sebastian Nowozin, Joshua Dillon, Balaji Lakshminarayanan, and Jasper Snoek. Can you trust your model's uncertainty? evaluating predictive uncertainty under dataset shift. In Advances in Neural Information Processing Systems, volume 32. Curran Associates, Inc., 2019.
- Prabhu et al. (2021) Viraj Prabhu, Shivam Khare, Deeksha Kartik, and Judy Hoffman. Sentry: Selective entropy optimization via committee consistency for unsupervised domain adaptation. In Proceedings of the IEEE/CVF International Conference on Computer Vision, pp. 8558–8567, 2021.
- Recht et al. (2018) Benjamin Recht, Rebecca Roelofs, Ludwig Schimidt, and Vaishaal Shankar. Do cifar-10 classifiers generalize to cifar-10? arXiv preprint arXiv: 1806.00451, 2018.
- Recht et al. (2019) Benjamin Recht, Rebecca Roelofs, Ludwig Schmidt, and Vaishaal Shankar. Do ImageNet classifiers generalize to ImageNet? In Proceedings of the 36th International Conference on Machine Learning, volume 97 of Proceedings of Machine Learning Research, pp. 5389–5400. PMLR, 09–15 Jun 2019.
- Rusak et al. (2022) Evgenia. Rusak, Steffen Schneider, George Pachitariu, Luisa Eck, Peter Gehler, Oliver Bringmann, Wieland Brendel, and Matthias Bethge. If your data distribution shifts, use self-learning. Transactions of Machine Learning Research, 2022.
- Sagawa et al. (2022) Shiori Sagawa, Pang Wei Koh, Tony Lee, Irena Gao, Sang Michael Xie, Kendrick Shen, Ananya Kumar, Weihua Hu, Michihiro Yasunaga, Henrik Marklund, Sara Beery, Etienne David, Ian Stavness, Wei Guo, Jure Leskovec, Kate Saenko, Tatsunori Hashimoto, Sergey Levine, Chelsea Finn, and Percy Liang. Extending the wilds benchmark for unsupervised adaptation. In International Conference on Learning Representations (ICLR), 2022.
- Sandler et al. (2018) Mark Sandler, Andrew Howard, Menglong Zhu, Andrey Zhmoginov, and Liang-Chieh Chen. Mobilenetv2: Inverted residuals and linear bottlenecks. In Proceedings of the IEEE Conference on Computer Vision and Pattern Recognition (CVPR), June 2018.
- Schneider et al. (2020) Steffen Schneider, Evgenia Rusak, Luisa Eck, Oliver Bringmann, Wieland Brendel, and Matthias Bethge. Improving robustness against common corruptions by covariate shift adaptation. In Advances in Neural Information Processing Systems, volume 33, pp. 11539–11551. Curran Associates, Inc., 2020.
- Simonyan & Zisserman (2015) Karen Simonyan and Andrew Zisserman. Very deep convolutional networks for large-scale image recognition. In International Conference on Learning Representations, 2015.
- Sun et al. (2020) Yu Sun, Xiaolong Wang, Zhuang Liu, John Miller, Alexei A. Efros, and Moritz Hardt. Test-time training with self-supervision for generalization under distribution shifts. In International Conference on Machine Learning (ICML), 2020.
- Szegedy et al. (2014) Christian Szegedy, Wei Liu, Yangqing Jia, Pierre Sermanet, Scott Reed, Dragomir Anguelov, Dumitru Erhan, Vincent Vanhoucke, and Andrew Rabinovich. Going deeper with convolutions, 2014.
- Teney et al. (2023) Damien Teney, Yong Lin, Seong Joon Oh, and Ehsan Abbasnejad. Id and ood performance are sometimes inversely correlated on real-world datasets, 2023.
- Wang et al. (2021) Dequan Wang, Evan Shelhamer, Shaoteng Liu, Bruno Olshausen, and Trevor Darrell. Tent: Fully test-time adaptation by entropy minimization. In International Conference on Learning Representations, 2021.
- Wang & Wibisono (2023) Jun-Kun Wang and Andre Wibisono. Towards understanding gd with hard and conjugate pseudo-labels for test-time adaptation. In Internetional Conference on Learning Representations, 2023.
- Wenzel et al. (2022) Florian Wenzel, Andrea Dittadi, Peter V. Gehler, Carl-Johann Simon-Gabriel, Max Horn, Dominik Zietlow, David Kernert, Chris Russell, Thomas Brox, Bernt Schiele, Bernhard Schölkopf, and Francesco Locatello. Assaying out-of-distribution generalization in transfer learning. In Neural Information Processing Systems, 2022.
- Xie et al. (2016) Saining Xie, Ross Girshick, Piotr Dollár, Zhuowen Tu, and Kaiming He. Aggregated residual transformations for deep neural networks. arXiv preprint arXiv:1611.05431, 2016.
- Zagoruyko & Komodakis (2017) Sergey Zagoruyko and Nikos Komodakis. Wide residual networks, 2017.
- Zhang et al. (2022) Marvin Zhang, Sergey Levine, and Chelsea Finn. MEMO: Test time robustness via adaptation and augmentation. In Advances in Neural Information Processing Systems, 2022.
- Zhao et al. (2023) Hao Zhao, Yuejiang Liu, Alexandre Alahi, and Tao Lin. On pitfalls of test-time adaptation. In International Conference on Machine Learning (ICML), 2023.
Appendix A Appendix
A.1 Experimental setup
This section provides the experimental details used throughout the paper, including distribution shifts, network architectures, and adaptation setups.
Distribution shifts.
We test the models on different distribution shifts that include synthetic corruptions and real-world shifts. Synthetic corruptions datasets, CIFAR10-C, CIFAR100-C, and ImageNet-C (Hendrycks & Dietterich, 2019) are designed to apply the different types of corruptions, such as Gaussian Noise, on their original dataset counterparts. We use the most severe corruptions, which have severity of , in all experiments. These corruptions datasets are most commonly evalutated distribution shifts in a wide range of TTA papers (Schneider et al., 2020; Sun et al., 2020; Liu et al., 2021; Liang et al., 2020; Wang et al., 2021; Goyal et al., 2022; Niu et al., 2022; 2023; Zhao et al., 2023).
We also test on real-world shifts, which include CIFAR10.1 (Recht et al., 2018), CIFAR10.2 (Lu et al., 2020), ImageNetV2 (Recht et al., 2019), ImageNet-R (Hendrycks et al., 2021), and FMoW-WILDS (Sagawa et al., 2022). CIFAR10.1, CIFAR10.2, and ImageNetV2 are the reproduced datasets of their base counterparts by following the original dataset creation procedures. ImageNet-R is the variant of ImageNet which contains the images with renditions of various styles, such as paintings or cartoons. FMoW-WILDS (Sagawa et al., 2022) contains the spatio-temporal satellite imagery of different use of land or building categories, where distribution shifts originate from the years that the imagery is taken. Specifically, following Miller et al. (2021), we use ID set consists of images taken from to , and OOD set taken between and .
Network architectures.
We use a different set of the network architectures for specific datasets and their shifts in Sections 2 and 3.1. Specifically, for CIFAR10 and CIFAR100 vs. their OOD shifts, we use ResNet-18,26,34,50,101 (He et al., 2016), WideResNet-28-10 (Zagoruyko & Komodakis, 2017), MobileNetV2 (Sandler et al., 2018), VGG11,13,16,19 (Simonyan & Zisserman, 2015). For ImageNet and FMoW-WILDS vs. their OOD shifts, we leverage ResNet-18,34,50,101,152, WideResNet-50,101, DenseNet121 (Huang et al., 2017), ResNeXt50-32x4d (Xie et al., 2016). As mentioned in Section 2.1, we use the pretrained model weights from torchvision, except for TTT (Sun et al., 2020) and ConjPL (Goyal et al., 2022). In addition, since TTT requires the rotation-prediction task during pretraining on source data, we train them ourselves using ResNet-14,26,32,50,104, and 152, which are available in their original implementation222https://github.com/yueatsprograms/ttt_cifar_release and use them for Section 3.3. For Figure 3 and Tables 2, 3, and 4, we use the default network architecture, which is ResNet-26 for CIFAR10 and CIFAR100, and ResNet-50 for ImageNet and FMoW.
Optimizer and learning rates.
We use SGD optimizer with momentum of for all TTA baselines except for SAR, which uses sharpness-aware minimization (SAM) optimizer (Foret et al., 2021). For Tables 1, 4, and Figure 3, we adapt the models adapted with different learning rates. Specifically, for Table 1, we evaluate the models with different architectures but adapted with the same learning rates, and then we average their estimation results across learning rates. For Table 4 and Figure 3, we evaluate the models (with same architecture) adapted with different learning rates, and observe the linear trends. For these experiments, we sweep over in the grid of for CIFAR10, CIFAR100, and their OOD shifts, while using for ImageNet and their OOD counterparts. For Figures 1, 2 and Tables 2, 3, we use the fixed learning rates of for CIFAR10, CIFAR100 and their OOD counterparts, and for ImageNet, FMoW and their counterparts.
Batch sizes.
In Figure 3 and Table 4, we test a wide spectrum of different values of batch sizes, by sweeping over the grid of . For the rest of the experiments, we fix the batch size of for TTA on CIFAR10, CIFAR100 and their OOD, and on ImageNet, FMoW for their OOD. Note that for TTT, we use a single batch following the original paper setup.
Number of adapt steps.
In Figure 3 and Table 4, we sweep through one to five adaptation steps for every TTA baseline we use. For the rest of the experiments, we use a single step of the adaptations. We utilize the online adaptation (i.e., no initialization for each batch) strategy for all baselines.
A.2 OOD Accuracy estimation methods
ALine-S and ALine-D
Average thresholded confidence (ATC)
Garg et al. (2021) introduce OOD accuracy estimation method, ATC, which learns the confidence threshold and predicts the OOD accuracy by using the fraction of unlabeled OOD samples for which model’s negative entropy is less that threshold. Specifically, let denote the softmax output of model given data from for classifying among classes. The method can be written as below:
| (3) |
where is the negative entropy, i.e., , and satisfies
| (4) |
Difference of confidence (DOC)-feat
Guillory et al. (2021) observe that the shift of distributions is encoded in the difference of model’s confidences between them. Based on this observation, they leverage such differences in confidences as the accuracy gap under distribution shifts for calculating the final OOD accuracy. Specifically,
| (5) |
Average confidence (AC)
Hendrycks & Gimpel (2017) estimate the OOD accuracy based on model’s averaged confidence, which can be written as
| (6) |
Agreement
Jiang et al. (2022) observe that disagreement between the models that are trained with different setups closely tracks the error of models in ID. We adopt this as the baseline for assessing generalization under distribution shifts, where we can estimate , where denotes the set of predictions of the models on OOD data .
A.3 Accuracy estimation results on real-world shifts.
Given the strong AGL and ACL trends that persist under real-world shifts (Figure 2), we demonstrate the estimation results of the TTAed models’ OOD accuracy by comparing them with the ground-truth accuracy on such shifts. In Figure 5, we compare the estimated and ground-truth OOD accuracy of vanilla and the adapted models using TENT, ETA, and SAR. It shows that their accuracies can be closely estimated to the actual accuracies (i.e., closer to ) on CIFAR10.1, ImageNetV2, ImageNet-R, and FMoW-WILDS. In particular, as shown in ImageNetV2 and ImageNet-R, the estimation results of TTAed models are located closer to than those of vanilla, indicating TTAed models’ accurate estimation performances compared to those of vanilla models.
A.4 Analysis on the number of TTAed models for accurate estimation.
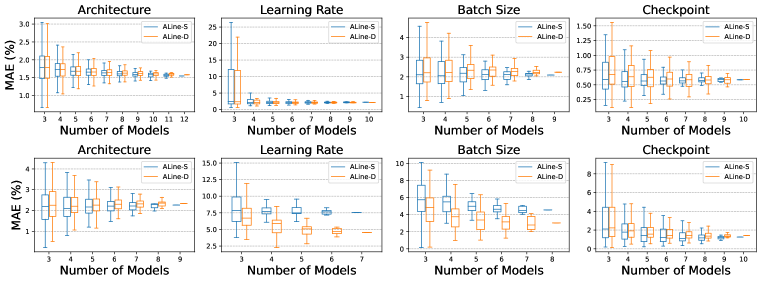
In this section, we investigate how the accuracy estimation of test-time adapted model’s performances change as we vary the number of the models used in estimation. To this end, we examine the models with different architectures as well as the hyperparameters examined in Section 3.3, which include learning rates, batch sizes, and the checkpoints of the source-trained models. We vary the size of models, , and for each size, we calculate all possible sets of models’ estimation error.
Figure 6 illustrates the changes of the distributions of the estimation error (MAE) with respect to the number of models used for implementing AGL and ACL. We test TENT on CIFAR10 test vs. CIFAR10-C Gaussian Noise, and ETA on ImageNet test vs. ImageNet-C Gaussian Noise. We observe that even using the minimum number of models for estimation, which is three, the estimation results achieve the low MAE, particularly when using different architectures or the checkpoints of the source-trained models. In addition, we note the rapid decrease in MAE is easily attainable by adding only a small number of additional models, which is pronounced when using learning rates or batch size (in ImageNet-C). These results indicate that during TTA, accurate estimation of OOD accuracy can be achieved with a reasonable number of models, each with different hyperparameter values, thereby offering practical feasibility during testing.
A.5 Additional experimental results
Strong ACL and AGL after TTA.
In this section, we supplement the Section 2 by providing additional results of TTAed models exhibiting strong AGL and ACL linear trends across datasets and TTA methods. Specifically, in Figures 7 and 8, we provide the results of SHOT, TENT, ETA, and SAR comparing with those of vanilla, across every corruption types of CIFAR10-C with highest severity. The axes are probit-scaled, and each blue and pink dot represent the accuracy and agreement of the model, respectively. In Figure 9, we add the results on CIFAR10.2 along with other TTA methods’ results on the real-world shifts to supplement the Figure 2. We consistently observe that AGL and ACL consistently persist or even become stronger than vanilla models, when applying various TTA methods across distribution shifts, evidenced by the high values in most of the cases.