Hydrocarbon chemistry in inner regions of planet forming disks
Abstract
Context. The analysis of the mid-infrared spectra helps understanding the composition of the gas in the inner, dense and warm terrestrial planet forming region of disks around young stars. ALMA has detected hydrocarbons in the outer regions of the planet forming disk and Spitzer detected \ceC2H2 in the inner regions. JWST- MIRI provides high spectral resolution observations of \ceC2H2 and a suite of more complex hydrocarbons are now reported. Interpreting the fluxes observed in the spectra is challenging and radiation thermo-chemical codes are needed to properly take into account the disk structure, radiative transfer, chemistry and thermal balance. Various disk physical parameters like the gas-to-dust ratio, dust evolution including radial drift, dust growth and settling can affect the fluxes observed in the mid-IR. Still, thermo-chemical disk models were not always successful in matching all observed molecular emission bands simultaneously.
Aims. The goal of this project is two-fold. We analyse the warm carbon chemistry in the inner regions of the disk, i.e. within 10 au to find pathways forming \ceC2H2 potentially missing from the existing chemical networks. Second, we analyse the effect of the new chemistry on the line fluxes of acetylene.
Methods. We use radiative thermo-chemical disk code PRODIMO to expand the hydrocarbon chemistry that occurs in a typical standard T Tauri disks. We used the UMIST and the KIDA rate databases for collecting reactions for the species. We include a number of three-body and thermal decomposition reactions from STAND2020 network. We included isotopomers for the species that were present in the databases. The chemistry is then analysed in the regions that produce observable features in the mid-infrared spectra. The effect of expanding the hydrocarbon chemistry on the mid-infrared spectra is studied.
Results. Acetylene is formed via two pathways in the surface layers of disks: neutral-neutral and ion-neutral. They proceed via the hydrogenation of C or \ceC+, respectively. Thus, the abundances of C, \ceC+, H and \ceH2 affect the formation of \ceC2H2. Therefore, also the formation of \ceH2 indirectly affects the abundance of acetylene. Chemisorbed H is more efficient in forming \ceH2 compared to physisorbed H at warm temperatures and hence increases the abundance of \ceC2H2.
Conclusions. We provide a new extended warm chemical network that considers up to eight carbon atom long species, takes into account different isotopomers and can form the building block of PAHs \ceC6H6. For a standard T Tauri disk with a canonical value of gas-to-dust mass, the line fluxes increase only a factor of less than 2. JWST is now detecting hydrocarbons like methane, acetylene and \ceC4H2 in disks having high C/O ratio. Hence this new extended warm hydrocarbon network will aid in interpreting the observed mid-infrared fluxes.
Key Words.:
astrochemistry – inner disk – hydrocarbons – mid-IR spectra – JWST-MIRI1 Introduction
The inner region of a planet forming disk (10 au) is warm (200-1000 K), dense (108-1015 cm-3) and is the nursery for the terrestrial planets (Henning & Semenov 2013). Understanding the rich molecular chemistry in this region can help predict the composition of terrestrial planets. Studies of the chemistry in this region are possible with mid-infrared spectroscopy which traces the warm surface layers.
Carbon is one of the most abundant elements and is essential for life. The warm molecular layer is abundant in \ceH2, carbon and shielded from UV photons by dust, \ceH2 (Draine & Bertoldi 1996), \ceH2O (Bethell & Bergin 2009; Duval et al. 2022), thus paving the way for a rich organic chemistry. Carbon based molecules like CO, \ceCO2, C2H2 have been observed using Spitzer (e.g. Carr & Najita 2011; Salyk et al. 2008; Pontoppidan et al. 2010). Other hydrocarbons like c-C3H2 (Qi et al. 2013), C2H (Bergin et al. 2016) have been detected in the outer disks by the MAPS consortium (Ilee et al. 2021; Guzmán et al. 2021). With the advent of JWST, a plethora of new species are discovered due to its high sensitivity and increased spectral resolution compared to Spitzer. Among the new detections (Tabone et al. 2023, A. M. Arabhavi 2023) are various hydrocarbons emitting in the mid-infrared region as predicted by Bast et al. (2013).
There have been various studies on hydrocarbon chemistry in different environments (temperatures, pressures initial abundances, radiation etc.) like in molecular clouds, AGB stars, planetary nebulae and planet forming disks. Carbon chains can form at the early stages of cloud evolution before C gets locked in CO in warm carbon chain chemistry in molecular clouds. Experimental study by Santoro et al. (2020) investigated the gas-phase interaction of C and \ceC2 with \ceC2H2 leading to polyacetylenic chains and poly-cyclic aromatic hydrocarbons (PAHs) for the outer layers of C-rich AGB and protoplanetary nebulae. Benzene is shown to form in a bottom up approach in the inner 3 au of the planet forming disk and its abundance structure is affected by the uncertainty in the adsorption energies assumed for it (Woods & Willacy 2007). Kress et al. (2010) studied the formation of poly-cyclic aromatic hydrocarbons (PAHs) and calculated the position of the soot line beyond which PAHs are destroyed in disks. A comparative study on chemistry around the stars with spectral types from A to M showed different abundance structures of \ceC2H2 and set of pathways leading to its formation in X-ray and UV dominated regions (Walsh et al. 2015).
Hydrocarbons have been detected in the ISM and molecular clouds with only \ceC2H2 detected in disks around T Tauri stars and \ceCH4, \ceC4H2, \ceC6H6 detected (Tabone et al. 2023) in disks around very low mass stars in the mid-IR. There have been numerous attempts to reproduce the observational flux levels through thermo-chemical modelling. Earlier work (e.g. Woitke et al. 2018; Greenwood et al. 2019a, b; Anderson et al. 2021) proposed high gas-dust, dust evolution (including radial drift, growth, settling) and a high C/O ratio to interpret the observed fluxes of \ceC2H2 and \ceH2O. Little work went in looking in more detail into the formation pathways of \ceC2H2 which explains the need to revisit the chemical networks used widely in the disk community.
Hence, in this paper, the focus is on expanding the hydrocarbon chemistry and studying how this affects the mid-infrared spectra especially in the light of new JWST data. The radiation thermo-chemical modelling code PRODIMO (Woitke et al. 2009) is used to determine the disk structure of a typical T Tauri disk (Woitke et al. 2016). The hydrocarbon chemistry is expanded beyond the large DIANA chemistry (Kamp et al. 2017). The key ingredients of the disk modelling code PRODIMO, the large DIANA chemical network and the description of the extension of the chemical network for hydrocarbons is provided in section 2. Section 3 identifies pathways of \ceC2H2 formation, presents network diagrams and analyses the hydrocarbon chemistry in a typical T Tauri disk and highlights the differences between using the UMIST (McElroy et al. 2013) and the KIDA (Wakelam et al. 2012)111Note that we use here the published network file kida.uva.2014 from Wakelam et al. (2015), referred to as KIDA2014 in the remainder of this work. chemical rate databases. The implications of the new chemical network on the mid infrared spectra is described in section 4. Section 5 discusses the results followed by conclusions.
2 Modeling
2.1 Physical disk Modeling
PRODIMO (Version: 2.0-421754a9) is a radiation thermo-chemical code that models the physical and chemical structure of planet forming disks (Woitke et al. 2009, 2016). It assumes an axis-symmetric, Keplerian, irradiated disk. It performs 3D ray based dust continuum radiative transfer to obtain the dust temperature and the wavelength dependent radiation field in the disk (Woitke et al. 2009).
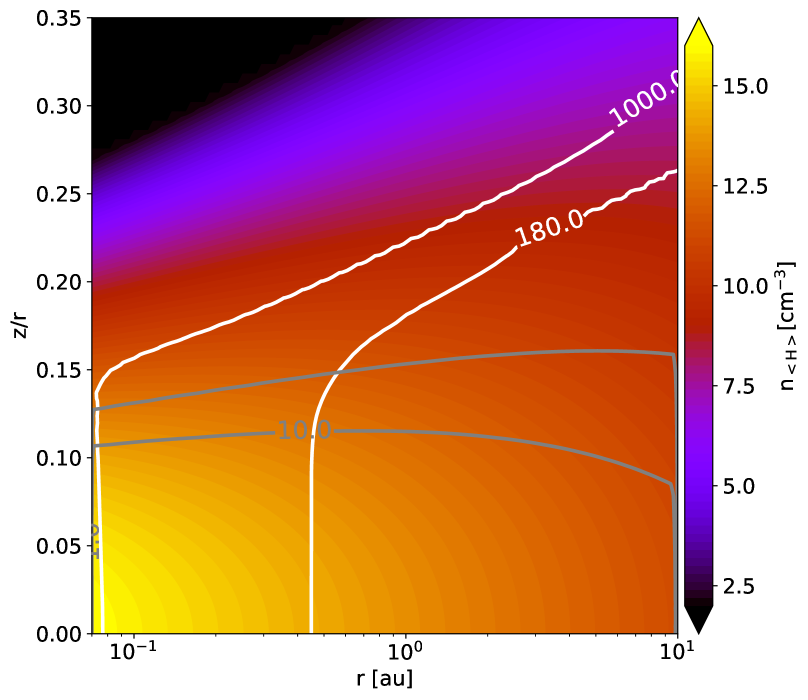
We model a steady-state standard T Tauri star-disk system with a grid point resolution of 150x100 cells. Our disk parameters are the same as in Woitke et al. (2018) except for the radial extent . The emitting region of molecules like C2H2 in the mid-IR are limited to within 10 au (Woitke et al. 2018). Hence, we cut the radial extent of the disk to 10 au to be able to increase the spatial resolution for the inner regions. Our corresponding disk mass inside 10 au is only 9.49510-4 M⊙. We also use the canonical gas-to-dust mass ratio of 100. Figure 1 shows the physical structure of the disk model.
2.2 Thermo-Chemical disk Modeling
| Elements | 12 + log | Abundance (relative to H) |
|---|---|---|
| H | 12 | 1 |
| He | 10.98 | 9.6410-2 |
| C | 8.14 | 1.3810-4 |
| N | 7.90 | 7.9410-5 |
| O | 8.48 | 3.0210-4 |
| Ne | 7.95 | 8.9110-5 |
| Na | 3.36 | 2.2910-9 |
| Mg | 4.03 | 1.0710-8 |
| Si | 4.24 | 1.7410-8 |
| S | 5.27 | 1.8610-7 |
| Ar | 6.08 | 1.2010-6 |
| Fe | 3.24 | 1.7410-9 |
| PAH | 5.48 | 3.01910-7 |
The gas temperature in PRODIMO is determined by the balance between the heating and cooling processes as listed in Woitke et al. (2009). The code uses the kinetic rate approach to obtain the chemical composition in the disk. Additional heating/cooling processes namely the line cooling by molecules emitting in the mid-IR like H2O, \ceC2H2, CH4, CO2, NH3, HCN, OH is included in the model (Woitke et al. 2018).
The chemical network includes the gas-phase chemistry and gas-grain desorption (thermal desorption, photo-desorption and cosmic-ray desorption) and freeze-out. The chemistry is modeled using 13 elements, namely H, He, C, N, O, Ne, Na, Mg, Si, S, Ar, Fe and PAH. Table 1 lists the elemental abundances used in all the models (Woitke et al. 2016); we use C/O ratio of 0.457. The fiducial model uses the large DIANA chemical network consisting of 235 species, including atoms, molecules, corresponding positive ions, protonated ions and ices (Kamp et al. 2017). There are 3037 reactions in the fiducial model that largely originate from the UMIST2012 database (McElroy et al. 2013). We add two reactions from the KIDA 2014 database, which are explained in Sect. 2.3. The network has a number of specific additional reactions as mentioned in Kamp et al. (2017) : X-ray chemistry (Meijerink et al. 2012; Rab et al. 2018), PAH chemistry (C54H18 is taken as a representative PAH) including adsorption and freeze out (see references in Kamp et al. 2017), collider reactions from the UMIST 2006 database and photodissociation reactions for the molecular ions (Heays et al. 2017). Photorates are calculated using the local wavelength dependent radiation field inside the disk (Kamp et al. 2010). We include a number of three body and thermal decomposition reactions taken from STAND2020 (Rimmer & Helling 2016) listed in the Appendix A. We take only those reactions from STAND2020 which have valid data for the forward direction 222A+B+M C+D+M, reverse of such a reaction is not added; the backward reactions for the same are not included. H2 formation is included following Cazaux & Tielens (2004). We explore the impact of using a different \ceH2 formation rate (Cazaux & Tielens 2010) in Sect. 4.2.
2.3 Expanding the network for longer hydrocarbon molecules
| C | 2C | 3C | 4C | 5C | 6C | 7C | 8C |
|---|---|---|---|---|---|---|---|
| CH | C2 | C3 | C4 | C5 | C6 | C7 | C8 |
| CH2 | C2H | C | C | C | C | C | C |
| CH3 | C2H2 | C3H | C4H+ | C5H | C6H | C7H | C8H |
| CH4 | C2H3 | C3H+ | C4H | C5H+ | C6H+ | C7H+ | C8H+ |
| CH+ | C2H4 | C3H2 | HC4H | C5H2 | C6H2 | C7H2 | C8H2 |
| CH | C2H5 | C3H | C4H3 | C5H | C6H | C7H | C8H |
| CH | C | C3H | CH2CHCCH | C5H | C6H | C7H | C8H |
| CH | C2H+ | CCCH (l-C3H) | CH2CHCHCH2 | CH3C4H | C6H | C7H | C8H |
| CH | C2H | H2CCC (l-C3H2) | C4H | CH3C4H+ | C6H | C7H | C8H |
| CH | C2H | CH2CCH | C4H | C5H | C6H6 | CH3C6H | C |
| CH | C2H | CH3CCH | C4H | C | C6H | C | C8H |
| CH | C2H | CH2CCH2 | C4H | C5H | C6H | C7H | C8H |
| CH | CH3CH3 | CH3CHCH2 | C4H | C5H | C | C7H | |
| CH3CH | CH2CCH+ | C | CH3C4H | C6H | CH3C6H | ||
| C2H | C3H | C4H | C6H | ||||
| C | C3H | HC4H | C6H | ||||
| C2H | C3H | C4H | |||||
| C2H | C3H | CH2CHCCH | |||||
| C2H | C | CH2CHCHCH | |||||
| C2H | C3H | ||||||
| C2H | C3H | ||||||
| CH3CH | CCCH | ||||||
| H2CCC | |||||||
| CH2CCH | |||||||
| CH3CCH | |||||||
| CH2CCH | |||||||
| CH3CHCH |
We aim to analyse the chemical formation and destruction pathways of \ceC2H2 and quantify the effect of chemistry on the \ceC2H2 abundance and its mid-IR spectra. Our goal is to find potentially missing chemical pathways from the existing chemical network and study their impact on the disk. To do so, we first expand the large DIANA chemical network by adding additional longer hydrocarbon species.
We decided to restrict ourselves to the chemistry up to the most simple cyclic aromatic hydrocarbon, namely \ceC6H6. We included species up till eight carbon atoms to take into account the destruction of larger hydrocarbons to form the stable C6H6 molecule. The negative ions are omitted except for H-. The rule formulated in Kamp et al. (2017) which states to include the ions and protonated forms of the neutral stable closed shell species is followed. We identify the stable species as C2H6, C3H4, C3H6, C4H2, C4H4, C4H6, C5, C5H2, C5H4, C6, C6H2, C6H6, C7, C7H2, C7H4, C8, C8H2. Their ions and protonated forms are added in the network except for C4H6. Only the protonated form of this species is added in the network because destruction reactions for \ceC4H6+ were unavailable in the rate databases.
In a first step, the hydrocarbon species and their isotopomers, if any, for which the destruction and formation reactions are available in the UMIST2012 database are included in the network. The network has the cyclic and linear isotopomers of \ceC3H denoted as \ceC3H and \ceCCCH, C3H2 denoted as \ceC3H2 and \ceH2CCC, C3H denoted as \ceC3H3+ and \ceCH2CC+, respectively. It also has both linear isotopomers of C3H4 denoted as CH2CCH2 and CH3CCH.
The reactions for \ceCCCH are taken from KIDA2014. Both the KIDA2014 and the UMIST2012 database do not provide the reactions for the cyclic counterpart \cec-C3H+ which might be because this species has never been detected in space. The network also misses C6H5 and C6H4 as neither of the two databases provides the destruction and formation reactions for these species. The KIDA2014 database misses C3H, C3H, C6H, CH2CCH2 and UMIST misses CCCH.
This resulted in a total of 92 new hydrocarbon species added to the large chemical DIANA network. Rates for their reactions are takes from either UMIST2012 or KIDA2014. Table 2 summarizes this list and shows the stable species in bold font. Neutral hydrocarbons including the radicals can freeze on the dust grains. The adsorption energies for these neutral species are taken also from the UMIST2012 database. We assumed the same adsorption energies for both the isomers of \ceC3H4 due to the lack of individual data. The enthalpy of formation at 0 K is taken from the UMIST and KIDA database, respectively. We were not able to find the heat of formation for C3H, C4H, C4H, C5H+, C5H, C5H, C5H4, C, C6H+,C6H,C6H, C6H, C7H+, C7H, C7H, C7H, C7H, CH3C6H, C, C8H+, C8H, C8H, C8H in the UMIST, the KIDA or the NIST database. Similar to the adsorption energies, we assumed then the enthalpy of formation for isotopomers as equal for these species.
| Only in UMIST2012 | Only in KIDA2014 |
|---|---|
| \ceC3H6+ | CCCH |
| C3H | |
| C6H | |
| CH2CCH2 |
2.4 Chemical Networks
We aim to investigate the changes in the chemistry of \ceC2H2 from using different sets of rate coefficients from UMIST2012 and KIDA2014 after expanding the chemical network. We can then analyse the impact of the extended chemical network on the mid-IR spectra from the disks. To build up our understanding, a series of models was used.
Our fiducial model uses the large DIANA chemical network with 235 species (Kamp et al. 2017), plus the set of three body and thermal decomposition reactions listed in Appendix A. The heating and cooling processes that determine the gas temperature are intertwined with the chemistry. Hence, we decided to fix the physical structure of the disk (gas, dust temperatures and densities) to that of the fiducial model for all subsequent models. Only the chemical concentrations were recalculated. This allows to isolate the effect of chemical rates on the species abundances, line emitting regions of the molecules and the mid-IR line fluxes.
Each model has a barrier-less charge exchange and a dissociative recombination formation reaction for C2H2 taken from the KIDA2014 database:
| (1) |
| (2) |
These reactions constitute a dominant formation pathway of \ceC2H2 when using KIDA2014 and are therefore added in all the models.
Table 4 summarises the different models that we use in this work. The chemical database and the size of the chemical network are varied in the models. Model 2 uses the large DIANA chemical network with the rates calculated using the rate coefficients provided by the KIDA2014 database. Model 3 and model 4 use the new extended chemical network consisting of all the species in Table 2 except the underlined ones and use rate coefficients for reactions primarily taken from UMIST2012 and KIDA2014, respectively. They have the same species to facilitate the comparison between the two databases. This is why they lack seven species, namely C3H, C3H, C6H, CH2CCH2(C3H4) and its corresponding ice CH2CCH2#, and CCCH and its corresponding ice CCCH# 555# represents ices of the corresponding species. The databases are not complete in providing all the required reactions and species. For example, the UMIST2012 database clubbed \cec-C3H2+ and \cel-C3H2+ together as \ceC3H2+ which is used in model 3. We therefore use \cec-C3H2+ from the KIDA2014 database as its counterpart in model 4.
Model 5 has the missing seven species included and uses the UMIST2012 database and a few selected reactions added from the KIDA2014 database for CCCH. Model 5 thus presents the complete extended chemical network.
Model 5 also includes the following dissociative recombination reaction with electrons
| (3) |
The rate coefficient is taken from the KIDA2014 database.
| Model # | database | # of species | # of reactions | |
|---|---|---|---|---|
| Fiducial | UMIST2012 | 235 | 3036 | |
| Model 2 | KIDA2014 | 235 | 3072 | |
| Model 3 | UMIST2012 | 320 | 4004 | |
| Model 4 | KIDA2014 | 320 | 4150 | |
| Model 5 | UMIST2012 | 327 | 4121 |
3 The hydrocarbon chemistry
| point | r,z (au) | Tgas [K] | Tdust [K] | A | A | n<H> [cm-3] | remark | reservoirs in fiducial model | |
|---|---|---|---|---|---|---|---|---|---|
| 1 | 1.41, 0.30 | 300 | 230 | 1.10 | 0.021 | surface layer | \ceH2,\ceHe,\ceO,\ceC,\ceCO | ||
| 2 | 1.79, 0.19 | 85 | 85 | 3200 | 13 | 0 | outer midplane | \ceH2,\ceHe,\ceCO,\ceC3H2# | |
| 3 | 0.1, 0.0085 | 480 | 480 | 1700 | 62 | 0 | inner midplane | \ceH2,\ceHe,\ceCH4,\ceH2O, |
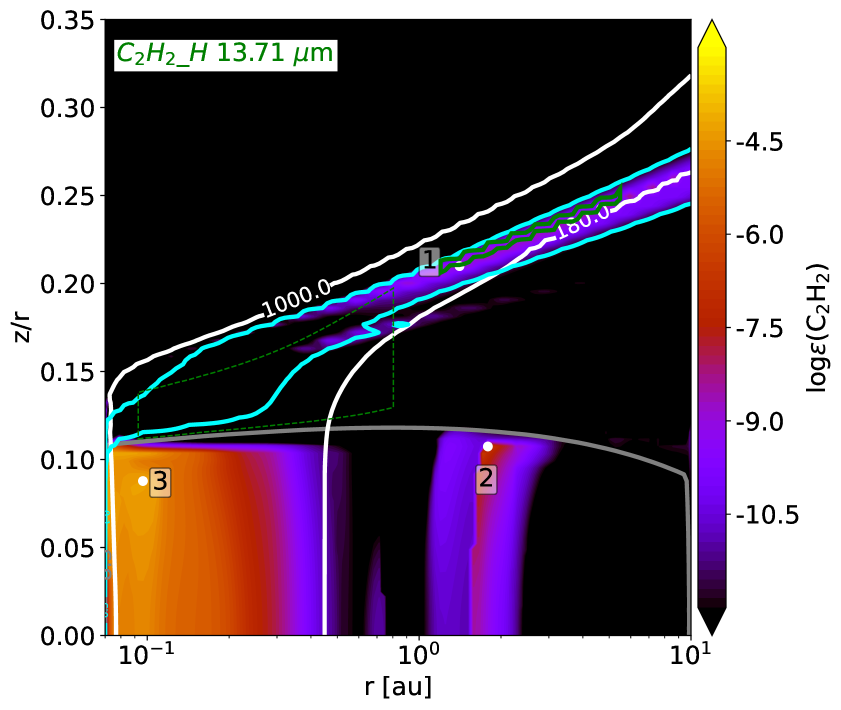
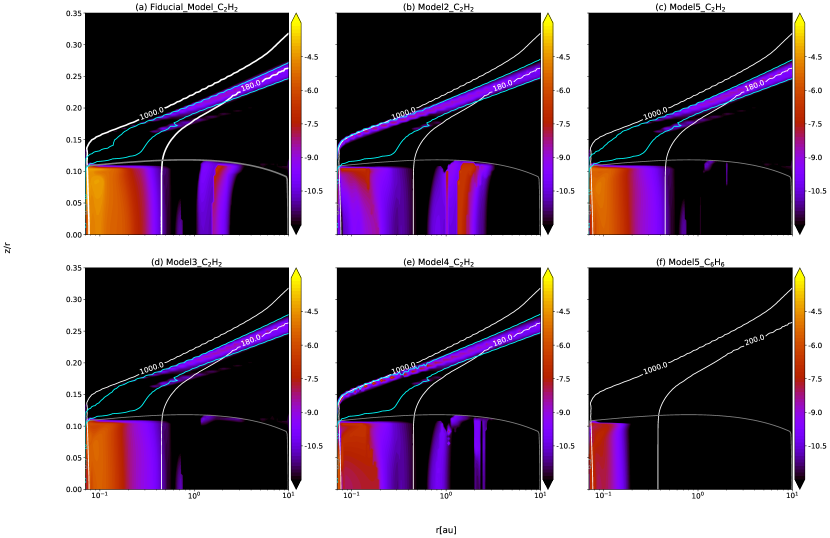
The abundance of \ceC2H2 in the fiducial model is shown in Fig 2. \ceC2H2 resides in a thin surface layer and two larger reservoirs in the midplane around 0.1 au and 2 au. This general qualitative structure of the \ceC2H2 abundance is the same in all the models no matter which size of network/database we use; only the radial extent changes slightly.
To understand the formation of \ceC2H2 in our disk model, we have chosen three representative grid points from the three reservoirs shown as white circles in Fig. 2. Grid point 1 is the representative point for surface chemistry that lies around the emitting region of the C2H2 transition at 13.706 m above the continuum emitting surface at 13.7 m. This particular transition is chosen as it has the highest flux in the fiducial model. Grid points 2 and 3 reside in regions of maximum abundance of \ceC2H2 in the two reservoirs in the midplane. Table 5 summarises the properties of the locations that are analysed. The typical abundance in the models in the surface layers (grid point 1) and the regions beyond au (grid point 3) is of the order of 10-9 and 10-5, respectively. The surface layer is confined to a region where the abundance of \ceH2 is higher than 0.05, the abundance of H is higher than 0.0019 and the abundance of C is of the order of 10-6. The two regions in the midplane are confined by the absence of electrons. In regions with an electron abundance , the abundance of \ceC2H2 is low (10-12). In the second reservoir around 2 au O is depleted from the gas as it forms \ceH2O ice. The gas then becomes C-rich and that gives rise to carbon chemistry.
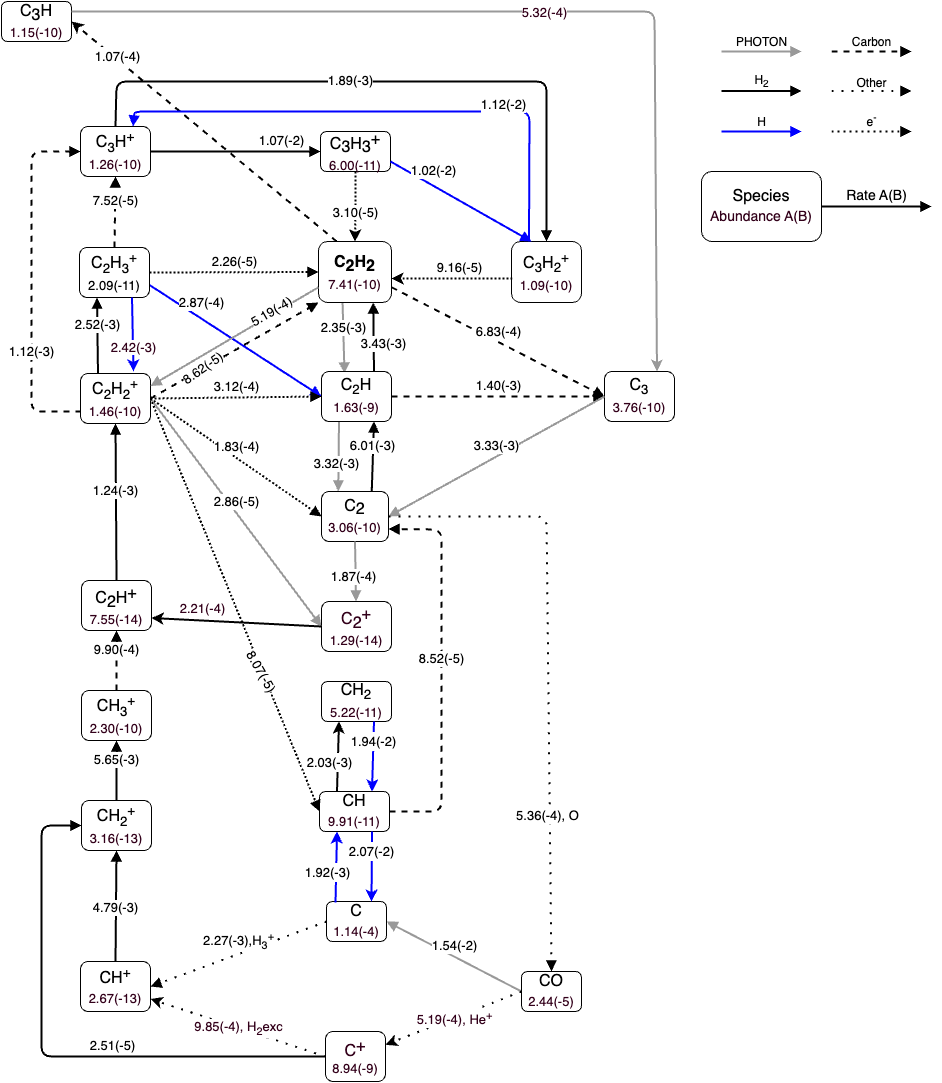
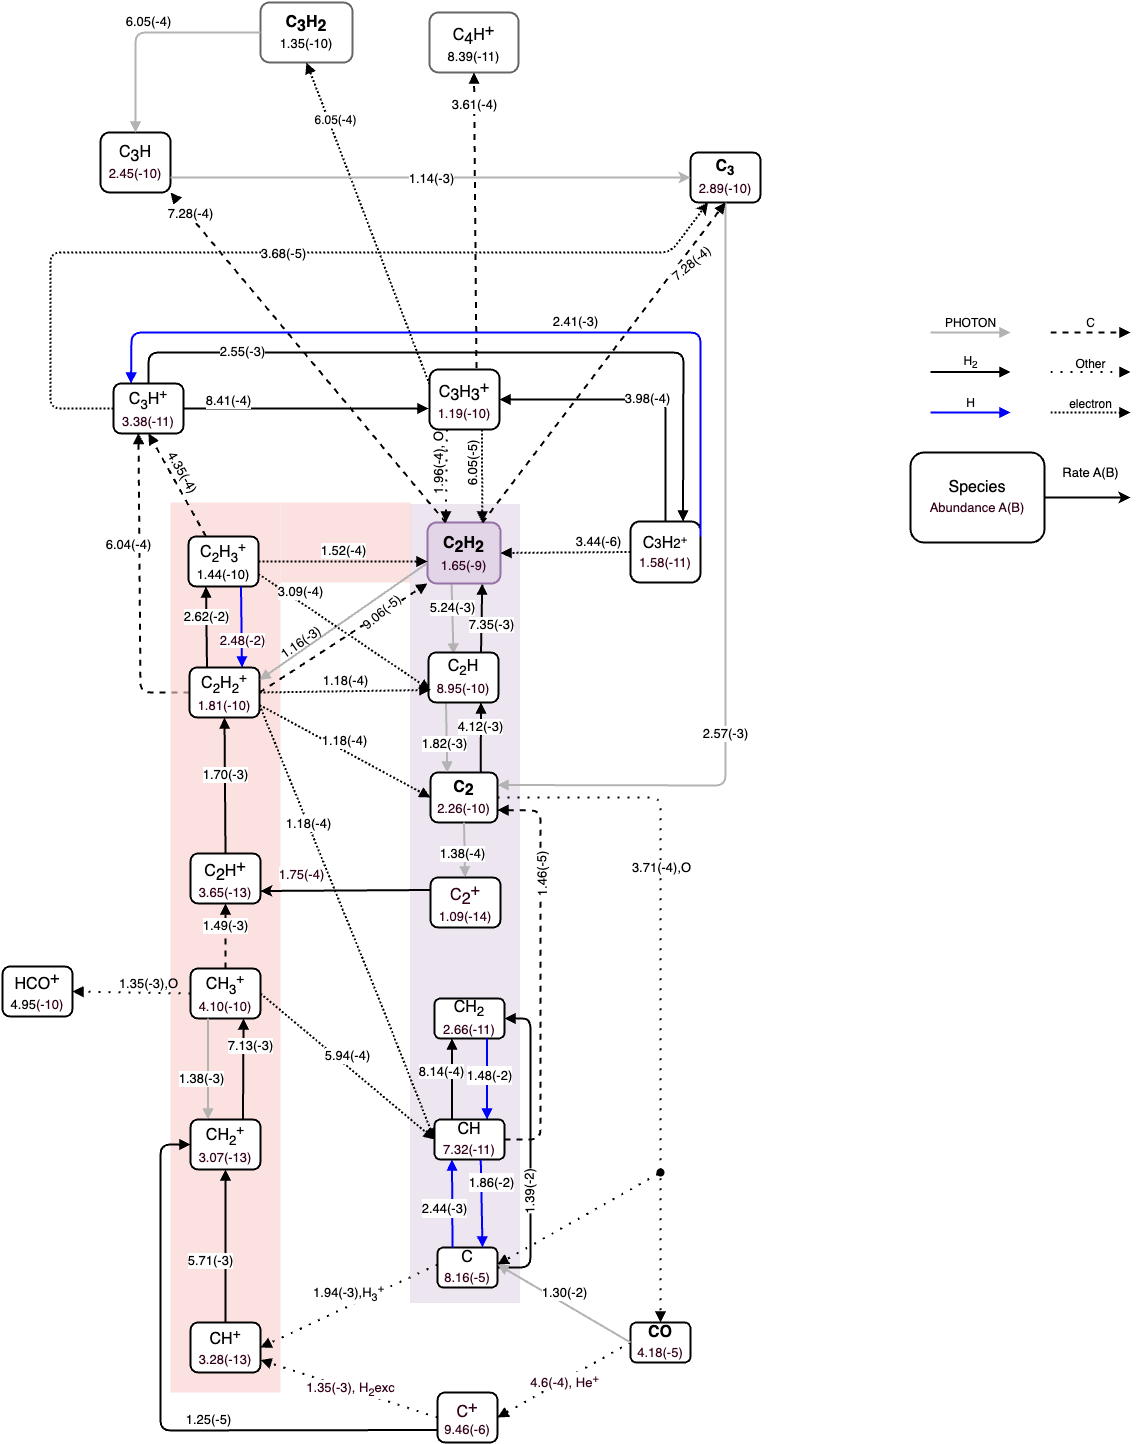
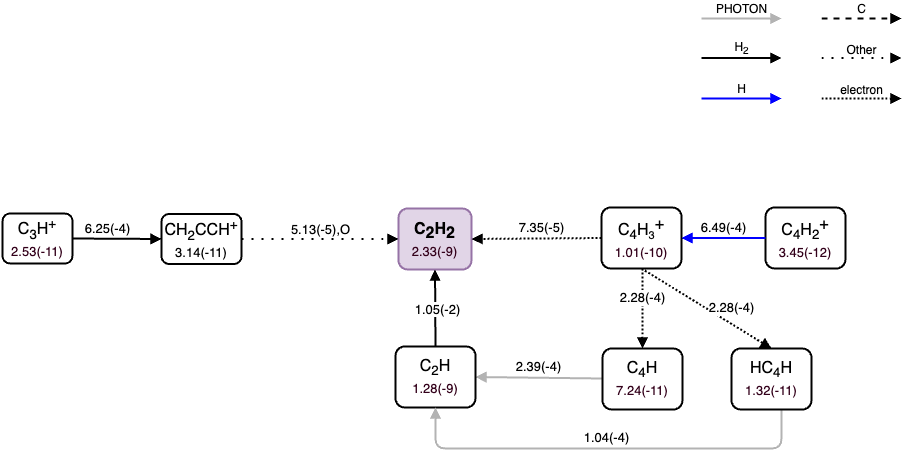
First, the chemistry of \ceC2H2 at grid point 1 in the surface layer is analysed. The major formation and destruction pathways of \ceC2H2 in the fiducial model are shown in Fig 6. Carbon, being the key ingredient of any hydrocarbon chemistry is unlocked by the photodissociation of CO by UV photons. It can also be unlocked as \ceC+ when He+ dissociates \ceCO. He+ is produced either by X-rays or cosmic rays depending on which dominates in the surface layers. There are two pathways forming \ceC2H2 as shown in the two color-shaded regions of Fig. 6: the neutral-neutral pathway (purple) and the ion-molecule pathway (orange). The formation of \ceC2H2 via the neutral-neutral pathway proceeds via the hydrogenation of C. The reaction of \ceH2 with C forms \ceCH2 which dissociates to form CH. The reaction of C with H also forms CH. These reactions are barrier less and so depend only on the abundances of H, \ceH2 and C. Once CH is formed, it can form \ceC2 via addition of neutral C. This is followed by abstraction of H to form C2H and finally C2H2. The ion-molecule pathway proceeds through hydrogen addition. Starting from C+, this leads to the formation of \ceCH3+ via \ceCH+. The addition of neutral C then forms \ceC2H+. Again, as these reactions are barrier less, the availability of neutral C is the limiting factor here. Thus for both pathways, the availability of C, H and \ceH2 is pivotal in deciding the formation route of \ceC2H2 in the surface layers. This fundamental chemistry is valid for all the models. The pathways leading to \ceC2H2 via C and \ceC+ are same in all the models. The rates of the reactions differ because of the differences in the abundances and the rate coefficients between the two databases.
C2H2 is destroyed to form higher hydrocarbons via the addition of C in the fiducial model. An example is the formation of \ceC3H. The other destruction path is \ceC2H2 photodissociation to \ceC2H.
In the fiducial model, at grid point 2, we find the ion-molecule chemistry to dominate. The most important pathways forming C2H2 are:
| (4) |
| (5) |
| (6) |
These formation pathways are not relevant in the surface layers. As the surface layers are UV dominated, C3H2 is photodissociated to C3H instead of forming C2H2. Figure 3 shows the difference in the abundances for \ceC2H2 in all our models which we discuss in the following subsections.
3.1 The extended hydrocarbon chemistry using the UMIST database
In model 3, we add the hydrocarbon species that are common to the UMIST2012 and the KIDA2014 rate database as shown in Table 2. Model 3 only uses reactions from the UMIST2012 rate database. The new \ceC2H2 abundances are shown in Fig. 3 (lower left panel). To understand the differences in abundance of C2H2 between the fiducial model and this model 3, Fig. 7 highlights the differences in the pathways described in the previous section.
In the surface layers, i.e. grid point 1, the total formation rate of C2H2 increases by 41% in model 3 relative to the fiducial model. This increase is due to the new pathways that are active now and which were missing from the fiducial model. Figure 7 shows these new pathways that form \ceC2H2.
The other difference is the formation of C2H via breaking down larger hydrocarbons in model 3. For example, the following two reactions were absent in the fiducial model
| (7) |
| (8) |
C4H dissociates to smaller hydrocarbon molecules like \ceC2H and C2. These two molecules are steps in the formation of C2H2 as seen in Fig 6. Enhancing their abundances will propagate and lead to a higher abundance of \ceC2H2.
The abundance of \ceC2H2 in the outer midplane i.e. grid point 2 drops by 6 orders of magnitude in model 3 with respect to the fiducial model (Fig. 3). Due to the presence of longer hydrocarbons and their corresponding more stable ices, the carbon is bound in the ices of longer hydrocarbons. The most abundant ice at this location is benzene ice C6H6#. The gas-phase longer hydrocarbon species are concentrated in the inner midplane regions roughly inside 0.5 au at higher than 200 K.
In the inner midplane, i.e. grid point 3, the total formation rate of C2H2 decreases by an order of magnitude in model 3 compared to the fiducial model resulting in a decrease in abundance by an order of magnitude. The dominant formation pathway in the fiducial model is
| (9) |
This reaction is exactly balanced by the destruction of \ceC2H2 via a three body reaction
| (10) |
in model 3 making the thermal decomposition of \ceCH2CCH by M (where M can be H, \ceHe or \ceH2) the dominant formation pathway. As we go deeper in the disk (, , = 1100 K and n= ), we find that these major formation pathways are balanced by neutral-neutral or three body destruction pathways making secondary species like \ceH2O important in forming \ceC2H2.
The neutral-neutral destruction reaction of \ceC2H2
| (11) |
is favoured over cosmic ray induced photodissociation of \ceC2H2 to form \ceC2H; this reaction is missing from the fiducial model. This again highlights the importance of adding higher hydrocarbons to determine more reliable \ceC2H2 abundances.
3.2 Role of isomers in the extended hydrocarbon network
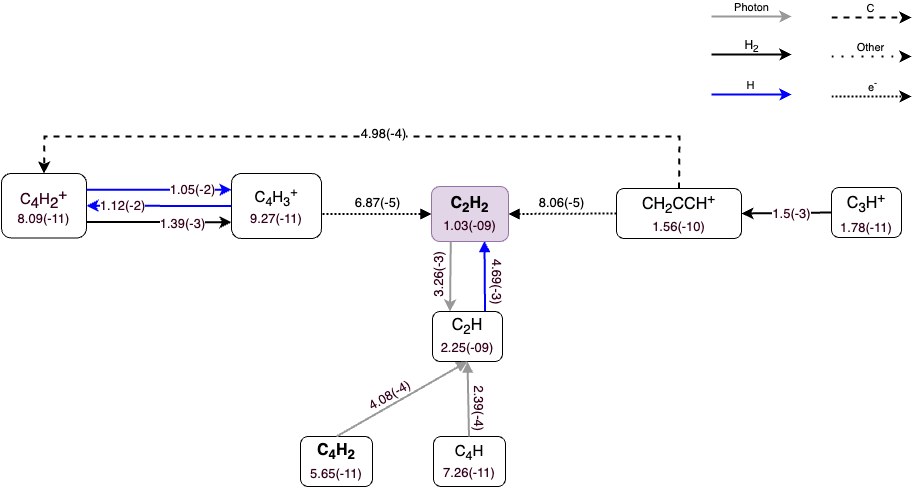
We compare models 2 and 4 that is the large DIANA and extended chemical network using the KIDA2014 rate database, respectively. We find two new pathways which are reaction 3 and the dissociative recombination of \ceCH2CCH+ with \cee- forming \ceC2H2 in model 4 (at point 1, Fig 15). These are the new species added in the extended network. The dissociative recombination reaction of \ceC3H2 with \cee- becomes less important in model 4. This is due to a lowered abundance of \ceC3H2+. Its formation proceeds through
| (12) |
| (13) |
in model 2. In the extended network, the first step can branch to two isomers, \ceC3H3+ (\cec-C3H3+) and \ceCH2CCH+ (\cel-C3H3+) thus lowering the abundance of \ceC3H3+ consequently lowering the abundance of \ceC3H2+. However, the decrease in this rate is compensated by the two new pathways above, overall resulting in an increase of 40% in the abundance of \ceC2H2 at grid point 1 in model 4.
One of the major formation pathways in both models at grid point 3 is
| (14) |
The thermal decomposition of \ceCH2CCH by M and dissociative recombination of \ceC5H5+ with \cee- add to the production of \ceC2H2. Both were missing from the DIANA chemical network thus increasing the \ceC2H2 abundance by 2 orders of magnitude in the inner disk midplane region (point 3).
3.3 Comparison between the UMIST and KIDA rate databases
Figure 3 shows the difference in the radial extent of the surface layer of \ceC2H2 in models using the UMIST2012 and the KIDA2014 rate database. We traced this back to the layer with high \ceH2 abundances extending down to smaller radii in models using the KIDA2014 database. The chemical pathways displayed in Fig. 6 show that \ceH2 is crucial in the formation of \ceC2H2. Comparing two models using the same chemical network but different rate databases (models 3 and 4), the vertical height at which H/H2 transition occurs is higher by 0.005 au at the radial distance of 1 au in model 4 (KIDA2014) compared to model 3 (UMIST2012). Models using the UMIST2012 database (fiducial and model 2) have a higher destruction rate of \ceH2. There is more destruction of H2 by atomic oxygen in the UMIST2012 model compared to the KIDA2014 model due to different rate coefficients for the reaction
| (15) |
The \ceC2H2 abundance at grid point 3 for model 2 is lower compared to the fiducial model as seen in Fig 3. In the fiducial model, C is locked in \ceC2H2 while in model 2 more of the C is in instead \ceCH4 at the inner midplane (grid point 3). We attribute this difference to missing reactions and different rate coefficients given in the databases. The reaction
| (16) |
is missing from the KIDA2014 database, but it is one of the dominant destruction reactions for \ceC2H3 and the dominant formation reaction for CH4 and \ceC2H2 when using UMIST2012 (fiducial model). The following dominant formation reaction in the fiducial model
| (17) |
has a barrier of 1300 K in KIDA2014 but only 130 K in UMIST2012 explaining the lower rate in model 2. Another important species contributing to the formation of \ceC2H2 is \ceC2H3+. This molecular ion is formed via the reaction
| (18) |
which is a barrierless reaction in UMIST2012 but has an activation energy of 2000 K in KIDA2014. The combination of these differences lead to a lower abundance of \ceC2H2 in model 2 at grid point 3 when compared to the fiducial model.
3.4 Benzene formation
Benzene is confined to the inner midplane below au and a of . It also appears in a narrower radial region in model 4 (KIDA2014, extended hydrocarbon chemistry). To find the dominant formation and destruction pathways in models, we analyse the chemistry in the inner midplane at au and with = = 570 K in an optically thick region with = 150 and = 2400 and = . We choose this point as it has the maximum abundance of benzene in model 5 (final extended chemical network). The network might be missing some reaction as the databases are not complete in hydrocarbons with 6 C atoms such as C6H4, C6H5 etc. The pathway to form benzene is via \ceCH4 and \ceC2H2. In model 3 (using UMIST2012), the dominant pathway of formation is
| (19) |
contributing 90% to the total formation rate followed by
| (20) |
contributing only 5%. \ceC6H5+ reacts further with \ceH2 to form \ceC6H7+ which subsequently recombines with an electron to form benzene
| (21) |
| (22) |
Model 4 (KIDA2014) also follows the same formation scheme as explained above. However, the abundance of benzene at this location in model 4 is of the order of 10-14 but even when analysing the region with the highest abundance (10-10) we find the same formation mechanism which then leads to \ceC6H6 via dissociative recombination (reaction 22).
3.5 The final hydrocarbon network
Based on what we learned from the previous comparisons, we compiled the final chemical network that has 327 species in total combining the large DIANA network with 235 species and the 92 additional hydrocarbons from Table 3. The leading database is UMIST2012 as it has more species than KIDA2014 and we add a few reactions picked from the KIDA2014 database as described in Sect. 2.3. The network includes the three body and thermal decomposition reactions as mentioned in Appendix A.
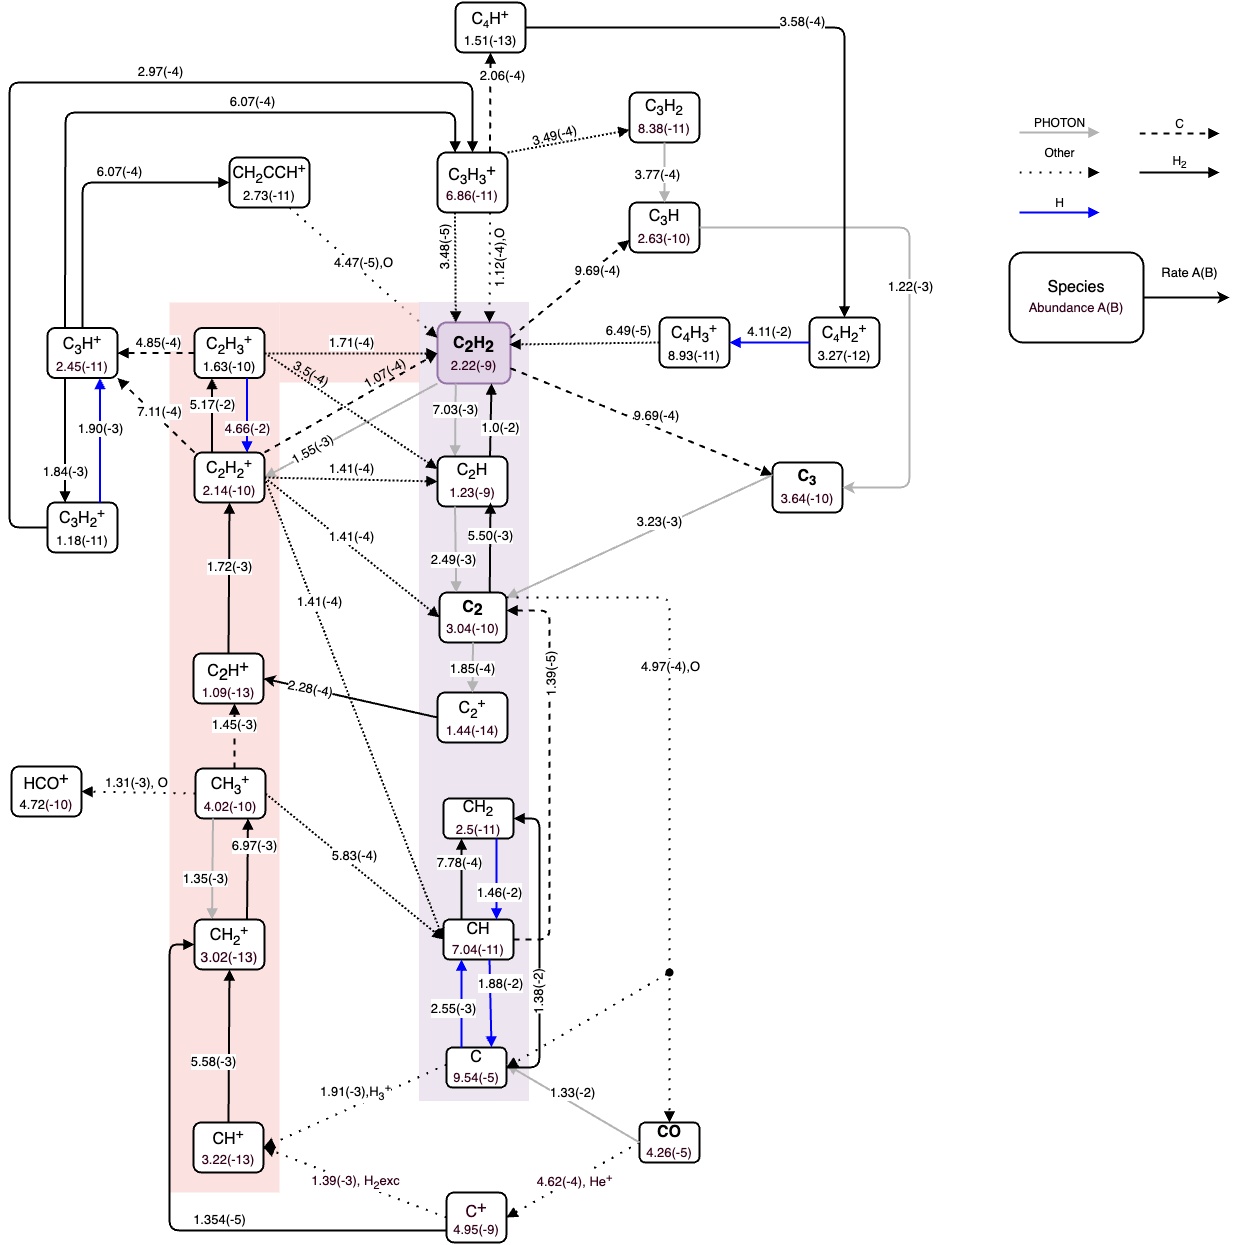
The basic formation and destruction pathways of \ceC2H2 remain the same as described in Sect. 3.1. Figure 8 details the chemical pathways in the surface layers of the disk. The dominant reactions forming \ceC2H2 are reactions 1,
| (23) |
| (24) |
These were also the dominant formation reactions in model 3 for the surface layers. The addition of new hydrocarbons changes the abundances of \ceC2H2 in the inner and outer midplane by 2 and 7 orders of magnitude, respectively, compared to the fiducial model for the reasons explained in previous sections. But it does not affect the \ceC2H2 abundances in the surface layers much (increase by a factor of 1.5).
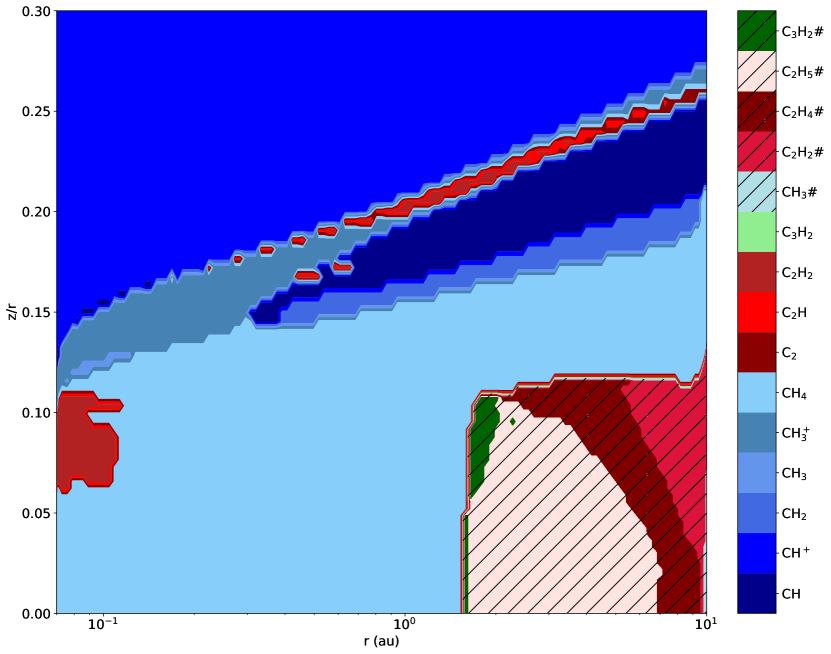
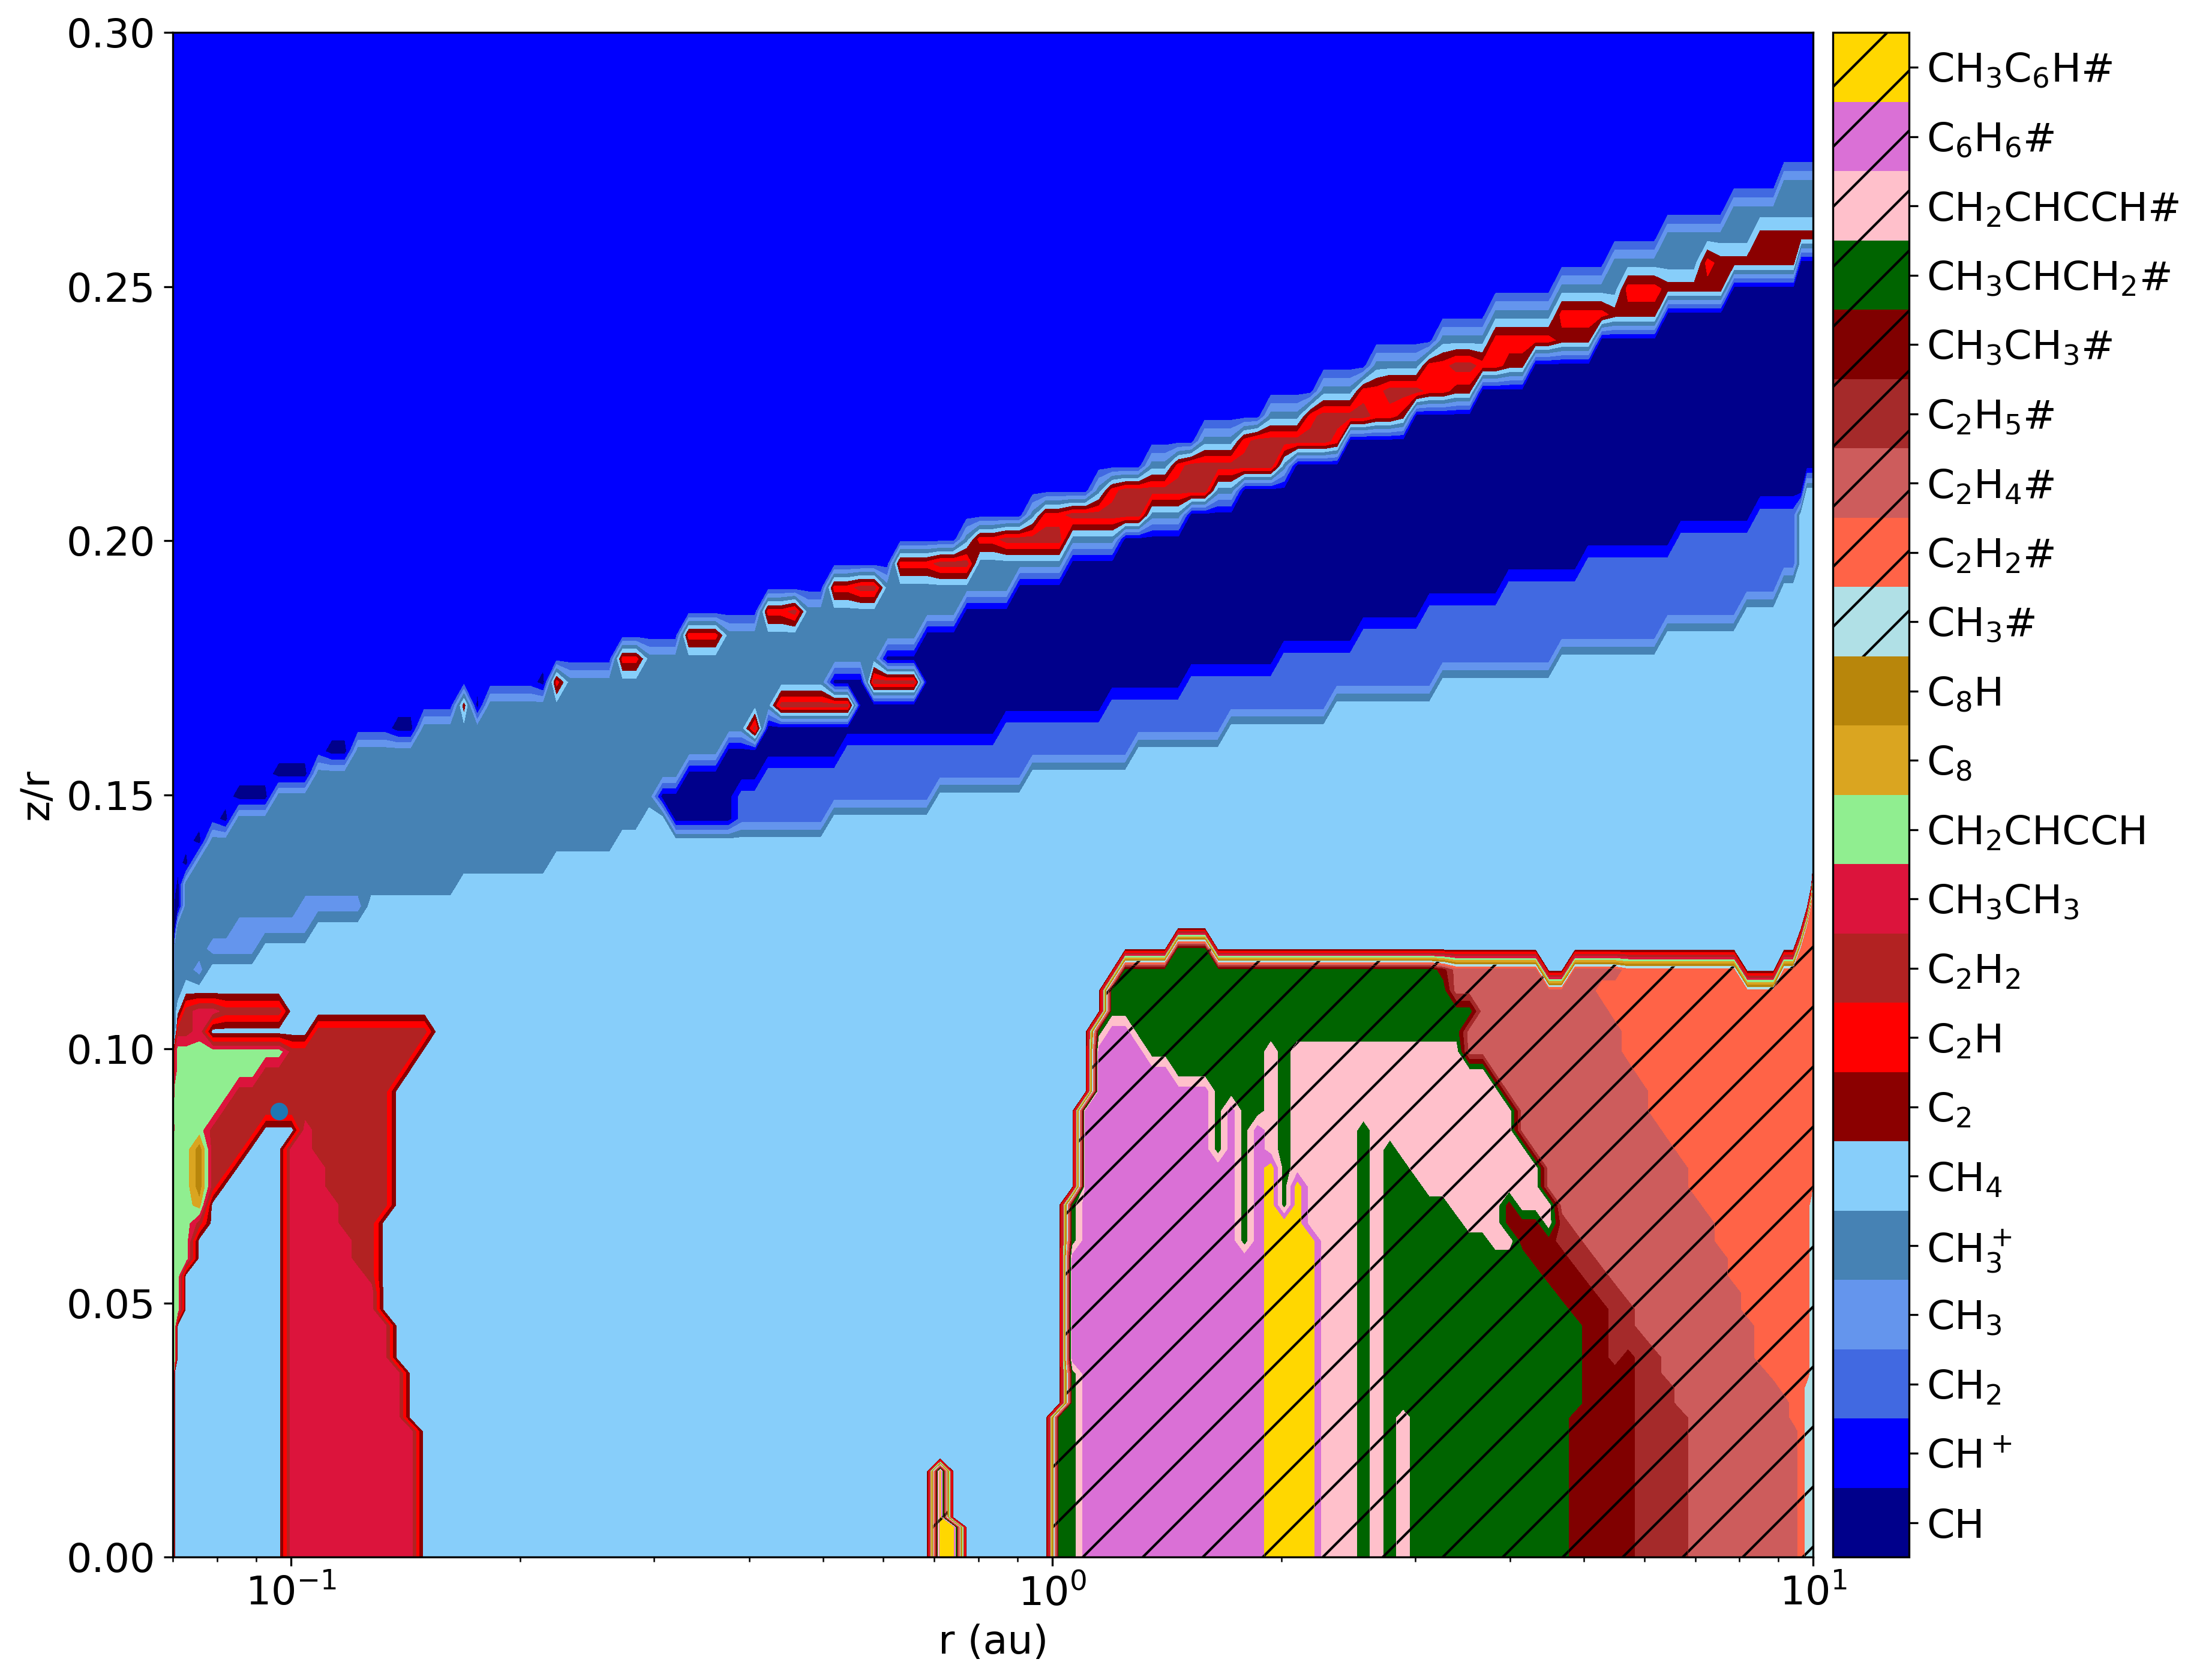
In the final network, the reaction of \ceH2 with \ceC6H5+ leads to \ceC6H7+ that recombines with an electron to form benzene (see reactions 22 and 21). Reaction 19 contributes 83% and reaction 20 contributes 16% to the total formation rate of \ceC6H5+. Hence, both \ceCH4 and \ceC2H2 contribute to the formation of \ceC6H6 with the route through \ceCH4 being the dominant one. Figures 4 and 5 show the effect of adding complex hydrocarbons and highlights how carbon chain length changes throughout the disk. The shades of blue and red corresponds to the single C and two C atom bearing species. The diversity in the ices also increase on using the extended chemical network. This network will be used for the remainder of the paper.
4 Mid-IR spectra
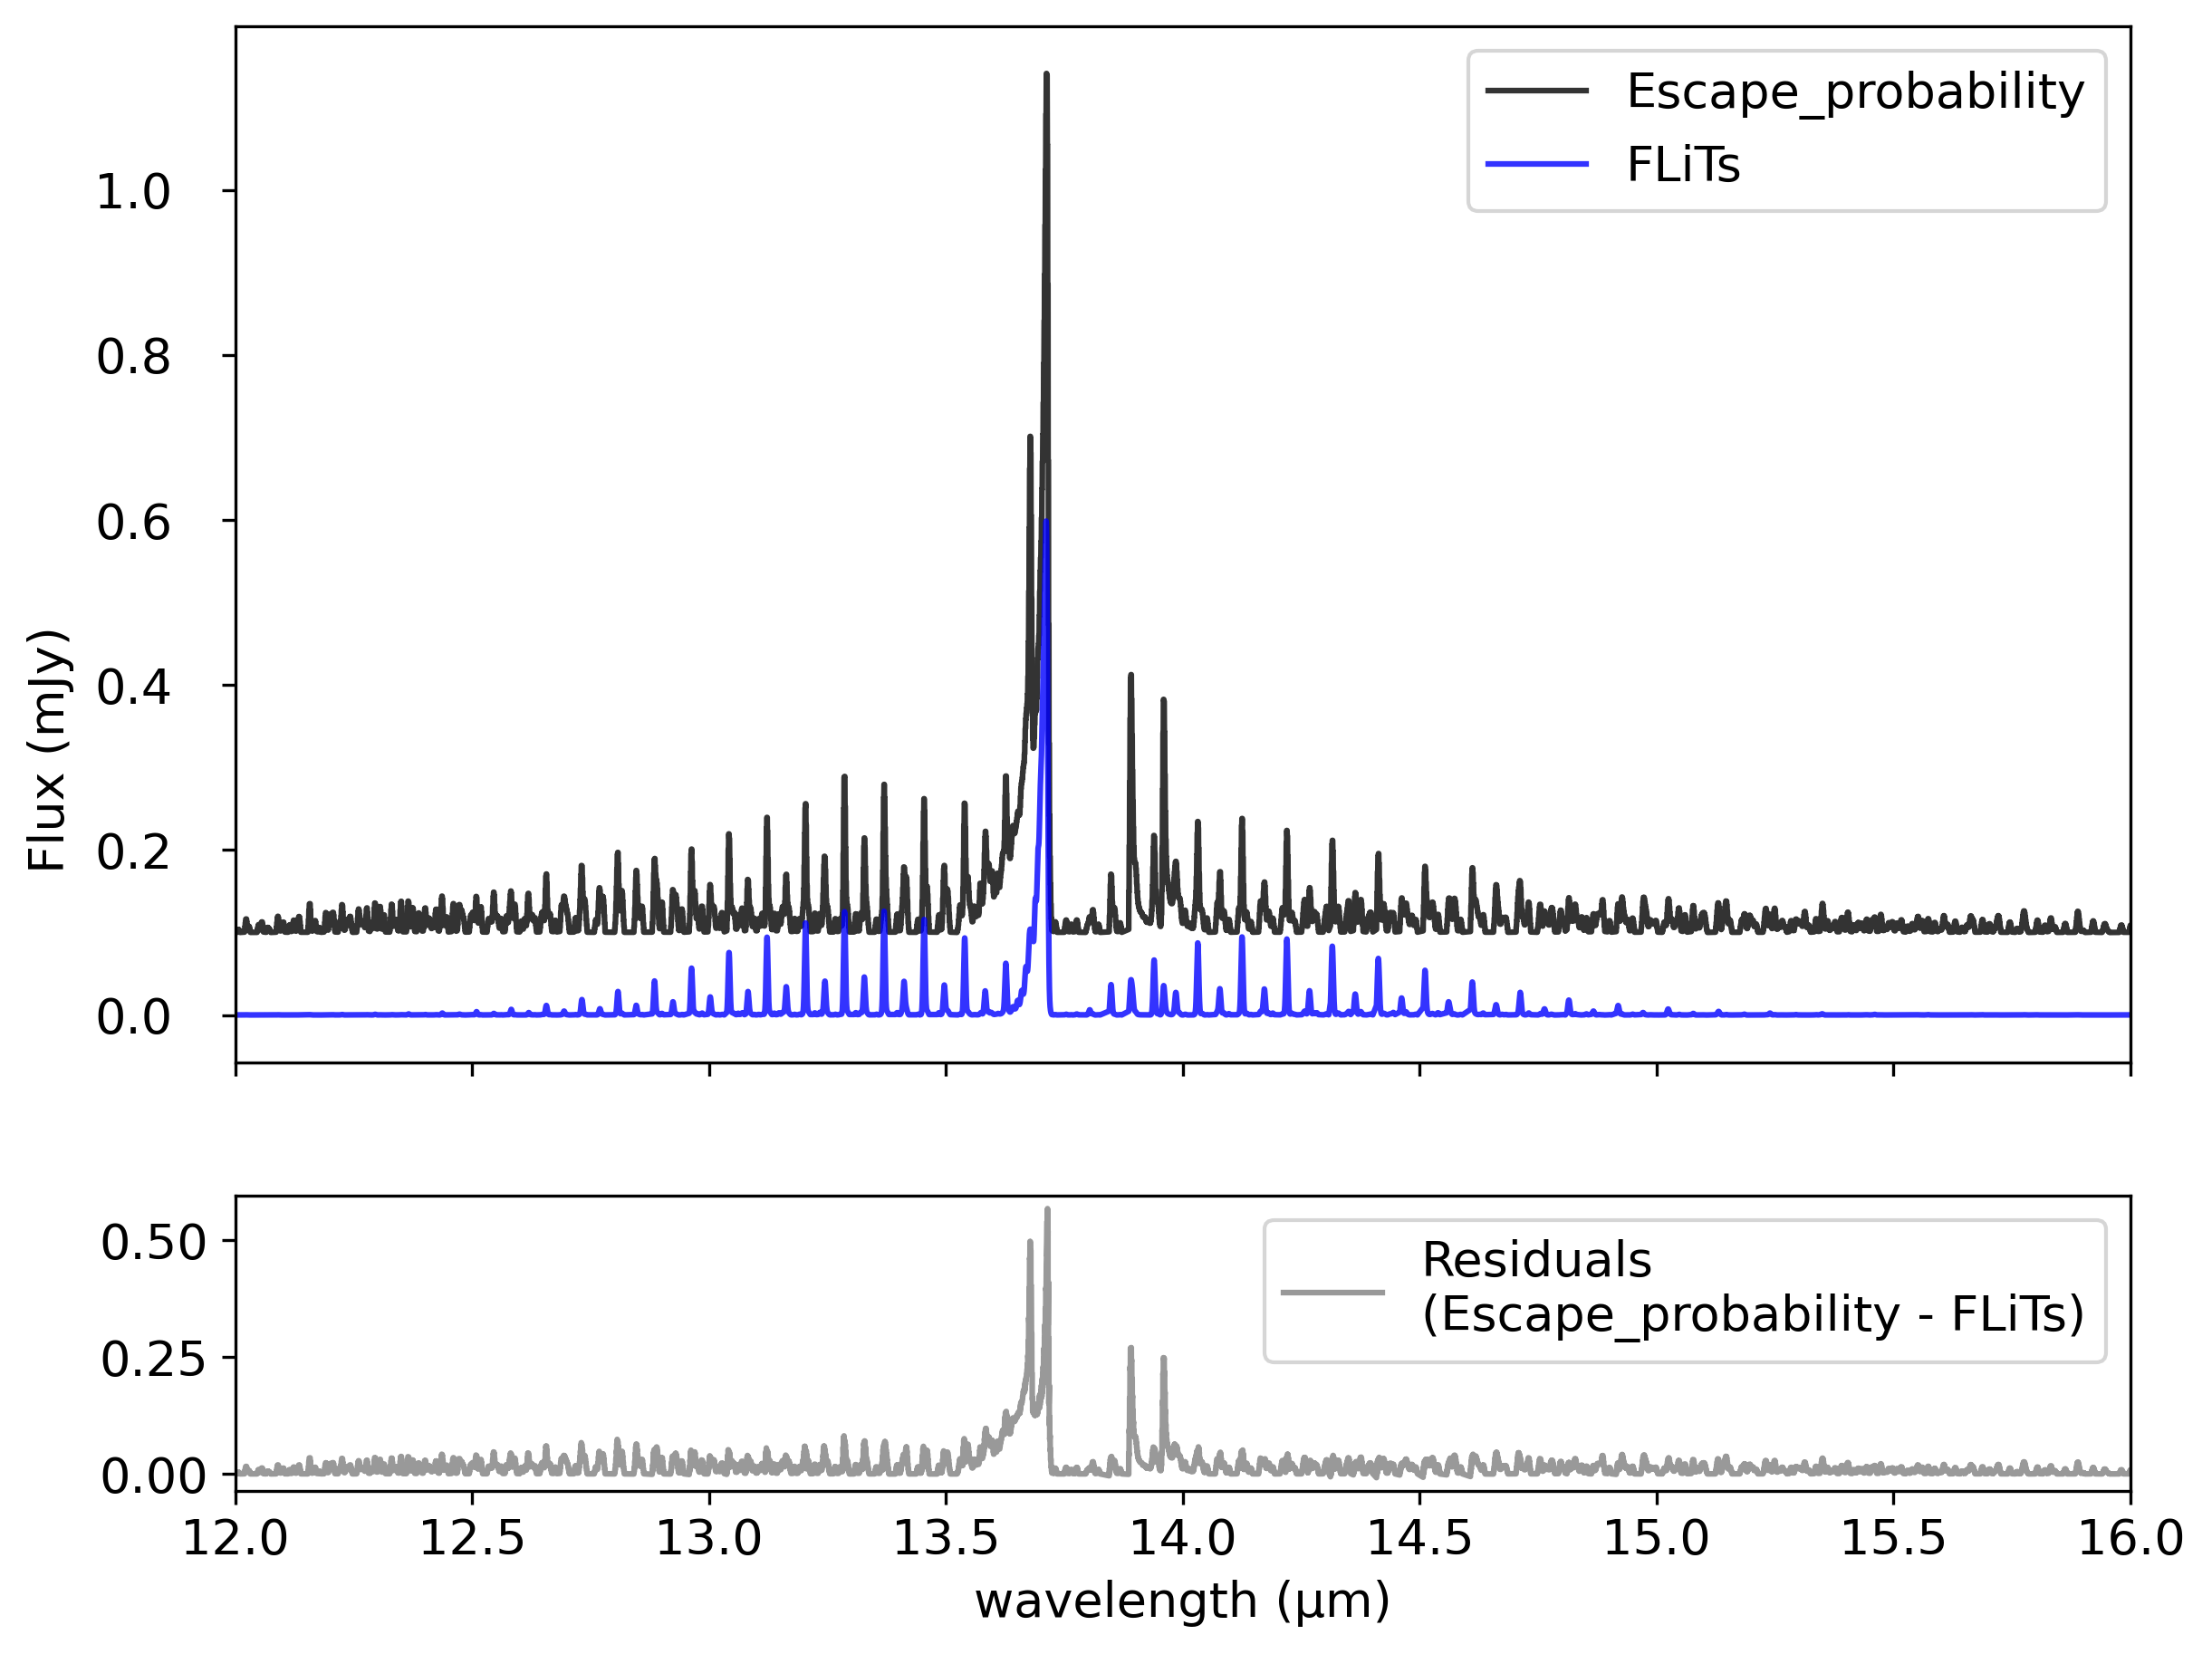
The extended hydrocarbon chemistry has an effect on the chemical abundances, especially on \ceC2H2. We study here whether this has an impact on the mid-infrared spectra emitted from the disk. We use the escape probability method which yields vertically emitted total line fluxes (Woitke et al. 2009) and FLiTs developed by Michiel Min (Woitke et al. 2018). FLiTs does a full line radiative transfer including the dust continuum and line opacity overlap. We use HITRAN 2009 (Rothman et al. 2009) as our spectroscopic database. The rules for selecting the line transitions are taken from Woitke et al. (2018).
Figure 9 shows the line flux for \ceC2H2 calculated using the escape probability method and FLiTs convolved to a resolution of 3000 appropriate for JWST. The weak lines at m have higher fluxes using the escape probability method compared to FLiTs (see residuals in Fig. 9). The escape probability treatment do not take into account absorption by the continuum which can be an issue for molecules emitting from relatively low heights in the disk. The escape probability produces a factor of 2 higher integrated \ceC2H2 (11.8-16.22 m) flux relative to FLiTs as shown in Fig 9. In the following, we use FLiTs to calculate the spectra.
4.1 Implication on mid-IR spectra
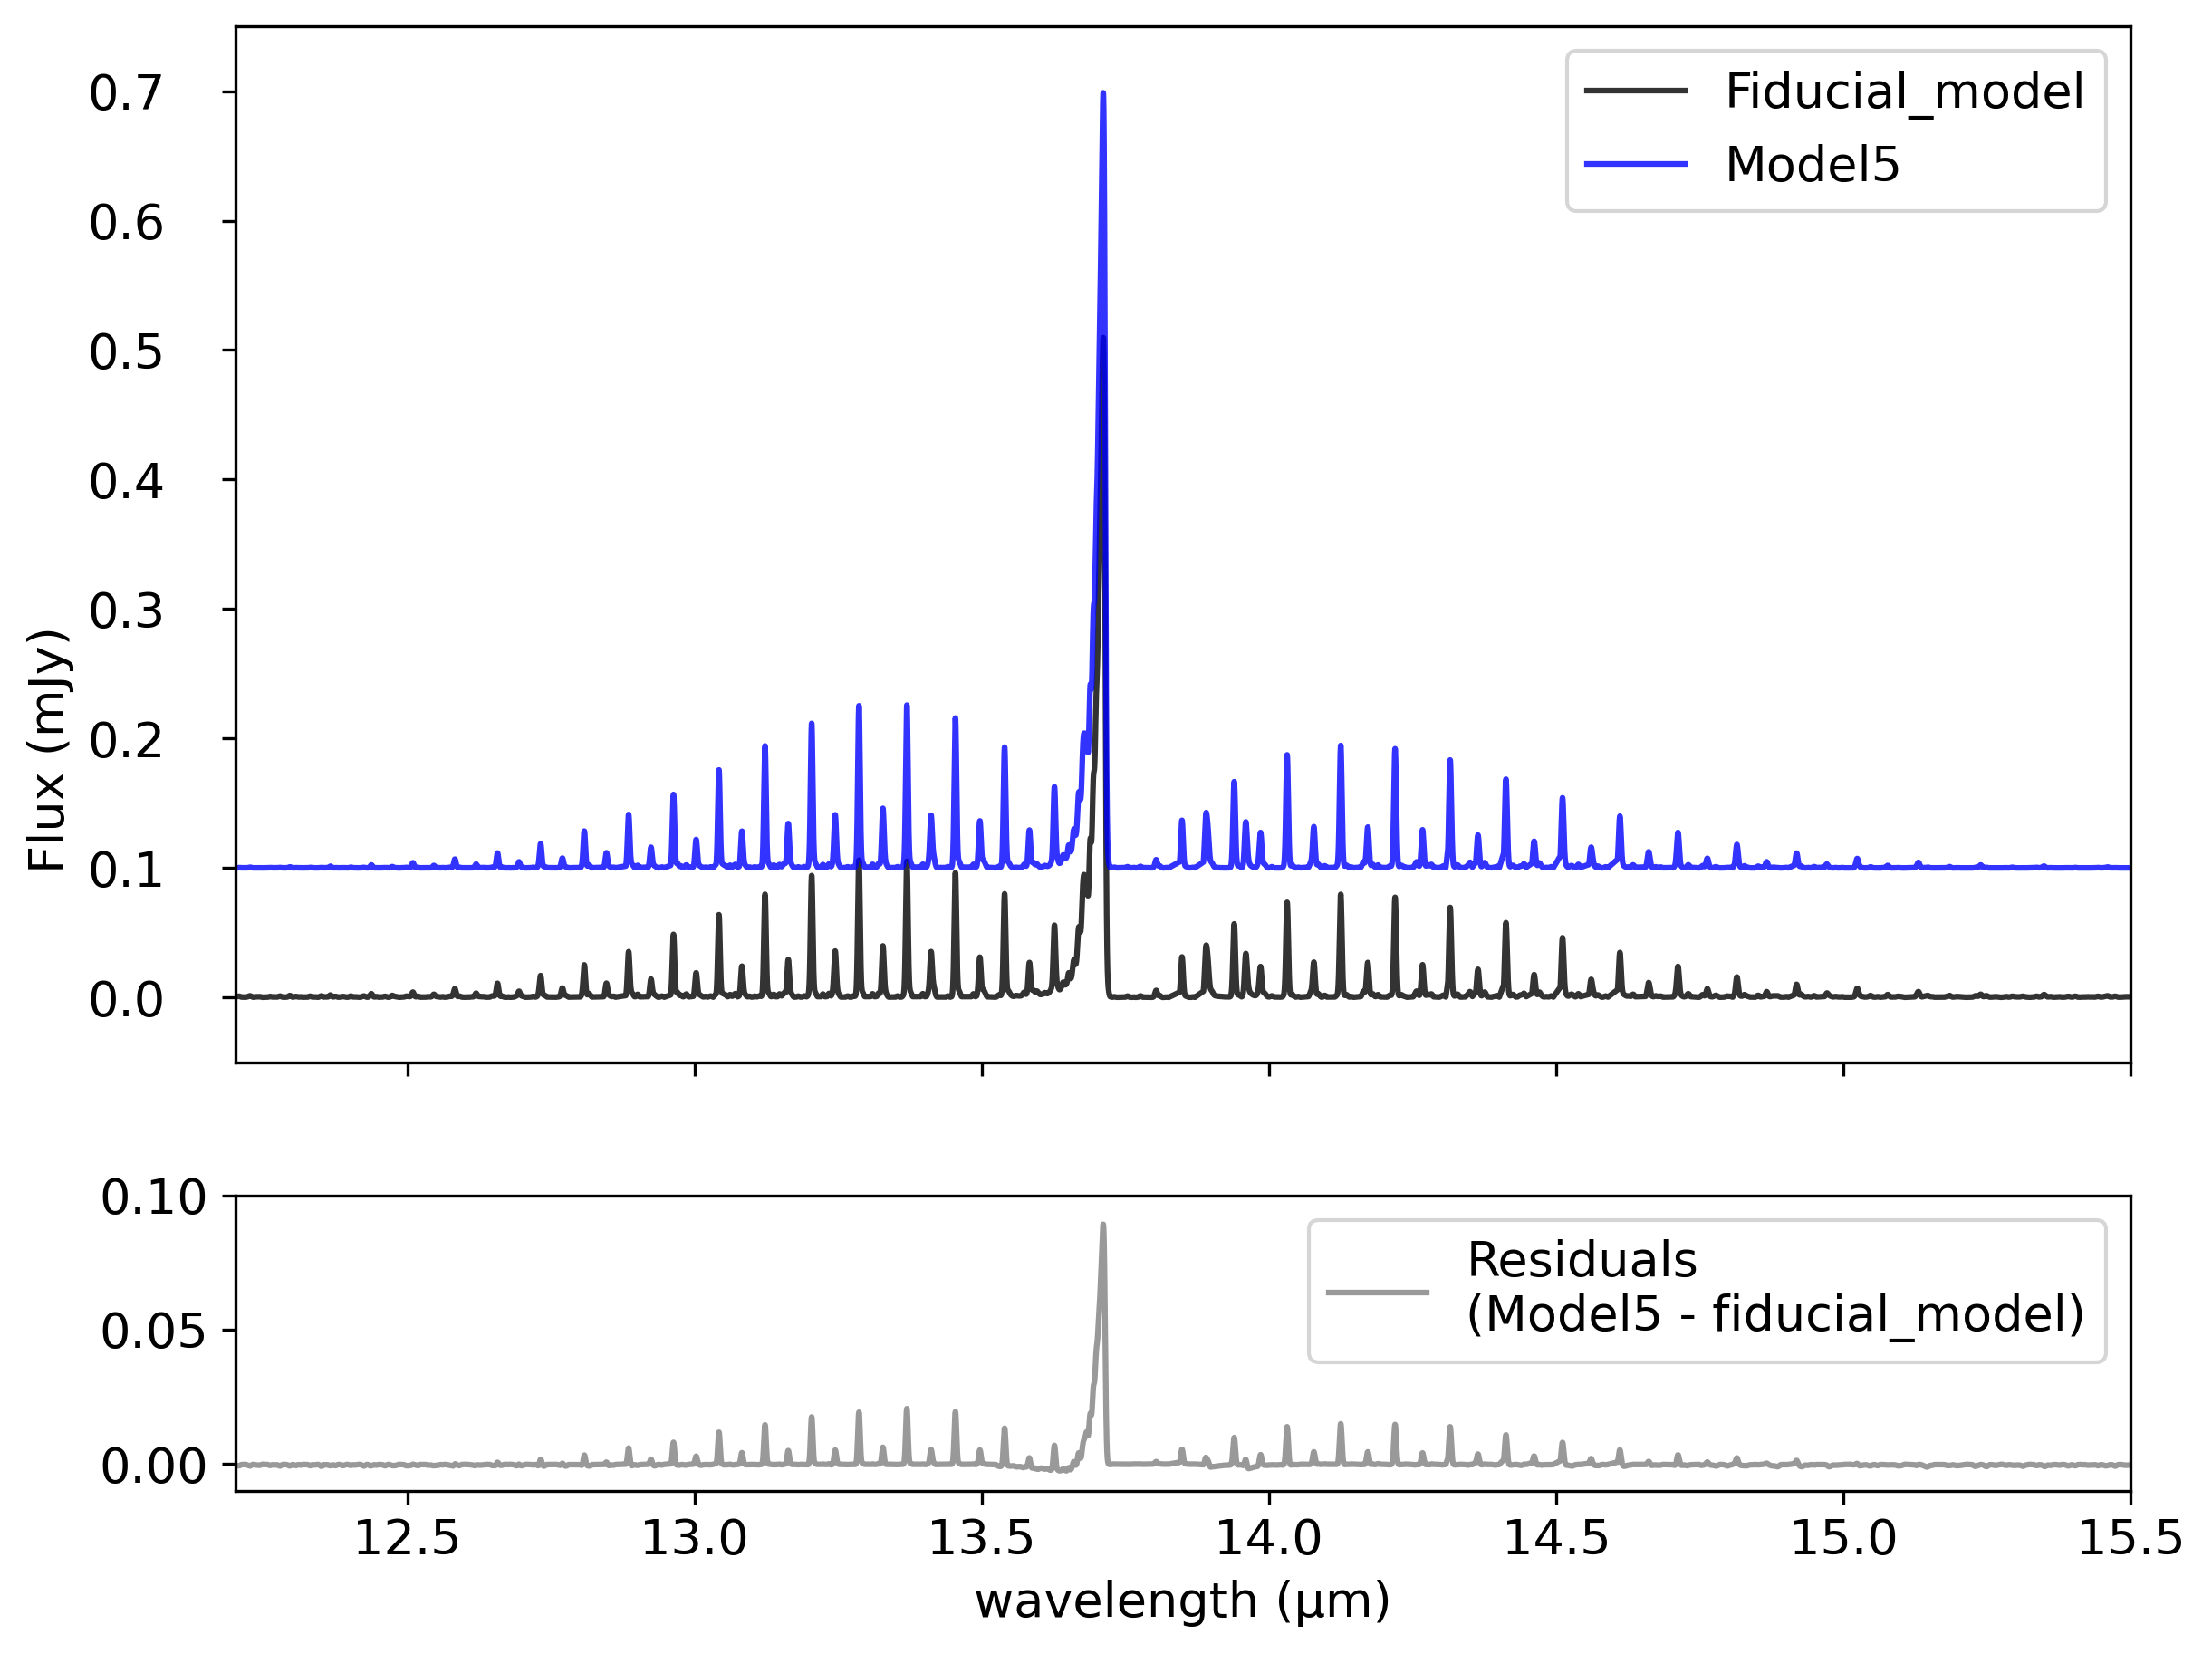
Figure 10 shows the flux emitted by \ceC2H2 for the model with the expanded hydrocarbon chemistry (model 5) and the one using the large DIANA chemical network (fiducial model). The total integrated flux in model 5 is higher by 10% relative to the fiducial model. This increase is solely because of the use of the expanded chemical network as we fixed the gas temperature of the disk. The peak fluxes produced in model 5 are mJy at and mJy at . The peak flux for \ceC2H2 in T Tauri disks as observed by Spitzer is 20 mJy at a . We find that using an extended chemical network cannot enhance \ceC2H2 emission to the typical flux level of mid-infrared observations of TTauri disks. A wide exploration of disk physical parameters like UV radiation, disk mass etc. using this network is now required to identify the key parameters and processes that allow us to reproduce the observed fluxes.
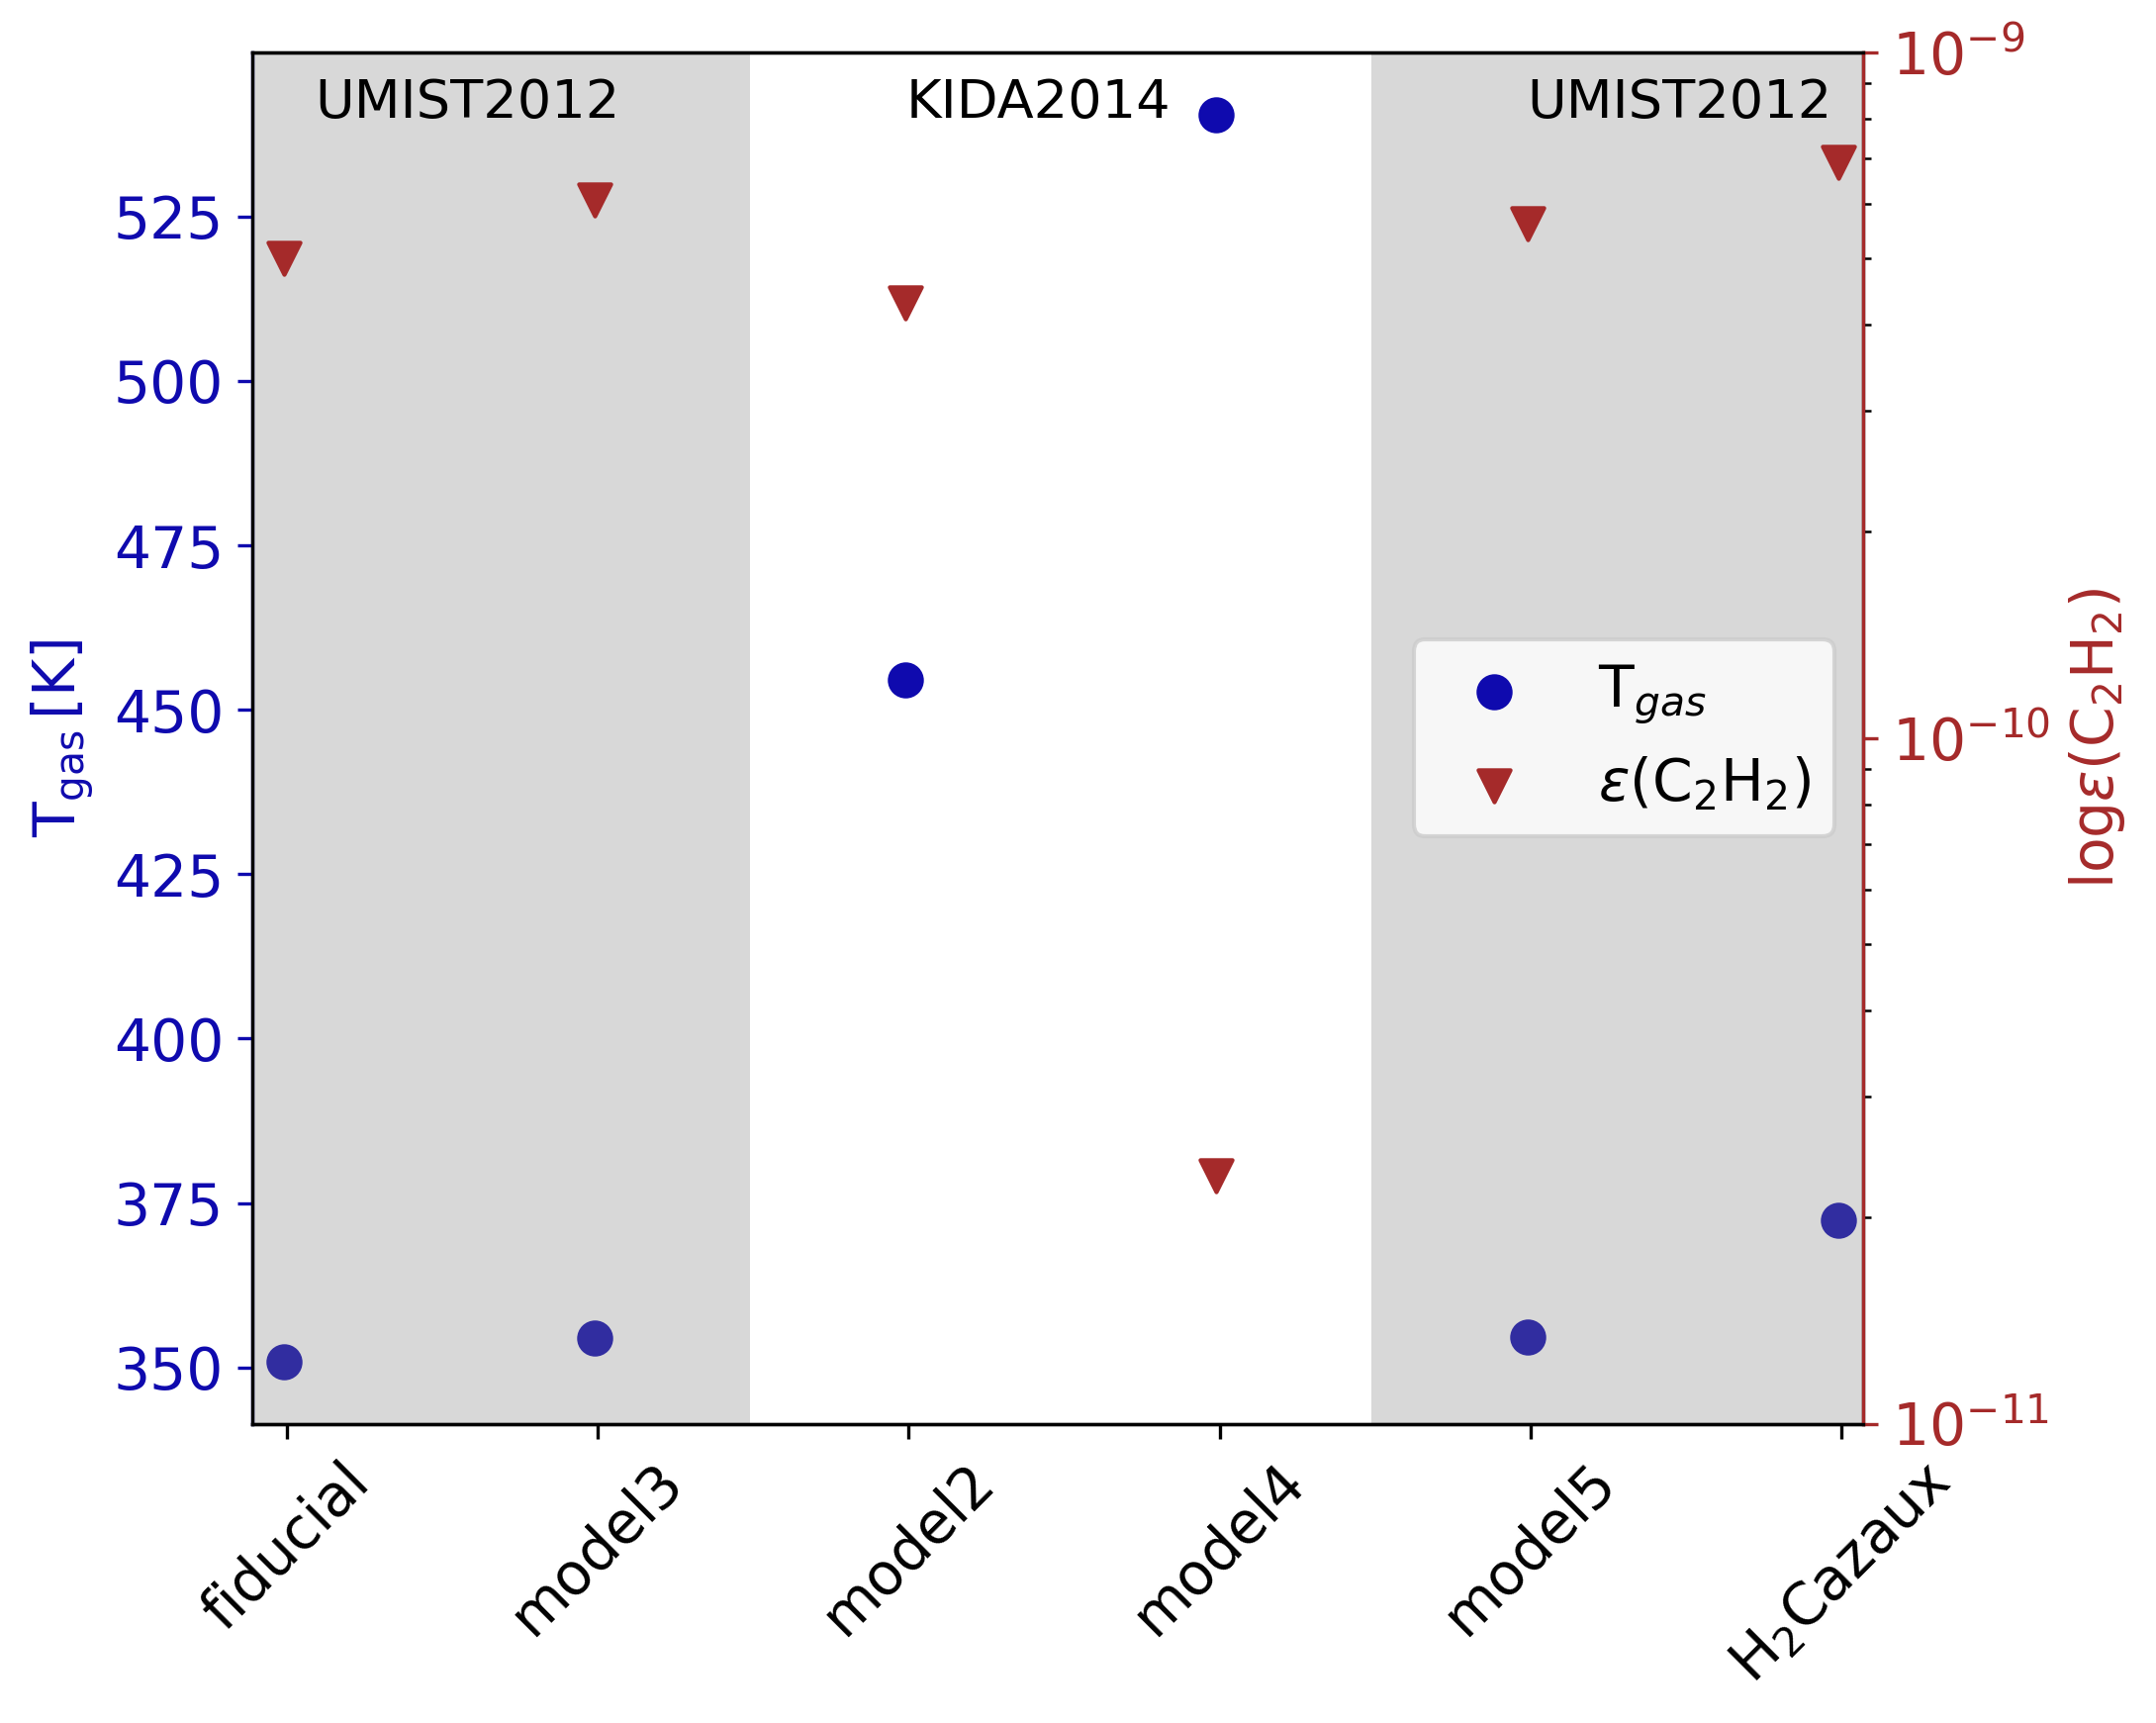
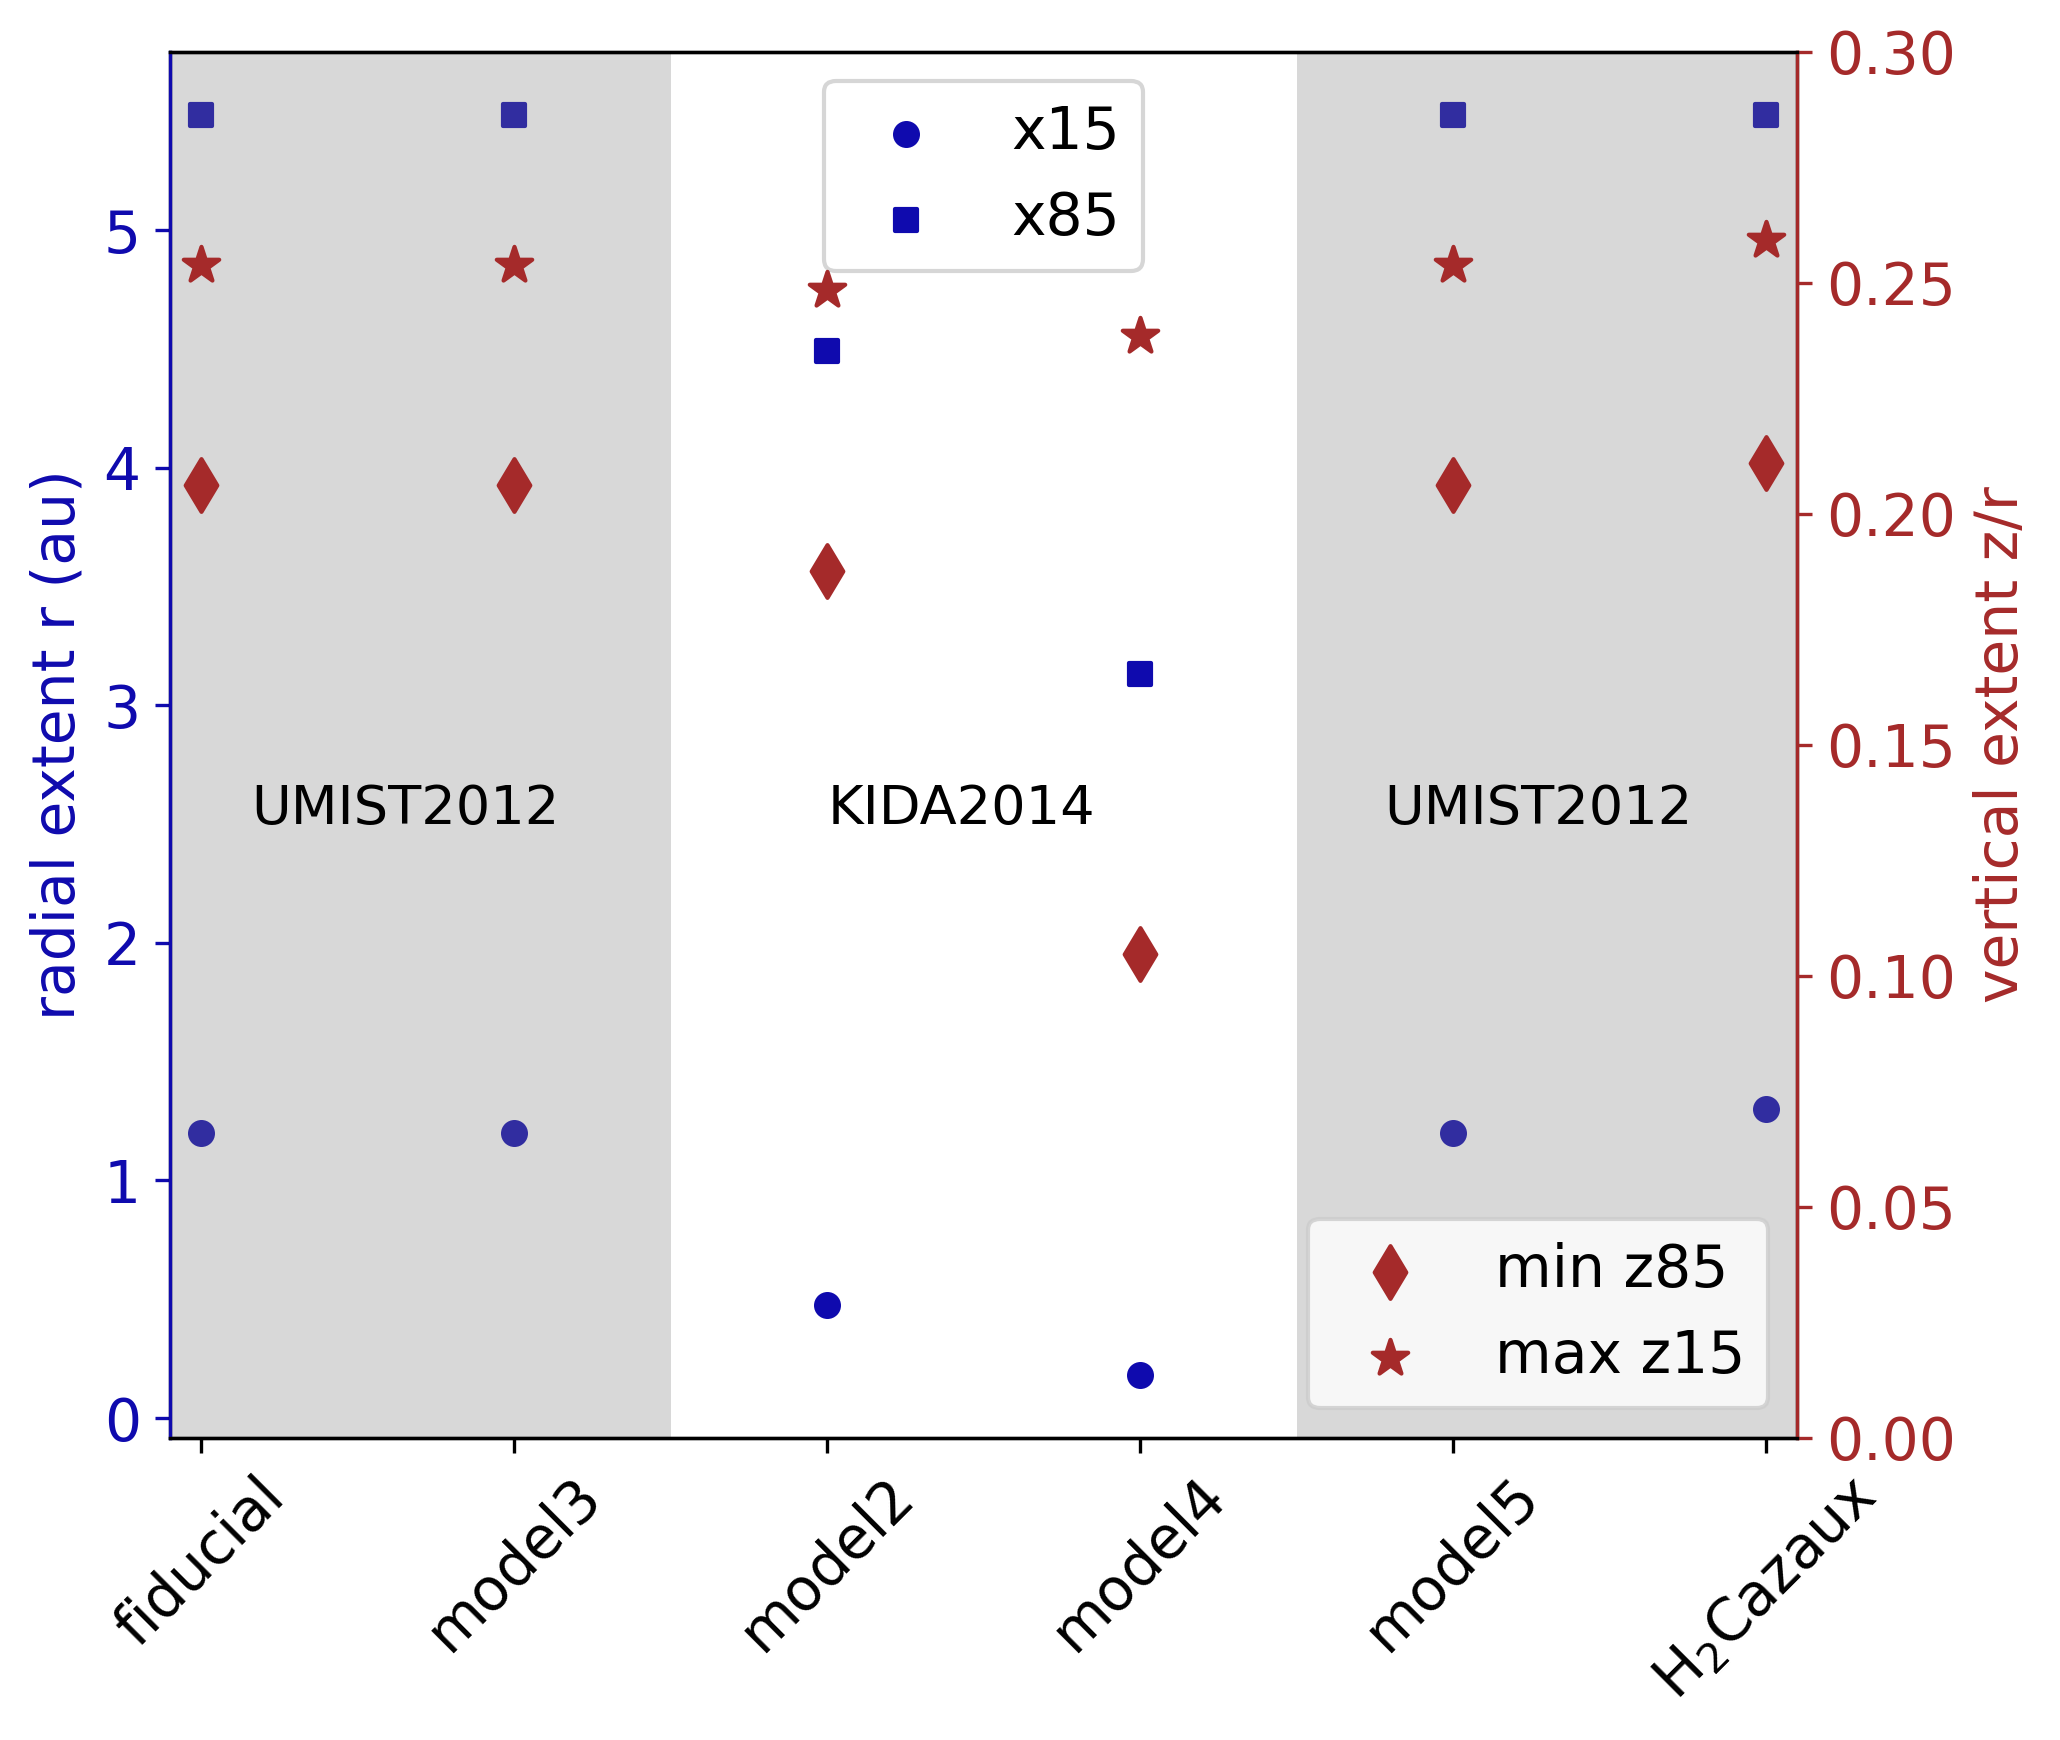
The integrated line flux for \ceC2H2 is a factor 3 higher in model 4 (KIDA2014) compared to model 3 (UMIST2012) that have the same chemical network (i.e. equal number of species). The difference arises from the different rate coefficients in the two databases. This leads to the molecular layer being shifted radially inwards in model 4 and being 50% more vertically extended (see Fig. 12, and also Sect. 3.3). As a result, the \ceC2H2 abundance and the abundance weighted gas temperature is higher in model 4 by 53% (see Fig. 11), which leads to the factor 3 higher line fluxes.
As seen in Fig. 2, in our fiducial model (TTauri disk model, power law surface density profile with a sharp inner edge), only the surface layers contribute towards the mid-IR emission. However, Woitke et al. (submitted) propose a disk model for EX Lupi with a steadily increasing surface density at the inner rim. This fits the spectral energy distribution, the overall shape of the mid-IR spectra observed by JWST, and the observed molecular features and its characteristics like emitting area and gas temperatures. In their model, they find a high abundance of \ceC2H2 in the O-rich gas around the inner rim, caused by X-ray irradiation. This region corresponds to our inner midplane (grid point 3) reservoir of \ceC2H2. This recent work shows that for models with a different physical structure, the inner regions (grid point 3) can also contribute to the mid-IR emission.
4.2 The effect of \ceH2 formation on \ceC2H2
In Sect. 3 we show that the H/H2 transition is important for the abundance of \ceC2H2 and in Sect. 4.1 we show that this affects also the flux emitted from this molecule. Hence, the formalism of how H2 forms may affect the abundance of \ceC2H2 in the disk surface layer.
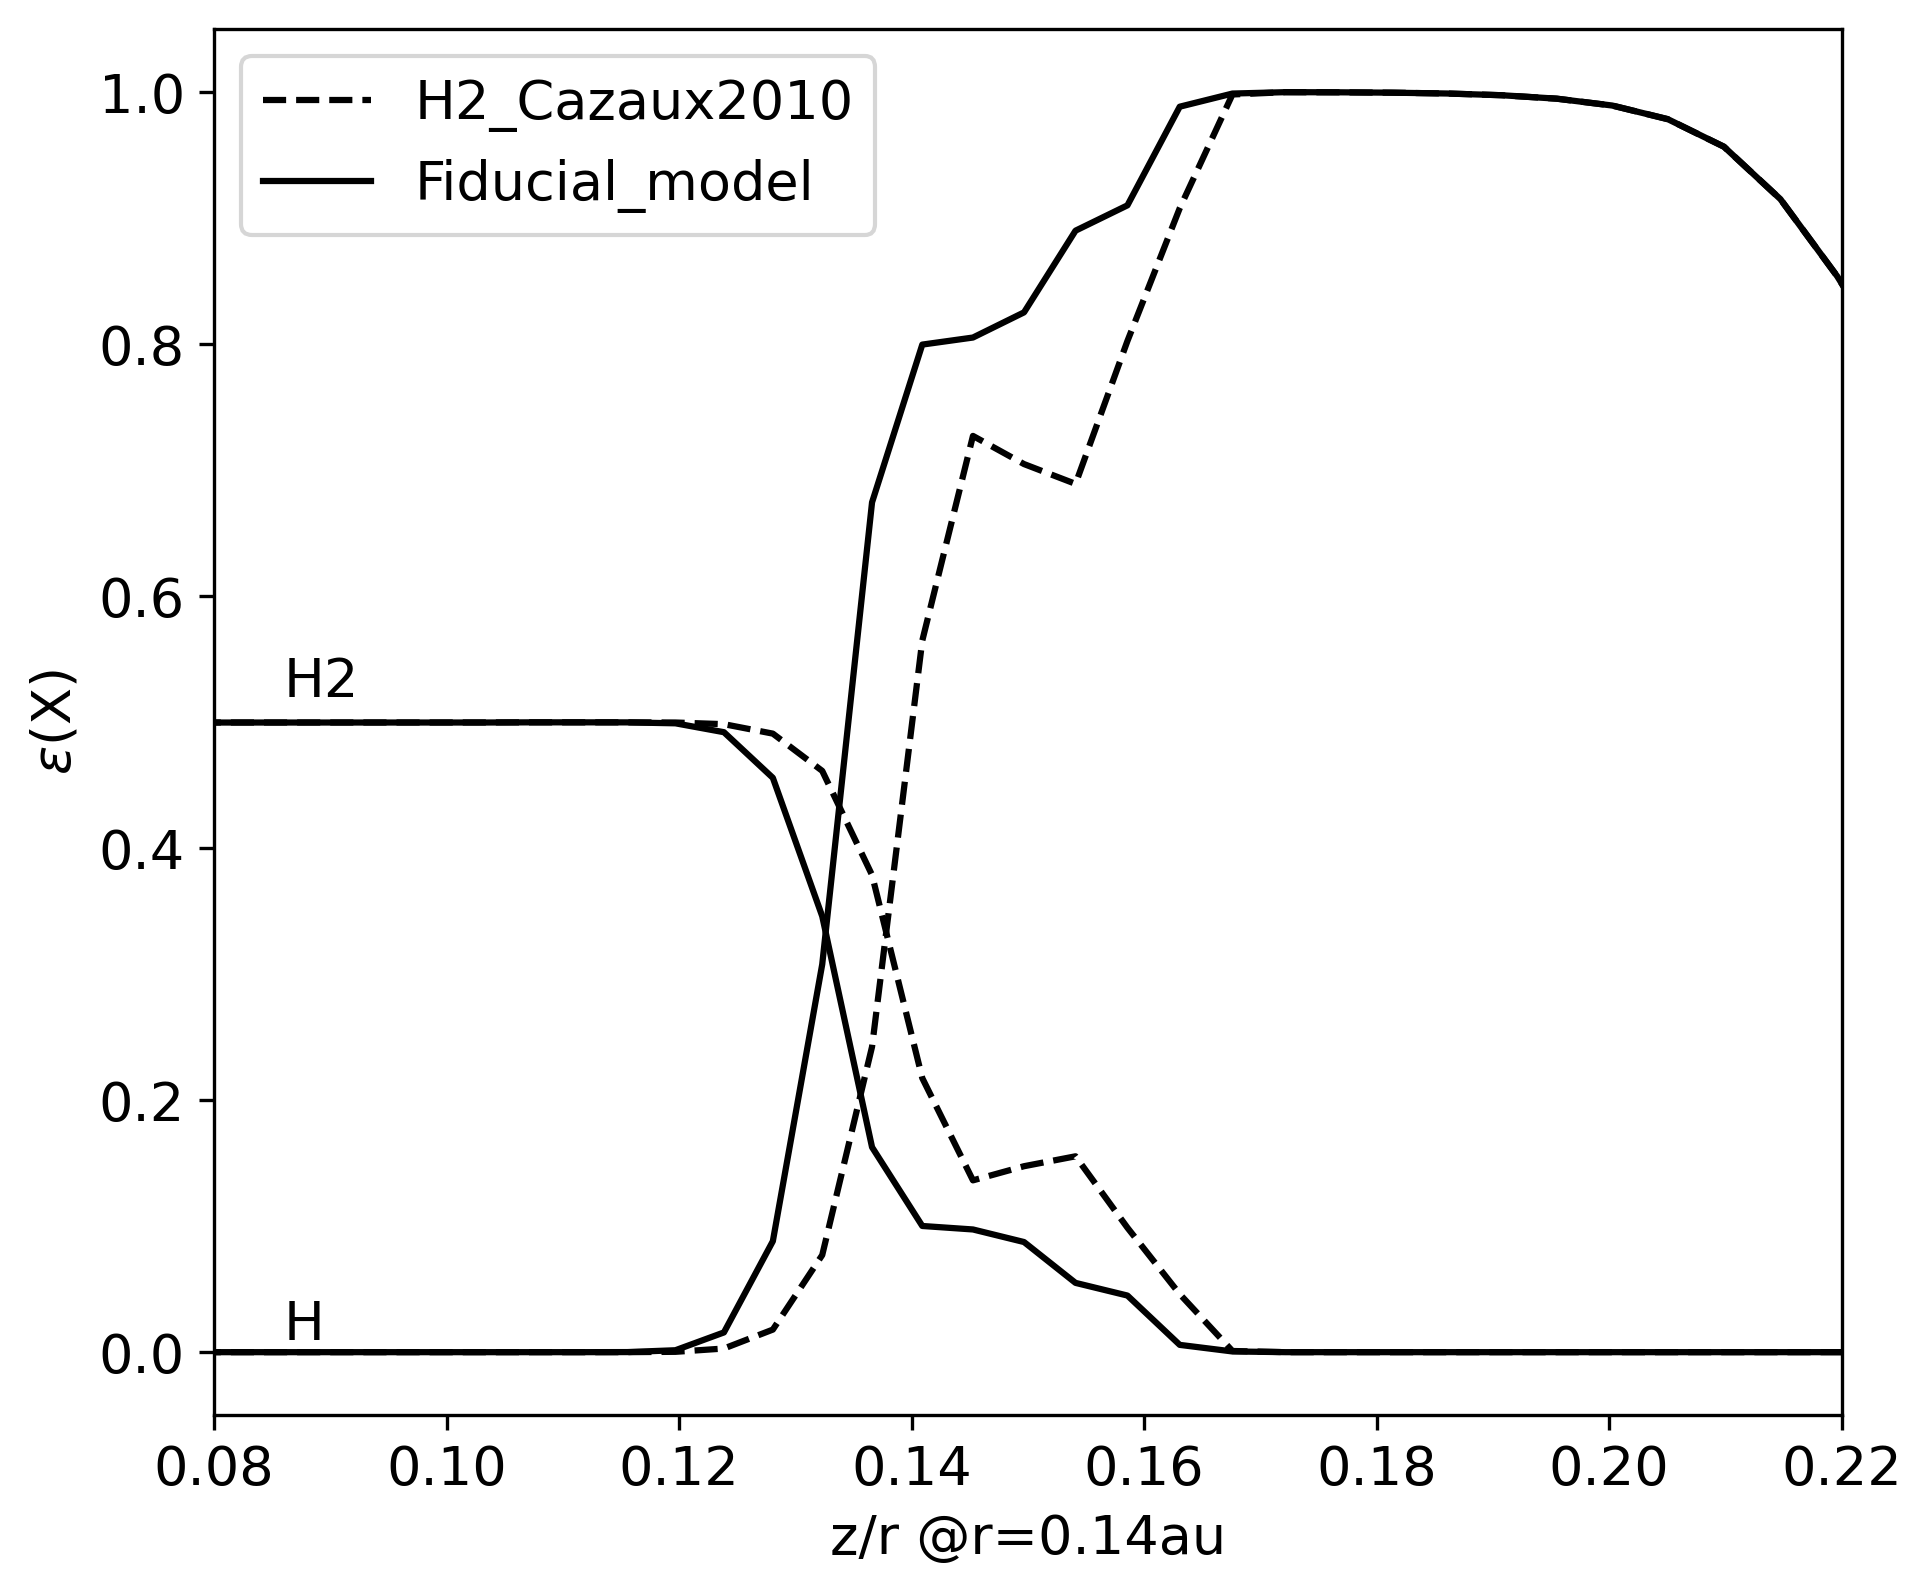
To investigate this, we compare the two approaches of H2 formation described in Cazaux & Tielens (2004) and Cazaux & Tielens (2010). In cold regions, the formation of H2 from physisorbed H dominates whereas in warm regions, the formation of H2 can also proceed via chemisorbed H. Figure 13 shows how the height of the H/H2 transition () shifts upwards by 0.005 au at r = 1 au when using an improved treatment of mobility of H atoms on grain surfaces at warmer temperatures. Model \ceH2Cazaux in Figs. 11 and 12 show the effect on the gas temperature, \ceC2H2 abundance and the emitting area of using different databases and the chemical networks. Model \ceH2Cazaux used extended chemical network with the UMIST2012 rate database. The peak flux emitted by \ceC2H2 at m (Q branch) increases by a factor of 2 (escape probability method) when using the Cazaux & Tielens (2010) formalism. The increase in flux can be attributed to the increased gas temperature of the line emitting region as shown in Fig. 11 when compared to model 5. Also in this case, the surface layer of \ceC2H2 extends radially inwards into the inner disk regions as warm temperatures promote the chemisorption channel for \ceH2 formation.
5 Discussion
We studied various pathways leading to the larger hydrocarbons in protoplanetary disks, specifically \ceC2H2. We isolate the major formation and destruction pathways for \ceC2H2 and \ceC6H6 and their differences on the basis of whether the UMIST2012 or KIDA2014 rate databases are used. We study the effect of the H/\ceH2 transition layer on the surface layers of \ceC2H2 when using different \ceH2 formation formalism. We compare in the following the hydrocarbon chemistry from our network in disks to earlier works on hot cores, disks, AGB stars and planetary atmospheres.
5.1 Acetylene
Comparing to previous disk studies, we find that the mechanism to unlock C from CO is the same as described in Bast et al. (2013, and references therein) and Walsh et al. (2015): CO is either photodissosciated to C or reacts with \ceHe+ produced by CR or X-ray photons (depending on which one dominates) to form \ceC+. The chemistry pathways to form \ceC2H2 shown in these studies are similar to what we find. Walsh et al. (2015) do not find the neutral-neutral formation pathway to \ceC2H from \ceC2 important. Our chemistry is also similar to that in Agúndez et al. (2008), although their models begin to form CH by C abstracting H from \ceH2. This reaction has a high energy barrier (12000 K) and is also reported in Walsh et al. (2015). Despite having this reaction in our disk models, we form CH via radiative association of C and H and destruction of \ceCH2 which is a barrier-free reaction and has no temperature dependence. This difference arises because Agúndez et al. (2008) follow the time dependent evolution of chemistry with hydrogen being initially molecular.
Warm carbon chain chemistry (WCCC) sources are Class 0/I objects that contain hydrocarbons (e.g. L1527) (Sakai et al. 2008). Densities in WCCCs are of the order of and temperatures are K. The chemistry is initiated by sublimating methane ice, which subsequently reacts with \ceC+ to form hydrocarbon molecules (Sakai & Yamamoto 2013). The formation of higher hydrocarbons proceeds via addition of \ceC+ followed by dissosciative recombination with \cee- or via reaction with \ceCH4 (Sakai & Yamamoto 2013). The chemistry is completely dominated by ion-neutral chemistry. In our disk models (point 1 which has similar density, temperatures as WCCC sources (see Fig. 1)), we find reactions with C to dominate over reactions with \ceC+. Higher hydrocarbons are formed also via addition of neutral \ceC. Addition of \ceH2 to ions is the main pathway in disks to form higher hydrogenated ion contrary to the addition of \ceCH4 to molecular ions which occurs in WCCC sources. The high abundances of \ceC+ required in WCCC sources are maintained either by high cosmic-ray induced ionization () or high UV. WCCCs can have (Kalvāns 2021) whereas we use in our disk models. We also use a steady state chemistry model while the WCCC models study time dependent chemistry starting from cold icy conditions in dark cores and warming up over short timescales as gravitational collapse provides energy. So there is also a fundamental difference in timescales of chemistry and history of material.
C-rich Asymptotic giant branch (AGB) stars have been studied in detail by for example Cherchneff & Glassgold (1993); Millar & Herbst (1994). Typical gas temperatures in the inner circumstellar envelopes around AGB stars are 1000 K and densities are the order of 10. The neutral-neutral chemistry dominates in these objects while the chemistry in disk surface layers that have similar physical conditions (see Fig. 1) is a mixture of ion-neutral and neutral-neutral chemistry. The difference in the initial abundances between our disk model and that of Cherchneff et al. (1993, Table 2) prevents a direct comparison. The trend of odd-even effect where even numbered C hydrocarbons are more abundant than the odd C (see Cherchneff & Glassgold 1993, Fig. 3) is also seen in our disk models.
Loison et al. (2019); Vuitton et al. (2019) studied the hydrocarbon chemistry in atmospheres of planets and moons. The chemical networks in these studies take into account the termolecular and pressure dependent reactions. The temperatures range from 80 to 180 K and pressures vary from 105 (surface) to 10-7 Pascal with altitude (Hörst 2017). These pressures correspond to a range of 108 to 10 of particle densities. The reactions destroying \ceC2H2 to form \ceC2H and \ceC2 in atmospheres (Vuitton et al. 2019) are also dominant in the disk surface layers but the physical conditions are not the same, thus preventing an in depth comparison.
5.2 Benzene
The reactions 20, 21 and 22 forming \ceC6H6 are the dominant pathways in both studies (Loison et al. 2019; Vuitton et al. 2019). We find the same reactions to be the major pathways forming benzene in the disk. The reaction
| (25) |
is found to contribute to form benzene at pressures 1015 to 10 and at temperatures of 160 K in atmospheres (Loison et al. 2019). However, Woods & Willacy (2007) who include this reaction, did not find it to be important in disks and it is therefore not included in our network.
On comparing the benzene formation routes in models using the UMIST2012 and KIDA2014 database the formation scheme via reactions 20 and 21 leading to \ceC6H6 are reported in McEwan et al. (1999) for the interstellar medium and are dominant in both the models. The reaction scheme forming benzene in protostellar environments outlined in Woods & Willacy (2007) as
| (26) |
is not dominant in any of our models. The thermal decomposition reaction of \ceCH2CCH with M to form \ceC2H2 becomes dominant and is favoured over the neutral-neutral reaction of \ceCH2CCH with \ceH2 forming \ceCH3CCH. This decreases the abundance of \ceCH3CCH resulting in reaction 26 not being dominant.
5.3 Future work
A chemical network can never be complete. Based on the species for which the reactions of formation and destruction were available, the extended network for hydrocarbon chemistry is provided. The difference in rate coefficients from the rate databases affects the chemistry and the abundance of species in the disk, but we show that the impact on the observable \ceC2H2 line fluxes is lower than a factor 2.
The values of adsorption energies shift the ice lines and the uncertainties in these thus affect the chemistry. Laboratory measurements of enthalpy of formation for a number of higher hydrocarbon ions are needed as they can also affect the chemical structure of the disk. We also miss species from the chemical network as we are limited by the rate databases. Our network does not include \ceC6H5 or \ceC6H4 (as explained in Sect. 2.3).
A clear distinction between the isotopomers of species and their rate coefficients needs to be included in the rate databases. KIDA has more species compared to KIDA2014, but it is not in the format of an easy to use ratefile. Often multiple rate coefficients exists and so the user has to decide which rates are better. In addition, the database changes constantly, causing an issue to reproduce results at a later stage. These are fundamental differences to UMIST which clearly recommends rates and has stable releases. Both approaches of course have their pros and cons.
We lack currently the framework to fully take into account the pressure-dependent reactions in PRODIMO which are dominant in planetary atmospheres. Adding these is beyond the scope of this paper and will be the subject of a future study. These reactions might be important in the midplane (point 3) but less so in the surface layers of the disks. It is necessary to test in the future the importance of such reactions for the high density inner disks as we may miss some key pathways.
6 Conclusion
In this paper, we aim to understand the hydrocarbon chemistry in the inner, warm and dense regions of planet-forming disks around T Tauri stars. We present an extended chemical network that includes hydrocarbon species with up to 8 carbon atoms. It includes the linear and cyclic isotopomers of several species, limited by the availability of such data in UMIST2012 and KIDA2014. With this network we can form the simplest cyclic hydrocarbon: Benzene.
We find that a more extended chemistry alone does not explain the high fluxes observed by Spitzer. A more detailed study varying physical parameters of the disk using this chemical network is needed to better interpret the observations. We find that the abundances of \ceC2H2 using the extended chemical network increase only by 40% relative to the large DIANA chemical network in the surface layers (grid point 1). The reservoir of gas-phase \ceC2H2 in the outer midplane disappears to form ices of longer hydrocarbons. The abundance in those regions hence drops by 7 orders of magnitude (grid point 2). There is a decreasing gradient of \ceC2H2 abundance in the inner midplane which is more prominent in model using the extended chemical network (model 5). With the expanded network, we find that in extremely inner regions of the disk the major \ceC2H2 formation pathways were balanced by the neutral-neutral, three body or thermal decomposition destruction pathways making secondary species like \ceH2O, \ceNH3 etc important. A detailed analysis of the three-body reactions network is needed and will be the focus of a subsequent paper.
H, \ceH2, C and \ceC+ are crucial to form \ceC2H2. Therefore, the layer at which the H/\ceH2 transition occurs is important and thus the details of the \ceH2 formation mechanism. We find that this transition occurs higher up in the disk when using the updated formalism of \ceH2 formation (Cazaux & Tielens 2010). This is also important in determining the radial extent of the surface layer where \ceC2H2 is abundant.
The extended chemical network presented here, is important when studying longer hydrocarbons in the disks. With JWST discovering more complex hydrocarbon species in disks more complex chemical modelling is warranted. Our work presents thus a key step forward in modelling the hydrocarbons in disks for future comparison with observations from JWST.
Acknowledgements.
This project has received funding from the European Union’s Horizon 2020 research and innovation programme under the Marie Sklodowska-Curie grant agreement No. 860470. CHR acknowledges the support of the Deutsche Forschungsgemeinschaft (DFG, German Research Foundation) research Unit ”Transition discs” - 325594231. CHR is grateful for support from Max Planck Society. We thank the anonymous referee for their constructive comments.References
- A. M. Arabhavi (2023) A. M. Arabhavi, I. K. 2023, Science, submitted
- Agúndez et al. (2008) Agúndez, M., Cernicharo, J., & Goicoechea, J. R. 2008, A&A, 483, 831
- Anderson et al. (2021) Anderson, D. E., Blake, G. A., Cleeves, L. I., et al. 2021, The Astrophysical Journal, 909, 55
- Bast et al. (2013) Bast, J. E., Lahuis, F., van Dishoeck, E. F., & Tielens, A. G. G. M. 2013, A&A, 551, A118
- Bergin et al. (2016) Bergin, E. A., Du, F., Cleeves, L. I., et al. 2016, ApJ, 831, 101
- Bethell & Bergin (2009) Bethell, T. & Bergin, E. 2009, Science, 326, 1675
- Carr & Najita (2011) Carr, J. S. & Najita, J. R. 2011, ApJ, 733, 102
- Cazaux & Tielens (2004) Cazaux, S. & Tielens, A. G. G. M. 2004, ApJ, 604, 222
- Cazaux & Tielens (2010) Cazaux, S. & Tielens, A. G. G. M. 2010, ApJ, 715, 698
- Cherchneff & Glassgold (1993) Cherchneff, I. & Glassgold, A. E. 1993, ApJ, 419, L41
- Cherchneff et al. (1993) Cherchneff, I., Glassgold, A. E., & Mamon, G. A. 1993, ApJ, 410, 188
- Draine & Bertoldi (1996) Draine, B. T. & Bertoldi, F. 1996, ApJ, 468, 269
- Duval et al. (2022) Duval, S. E., Bosman, A. D., & Bergin, E. A. 2022, ApJ, 934, L25
- Greenwood et al. (2019a) Greenwood, A. J., Kamp, I., Waters, L. B. F. M., Woitke, P., & Thi, W. F. 2019a, Astronomy and Astrophysics, 626, A6
- Greenwood et al. (2019b) Greenwood, A. J., Kamp, I., Waters, L. B. F. M., Woitke, P., & Thi, W. F. 2019b, Astronomy and Astrophysics, 631, A81
- Guzmán et al. (2021) Guzmán, V. V., Bergner, J. B., Law, C. J., et al. 2021, ApJS, 257, 6
- Heays et al. (2017) Heays, A. N., Bosman, A. D., & van Dishoeck, E. F. 2017, A&A, 602, A105
- Henning & Semenov (2013) Henning, T. & Semenov, D. 2013, Chemical Reviews, 113, 9016
- Hörst (2017) Hörst, S. M. 2017, Journal of Geophysical Research: Planets, 122, 432
- Ilee et al. (2021) Ilee, J. D., Walsh, C., Booth, A. S., et al. 2021, ApJS, 257, 9
- Kalvāns (2021) Kalvāns, J. 2021, ApJ, 910, 54
- Kamp et al. (2017) Kamp, I., Thi, W. F., Woitke, P., et al. 2017, Astronomy and Astrophysics, 607, A41
- Kamp et al. (2010) Kamp, I., Tilling, I., Woitke, P., Thi, W. F., & Hogerheijde, M. 2010, A&A, 510, A18
- Kress et al. (2010) Kress, M. E., Tielens, A. G. G. M., & Frenklach, M. 2010, Advances in Space Research, 46, 44
- Loison et al. (2019) Loison, J. C., Dobrijevic, M., & Hickson, K. M. 2019, Icarus, 329, 55
- McElroy et al. (2013) McElroy, D., Walsh, C., Markwick, A. J., et al. 2013, A&A, 550, A36
- McEwan et al. (1999) McEwan, M. J., Scott, G. B. I., Adams, N. G., et al. 1999, ApJ, 513, 287
- Meijerink et al. (2012) Meijerink, R., Aresu, G., Kamp, I., et al. 2012, A&A, 547, A68
- Millar & Herbst (1994) Millar, T. J. & Herbst, E. 1994, A&A, 288, 561
- Pontoppidan et al. (2010) Pontoppidan, K. M., Salyk, C., Blake, G. A., et al. 2010, ApJ, 720, 887
- Qi et al. (2013) Qi, C., Öberg, K. I., Wilner, D. J., & Rosenfeld, K. A. 2013, ApJ, 765, L14
- Rab et al. (2018) Rab, C., Güdel, M., Woitke, P., et al. 2018, A&A, 609, A91
- Rimmer & Helling (2016) Rimmer, P. B. & Helling, C. 2016, The Astrophysical Journal Supplement Series, 224, 9
- Rothman et al. (2009) Rothman, L. S., Gordon, I. E., Barbe, A., et al. 2009, J. Quant. Spec. Radiat. Transf., 110, 533
- Sakai et al. (2008) Sakai, N., Sakai, T., Hirota, T., & Yamamoto, S. 2008, ApJ, 672, 371
- Sakai & Yamamoto (2013) Sakai, N. & Yamamoto, S. 2013, Chemical Reviews, 113, 8981
- Salyk et al. (2008) Salyk, C., Pontoppidan, K. M., Blake, G. A., et al. 2008, ApJ, 676, L49
- Santoro et al. (2020) Santoro, G., Martínez, L., Lauwaet, K., et al. 2020, The Astrophysical Journal, 895, 97
- Tabone et al. (2023) Tabone, B., Bettoni, G., van Dishoeck, E. F., et al. 2023, Nature Astronomy [arXiv:2304.05954]
- Vuitton et al. (2019) Vuitton, V., Yelle, R. V., Klippenstein, S. J., Hörst, S. M., & Lavvas, P. 2019, Icarus, 324, 120
- Wakelam et al. (2012) Wakelam, V., Herbst, E., Loison, J. C., et al. 2012, ApJS, 199, 21
- Wakelam et al. (2015) Wakelam, V., Loison, J. C., Herbst, E., et al. 2015, ApJS, 217, 20
- Walsh et al. (2015) Walsh, C., Nomura, H., & van Dishoeck, E. 2015, A&A, 582, A88
- Woitke et al. (2009) Woitke, P., Kamp, I., & Thi, W. F. 2009, Astronomy and Astrophysics, 501, 383
- Woitke et al. (2016) Woitke, P., Min, M., Pinte, C., et al. 2016, Astronomy and Astrophysics, 586, A103
- Woitke et al. (2018) Woitke, P., Min, M., Thi, W. F., et al. 2018, A&A, 618, A57
- Woods & Willacy (2007) Woods, P. M. & Willacy, K. 2007, The Astrophysical Journal, 655, L49
Appendix A Reactions taken from STAND2020
We list the three body and thermal decomposition reactions that are taken from STAND2020 network and are included in our models. As three body reactions are pressure dependent, we take the low pressure rate coefficients for these reactions. A detailed analysis to formulate a complete three body reaction network will be left for future work.
| Reactions | |||
|---|---|---|---|
| CH + M C + H + M | 3.16E-10 | 0.00E+00 | 3.37E+04 |
| CN + M C + N + M | 1.09E-9 | 0.00E+00 | 7.10E+04 |
| H + H + M H2 + M | 9.13E-33 | -6.00E-01 | 0.00E+00 |
| H + N + M NH + M | 5.02E-32 | 0.00E+00 | 0.00E+00 |
| N + N + M N2 + M | 1.25E-32 | 0.00E+00 | 0.00E+00 |
| N + O + M NO + M | 3.26E-33 | 0.00E+00 | 0.00E+00 |
| C2H + M C2 + H + M | 5.00E-01 | -5.16E+00 | 5.74E+04 |
| C2O + M C2 + O + M | 5.00E-01 | -5.16E+00 | 5.74E+04 |
| CH2 + M CH + H + M | 9.33E+00 | 0.00E+00 | 4.51E+04 |
| HCN + M HNC + M | 1.45E-06 | 1.00E+00 | 2.38E+04 |
| CN + H + M HCN + M | 9.35E-30 | -2.00E+00 | 5.20E+20 |
| CO + O + M CO2 + M | 1.20E-32 | 0.00E+00 | 2.16E+03 |
| NH2 + M NH + H + M | 1.99E-09 | 0.00E+00 | 3.83E+04 |
| H + CH2 + M CH3+ M | 5.63E-31 | 0.00E+00 | 0.00E+00 |
| NH3 + M NH + H2 + M | 1.05E-09 | 0.00E+00 | 4.70E+04 |
| OCN + M CO + N + M | 3.95E-06 | -1.90E+00 | 3.01E+04 |
| H + C2H + M C2H2 + M | 2.63E-26 | -3.10E+00 | 7.21E+02 |
| \ceH2CO + M CO + \ceH2 + M | 9.40E-09 | 0.00E+00 | 3.32E+04 |
| \ceC2H2 + M + H M + \ceC2H3 + M | 4.87E-30 | -1.07E+00 | 8.38E+01 |
| \ceH + \ceC2H4 + M \ceC2H5 + M | 9.23E-29 | -1.51E+00 | 7.29E+01 |
| \ceH + \ceC2H5 + M \ceCH3CH3 + M | 2.00E-28 | -1.50E+00 | 0.00E+00 |
| H + \ceC2H3 + M \ceC2H4 + M | 1.49E-29 | -1.00E+00 | 0.00E+00 |
| \ceCH2OH + M + H \ceCH3OH + M | 1.20E-29 | 1.04E+00 | 0.00E+00 |
| \ceCH3O + H + M \ceCH3OH + M | 7.21E-30 | 1.24E+00 | 0.00E+00 |
| \ceH2CO + H + M \ceCH3O + M | 1.80E-31 | 6.60E-01 | 8.63E+02 |
| \ceCH2OH + M \ceH2CO + H + M | 1.66E-10 | 0.00E+00 | 1.26E+04 |
| \ceC2H + M \ceC2 + H + M | 5.00E-01 | -5.16E+00 | 5.74E+04 |
| \ceC2O + M \ceC2 + O + M | 5.00E-01 | -5.16E+00 | 5.74E+04 |
| H + \ceC2H3 + M \ceC2H4 + M | 1.49E-29 | -1.00E+00 | 0.00E+00 |
| \ceC2H4 + M \ceC2H2 + \ceH2 + M | 5.80E-08 | 0.00E+00 | 3.60E+00 |
| H + \ceC4H + M \ceHC4H + M | 2.64E-26 | -3.10E+00 | 7.21E+02 |
| \ceC2H + \ceC2H + M \ceHC4H + M | 5.56E-28 | -3.00E+00 | 3.00E+02 |
| H + \ceC4H3 + M \ceCH2CHCCH + M | 5.41E-23 | -3.97E+00 | 1.77E+02 |
| H + \ceHC4H + M \ceC4H3 + M | 3.53E-25 | -2.93E+00 | 1.76E+02 |
| \ceC2H2 + \ceC2H2 + M \ceCH2CHCCH + M | 3.78E-31 | 1.00E+00 | 1.86E+00 |
| \ceCH3CH3 + M \ceC2H4 + \ceH2 + M | 3.80E-07 | 0.00E+00 | 3.40E+04 |
| \ceCH2CCH + M \ceC2H2 + CH + M | 1.00E-14 | 0.00E+00 | 0.00E+00 |
| \ceC4H3 + M \ceC2H2 + \ceC2H + M | 5.34E-05 | 1.00E+00 | 4.15E+04 |
| H + \cee- + M \ceH- + M | 2.50E-31 | -1.50E+00 | 0.00E+00 |
| HS + H + M \ceH2S + M | 1.00E-30 | -2.00E+00 | 0.00E+00 |
| \ceH2 + S + M \ceH2S + M | 1.40E-31 | -1.90E+00 | 8.14E+03 |
| CO + S + M OCS + M | 3.00E-33 | 0.00E+00 | 1.00E+03 |
| \ceCH3+ + \ceH2 + M \ceCH5+ + M | 1.10E-28 | 0.00E+00 | 0.00E+00 |
| \ceC2H2+ + \ceC2H2 + M \ceC4H4+ + M | 1.60E-26 | 0.00E+00 | 0.00E+00 |
| \ceC2H2+ + \ceH2 + M \ceC2H4+ + M | 1.20E-27 | 0.00E+00 | 0.00E+00 |
| \ceC2H3+ + \ceH2 + M \ceC2H5+ + M | 1.49E-29 | 0.00E+00 | 0.00E+00 |
Appendix B \ceC2H2 formation/destruction pathways in KIDA2014
The following figures show the major formation and destruction pathways leading to \ceC2H2 when using the KIDA2014 database in model 2 (using large DIANA network) and model 4 (using extended hydrocarbon network).