Fiber-taper collected emission from NV centers in high- diamond microdisks
Abstract
Fiber-coupled microdisks are a promising platform for enhancing the spontaneous emission from color centers in diamond. The measured cavity-enhanced emission from the microdisk is governed by the effective volume () of each cavity mode, the cavity quality factor (), and the coupling between the microdisk and the fiber. Here we observe photoluminescence from an ensemble of nitrogen-vacancy centers into high microdisk modes, which when combined with coherent spectroscopy of the microdisk modes, allows us to elucidate the relative contributions of these factors. The broad emission spectrum acts as an internal light source facilitating mode identification over several cavity free spectral ranges. Analysis of the fiber-taper collected microdisk emission reveals spectral filtering both by the cavity and the fiber-taper, the latter of which we find preferentially couples to higher-order microdisk modes. Coherent mode spectroscopy is used to measure – the highest reported values for diamond microcavities operating at visible wavelengths. With realistic optimization of the microdisk dimensions, we predict that Purcell factors of are within reach.
1 Introduction
Color centers in diamond are luminescent defects consisting of vacancies and substitutional impurity atoms embedded in the carbon lattice. These color centers often combine long spin coherence times [1, 2, 3, 4] with spin-selective optical transitions [5, 6, 7]. The ability to perform all-optical spin control [8, 9, 10] and single-shot spin readout [11, 12, 13] makes these color centers promising qubit candidates for photonic quantum architectures [14, 15, 16, 17]. In particular, the optically addressable electron spin associated with the nitrogen-vacancy (NV) center [18] has been used in successful demonstrations of quantum memories [19, 20, 3, 21, 22], spin-photon [23] and spin-spin [24, 25, 26] entanglement, and quantum teleportation [27], culminating in the demonstration of multinode quantum networks [28, 29]. However, the ability to extend these proof-of-principle demonstrations to practical on- and off-chip quantum networks [30] requires the efficient generation and distribution of entanglement across remote network nodes [31]. The success rate of heralded entanglement schemes utilizing one-photon [29, 32] and two-photon protocols [24, 27, 25] are inherently limited by the collection probability of coherent photons. For experiments using NV centers, the flux of coherent photons is limited by the small branching into the zero-phonon line of and a poor collection efficiency due to total internal reflection at the diamond-air interface [33]. In turn, these shortcomings limit scalability to systems consisting of many entangled nodes, such as quantum-repeater-based long-distance quantum communication [34] and the realization of quantum networks [30, 31].
The tight confinement of light in optical resonators combining a high quality factor, , with a small mode volume, , leads to enhanced light-matter interactions [35, 36, 37]. For example, by utilizing the Purcell effect [38], optical cavities have been used to enhance the photon flux from color centers in diamond [39, 40, 33, 41]. While coupling between diamond color centers and optical cavities have been demonstrated using a variety of different geometries, including hybrid platforms [42, 43, 44, 45, 46, 47, 48] and tunable Fabry-Perot microcavities [49, 50, 51, 33, 52, 53, 54, 41, 55], realizing high monolithic cavities directly from single-crystal diamond (SCD) allows for minimizing while maximizing the emitter-cavity coupling by maximizing the overlap of the emitter dipole-moment with the cavity mode. Furthermore, the use of monolithic resonators facilitate the implementation of on-chip photonic buses for efficient photon extraction [56]. This, in conjunction with the fact that the highest quality color centers are found in bulk SCD [1, 57, 58, 59, 60, 61], has spurred the invention of fabrication techniques to further develop SCD devices [62, 63, 64, 65, 66, 67, 68, 69, 70, 71, 72].
At the visible wavelengths resonant with diamond color center optical transitions ( for the NV center), SCD ring resonators produced by a thinned membrane technique have been reported with and effective mode volume, [39]. In this wavelength range, racetrack resonators [62] fabricated using angled etching of SCD [73] have demonstrated – the previously largest -factor reported for monolithic SCD resonators – while open Fabry-Perot microcavities have been reported with [74, 75, 76]. However, the increased length of these resonators limits the smallest achievable . Photonic crystal nanocavities, on the other hand, have been demonstrated with [67], and ultra-low [70, 77]. Recently, quasi-isotropic undercut etching [78] has been used to create high microdisks [79, 80, 69] and photonic crystal cavities [81, 82]. While the latter have been realized at visible wavelengths, and coupling to color centers have been demonstrated [83, 84], previous studies of diamond microdisks have been predominantly limited to telecommunication wavelengths and applications related to cavity optomechanics [80, 85, 86, 87, 88].
In this work, we demonstrate coupling between an ensemble of NV centers and whispering gallery modes (WGM) in a SCD microdisk. We further employ the NV center emission, combined with coherent mode spectroscopy, to simultaneously probe the coupling of the NV centers to the microdisk and the coupling between the microdisk and the fiber-taper. To this end, we use the fiber-taper waveguide to evanescently probe and collect the microdisk mode PL, and harness the broad phonon sideband (PSB, ) as an internal lightsource to perform broadband cavity mode spectroscopy over several cavity free spectral ranges (FSR). We present a quantitative comparison of these results to coherent fiber-taper transmission spectroscopy performed using tunable lasers with a smaller tuning range () but higher spectral resolution.
The subsequent analysis reveals that high-intensity PL signals are not necessarily indicative of modes that promise the largest Purcell enhancement. The transmission measurements demonstrate microdisk -factors as high as with expected to be estimated from finite-difference time-domain (FDTD) simulations. With optimized dimensions, simulations predict that is within reach, suggesting that SCD microdisks may be able to match the Purcell factors demonstrated using photonic crystal [81, 83] and Fabry-Perot cavities [33, 54, 41].
The remainder of this paper is organized as follows. We begin by detailing the fiber-taper–microdisk system, followed by an outline of the experimental procedure. Next, we study the fiber-taper-collected PL spectra by comparing the measured intensities to those expected from a simple model of the system, based on the -factors extracted from the fiber-taper transmission measurements. Following this, we use broadband FSR data to perform mode-family identification to gain further insight into the fiber-taper–microdisk system. Finally, in the outlook, we discuss optimization of the microdisk geometry with regards to Purcell enhancement of spontaneous emission from color centers embedded in the microdisks.
2 Experimental setup: fiber and free-space coupling
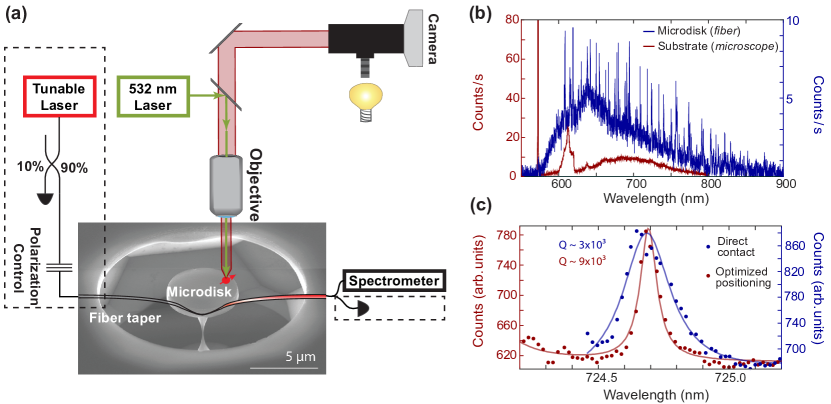
In the experiment presented in this work, we study SCD microdisks fabricated following the quasi-isotropic undercut etching process reported in Refs. [80, 79, 69]. The starting material were diamond chips with a crystal orientation grown using chemical vapor deposition (Element Six). These chips are “optical grade”, with an estimated nitrogen impurity concentration of . In brief, the microdisk fabrication procedure involves three main steps: (1) writing device patterns using electron beam lithography (EBL); (2) transferring patterns to a silicon nitride hard mask and subsequently to the diamond via anisotropic reactive ion etching; and (3) undercutting of the devices with a quasi-isotropic etch [78, 79]. As shown in Fig.1 (a), the resulting microdisks are supported by thin pedestals and have radius and thickness .
The experimental setup used to study both the fiber transmission and PL from the microdisks is shown schematically in Fig. 1 (a). The fiber-taper is positioned within the near-field of the microdisks using stepper-motor translation stages (Suruga Seiki), while imaged with white light on a CCD camera. When coupling the fiber-taper to the microdisk, it is important to avoid interactions with the unpatterned substrate surrounding the ring-shaped windows defining the microdisks. Therefore, the fiber-taper is produced with a dimple [89]. The fabrication procedure of the dimpled fiber-taper goes as follows. First, a single-mode optical fiber (Nufern 630-HP) designed for operation at visible wavelengths is heated using a stationary (no dither) hydrogen torch setup and stretched to produce a fiber-taper that is single mode at . Ideally, this corresponds to a fiber-taper radius of [90]. The dimple is then created by annealing the taper while it is wrapped around a ceramic knife edge. The dimpled fiber-taper is mounted in a U-bend shape, which provides mechanical stability and resilience.
To measure the transmission through the fiber-taper, we sweep the output of a narrow linewidth tunable diode laser (Newport Velocity, , ), while monitoring the transmitted signal on a photodiode. To maximize the contrast of the observed cavity resonances, the polarization of the incoupled light is adjusted using a fiber paddle controller. Wavelength- and time-dependent fluctuations in the laser output can make it difficult to discern low-contrast features in the transmission measurement. To mitigate this effect, a tap-off of the laser output provides a means to remove the laser-related features from the transmitted signal, thus aiding the identification of microdisk resonances.
For the fiber-taper-collected PL measurements, an ensemble of NV centers intrinsic to the optical grade diamond are excited from the top using a laser with power on the order of mW using a microscope objective of numerical aperture (). The resulting PL from the NV center PSB provides an internal cavity light-source that can be used to characterize the optical modes of the microdisk [91]. The microdisk-filtered PL is collected by the fiber-taper and detected by a spectrometer. An example spectrum collected using this system is shown by the blue curve in Fig. 1 (b). Sharp features associated with coupling to individual microdisk modes are evident over a broad range extending from . This broad signal extends over the same wavelength range as the reference spectrum (burgundy) of the NV center PSB [92, 93]. The reference spectrum was measured through direct free-space confocal microscope collection of PL from implanted NV centers in an electronic grade sample, using an alternative setup. It represents the standard shape of a PL spectrum from a diamond sample excited by light, including NV emission and Raman signatures at and [91]. The shape of the fiber-taper-collected signal is dependent on factors including the position of the excitation laser and the fiber-taper, respectively. We therefore note that the reference spectrum should not be used to compare collection efficiencies, as any variation between the two spectra arises due to the different collection methods.
At the close proximity required for evanescent coupling, the fiber-taper is attracted to the microdisk, often resulting in contact between the fiber-taper and the disk [62]. However, it is possible to mitigate completely this contact by taking advantage of the geometry of the window in the substrate that defines the microdisk (see Fig. 1 (a)). While maintaining sufficient separation between the sample surface and fiber-taper to prevent attraction, the taper can be roughly positioned at the desired lateral location. Then, by lowering the fiber quickly, contact between the window edges and the fiber-taper prevents the fiber from touching the microdisk. The importance of careful positioning of the fiber-taper is illustrated in Fig. 1 (c), where PL measurements were recorded for two different fiber-taper positions. An increase in the cavity linewidth, and corresponding reduction in -factor, is observed when the fiber is in contact with the microdisk (blue line in Fig. 1 (c) ). Intuitively, this reduction in -factor can be explained by, upon contact, the fiber effectively becomes part of the cavity and induces parasitic loss [94].
3 Fiber-coupled NV center photoluminescence and coherent mode spectroscopy
In this section, we use fiber-taper-collected PL from the NV centers as a means to characterize the microdisk optical mode spectrum over the broad PSB wavelength range. In an ideal case, NV center PL collected by the fiber-taper and imaged on the spectrometer would reveal the bare microdisk cavity mode spectrum, where the relative peak intensities are governed by the ratio of the individual modes. However, in practice, this is not the case as fiber-taper-collected PL is affected by the coupling between the fiber-taper and the microdisk – an effect that we elucidate in the analysis presented below.
Figure 2 shows fiber-taper-collected PL and fiber-taper transmission measurements for two microdisks, labeled and with dimensions [][] and [][], respectively. The correlation between peaks in PL and dips in the transmission spectrum, confirms that the observed PL peaks are signatures of microdisk optical modes. However, the strongest fiber-collected PL signals do not, in general, correspond to the highest- microdisk modes measured in transmission. Rather, the peaks in PL can be aligned with lower- microdisk modes coupled more strongly to the fiber-taper. Below we analyze both transmission and PL data to determine the relative impact of the optical mode -factor and coupling parameters on the observed signals.
The fiber-taper-collected PL intensity, , of microdisk mode , can be predicted by modeling the fiber-taper–microdisk collection system using an input-output formalism. Mode is defined to have field amplitude , total loss rate , and resonant frequency [94]. The mode is excited at frequency by a source term , whose strength depends on the emission of the NV PSB into mode . Given external coupling rate from the microdisk mode into the forward propagating (i.e. measured) mode of the fiber-taper, the collected PL intensity from mode is . The cavity mode equation of motion is [95]:
| (1) |
where . This can be solved for a steady-state value of to obtain:
| (2) |
Note that similar expressions can be derived for the symmetric and anti-symmetric modes of doublet resonances observed for the highest modes of our microdisks [96] .
Equation (2) can be expressed in terms of and and evaluated on resonance to obtain a peak height of:
| (3) |
From this expression, the emission into the fiber-taper for mode can be enhanced by increasing or by increasing the coupling strength to the fiber-taper, as determined by . The ratio of to is responsible for the dramatic differences in peak heights observed in Fig. 2, which we will quantify further below.

Microdisk supports a high mode alongside lower modes, as shown in the laser transmission measurements in Fig. 2 (a) and Fig. 2 (b). Microdisk , on the other hand, has a more complicated mode spectrum, as shown in Fig. 2 (c) and 2 (d). In Fig. 2 (b), we see that mode of microdisk has -factor approximately 4 times larger than that of mode . However, the PL associated with is barely discernible, while exhibits a strong peak. On the other hand, Fig. 2 (d) shows that for microdisk , the higher- mode does have a larger peak height in PL compared to the lower- mode. The data illustrates that the peak height is not always an accurate measure of the -factor, and that variations in the peak height can be strongly influenced by differences in and .
To quantify further the impact of the different contributions to the peak height, we define the peak height ratio, , for a given pair of modes:
| (4) |
Table 1 compares three distinct versions of , calculated under different assumptions to reveal the effect of and on the relative peak height. Here, is the ratio of the measured PL intensity values. We next use Eq. 3 to calculate for two different scenarios using the values of extracted from the laser transmission measurement in Fig. 2 (b) and Fig. 2 (d). First, assuming equal fiber-taper coupling for both modes, i.e. , we calculate the Purcell enhanced peak intensity and the corresponding . Second, to account for the different fiber-taper coupling strength for mode , we calculate the peak intensity, and the corresponding , by extracting from the transmission resonance contrast and the measured . We note that in calculating and , we made the assumption that ; a reasonable assumption on the grounds that the measurements are performed at room temperature where the microdisk–NV center system is in the “bad emitter regime”, so long as modes and have comparable mode volume, which we revisit shortly. In this regime, emitters behave as a white light source [97, 98, 51], and thus is expected to be proportional to the intensity of the PSB at , approximated to be constant over the narrow wavelength ranges studied in Fig. 2 (b) and Fig. 2 (d).
| Microdisk | |||||||
|---|---|---|---|---|---|---|---|
For microdisk , the cavity transmission spectrum, used to calculate , predicts to be times larger compared to . However, after considering the fiber-taper coupling strength, we predict that should be of similar magnitude () as , as quantified by . This demonstrates how the microdisk-fiber-taper coupling strength, quantified by the ratio , can compensate for a lower when determining PL peak height [94]. Furthermore, the order of magnitude reduction from to points towards other factors affecting the system. For comparison, a similar, but less drastic tendency, is observed for Microdisk .
We next elucidate on possible explanations accounting for the observed variations in . For microdisk , the discrepancy between and can be attributed to limited spectrometer resolution – the peak in PL is not fully captured by the spectrometer owing to the high -factor and doublet nature of mode . Note that by sending the excitation laser straight to the spectrometer, we estimate the spectrometer resolution to be , corresponding to a spectrometer limited – cavity resonances with -factors exceeding can not be reliably resolved [43]. Furthermore, a non-unity would be manifested by variations in . However, the present data is insufficient to conclude whether or not our assumptions for are valid. In particular, rather than approximating the PSB to be a white light source, one could model the NV center emission rate into each mode, as demonstrated for a single NV center coupled to a Fabry-Perot cavity [49]. A closer agreement between and is found for Microdisk . However, a disagreement is still present – the factor of difference between and can be explained by differences in the mode volume, as will be discussed further below.
4 Microdisk mode identification and impact on the fiber-coupled NV center emission
To better understand the coupling between the fiber-taper and the microdisk, we next identify microdisk WGM families using individual PL resonances. We start by identifying the cavity mode families based on the free spectral range. Next, we elucidate how modes of different order couple to the guided mode in the fiber-taper.
4.1 The cavity free spectral range
Microdisk mode families are classified by TE (TM)p,q, for predominantly transverse electric (magnetic) polarization and WGM radial (vertical) order number (). For a given polarization and , there exists a discrete spectrum of modes with a range of allowed azimuthal order number . The FSR, defined as the spacing between mode and mode of the same family, can be estimated according to
| (5) |
where is the effective refractive index, dependent on the mode family and varying slowly with . Modes of different families can be distinguished by measuring of regularly spaced resonances of wavelengths and determining . Comparison with simulated values of FSR can then be used to determine the polarization and () of each mode family.
In general, mode family identification for the relatively thick microdisks studied here can be challenging, in part due to their multi-mode nature and subsequently dense mode spectra. Such identification was not practical from the data collected for microdisks and . However, a sparse spectrum shown in Fig. 3 (a) owing to an advantageously positioned fiber-taper when measuring a third device with similar dimensions, microdisk ([]=[, ]), lends itself to this analysis.
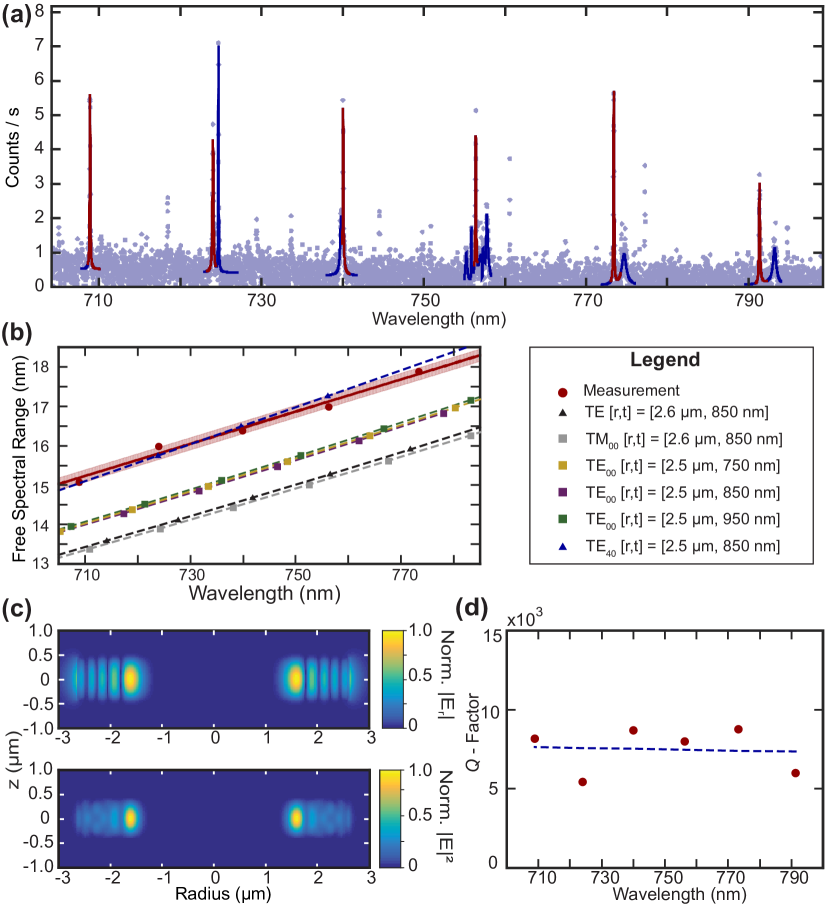
Figure 3 (a) shows the cavity mode spectrum for microdisk . The measured FSR for the dominant resonances in the spectrum are plotted in Fig. 3 (b), along with the FDTD simulated FSR values for several different mode families. These simulations were obtained using the MEEP open-source software package [99]. The measured FSR values are significantly larger compared to the simulated FSR values of the fundamental TE00 and TM00 modes. Accounting for an uncertainty in the radius on the order of (EBL resolution) and an uncertainty in the thickness (defined during the etching process and estimated via SEM), does not explain this difference. This is illustrated by the simulated values in Fig. 3 (b) accounting for a range of geometries. The high-intensity resonances in Fig. 3 (a), therefore, do not appear to be fundamental modes.
As alluded to by the typically dense mode spectra, simulations confirm that, for the dimensions of these microdisks, high- modes of both higher radial and vertical order exist. As the radial order increases, decreases and FSR as a function of wavelength increases. Consistent with these trends, the FSR of the TE40 mode is found to be of similar magnitude to the measured values (Fig. 3 (b)). Note that, the TE40 family has simulated radiation limited over the entire measured range – a trend consistent with the measured -factors in Fig. 3 (d), where the average shows no clear wavelength dependence, thus indicating that the measured modes are not radiation limited [100, 101]. Furthermore, the larger mode volume associated with higher-order TE40 modes is consistent with the difference in the observed ratios – as shown below, the TE40 mode have times larger compared to the fundamental TE (TM)00 modes.
| Mode | / | ||
|---|---|---|---|
| TM00 | 738 | 0.58 | 29 |
| TE00 | 742 | 0.59 | 33 |
| TE40 | 741 | 0.91 | 84 |
4.2 Fiber Coupling
The preferential fiber-taper coupling to the higher-order modes compared to the fundamental modes can be explained by their relative differences in phase matching to the fiber-taper. For fiber-taper position defined by radial, , and azimuthal, , coordinates with respect to the microdisk center, a taper with propagation wavenumber along the taper axis has electric field varying as ) [102]. For a microdisk with a mode field varying as , the phase-matching requirement is [102].
Assuming the fiber-taper has the waist radius expected for a single-mode fiber at [90], and evaluating the approximate for the wavelengths studied here at an of 27 is required for ideal phase-matching [90]. Table 2 demonstrates that, while the fundamental modes show nearly twice the desired angular momentum, the higher-order mode identified through FSR matching has close to and therefore, favourable phase matching could explain the preferential coupling. While it is not uncommon to couple to microdisk modes demonstrating [102], in such instances the devices are often made extremely thin to relax the phase-matching requirements by boosting the intensity of the microdisk field that interacts with the fiber-taper. Table 3 shows that the normalized microdisk thickness, , of the microdisks studied here are over twice the value of other demonstrated microdisk devices. This is consistent with the stringent phase-matching requirements limiting the coupling to lower-order modes in our system. Finally, Table 2 shows the difference in , defined by the peak field intensity , expected for the fundamental and TE40 modes. Here we assume that the fundamental modes are standing waves while the TE40 mode is a traveling wave, as observed in measurements of (likely fundamental) and (TE40), which are found to be a doublet and a singlet resonance, respectively. The variations in for mode , and the consequential change in , combined with the aforementioned differences in phase matching between the different microdisk modes and the fiber-taper is reflected by the observed discrepancy in (see Table 1).
5 Outlook: Optimized microdisk geometry for enhanced emitter-photon coupling
Utilizing the Purcell effect [38] provides a means to greatly enhance the flux of coherent photons from color centers in diamond by resonant coupling of the ZPL to a single mode in an optical resonator [33]. For an NV center with lifetime limited optical emission linewidth, optimally positioned in the microdisk with the dipole moment aligned perfectly with the optical field, the Purcell factor is given by [103, 75]:
| (6) |
where is the NV center Debye-Waller factor describing the branching into the ZPL [33, 104]. The scaling favours the use of fundamental cavity modes with low , on account of their large -factor and small (see Table 3) [103, 17]. In Fig. 4 (a) and (b), we show laser transmission measurement of diamond microdisks with []=[3.5, 1.0] and []=[3.6, 1.0] , respectively. To extract the -factor, we fit the cavity resonance with a double Lorentzian, and find at for both devices. These are, to the best of our knowledge, the largest -factors for SCD resonators at visible wavelength reported to date. Here we focus on modes around excited by the available laser and resonant with the SiV center [105]. We expect modes at , resonant with the NV center ZPL, to have comparable , depending on the trade-off between mode confinement and surface scattering – both the sensitivity to surface scattering and the mode confinement increases with shorter wavelengths [100, 101].
We now turn to discuss a potential route to improve the ratio for our devices. For a general optical resonator, the total -factor is given by:
| (7) |
where accounts for radiation loss, is associated with material absorption and encompasses surface scattering and absorption resulting from fabrication imperfections [101, 69]. Reducing the microdisk dimensions constitutes a method to simultaneously improve the coupling to lower-order fundamental modes and decreasing . Although is expected to decrease with microdisk and , in this work, we expect to be the dominant limitation to . As the relative contribution from fabrication induced imperfections in degrading increases with smaller disk size, (Fig. 4 (a) and (b)) provides a realistic upper-limit on expected with the current state-of-the-art fabrication techniques [69]. Therefore, in the following analysis, we set as the upper limit to i.e. , where we have ignored on the grounds of the low absorption in diamond.
In Fig. 4 (c) and (d), we simulate the behaviour of as a function of and , respectively. As expected, we observe an increase in with increasing and (blue lines in Fig. 4 (c) and (d)). Furthermore, as indicated by the horizontal dashed line in Fig. 4 (c), only becomes the dominant limitation for for – significantly smaller than the range of for the microdisks studied in this work. This observation supports our assumption that is the dominant limitation to .
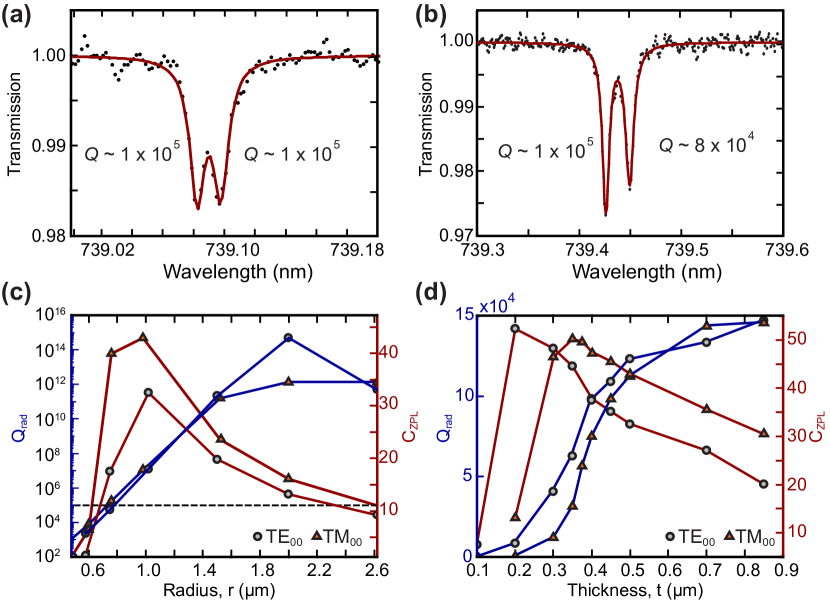
Assuming we can maintain the current , we next estimate the Purcell factor, , expected for our devices at smaller and . The burgundy lines in Fig. 4 (c) and (d) evaluates the theoretical according to Eq. 7 as a function of the microdisk radius and thickness, respectively. As can be seen, would be optimized for a microdisk with and , for which a maximum value is predicted. At this thickness, the devices will have – comparable to what is achieved with the current devices measured at telecom wavelengths [80].
Select literature values for , as well as the emitter-independent value , are presented in Table 4. The results presented in Fig. 4 (d) demonstrates that, provided fabrication-related losses can be controlled, diamond microdisks have the ability to match the achievable with other state-of-the-art on-chip devices, while providing a broader mode spectrum and direct low-loss coupling without integrated fiber couplers [89, 67].
| Ref. | Geometry | Material | ||
|---|---|---|---|---|
| [43] | Microdisk | GaP on diamond | 20 | 0.6 |
| [40] | Photonic crystal cavity | Diamond | 260 | 7.8 |
| [67] | Photonic crystal cavity | Diamond | 1600 | 48 |
| [82] | Photonic crystal cavity | Diamond | 1300 | 39 |
| This Work | Microdisk | Diamond | 1670 | 50 |
6 Conclusion
We have performed optical spectroscopy of single-crystal diamond microdisks using fiber-taper-collected PL from an ensemble of NV centers. The relative intensities of resonances in the PL signal compared to those predicted from transmission measurement of mode properties suggest that the PSB emission is filtered not only by the cavity spectrum but also by the mode-dependent coupling between the microdisk and the fiber-taper. A comparison between the measured and simulated FSR implies that, for the devices studied here, there is preferential fiber coupling to higher-order radial modes of relatively high -factor (). This preferential coupling is likely a consequence of a more favourable phase-matching conditions. The relatively poor coupling to the fiber-taper limits the characterization of the highest- mode families with fiber collection. However, thinning of the microdisks to should simultaneously improve the phase-matching-limited fiber-taper coupling and reduce the multi-mode nature of the microdisks by freezing out higher-order vertical modes. If the highest measured can be achieved in such small devices, diamond microdisks should be able to achieve Purcell factors , matching those of other state-of-the-art devices while providing broader mode spectrum and alternative integrated coupling options.
Acknowledgments
This work was supported by funding from the National Sciences and Engineering Research Council of Canada (NSERC), Alberta Innovates - Technology Futures (AITF) and National Research Council Nanotechnology Research Centre NanoInitiative. SF acknowledges support from the Swiss National Science Foundation (Project No. P500PT_206919).
References
- [1] G. Balasubramanian, P. Neumann, D. Twitchen, M. Markham, R. Kolesov, N. Mizuochi, J. Isoya, J. Achard, J. Beck, J. Tissler, V. Jacques, P. R. Hemmer, F. Jelezko, and J. Wrachtrup, “Ultralong spin coherence time in isotopically engineered diamond,” \JournalTitleNature Materials 8, 383–387 (2009).
- [2] M. H. Abobeih, J. Cramer, M. A. Bakker, N. Kalb, M. Markham, D. J. Twitchen, and T. H. Taminiau, “One-second coherence for a single electron spin coupled to a multi-qubit nuclear-spin environment,” \JournalTitleNature Communications 9, 2552 (2018).
- [3] C. E. Bradley, J. Randall, M. H. Abobeih, R. C. Berrevoets, M. J. Degen, M. A. Bakker, M. Markham, D. J. Twitchen, and T. H. Taminiau, “A Ten-Qubit Solid-State Spin Register with Quantum Memory up to One Minute,” \JournalTitlePhysical Review X 9, 031045 (2019).
- [4] P.-J. Stas, Y. Q. Huan, B. Machielse, E. N. Knall, A. Suleymanzade, B. Pingault, M. Sutula, S. W. Ding, C. M. Knaut, D. R. Assumpcao, Y.-C. Wei, M. K. Bhaskar, R. Riedinger, D. D. Sukachev, H. Park, M. Lončar, D. S. Levonian, and M. D. Lukin, “Robust multi-qubit quantum network node with integrated error detection,” \JournalTitleScience 378, 557–560 (2022).
- [5] P. Tamarat, N. B. Manson, J. P. Harrison, R. L. McMurtrie, A. Nizovtsev, C. Santori, R. G. Beausoleil, P. Neumann, T. Gaebel, F. Jelezko, P. Hemmer, and J. Wrachtrup, “Spin-flip and spin-conserving optical transitions of the nitrogen-vacancy centre in diamond,” \JournalTitleNew Journal of Physics 10, 045004 (2008).
- [6] L. Robledo, H. Bernien, T. V. D. Sar, and R. Hanson, “Spin dynamics in the optical cycle of single nitrogen-vacancy centres in diamond,” \JournalTitleNew Journal of Physics 13 (2011).
- [7] T. Müller, C. Hepp, B. Pingault, E. Neu, S. Gsell, M. Schreck, H. Sternschulte, D. Steinmüller-Nethl, C. Becher, and M. Atatüre, “Optical signatures of silicon-vacancy spins in diamond,” \JournalTitleNature Communications 5, 3328 (2014).
- [8] L. J. Rogers, K. D. Jahnke, M. H. Metsch, A. Sipahigil, J. M. Binder, T. Teraji, H. Sumiya, J. Isoya, M. D. Lukin, P. Hemmer, and F. Jelezko, “All-Optical Initialization, Readout, and Coherent Preparation of Single Silicon-Vacancy Spins in Diamond,” \JournalTitlePhysical Review Letters 113, 263602 (2014).
- [9] Y. Chu, M. Markham, D. J. Twitchen, and M. D. Lukin, “All-optical control of a single electron spin in diamond,” \JournalTitlePhysical Review A 91, 021801 (2015).
- [10] J. N. Becker, B. Pingault, D. Groß, M. Gündoğan, N. Kukharchyk, M. Markham, A. Edmonds, M. Atatüre, P. Bushev, and C. Becher, “All-Optical Control of the Silicon-Vacancy Spin in Diamond at Millikelvin Temperatures,” \JournalTitlePhysical Review Letters 120, 053603 (2018).
- [11] L. Robledo, L. Childress, H. Bernien, B. Hensen, P. F. A. Alkemade, and R. Hanson, “High-fidelity projective read-out of a solid-state spin quantum register,” \JournalTitleNature 477, 574–578 (2011).
- [12] D. D. Sukachev, A. Sipahigil, C. T. Nguyen, M. K. Bhaskar, R. E. Evans, F. Jelezko, and M. D. Lukin, “Silicon-Vacancy Spin Qubit in Diamond: A Quantum Memory Exceeding 10 ms with Single-Shot State Readout,” \JournalTitlePhysical Review Letters 119, 223602 (2017).
- [13] D. M. Irber, F. Poggiali, F. Kong, M. Kieschnick, T. Lühmann, D. Kwiatkowski, J. Meijer, J. Du, F. Shi, and F. Reinhard, “Robust all-optical single-shot readout of nitrogen-vacancy centers in diamond,” \JournalTitleNature Communications 12, 532 (2021).
- [14] S. Johnson, P. R. Dolan, and J. M. Smith, “Diamond photonics for distributed quantum networks,” \JournalTitleProgress in Quantum Electronics 55, 129–165 (2017).
- [15] D. D. Awschalom, R. Hanson, J. Wrachtrup, and B. B. Zhou, “Quantum technologies with optically interfaced solid-state spins,” \JournalTitleNature Photonics 12, 516–527 (2018).
- [16] M. Ruf, N. H. Wan, H. Choi, D. Englund, and R. Hanson, “Quantum networks based on color centers in diamond,” \JournalTitleJournal of Applied Physics 130, 070901 (2021).
- [17] P. K. Shandilya, S. Flågan, N. C. Carvalho, E. Zohari, V. K. Kavatamane, J. E. Losby, and P. E. Barclay, “Diamond Integrated Quantum Nanophotonics: Spins, Photons and Phonons,” \JournalTitleJournal of Lightwave Technology 40, 7538–7571 (2022).
- [18] M. W. Doherty, N. B. Manson, P. Delaney, F. Jelezko, J. Wrachtrup, and L. C. Hollenberg, “The nitrogen-vacancy colour centre in diamond,” \JournalTitlePhysics Reports 528, 1–45 (2013).
- [19] M. V. G. Dutt, L. Childress, L. Jiang, E. Togan, J. Maze, F. Jelezko, A. S. Zibrov, P. R. Hemmer, and M. D. Lukin, “Quantum Register Based on Individual Electronic and Nuclear Spin Qubits in Diamond,” \JournalTitleScience 316, 1312–1316 (2007).
- [20] G. D. Fuchs, G. Burkard, P. V. Klimov, and D. D. Awschalom, “A quantum memory intrinsic to single nitrogen–vacancy centres in diamond,” \JournalTitleNature Physics 7, 789–793 (2011).
- [21] C. E. Bradley, S. W. de Bone, P. F. W. Möller, S. Baier, M. J. Degen, S. J. H. Loenen, H. P. Bartling, M. Markham, D. J. Twitchen, R. Hanson, D. Elkouss, and T. H. Taminiau, “Robust quantum-network memory based on spin qubits in isotopically engineered diamond,” \JournalTitlenpj Quantum Information 8, 122 (2022).
- [22] M. H. Abobeih, Y. Wang, J. Randall, S. J. H. Loenen, C. E. Bradley, M. Markham, D. J. Twitchen, B. M. Terhal, and T. H. Taminiau, “Fault-tolerant operation of a logical qubit in a diamond quantum processor,” \JournalTitleNature 606, 884–889 (2022).
- [23] E. Togan, Y. Chu, A. S. Trifonov, L. Jiang, J. Maze, L. Childress, M. V. G. Dutt, A. S. Sørensen, P. R. Hemmer, A. S. Zibrov, and M. D. Lukin, “Quantum entanglement between an optical photon and a solid-state spin qubit,” \JournalTitleNature 466, 730–734 (2010).
- [24] H. Bernien, B. Hensen, W. Pfaff, G. Koolstra, M. S. Blok, L. Robledo, T. H. Taminiau, M. Markham, D. J. Twitchen, L. Childress, and R. Hanson, “Heralded entanglement between solid-state qubits separated by three metres,” \JournalTitleNature 497, 86–90 (2013).
- [25] B. Hensen, H. Bernien, A. E. Dréau, A. Reiserer, N. Kalb, M. S. Blok, J. Ruitenberg, R. F. L. Vermeulen, R. N. Schouten, C. Abellán, W. Amaya, V. Pruneri, M. W. Mitchell, M. Markham, D. J. Twitchen, D. Elkouss, S. Wehner, T. H. Taminiau, and R. Hanson, “Loophole-free Bell inequality violation using electron spins separated by 1.3 kilometres,” \JournalTitleNature 526, 682–686 (2015).
- [26] N. Kalb, A. A. Reiserer, P. C. Humphreys, J. J. W. Bakermans, S. J. Kamerling, N. H. Nickerson, S. C. Benjamin, D. J. Twitchen, M. Markham, and R. Hanson, “Entanglement distillation between solid-state quantum network nodes,” \JournalTitleScience 356, 928–932 (2017).
- [27] W. Pfaff, B. J. Hensen, H. Bernien, S. B. van Dam, M. S. Blok, T. H. Taminiau, M. J. Tiggelman, R. N. Schouten, M. Markham, D. J. Twitchen, and R. Hanson, “Unconditional quantum teleportation between distant solid-state quantum bits,” \JournalTitleScience 345, 532–535 (2014).
- [28] M. Pompili, S. L. N. Hermans, S. Baier, H. K. C. Beukers, P. C. Humphreys, R. N. Schouten, R. F. L. Vermeulen, M. J. Tiggelman, L. dos Santos Martins, B. Dirkse, S. Wehner, and R. Hanson, “Realization of a multinode quantum network of remote solid-state qubits,” \JournalTitleScience 372, 259–264 (2021).
- [29] S. L. N. Hermans, M. Pompili, H. K. C. Beukers, S. Baier, J. Borregaard, and R. Hanson, “Qubit teleportation between non-neighbouring nodes in a quantum network,” \JournalTitleNature 605, 663–668 (2022).
- [30] H. J. Kimble, “The quantum internet,” \JournalTitleNature 453, 1023–1030 (2008).
- [31] S. Wehner, D. Elkouss, and R. Hanson, “Quantum internet: A vision for the road ahead,” \JournalTitleScience 362, eaam9288 (2018).
- [32] P. C. Humphreys, N. Kalb, J. P. J. Morits, R. N. Schouten, R. F. L. Vermeulen, D. J. Twitchen, M. Markham, and R. Hanson, “Deterministic delivery of remote entanglement on a quantum network,” \JournalTitleNature 558, 268–273 (2018).
- [33] D. Riedel, I. Söllner, B. J. Shields, S. Starosielec, P. Appel, E. Neu, P. Maletinsky, and R. J. Warburton, “Deterministic Enhancement of Coherent Photon Generation from a Nitrogen-Vacancy Center in Ultrapure Diamond,” \JournalTitlePhysical Review X 7, 031040 (2017).
- [34] S. Guha, H. Krovi, C. A. Fuchs, Z. Dutton, J. A. Slater, C. Simon, and W. Tittel, “Rate-loss analysis of an efficient quantum repeater architecture,” \JournalTitlePhysical Review A 92, 022357 (2015).
- [35] K. J. Vahala, “Optical microcavities,” \JournalTitleNature 424, 839–846 (2003).
- [36] D. Wang, H. Kelkar, D. Martin-Cano, D. Rattenbacher, A. Shkarin, T. Utikal, S. Götzinger, and V. Sandoghdar, “Turning a molecule into a coherent two-level quantum system,” \JournalTitleNature Physics 15, 483–489 (2019).
- [37] D. Najer, I. Söllner, P. Sekatski, V. Dolique, M. C. Löbl, D. Riedel, R. Schott, S. Starosielec, S. R. Valentin, A. D. Wieck, N. Sangouard, A. Ludwig, and R. J. Warburton, “A gated quantum dot strongly coupled to an optical microcavity,” \JournalTitleNature 575, 622–627 (2019).
- [38] E. M. Purcell, H. C. Torrey, and R. V. Pound, “Resonance Absorption by Nuclear Magnetic Moments in a Solid,” \JournalTitlePhysical Review 69, 37–38 (1946).
- [39] A. Faraon, P. E. Barclay, C. Santori, K.-M. C. Fu, and R. G. Beausoleil, “Resonant enhancement of the zero-phonon emission from a colour centre in a diamond cavity,” \JournalTitleNature Photonics 5, 301–305 (2011).
- [40] A. Faraon, C. Santori, Z. Huang, V. M. Acosta, and R. G. Beausoleil, “Coupling of Nitrogen-Vacancy Centers to Photonic Crystal Cavities in Monocrystalline Diamond,” \JournalTitlePhysical Review Letters 109, 033604 (2012).
- [41] M. Ruf, M. Weaver, S. van Dam, and R. Hanson, “Resonant Excitation and Purcell Enhancement of Coherent Nitrogen-Vacancy Centers Coupled to a Fabry-Perot Microcavity,” \JournalTitlePhysical Review Applied 15, 024049 (2021).
- [42] K.-M. C. Fu, C. Santori, P. E. Barclay, I. Aharonovich, S. Prawer, N. Meyer, A. M. Holm, and R. G. Beausoleil, “Coupling of nitrogen-vacancy centers in diamond to a GaP waveguide,” \JournalTitleApplied Physics Letters 93, 234107 (2008).
- [43] P. E. Barclay, K.-M. C. Fu, C. Santori, and R. G. Beausoleil, “Chip-based microcavities coupled to nitrogen-vacancy centers in single crystal diamond,” \JournalTitleApplied Physics Letters 95, 191115 (2009).
- [44] P. E. Barclay, K.-M. C. Fu, C. Santori, A. Faraon, and R. G. Beausoleil, “Hybrid Nanocavity Resonant Enhancement of Color Center Emission in Diamond,” \JournalTitlePhysical Review X 1, 011007 (2011).
- [45] M. Gould, E. R. Schmidgall, S. Dadgostar, F. Hatami, and K.-M. C. Fu, “Efficient Extraction of Zero-Phonon-Line Photons from Single Nitrogen-Vacancy Centers in an Integrated GaP-on-Diamond Platform,” \JournalTitlePhysical Review Applied 6, 011001 (2016).
- [46] E. R. Schmidgall, S. Chakravarthi, M. Gould, I. R. Christen, K. Hestroffer, F. Hatami, and K.-M. C. Fu, “Frequency Control of Single Quantum Emitters in Integrated Photonic Circuits,” \JournalTitleNano Letters 18, 1175–1179 (2018).
- [47] K. G. Fehler, L. Antoniuk, N. Lettner, A. P. Ovvyan, R. Waltrich, N. Gruhler, V. A. Davydov, V. N. Agafonov, W. H. P. Pernice, and A. Kubanek, “Hybrid Quantum Photonics Based on Artificial Atoms Placed Inside One Hole of a Photonic Crystal Cavity,” \JournalTitleACS Photonics 8, 2635–2641 (2021).
- [48] D. Riedel, H. Lee, J. F. Herrmann, J. Grzesik, V. Ansari, J.-M. Borit, H. S. Stokowski, S. Aghaeimeibodi, H. Lu, P. J. McQuade, N. A. Melosh, Z.-X. Shen, A. H. Safavi-Naeini, and J. Vučković, “Efficient Photonic Integration of Diamond Color Centers and Thin-Film Lithium Niobate,” \JournalTitlearXiv: 2306.15207 (2023).
- [49] R. Albrecht, A. Bommer, C. Deutsch, J. Reichel, and C. Becher, “Coupling of a Single Nitrogen-Vacancy Center in Diamond to a Fiber-Based Microcavity,” \JournalTitlePhysical Review Letters 110, 243602 (2013).
- [50] S. Johnson, P. R. Dolan, T. Grange, A. A. P. Trichet, G. Hornecker, Y. C. Chen, L. Weng, G. M. Hughes, A. A. R. Watt, A. Auffèves, and J. M. Smith, “Tunable cavity coupling of the zero phonon line of a nitrogen-vacancy defect in diamond,” \JournalTitleNew Journal of Physics 17, 122003 (2015).
- [51] H. Kaupp, T. Hümmer, M. Mader, B. Schlederer, J. Benedikter, P. Haeusser, H.-C. Chang, H. Fedder, T. W. Hänsch, and D. Hunger, “Purcell-Enhanced Single-Photon Emission from Nitrogen-Vacancy Centers Coupled to a Tunable Microcavity,” \JournalTitlePhysical Review Applied 6, 054010 (2016).
- [52] J. Benedikter, H. Kaupp, T. Hümmer, Y. Liang, A. Bommer, C. Becher, A. Krueger, J. M. Smith, T. W. Hänsch, and D. Hunger, “Cavity-Enhanced Single-Photon Source Based on the Silicon-Vacancy Center in Diamond,” \JournalTitlePhysical Review Applied 7, 024031 (2017).
- [53] S. Häußler, J. Benedikter, K. Bray, B. Regan, A. Dietrich, J. Twamley, I. Aharonovich, D. Hunger, and A. Kubanek, “Diamond photonics platform based on silicon vacancy centers in a single-crystal diamond membrane and a fiber cavity,” \JournalTitlePhysical Review B 99, 165310 (2019).
- [54] R. Høy Jensen, E. Janitz, Y. Fontana, Y. He, O. Gobron, I. P. Radko, M. Bhaskar, R. Evans, C. D. Rodríguez Rosenblueth, L. Childress, A. Huck, and U. Lund Andersen, “Cavity-Enhanced Photon Emission from a Single Germanium-Vacancy Center in a Diamond Membrane,” \JournalTitlePhysical Review Applied 13, 064016 (2020).
- [55] G. Bayer, R. Berghaus, S. Sachero, A. B. Filipovski, L. Antoniuk, N. Lettner, R. Waltrich, M. Klotz, P. Maier, V. Agafonov, and A. Kubanek, “A Quantum Repeater Platform based on Single SiV- Centers in Diamond with Cavity-Assisted, All-Optical Spin Access and Fast Coherent Driving,” \JournalTitlearXiv:2210.16157 pp. 1–8 (2022).
- [56] N. H. Wan, T.-J. Lu, K. C. Chen, M. P. Walsh, M. E. Trusheim, L. De Santis, E. A. Bersin, I. B. Harris, S. L. Mouradian, I. R. Christen, E. S. Bielejec, and D. Englund, “Large-scale integration of artificial atoms in hybrid photonic circuits,” \JournalTitleNature 583, 226–231 (2020).
- [57] S. B. van Dam, M. Walsh, M. J. Degen, E. Bersin, S. L. Mouradian, A. Galiullin, M. Ruf, M. IJspeert, T. H. Taminiau, R. Hanson, and D. R. Englund, “Optical coherence of diamond nitrogen-vacancy centers formed by ion implantation and annealing,” \JournalTitlePhysical Review B 99, 161203 (2019).
- [58] M. Kasperczyk, J. A. Zuber, A. Barfuss, J. Kölbl, V. Yurgens, S. Flågan, T. Jakubczyk, B. Shields, R. J. Warburton, and P. Maletinsky, “Statistically modeling optical linewidths of nitrogen vacancy centers in microstructures,” \JournalTitlePhysical Review B 102, 075312 (2020).
- [59] S. Chakravarthi, C. Pederson, Z. Kazi, A. Ivanov, and K.-M. C. Fu, “Impact of surface and laser-induced noise on the spectral stability of implanted nitrogen-vacancy centers in diamond,” \JournalTitlePhysical Review B 104, 085425 (2021).
- [60] V. Yurgens, J. A. Zuber, S. Flågan, M. De Luca, B. J. Shields, I. Zardo, P. Maletinsky, R. J. Warburton, and T. Jakubczyk, “Low-Charge-Noise Nitrogen-Vacancy Centers in Diamond Created Using Laser Writing with a Solid-Immersion Lens,” \JournalTitleACS Photonics 8, 1726–1734 (2021).
- [61] B. McCullian, H. Cheung, H. Chen, and G. Fuchs, “Quantifying the Spectral Diffusion of N- V Centers by Symmetry,” \JournalTitlePhysical Review Applied 18, 064011 (2022).
- [62] M. J. Burek, Y. Chu, M. S. Z. Liddy, P. Patel, J. Rochman, S. Meesala, W. Hong, Q. Quan, M. D. Lukin, and M. Lončar, “High quality-factor optical nanocavities in bulk single-crystal diamond,” \JournalTitleNature Communications 5, 5718 (2014).
- [63] M. J. Burek, J. D. Cohen, S. M. Meenehan, N. El-Sawah, C. Chia, T. Ruelle, S. Meesala, J. Rochman, H. A. Atikian, M. Markham, D. J. Twitchen, M. D. Lukin, O. Painter, and M. Lončar, “Diamond optomechanical crystals,” \JournalTitleOptica 3, 1404 (2016).
- [64] P. Appel, E. Neu, M. Ganzhorn, A. Barfuss, M. Batzer, M. Gratz, A. Tschöpe, and P. Maletinsky, “Fabrication of all diamond scanning probes for nanoscale magnetometry,” \JournalTitleReview of Scientific Instruments 87, 063703 (2016).
- [65] A. Sipahigil, R. E. Evans, D. D. Sukachev, M. J. Burek, J. Borregaard, M. K. Bhaskar, C. T. Nguyen, J. L. Pacheco, H. A. Atikian, C. Meuwly, R. M. Camacho, F. Jelezko, E. Bielejec, H. Park, M. Lončar, and M. D. Lukin, “An integrated diamond nanophotonics platform for quantum-optical networks,” \JournalTitleScience 354, 847–850 (2016).
- [66] S. Castelletto, L. Rosa, J. Blackledge, M. Z. Al Abri, and A. Boretti, “Advances in diamond nanofabrication for ultrasensitive devices,” \JournalTitleMicrosystems & Nanoengineering 3, 17061 (2017).
- [67] M. J. Burek, C. Meuwly, R. E. Evans, M. K. Bhaskar, A. Sipahigil, S. Meesala, B. Machielse, D. D. Sukachev, C. T. Nguyen, J. L. Pacheco, E. Bielejec, M. D. Lukin, and M. Lončar, “Fiber-Coupled Diamond Quantum Nanophotonic Interface,” \JournalTitlePhysical Review Applied 8, 024026 (2017).
- [68] M. Challier, S. Sonusen, A. Barfuss, D. Rohner, D. Riedel, J. Koelbl, M. Ganzhorn, P. Appel, P. Maletinsky, and E. Neu, “Advanced Fabrication of Single-Crystal Diamond Membranes for Quantum Technologies,” \JournalTitleMicromachines 9, 148 (2018).
- [69] M. Mitchell, D. P. Lake, and P. E. Barclay, “Realizing in diamond microdisks for optomechanics via etch optimization,” \JournalTitleAPL Photonics 4, 016101 (2019).
- [70] C. T. Nguyen, D. D. Sukachev, M. K. Bhaskar, B. Machielse, D. S. Levonian, E. N. Knall, P. Stroganov, C. Chia, M. J. Burek, R. Riedinger, H. Park, M. Lončar, and M. D. Lukin, “An integrated nanophotonic quantum register based on silicon-vacancy spins in diamond,” \JournalTitlePhysical Review B 100, 165428 (2019).
- [71] N. Hedrich, D. Rohner, M. Batzer, P. Maletinsky, and B. J. Shields, “Parabolic Diamond Scanning Probes for Single-Spin Magnetic Field Imaging,” \JournalTitlePhysical Review Applied 14, 064007 (2020).
- [72] Y. Duan, K. C. Chen, D. R. Englund, and M. E. Trusheim, “A vertically-loaded diamond microdisk resonator spin-photon interface,” \JournalTitleOptics Express 29, 43082 (2021).
- [73] M. J. Burek, N. P. De Leon, B. J. Shields, B. J. Hausmann, Y. Chu, Q. Quan, A. S. Zibrov, H. Park, M. D. Lukin, and M. Lončar, “Free-standing mechanical and photonic nanostructures in single-crystal diamond,” \JournalTitleNano Letters 12, 6084–6089 (2012).
- [74] E. Janitz, M. Ruf, M. Dimock, A. Bourassa, J. Sankey, and L. Childress, “Fabry-Perot microcavity for diamond-based photonics,” \JournalTitlePhysical Review A 92, 043844 (2015).
- [75] S. Flågan, D. Riedel, A. Javadi, T. Jakubczyk, P. Maletinsky, and R. J. Warburton, “A diamond-confined open microcavity featuring a high quality-factor and a small mode-volume,” \JournalTitleJournal of Applied Physics 131, 113102 (2022).
- [76] S. Flågan, P. Maletinsky, R. J. Warburton, and D. Riedel, “Microcavity platform for widely tunable optical double resonance,” \JournalTitleOptica 9, 1197 (2022).
- [77] M. K. Bhaskar, R. Riedinger, B. Machielse, D. S. Levonian, C. T. Nguyen, E. N. Knall, H. Park, D. Englund, M. Lončar, D. D. Sukachev, and M. D. Lukin, “Experimental demonstration of memory-enhanced quantum communication,” \JournalTitleNature 580, 60–64 (2020).
- [78] B. Khanaliloo, H. Jayakumar, A. C. Hryciw, D. P. Lake, H. Kaviani, and P. E. Barclay, “Single-Crystal Diamond Nanobeam Waveguide Optomechanics,” \JournalTitlePhysical Review X 5, 041051 (2015).
- [79] B. Khanaliloo, M. Mitchell, A. C. Hryciw, and P. E. Barclay, “High- Q / V Monolithic Diamond Microdisks Fabricated with Quasi-isotropic Etching,” \JournalTitleNano Letters 15, 5131–5136 (2015).
- [80] M. Mitchell, B. Khanaliloo, D. P. Lake, T. Masuda, J. P. Hadden, and P. E. Barclay, “Single-crystal diamond low-dissipation cavity optomechanics,” \JournalTitleOptica 3, 963 (2016).
- [81] J. Riedrich-Möller, L. Kipfstuhl, C. Hepp, E. Neu, C. Pauly, F. Mücklich, A. Baur, M. Wandt, S. Wolff, M. Fischer, S. Gsell, M. Schreck, and C. Becher, “One- and two-dimensional photonic crystal microcavities in single crystal diamond,” \JournalTitleNature Nanotechnology 7, 69–74 (2012).
- [82] S. Mouradian, N. H. Wan, T. Schröder, and D. Englund, “Rectangular photonic crystal nanobeam cavities in bulk diamond,” \JournalTitleApplied Physics Letters 111, 021103 (2017).
- [83] B. J. M. Hausmann, B. J. Shields, Q. Quan, Y. Chu, N. P. de Leon, R. Evans, M. J. Burek, A. S. Zibrov, M. Markham, D. J. Twitchen, H. Park, M. D. Lukin, and M. Loncǎr, “Coupling of NV Centers to Photonic Crystal Nanobeams in Diamond,” \JournalTitleNano Letters 13, 5791–5796 (2013).
- [84] T. Jung, J. Görlitz, B. Kambs, C. Pauly, N. Raatz, R. Nelz, E. Neu, A. M. Edmonds, M. Markham, F. Mücklich, J. Meijer, and C. Becher, “Spin measurements of NV centers coupled to a photonic crystal cavity,” \JournalTitleAPL Photonics 4, 120803 (2019).
- [85] D. P. Lake, M. Mitchell, Y. Kamaliddin, and P. E. Barclay, “Optomechanically Induced Transparency and Cooling in Thermally Stable Diamond Microcavities,” \JournalTitleACS Photonics 5, 782–787 (2018).
- [86] M. Mitchell, D. P. Lake, and P. E. Barclay, “Optomechanically amplified wavelength conversion in diamond microcavities,” \JournalTitleOptica 6, 832 (2019).
- [87] D. P. Lake, M. Mitchell, B. C. Sanders, and P. E. Barclay, “Two-colour interferometry and switching through optomechanical dark mode excitation,” \JournalTitleNature Communications 11, 2208 (2020).
- [88] P. K. Shandilya, D. P. Lake, M. J. Mitchell, D. D. Sukachev, and P. E. Barclay, “Optomechanical interface between telecom photons and spin quantum memory,” \JournalTitleNature Physics 17, 1420–1425 (2021).
- [89] C. P. Michael, M. Borselli, T. J. Johnson, C. Chrystal, and O. Painter, “An optical fiber-taper probe for wafer-scale microphotonic device characterization,” \JournalTitleOptics Express 15, 4745 (2007).
- [90] A. Yariv and P. Yeh, Photonics: Optical electronics in modern communications (Oxford University Press, 2006), 6th ed.
- [91] D. Riedel, S. Flågan, P. Maletinsky, and R. J. Warburton, “Cavity-Enhanced Raman Scattering for In Situ Alignment and Characterization of Solid-State Microcavities,” \JournalTitlePhysical Review Applied 13, 014036 (2020).
- [92] H. Kaupp, C. Deutsch, H.-C. Chang, J. Reichel, T. W. Hänsch, and D. Hunger, “Scaling laws of the cavity enhancement for nitrogen-vacancy centers in diamond,” \JournalTitlePhysical Review A 88, 053812 (2013).
- [93] P. R. Dolan, S. Adekanye, A. A. P. Trichet, S. Johnson, L. C. Flatten, Y. C. Chen, L. Weng, D. Hunger, H.-C. Chang, S. Castelletto, and J. M. Smith., “Robust, tunable, and high purity triggered single photon source at room temperature using a nitrogen-vacancy defect in diamond in an open microcavity,” \JournalTitleOptics Express 26, 7056 (2018).
- [94] S. M. Spillane, T. J. Kippenberg, O. J. Painter, and K. J. Vahala, “Ideality in a Fiber-Taper-Coupled Microresonator System for Application to Cavity Quantum Electrodynamics,” \JournalTitlePhysical Review Letters 91, 043902 (2003).
- [95] P. E. Barclay, C. Santori, K.-M. Fu, R. G. Beausoleil, and O. Painter, “Coherent interference effects in a nano-assembled diamond NV center cavity-QED system,” \JournalTitleOptics Express 17, 8081 (2009).
- [96] K. Srinivasan, “Semiconductor Optical Microcavities for Chip-Based Cavity QED Citation,” Ph.D. thesis, California Institute of Technology (2006).
- [97] A. Auffèves, J.-M. Gérard, and J.-P. Poizat, “Pure emitter dephasing: A resource for advanced solid-state single-photon sources,” \JournalTitlePhysical Review A 79, 053838 (2009).
- [98] A. Meldrum, P. Bianucci, and F. Marsiglio, “Modification of ensemble emission rates and luminescence spectra for inhomogeneously broadened distributions of quantum dots coupled to optical microcavities,” \JournalTitleOptics Express 18, 10230 (2010).
- [99] A. F. Oskooi, D. Roundy, M. Ibanescu, P. Bermel, J. Joannopoulos, and S. G. Johnson, “Meep: A flexible free-software package for electromagnetic simulations by the FDTD method,” \JournalTitleComputer Physics Communications 181, 687–702 (2010).
- [100] M. Borselli, K. Srinivasan, P. E. Barclay, and O. Painter, “Rayleigh scattering, mode coupling, and optical loss in silicon microdisks,” \JournalTitleApplied Physics Letters 85, 3693–3695 (2004).
- [101] M. Borselli, T. J. Johnson, and O. Painter, “Beyond the Rayleigh scattering limit in high-Q silicon microdisks: theory and experiment,” \JournalTitleOptics Express 13, 1515 (2005).
- [102] M. Borselli, “High-Q microresonators as lasing elements for silicon photonics,” Ph.d. thesis, california institute of technology, California Institute of Technology (2006).
- [103] E. Janitz, M. K. Bhaskar, and L. Childress, “Cavity quantum electrodynamics with color centers in diamond,” \JournalTitleOptica 7, 1232 (2020).
- [104] C. Santori, P. E. Barclay, K.-M. C. Fu, R. G. Beausoleil, S. Spillane, and M. Fisch, “Nanophotonics for quantum optics using nitrogen-vacancy centers in diamond,” \JournalTitleNanotechnology 21, 274008 (2010).
- [105] C. Hepp, T. Müller, V. Waselowski, J. N. Becker, B. Pingault, H. Sternschulte, D. Steinmüller-Nethl, A. Gali, J. R. Maze, M. Atatüre, and C. Becher, “Electronic Structure of the Silicon Vacancy Color Center in Diamond,” \JournalTitlePhysical Review Letters 112, 036405 (2014).