Supernova Remnants in the Irregular Galaxy NGC 4449
Abstract
The nearby irregular galaxy NGC 4449 has a star formation rate of and should host of order 70 SNRs younger than 20,000 years, a typical age for SNRs expanding into to an ISM with a density of 1 cm-3 to reach the radiative phase. We have carried out an optical imaging and spectroscopic survey in an attempt to identify these SNRs. This task is challenging because diffuse gas with elevated ratios of [S 2]:H is omnipresent in NGC 4449, causing confusion when using this common diagnostic for SNRs. Using narrow-band interference-filter images, we first identified 49 objects that have elevated [S 2]:H ratios compared to nearby H 2 regions. Using Gemini-N and GMOS, we then obtained high-resolution spectra of 30 of these SNR candidates, 25 of which have [S 2]:H ratios greater than 0.5. Of these, 15 nebulae are almost certainly SNRs, based on a combination of characteristics: higher [O 1]:H ratios and broader line widths than observed from H 2 regions. The remainder are good candidates as well, but need additional confirmation. Surprisingly, despite having superior imaging and spectroscopic data sets to examine, we are unable to confirm most of the candidates suggested by Leonidaki et al. (2013). While NGC 4449 is likely an extreme case because of the high surface brightness and elevated [S 2]:H ratio of diffuse gas, it highlights the need for sensitive high-resolution optical spectroscopy, or high spatial resolution radio or X-ray observations that can ensure accurate SNR identifications in external galaxies.
keywords:
galaxies: individual (NGC 4449) – galaxies: ISM – supernova remnantsAccepted for publication in The Astrophysical Journal
P. Frank Winkler
1 Introduction
Supernova remnants (SNRs) are the visible evidence of the shock driven by supernovae (SNe) into the surrounding circumstellar and interstellar medium. Along with the stellar winds arising from SN progenitors, SNRs are responsible for much if not all of the hot gas in normal galaxies and are an important part of the process of reprocessing interstellar gas into the next generation of stars. The interaction of the blast wave with the ISM results in radiation throughout the electromagnetic spectrum. In the Galaxy, most SNRs were first identified as bright, extended, non-thermal radio sources (see, e.g. Long, 2017). Beyond the Local Group, there are examples of SNRs that have been discovered by this method (see, e.g. Lacey et al., 1997), but the numbers are relatively few due to limited sensitivity and angular resolution. Instead, most SNRs and SNR candidates in external galaxies have been identified optically, as isolated nebulae with [S 2]:H ratios higher than expected from photoionized regions (cf. sec. 6 of Long et al., 2022, for further discussion).
The hypothesis that high [S 2];H ratios can effectively identify SNRs has both observational and theoretical bases. First, optical spectra of SNRs in the Galaxy and the Magellanic Clouds show that the optical spectra of SNRs identified by other means typically show [S 2]:H ratios of greater than 0.4, whereas (bright) H 2 regions have ratios of order 0.1 or less. Secondly, theoretical models of H 2 regions calculated with photoionization codes such as Cloudy or Mappings (Ferland et al., 1998; Allen et al., 2008) indicate that H 2 regions should have low [S 2]:H ratios because most of the S in H 2 regions is ionized to S++, whereas shock models show that fully radiative SNR shocks have an extended region where S+ is the dominant ion, which leads to a much higher observed [S 2]:H line ratios (Raymond, 1979; Hartigan et al., 1987; Allen et al., 2008).
Based on this hypothesis, we and others have identified a large number of SNRs and SNR candidates in galaxies within and beyond the Local Group. To date, almost all this attention has gone to spirals, including M31 (Blair et al., 1981; Lee & Lee, 2014a), M33 (Lee & Lee, 2014b; Long et al., 2018), M81 (Matonick & Fesen, 1997; Lee et al., 2015), M83 (Blair et al., 2012; Winkler et al., 2017; Williams et al., 2019; Long et al., 2022), M51 (Winkler et al., 2021), NGC 6946 (Long et al., 2019, 2020), NGC 3344 (Moumen et al., 2019), NGC 4030 (Cid Fernandes et al., 2021), and others (Kopsacheili et al., 2021).111See Vučetić et al. (2015) for a more complete listing of relevant papers prior to 2015.
By contrast, with the exception of the Magellanic Clouds (Mathewson et al., 1983, 1984, 1985; Filipović et al., 2008; Maggi et al., 2016; Bozzetto et al., 2017), where radio and X-ray observations are sufficiently sensitive to provide confirmation for SNR identifications, little attention has gone to SNRs in irregular galaxies. Yet many such galaxies have high star-formation rates that should result in a significant population of SNRs. Irregular galaxies typically have much lower metallicities, implying conditions quite different from those in most large spiral galaxies. The most significant attempt to identify SNRs in irregular galaxies was carried out by Leonidaki et al. (2013) who searched for SNRs in three irregular galaxies (NGC 3077, NGC 4214, and NGC 4449) using a combination of interference-filter imaging and follow-up spectroscopy. In the case of NGC 4449, they identified 19 objects as SNRs based on a spectroscopically determined [S 2]:H ratio greater than 0.4. Additionally they listed 39 objects as “probable SNRs”, based on photometrically-determined [S 2]:H line ratios greater than 0.4, and 13 objects as “probable candidate SNRs” with photometrically-determined ratios between 0.3 and 0.4, bringing their total to 71 objects of interest.
NGC 4449 is an interesting irregular galaxy to study because it is relatively nearby at 4.2 Mpc (Karachentsev et al., 2003), where 1\arcsec corresponds to 20 pc. It has a robust star formation rate of (Chyży et al., 2011; Manna & Roy, 2023), greater than that of the LMC (; Whitney et al., 2008). Reflecting this high SFR, it is the host of a very young SNR with very broad emission lines of oxygen, widely known as NGC 4449-SNR-1 (henceforth simply SNR-1), that likely resulted from an explosion of 20 star about 65 years ago (Blair et al., 1983; Milisavljevic & Fesen, 2008; Mezcua et al., 2013). A few of the sources identified by Leonidaki et al. (2013) as SNRs or SNR candidates are coincident or nearly coincident with X-ray sources identified in relatively short Chandra observations of the galaxy (Summers et al., 2003) and/or radio sources that Chomiuk & Wilcots (2009a) identified as as probable SNRs, based on their spectral indices.
In our own past research, we have concentrated on local spiral galaxies with significant star formation. We were also aware that irregular galaxies such as NGC 4449 have outflows and that the warm ionized gas contained in those outflows often shows significantly higher [S 2]:H ratios and higher surface brightnesses than is typical for the diffuse emission in spiral galaxies. As a result, one could anticipate that identifying SNRs by the standard [S 2]:H technique might be expected to be more difficult.
Here we report the results from new emission-line imaging surveys of NGC 4449, plus follow-up multi-object spectroscopy, with both significantly higher angular resolution and sensitivity than that of Leonidaki et al. (2013). For identification of nebulae as SNRs, we rely on additional diagnostics beyond the traditional [S 2]:H ratio: the strength of the [O 1] lines, which gives another indicator of cooling gas behind SN shocks, and the velocity width of the emission lines, as demonstrated by Chu & Kennicutt (1988) and Points et al. (2019). We propose a new list of 49 SNRs and candidates in NGC 4449. For a variety of reasons, as discussed in the sections below, our list of SNRs is largely disjoint from that of Leonidaki et al. (2013).
The paper is organized as follows: section 2 discusses the imaging and spectroscopic data sets used in this paper as well as their processing. Section 3 details our search for candidate SNRs and the spectroscopic analysis. We discuss our results in section 4, in the context of previous work and of other galaxies. Finally, we summarize our results and conclusions in section 5.
2 Observations and Data Sets
2.1 Imaging Observations: WIYN and Gemini-N
We initially carried out narrow-band imaging observations of NGC 4449 from the 3.5m WIYN telescope and MiniMosaic imager on Kitt Peak on the nights of 2011 June 26-28 (UT).222The WIYN Observatory is a joint facility of the NSF’s National Optical-Infrared Astronomy Research Laboratory, Indiana University, the University of Wisconsin-Madison, Pennsylvania State University, the University of Missouri, the University of California-Irvine, and Purdue University. The so-called “Minimo” was mounted at the f/6.3 Nasmyth port and consisted of a pair of SITe chips, with a field 9\farcm6 square at a scale of 0\farcs14 pixel-1, easily encompassing the entirety of NGC 4449. We used interference filters that passed lines of H, [S 2] 6716,6731, and [O 3]5007, plus red and green narrow-band continuum filters so we could subtract the stars and produce pure emission-line images (see Table 1 for details). Frames in each filter were dithered to facilitate removal of cosmic rays and bad pixels. The seeing was variable and not particularly good: our final combined images used the best three exposures through each filter and had effective seeing of 1\farcs2 – 1\farcs5 (FWHM). On the basis of these images, we assembled a preliminary SNR candidate list of over fifty objects in NGC 4449.
In order to obtain a deeper and higher-resolution view of nebulae in NGC 4449, to refine our list of candidate SNRs, and to facilitate the preparation of accurate masks for follow-up MOS spectroscopy, we obtained imaging data from the GMOS instrument on the 8.1 m Gemini-North telescope through program GN-2021A-Q-222. All the data were taken on 2021 Apr 6, and are detailed in Table 1. Processing was carried out using standard procedures in the IRAF333IRAF is distributed by the National Optical Astronomy Observatory, which is operated by the Association of Universities for Research in Astronomy, Inc., under cooperative agreement with the National Science Foundation. gemini package. The resolution of the combined GMOS images was 0\farcs6 – 0\farcs7, indeed significantly better than in the earlier WIYN data.
Fig. 1 highlights a striking difference between NGC 4449 and the spiral galaxies we have studied, in the form of a [S 2]:H ratio image formed from the continuum-subtracted GMOS images. To create this image, we first fit and subtracted a constant value to set the background sky level to zero. We then set all pixel values below a threshold to a constant value for both the [S 2] and H images before taking the ratio of the two. Thus the background sky surrounding the galaxy has a constant grey level in the figure: in this case corresponding to a moderate value of [S 2]:H = 0.25.
s2_by_ha3.jpg
From this image, it is clear that most of the diffuse emission throughout NGC 4449 has a relatively high [S 2]:H ratio, approaching and even exceeding 0.4, the usual criterion for identifying shock-heated nebulae. This is consistent with the measurement by Kobulnicky et al. (1999) of the global [S 2]:H ratio for NGC 4449 as about 0.28. While we do not have global ratios for the spiral galaxies we have studied, spectra of faint diffuse emission typically shows [S 2]:H , characteristic of photoionized material.444We note that at the lowest surface brightnesses sampled in M83, we encountered much the same situation, where the diffuse ionized gas had elevated values of [S 2]:H, causing confusion in the identification of SNR candidates; see Long et al. (2022). It is also interesting that the global ratio for NGC 4449 given by Kobulnicky et al. (1999) is significantly higher than those for any of the other seven Irr galaxies they observed (0.10 – 0.19; see their Table 1). As a result, the [S 2]:H ratio criterion is not as effective a diagnostic for SNRs in NGC 4449 as it has been in numerous earlier studies. This causes significant uncertainty in identification of nebulae that are near this usual dividing line, as discussed in section 3.1.
2.2 HST Imaging
While we did no HST imaging of our own for this project, the Multimission Archive for Space Telescopes (MAST555https://archive.stsci.edu.) contains HST/ACS imagery of NGC 4449 in H (F658N filter), a combination of H and [N 2] (F660N), [O 3] 5007 (F502N), and broadband optical filters (Annibali et al., 2008). However, there are no images for [S 2] or for [Fe 2] 1.644 m, for which WFC3 would have been required. We downloaded the processed versions of these data from the Hubble Legacy Archive)666https://hla.stsci.edu. for use in this project, although subsequent work to improve the astrometric solutions (using Gaia stars) was required to make accurate comparisons with other data sets.
The HST/ACS imagery of course has exquisite spatial resolution (pixel size 0\farcs10), and the bright emission structures and/or small angular size objects are well detected. However, many of the nebulae of interest from our ground-based imaging are extended and have relatively low surface brightness. Hence, the HST data have been useful for examining the morphology and physical sizes of some, but by no means all, of the objects of interest.
2.3 Spectroscopic Observations
As part of the same Gemini program as the imaging discussed above, we were approved to carry out follow-up spectroscopy: high-resolution MOS red spectra using the B1200 grating for two masks, plus a lower resolution and broader spectral coverage longslit spectrum with the B600 grating of the bright young remnant NGC 4449-SNR-1777The spectrum of NGC 4449SNR-1 will be reported in a separate paper specific to this object.. However, none of these spectra were actually obtained during semester 2021A due to COVID restrictions. All of the spectral were eventually obtained the following year, through program GN-2022A-Q-130. The detector was binned ; the spectral range for the B1200 MOS spectra varied with slit mask position, but included wavelengths from well below [O 1] to well above the [S 2] lines for all objects, with a dispersion of 0.53 Å per (binned) pixel, and a resolution of (FWHM, measured from night-sky lines). Further details of all the spectroscopic observations are given in Table 2.
Through our work on M83 (Winkler et al., 2023), we had become convinced that obtaining higher-resolution spectra was important for establishing with high confidence that objects are SNRs. This becomes especially important for NGC 4449, because of the somewhat compromised nature of the [S 2]:H ratio criterion. The velocity widths for SNRs should be determined largely by the shock velocity and bulk motions of the gas, typically for all but the oldest and most evolved remnants. This is in contrast to photoionized regions for which we expect much smaller velocity widths, more characteristic of the thermal velocity of the ISM (Chu & Kennicutt, 1988; Points et al., 2019), which would essentially be unresolved. In conjunction with a previous program on GMOS-S (Winkler et al., 2023), we had carried out a series of tests that clearly showed that the B1200 grating with relatively narrow 0\farcs6 slits gave the optimum combination of resolution and throughput, so we adopted the equivalent combination on GMOS-N for our NGC 4449 program. We used the GMOS images described above to design our MOS masks, with slit width 0\farcs6 for all the objects. (See section 3.1 for more detail.)
Immediately before or after each set of object spectra, we obtained quartz flats and CuAr arcs for calibration. The spectra were reduced using the gemini package in IRAF, including separation into 2-D spectra for each slit. We then subtracted the local background, stripped out 1-D spectra for each object, and finally did flux calibration based on observations of the spectrophotometric standard star Feige 66, provided by the Gemini Observatory.
3 Results and Analysis
3.1 Identification of Candidate SNRs
We identified candidates by conducting a visual search, as follows: we displayed various images, typically the continuum-subtracted H and [S 2], the [S 2]:H ratio image, and a continuum band, to identify and eliminate possible stellar residuals from consideration. The SAOimage ds9 tool (Joye & Mandel, 2003) was indispensable for this task. In the case where additional imagery is available (e.g., HST or other multi-wavelength images), these could be added into the visual search process.
We had conducted an initial search using the WIYN images, and for our final search we used the more recent and significantly better-seeing images from Gemini GMOS. (Our initial set of objects based on the WIYN data turned out to agree remarkably well with the final GMOS set, though the GMOS images were much better for detailed examination of the candidates, and for diameter measurement.) Searches were carried out independently by different ones of us, and also independently of the list of candidates suggested by Leonidaki et al. (2013). Since so much diffuse emission with elevated ratio is present, we added the following aspect to our search strategy: we identified nebulae that had reasonable integrity to their appearance either in the subtracted images and/or the [S 2]:H ratio image so that they constituted identifiable objects. Also, in the case of confused regions of high-ratio background, we attempted to select objects that were elevated even more than the background. While clearly we could be incomplete in our candidate list, the addition of these criteria was intended to improve the likelihood that the selected objects are indeed good candidates.
ha_snrs_grid.jpg
With the GMOS search complete, we also made comparisons against the positions of radio and X-ray point sources tabulated by others (Chomiuk & Wilcots, 2009a; Summers et al., 2003; Leonidaki et al., 2010). Examination of the HST/ACS imagery was also useful in this process, and allowed identification of sources associated with star clusters and likely X-ray binaries. The only coincidences between our candidate objects and Chandra ones from Summers et al. (2003) are the well-known SNR-1, the bright, complex nuclear source (W23-22, near coincident with S03-18), and W23-36, coincident with Summers source 24, which they identify as a background AGN. There are four coincidences between our candidates and radio sources identified by Chomiuk & Wilcots (2009a), but only three have non-thermal radio spectra characteristic of SNRs: W23-28 = CW09-19, W23-45 = CW09-26. plus the obvious SNR-1.888In addition, W23-23 is located within 3\arcsec of both CW09-14, listed by them as a SNR, and (more closely) with CW09-15, classified by them as an H 2 region. It is perhaps not surprising to find so few matches, especially in the case of the Chandra data, which were relatively shallow compared with other nearby galaxy data sets that are available (cf. Long et al., 2014). All the source matches are listed in Table 3 under the column “Other names.”
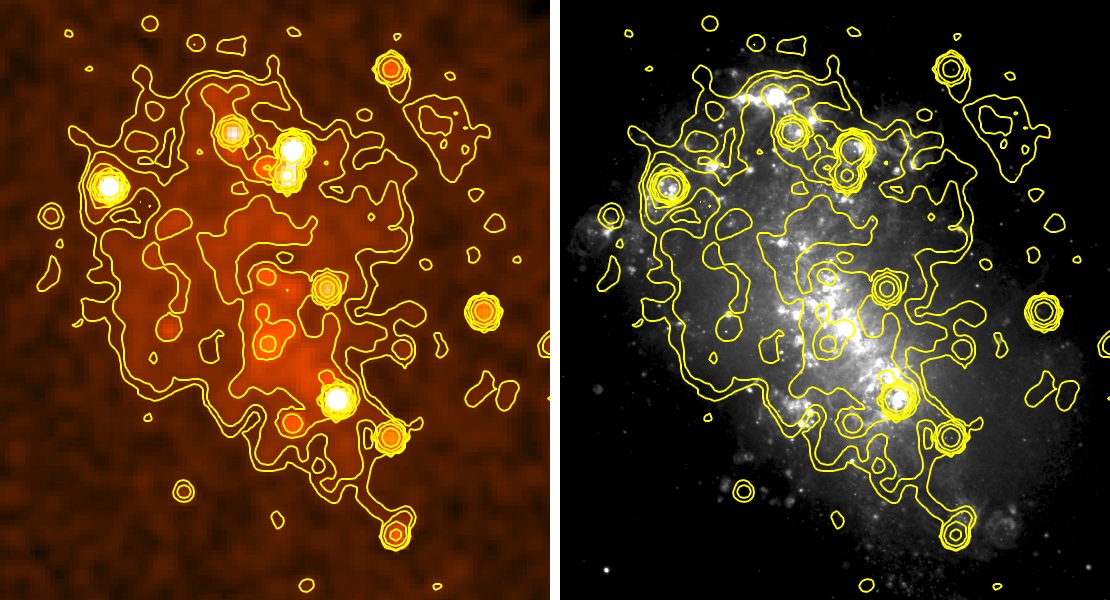
Our final list contains a total of 49 SNR candidates, which we list in Table 3999We choose not to list the unique and well-known SNR-1 in this Table as we consider it to be in a class by itself. and show in Fig. 2 as red circles projected onto the GMOS H image. Table 3 includes some ancillary data that were derived as we performed the search. Size information was determined by setting circular or elliptical ds9 regions on each object identified; where elliptical regions were used, we list the diameter as the geometric mean of the major and minor axes of the ellipse. The HST/ACS data were used for measuring object sizes when they were visible, but many of the objects are outside the ACS field or are too low in surface brightness to be seen in the available data. Angular sizes were converted to pc assuming a distance of 4.2 Mpc. We also include a morphology ‘Class’ assessment: the class A objects are either extended objects with evidence for a shell-like morphology or small-diameter objects that stand out against the background. These are more robust in appearance and/or are less confused than the class B objects, which have enhanced [S 2]:H ratio relative to the surrounding background, but that are more confused by surrounding nebulosity. The possible utility of this criterion is discussed further below, and several examples are shown in Fig. 3.
k09_k11_4pan.jpg0.38(a) \figk22_4pan.jpg0.38(b) \gridline \figk07_4pan.jpg0.38(c) \figk29_4pan.jpg0.38(d) \gridline \figk40_k42_4pan.jpg0.38(e) \figk41_4pan.jpg0.38(f)
3.2 Spectroscopy and Analysis
Once these candidate objects had been identified, we prepared two GMOS masks for follow-up multi-object spectroscopy, targeting a total of 30 candidates, plus the bright, O-rich SNR-1, two of the candidates from Leonidaki et al. (2013) that did not meet our selection criteria, and a handful of comparison H 2 regions. We selected small faint H 2 regions that were relatively isolated and comparable in surface brightness to the SNR candidates. Some additional H 2 region spectra were extracted from along several of the SNR apertures as well. The H 2 region positions are listed in Table 4. Having one mask with N-S slits and the other with E-W ones gave us additional flexibility in targeting objects in confused fields and in cases where we could target multiple objects on the same slit. These masks were used for the observations described above in Section 2.3. Also included on Mask 1 was the bright SNR-1, which we will report on in a separate upcoming paper.
5_spectra.jpg0.684(a) \fig5_spectra_ha_only.jpg0.30(b)
In order to characterize the spectra in a relatively uniform manner, we fit the most prominent lines in the spectra with simple Gaussians. Prior to fitting, we inspected each of the spectra and set a flag that excluded obviously discrepant pixels from the fitting process. We fit [O 1] as a singlet, but, as was the case when we analyzed both the MUSE and GMOS spectra of M83 SNRs and H 2 regions, we found that fitting [S 2] as a doublet and the H - [N 2] complex as a triplet with fixed separations and a single FWHM (plus a constant background) produced more consistent results than fitting all of the lines individually, especially for the fainter spectra. There were no cases where our visual inspections indicated any significant difference in the shapes of the [N 2] compared to H, except for a few that could be associated with a narrow component of H superposed on the broader profile of the SNR. Several typical spectra are shown in Fig. 4.
The results of the spectral fits are presented in Tables 1 and 1 for the SNRs and H 2 regions in the sample, respectively. The errors indicated in the tables should be treated with caution as they are statistical, and do not take into account systematic errors that might arise, for example, from imperfect background subtraction. Such errors are difficult to quantify.
4 Discussion
4.1 Overall characterization of the sample
As we noted in Sec. 3.1, the [S 2]:H ratio is generally high throughout NGC 4449, so we expect this diagnostic to be of more limited utility in confirming SNRs than it has been in other galaxies, especially for objects whose [S 2]:H ratios are within 0.1 of the usual 0.4 criterion we use as a discriminant. Our spectra confirm this prediction; as shown in the histogram of [S 2]:H ratios in Fig. 5 (a); while the bulk (28 out of 30) of the SNR candidates have [S 2]:H ratios that exceed the conventional 0.4 ratio, many (6 of 13) of our sample of faint H 2 regions do as well. However, the objects that have [S 2]:H ratios in excess of 0.5 do seem to be significantly in excess of the surrounding diffuse gas.
histogram_s2ha.jpg0.34(a) \fighistogram_oiha.jpg0.34(b) \fighistogram_fwhm.jpg0.34(c)
A much cleaner separation is obtained using the FWHM of the emission lines; 22 of the 30 SNR candidates with spectra have emission line widths of 90 , while none of the H 2 regions has a velocity width this high. This does not imply that some of the SNR candidates with narrower lines are not SNRs, but does imply that nearly all of the objects with large velocity widths are SNRs. We note that the discriminator of 90 is larger than one might expect for an instrumental resolution of 65 and typical H 2 region velocity dispersion of order 10 - 20 , but the statistical quality of the data and the limitations of simple Gaussian fitting lead us to choose the higher velocity threshold.
Are there other line ratios that would be of use in discriminating between SNRs and photoionized gas? Kopsacheili et al. (2020) have argued that the [O 1]:H ratio is an additional strong indicator of SNR shocks, and that any nebula with [O 1]:H is a probable SNR. In M83, Winkler et al. (2023) found that most SNRs had [O 1]:H ratios of 0.03 or greater (limited in part by sensitivity), arguing that at least for M83, confident detection of [O 1] should be considered when identifying SNRs optically. Of course, [O 1] can be affected by night sky subtraction, and NGC 4449 is redshifted by only 200 (4.3 Å). As shown in Fig. 5(b), there is a clear separation in this ratio between most of our SNR candidates and the faint H 2 regions for which we have data. Rather conservatively, we adopt a cutoff of 0.10 for NGC 4449: all SNRs have [O 1]:H , while no H 2 regions do.
Fig. 6 shows the correlation between the line widths for the [S 2] lines and that for H. We primarily use the line width for H because it is the strongest line, but as this figure shows, using the [S 2] width would give essentially the same results.
fwhm_s2_vs_ha.jpg
Comparison among our three diagnostics are shown graphically in Fig. 7 and Fig. 8(a), and a summary of the the numbers of spectroscopically-observed SNRs and H 2 regions that pass various tests is presented in Table 1. Of the 30 SNR candidates for which we have spectra, 25 have [S 2]:H ratios higher than a conservative value of 0.5, and 15 pass all three of our tests: ratios that exceed our thresholds for both [S 2]:H and [O 1]:H and have profiles with FWHM of greater than 90 . These 15 objects are almost certainly SNRs. The [O 1]:H and [S 2]:H ratios are fairly well correlated, as shown in Fig. 8(a), indicating that candidates that meet either ratio criterion and are velocity-broadened are most likely to be SNRs. As shown in panels (b) and (c) of Fig. 8, there is little if any correlation of the [N 2]:H ratio with either [S 2]:H or [O 1]:H.
ha_fwhm_vs_s2ha.jpgha_fwhm_vs_oiha.jpg
oiha_vs_s2ha.jpg0.34(a) \fign2ha_vs_s2ha.jpg0.34(b) \fign2ha_vs_oiha.jpg0.34(c)
Within the SNR sample there is little difference between the morphology class A and class B objects, in terms of the percentage of objects with spectra that satisfy the various tests, with the exception that the morphology class B objects tend not to have high [O 1]:H ratios. Since [O 1] is produced as post-shock gas cools to temperatures lower than required for [S 2], one could speculate that objects with well-defined morphologies have a higher percentage of emission from complete shocks than those with less well-defined morphologies.
As expected, in part because of how we have tailored the cuts, positive tests for the H 2 regions differ substantially from those for SNRs; None of the H 2 regions shows [O 1]:H greater than 0.1 nor a FWHM of greater than 90 , and only three show a [S 2]:H ratio greater than 0.5. This latter point indicates that, even with the elevated [S 2]:H criterion used here, we cannot be entirely confident in identifying some objects.
4.2 Our sample vs. that of Leonidaki et al. (2013)
Our sample of SNRs and candidates in NGC 4449 comprises 49 objects, while Leonidaki’s has 71, yet the two samples have merely four objects in common. This is unexpected in view of the fact that both our group and theirs selected candidates using the same basic method: narrow-band imaging in H and [S 2], and selecting objects with high [S 2]:H ratio relative to the surrounding background.
There are, nevertheless, important differences in our techniques. Notably, the GMOS images from the 8.1 m Gemini-N telescope that we used for our final selection have significantly higher sensitivity and better seeing (0\farcs6 - 0\farcs7) than those used by Leonidaki et al. (2013), which were taken from the 1.3 m Skinakas telescope in seeing from 1\farcs3 to 2\farcs5. Furthermore, Leonidaki et al. (2013) selected their candidates using an automated technique, SExtractor, while we selected ours by careful visual examination of the various imagery noted in Sec. 2.101010While automated selection is probably valuable in many cases where the [S 2]:H criterion is more effective, we expect the visual inspection technique described here to be superior in the case of NGC 4449. We further required our candidates to be nebulae with individual integrity that stood out as relatively isolated objects, brighter than the surrounding background. This was strictly true for our class A candidates, but by definition the class B ones were more marginal in this regard.
Any selection based on the [S 2]:H ratio in NGC 4449 requires further confirmation, since this ratio is unusually high in the diffuse emission that pervades much of the galaxy, and especially in the more central regions where many of the Leonidaki et al. (2013) objects were identified. Our selection of nebulae that clearly stood out as individual objects, and our use of additional spectroscopic diagnostics, all help to mitigate confusion caused by this generally elevated [S 2]:H ratio. In Fig. 9 we show images of several representative Leonidaki et al. (2013) objects: the four that we also identified (panels e - h; see Table 3) and four others not included in our list, selected because Leonidaki et al. (2013) observed particularly high photometric [S 2]:H ratios for all: LBZ-1 ([S 2]:H = 0.93), LBZ-12 (0.77), LBZ-13 (0.63), and LBZ-14 (0.79). The absence of identifiable objects with elevated ratio at the positions of the non-selected objects (panels a - d) should be clear.
lbz1.jpeg0.49(a) \figlbz12.jpeg0.49(b) \gridline \figlbz13.jpeg0.49(c) \figlbz14.jpeg0.49(d) \gridline \figlbz18.jpeg0.49(e) \figlbz22.jpeg0.49(f) \gridline \figlbz57.jpeg0.49(9) \figlbz66.jpeg0.49(h)
For spectroscopic confirmation of candidates, we used slits of width 0\farcs6, which served to effectively isolate our objects from the surrounding emission, in addition to facilitating our desired velocity resolution. By contrast, the spectra reported by Leonidaki et al. (2013) used a slit of width either 6.3\arcsec, or 2.5\arcsec for the objects observed at KPNO. Because of the high ratio in the diffuse gas and the large apertures used, it is hardly surprising that they measured high [S 2]:H ratios in virtually all the objects they observed.
We obtained spectra of four of the Leonidaki et al. (2013) objects—two of which were on our candidate list, and two of which were not. Of these, LBZ22 and LBZ57 pass all three of our tests, and are almost certainly SNRs. We did not obtain spectra of the other two objects in common between our list and theirs, LBZ18 and LBZ66, so these remain good candidates. However, spectra of LBZ49 and LBZ67 pass none of our criteria, and these should no longer be regarded as good candidate SNRs.
4.3 Diffuse background emission in NGC 4449
As discussed by Summers et al. (2003), Chandra X-ray images of NGC 4449 show not only a number of compact X-ray sources, but also diffuse emission whose morphology resembles the optically-emitting gas. The pervasiveness of [S 2] emission in NGC 4449 of course means that there is low-ionization gas throughout much of the galaxy. It is interesting to compare the optical emission with the soft X-ray emission that also pervades much of the galaxy (Fig. 10; see also Fig. 1). Both the X-rays and low-ionization optically emitting gas are probably related to the intense star formation that is taking place in NGC 4449 (Annibali et al., 2008; Karczewski et al., 2013; Calzetti et al., 2018; Sacchi et al., 2018), quite possibly triggered by a merger with a dwarf galaxy (Martínez-Delgado et al., 2012). The population of very hot, blue stars is surely producing intense winds in their vicinity. Since the mass of NGC 4449 is low, the winds are not gravitationally confined, and they drive significant outflows from NGC 4449 (Hong et al., 2013; Bomans & Weis, 2014; McQuinn et al., 2019). The UV emission from the hot stars and their winds can in turn excite diffuse gas to X-ray temperatures, and also produce shocks that lead to the low-ionization optical emission. The X-ray gas is understood to be the hot component of an outflow driven by multiple SN and stellar winds arising from young massive stars in the Galaxy. NGC 4449 was one of the first Irr galaxies where such outflows were identified (Summers et al., 2003).
Dwarf galaxies with starbursts are favorable locations for such outflows to exist because of their low gravitational potential. The low metallicity of dwarf starbursts is at least partly due to the fact that they cannot retain the metals that are produced by SN explosions (Dalcanton, 2007). These outflows are mass-loaded; that is, they contain some amount of hot gas but also very significant amounts of molecular gas. [S 2]:H ratios can be high in such outflows as a result of shocks that develop within the outflowing gas (Sharp & Bland-Hawthorn, 2010). The fact that NGC 4449 contains such an outflow and that these outflows are brighter than the diffuse interstellar gas (DIG) seen in other galaxies is the underlying reason why identifying SNRs in NGC 4449 has been so difficult.
4.4 The SNR Sample in NGC 4449 Compared with Other Galaxies
There are now numerous galaxies in which samples of several dozen to several hundred likely SNRs have been identified (Vučetić et al., 2015, and references in the Introduction). The list of observed galaxies is heavily weighted toward spirals. Not surprisingly given their relative masses, the spirals with well-characterized SNR samples at distances comparable to that of NGC 4449 or closer all harbor significantly larger SNR populations. Fig. 11 shows a comparison of the [N 2]:H ratios for NGC 4449 and four well-studied spirals, all plotted as a function of [S 2]:H. All are similar in terms of their [S 2]:H ratios (except that those for NGC 4449 are somewhat higher, as we have discussed). But the [N 2]:H ratios differ systematically by as much as an order of magnitude. Such dramatic differences reflect the differences in metallicity of the galaxies. As was the case in the other galaxies, most, but not all, of the SNR candidates have [S 2] line ratios near the low density limit of about 1.4.
n2_s2_5gals.jpg
The SNRs and candidates in NGC 4449 range from a minimum diameter of 11.5 pc to a maximum of 147 pc, with a median of 36 pc. Comparing this with other spiral galaxies, we find that the comparable statistics for M51 and M83 are both considerably smaller (medians of 24 pc and 20.6 pc, respectively), while for M33 they are larger (median 51 pc). It is reasonable that larger objects are seen in M33; it is far closer and better resolved than NGC 4449, with less diffuse background emission. Thus we can detect older, lower surface-brightness (and thus larger) SNRs in M33 than in NGC 4449. The M33 sample also includes numerous partial shells, which have been extrapolated to estimate the diameter. Such objects, if present, could have been easily missed in our NGC 4449 search. Most comparable to NGC 4449 is the Large Magellanic Cloud, where the (probably nearly complete) sample of 59 confirmed SNRs has a median diameter of 36 pc (Ou et al., 2018), almost identical to NGC 4449. Given the proximity of the LMC and the quality of the available multiwavelength data sets, it is not surprising that the number of confirmed SNRs is significantly higher than for NGC 4449.
The SNR sample in NGC 4449, like those of the other galaxies, is dominated by older SNRs, close to or already entering the radiative phase. This is expected, both because optical searches using the [S 2]:H ratio select SNRs with emission from radiative shocks (with recombination timescales less than the age of the SNR), and the total H (and [S 2]) luminosity of such shocks from a SNR typically increases with object diameter, simply because the surface area of the SNR increases with time.
4.5 How Complete is the NGC 4449 Sample?
Li et al. (2011) have developed a model for estimating the supernova rate for a galaxy as a function of its B-band and K-band luminosity. Applying their formalism to NGC 4449 yields an estimate of 0.35 SNe per century, essentially all of which should arise from core-collapse explosions. If we take a typical age of 20,000 years for a SNR to fade significantly in brightness as it begins to merge into the ISM, we find that NGC 4449 might have been expected to have of order 70 visible SNRs. As argued above, we have detected 15 to 30 of these (16 to 31, if we also include SNR-1).
Thus, it is reasonable to suppose that we have detected a sizable fraction of the potentially visible SNRs in NGC 4449, but certainly not all of them. Similar arguments lead to a similar conclusion for the larger spiral galaxies with the best-studied samples of SNRs, viz. M33 and M83, that is that we are only seeing a sub-sample of the total population of SNRs that may be present. This could be due to several effects. First of all, we know there are some remnants of Type Ia SNe that are seen optically as faint hydrogen Balmer-line emitters rather than bright radiative shocks. Any such objects would certainly have been missed. Secondly, in rapidly star forming galaxies, SNe that occur within the cavities blown by stellar winds and previous SNe are not expected to produce bright optical remnants as the shocks have little to run into. Thirdly, we note that there are a number of LMC SNRs that appear as ‘blisters’ or partial shells on the edge of bright H 2 regions. Such objects could easily be hidden or missed in the complex emission seen in NGC 4449.
4.6 Searching for SNRs in Starburst Galaxies: the Path Forward
The bright diffuse emission in galaxies similar to NGC 4449 and the fact that this diffuse emission can have elevated line ratios for both [S 2]:H (and probably [O 1]:H as well) makes identifying SNRs from low-resolution optical spectroscopy problematic, except in those cases where high spatial resolution imagery reveals the distinct morphology expected for an isolated SNR, and where a local background can be robustly subtracted. Three paths forward seem warranted:
(a) SNRs are demonstrated to have velocity widths that are broad compared to those of H 2 regions (cf. Points et al. (2019). Hence, catalogs constructed of resolved optical objects with broad lines are likely to be SNRs. Integral field spectroscopy, with instruments such as MUSE on the VLT or SITELLE on the CFHT, and with sufficient spectral resolution to measure velocity broadening , could provide a powerful technique for this application. (The recent study by Congiu et al., 2023, provides an illustration of what might be achieved.) Even the 65 resolution obtained in our study leaves an ambiguity for some SNRs whose velocity dispersions may be high compared with H 2 regions, but that are still not velocity-resolved. Of course, obtaining even higher spectral resolution for faint extended nebular sources can be challenging.
(b) SNRs also differ from H 2 regions and diffuse gas seen in outflows in terms of their radio spectral indices. SNRs are steep-spectrum objects, whereas radio sources powered by free-free emission have flat spectra. Most Galactic SNRs were discovered on the basis of this distinction. However, extending such observations to galaxies beyond the Local Group requires both spatial resolution and sensitivity at multiple frequencies that have been difficult to achieve (cf. Russell et al., 2020). Nevertheless, instruments such as the JVLA or the forthcoming Square Kilometre Array offer great potential.
(c) A third possibility, probably even more challenging, is higher sensitivity X-ray telescopes with Chandra-like spatial resolution and good spectral resolution. The detection of individual objects with spectra that are unambiguously thermal would not only positively identify SNRs, but also serve to reveal additional information about them. Unfortunately, X-ray telescopes with all of these properties seem not to be on the immediate horizon.
5 Summary and Conclusions
We have identified 49 nebulae in NGC 4449 as SNR candidates, based on narrow-band imaging in [S 2] and H lines, that shows identifiable objects with elevated [S 2]:H ratios compared with their surroundings. We have obtained spectra of 30 of the candidates, confirming the high [S 2]:H ratios in most of the objects. All remain viable SNR candidates, and most show additional features that support their identification as SNRs. There are 15 objects that meet all three criteria that we propose for SNRs in NGC 4449: [S 2]:H ratios greater than 0.5, [O 1]:H ratios greater 0.1, and H line widths greater than 90 . We contend that these 15, at minimum, are almost certainly SNRs.
Our list of SNRs and SNR candidates is almost disjoint from a set of 71 objects proposed by Leonidaki et al. (2013). Despite our doing a targeted search for nebulae at the positions they had identified, we are able to spectroscopically confirm only two of their objects as almost certain SNRs, and two more (for which we do not have spectra) as strong SNR candidates. For the majority of their objects, and especially those in the complex inner regions of the galaxy, we do not see objects identifiable as potential SNRs in our images, which are deeper and have significantly better seeing than the earlier data.
The SNRs and SNR candidates that we have found are not special compared to the SNRs that are found in other galaxies, aside from the fact that the spectra reflect the low abundances in NGC 4449. Based on their size distribution, most are older SNRs, likely entering the radiative phase, when SNRs are brightest at optical wavelengths.
Assuming NGC 4449 is typical of other irregular galaxies with the same general morphology, about 70 SNe should have exploded in the last 20,000 years, almost all of them core-collapse. While the age of the SNRs in our sample is uncertain, and the detectability of SNRs depends on the environment into which they are expanding, this suggests that we have found a significant fraction of the remnants from SNe that have exploded during that period, but clearly this list is incomplete.
Further progress in the identification and study of SNRs in galaxies beyond the Local Group is possible via integral field spectroscopy with instruments such as MUSE, especially if the kinematic resolution is sufficient to separate shocked gas from photoionized regions. Deep surveys in radio or possibly X-ray could, in principle, also help identify SNRs using different criteria. Such work is needed in any event to thoroughly characterize both individual SNRs and their population as a whole.
Based on observations obtained at the international Gemini Observatory, a program of NSF’s NOIRLab, which is managed by the Association of Universities for Research in Astronomy (AURA) under a cooperative agreement with the National Science Foundation on behalf of the Gemini Observatory partnership: the National Science Foundation (United States), National Research Council (Canada), Agencia Nacional de Investigación y Desarrollo (Chile), Ministerio de Ciencia, Tecnología e Innovación (Argentina), Ministério da Ciência, Tecnologia, Inovações e Comunicações (Brazil), and Korea Astronomy and Space Science Institute (Republic of Korea). We thank the staff at Gemini-North for their excellent support throughout several semesters during which weather, equipment problems, and the pandemic disrupted the observations.
PFW acknowledges financial support from the National Science Foundation through grants AST-0908566 and AST-1714281. WPB acknowledges support from the Dean of the Krieger School of Arts and Sciences and the Center for Astrophysical Sciences at JHU during this work.
Gemini:North (GMOS), WIYN 3.5m, HST (ACS)
SAOimage ds9, IRAF
References
- Allen et al. (2008) Allen, M. G., Groves, B. A., Dopita, M. A., Sutherland, R. S., & Kewley, L. J. 2008, ApJS, 178, 20, doi: 10.1086/589652
- Annibali et al. (2008) Annibali, F., Aloisi, A., Mack, J., et al. 2008, AJ, 135, 1900, doi: 10.1088/0004-6256/135/5/1900
- Blair et al. (1981) Blair, W. P., Kirshner, R. P., & Chevalier, R. A. 1981, ApJ, 247, 879, doi: 10.1086/159098
- Blair et al. (1983) Blair, W. P., Kirshner, R. P., & Winkler, P. F. 1983, ApJ, 272, 84, doi: 10.1086/161263
- Blair et al. (2012) Blair, W. P., Winkler, P. F., & Long, K. S. 2012, ApJS, 203, 8. http://stacks.iop.org/0067-0049/203/i=1/a=8
- Bomans & Weis (2014) Bomans, D. J., & Weis, K. 2014, Astronomische Nachrichten, 335, 99, doi: 10.1002/asna.201312019
- Bozzetto et al. (2017) Bozzetto, L. M., Filipović, M. D., Vukotić, B., et al. 2017, ApJS, 230, 2, doi: 10.3847/1538-4365/aa653c
- Calzetti et al. (2018) Calzetti, D., Wilson, G. W., Draine, B. T., et al. 2018, ApJ, 852, 106, doi: 10.3847/1538-4357/aaa1e2
- Chomiuk & Wilcots (2009a) Chomiuk, L., & Wilcots, E. M. 2009a, ApJ, 703, 370, doi: 10.1088/0004-637X/703/1/370
- Chomiuk & Wilcots (2009b) —. 2009b, AJ, 137, 3869, doi: 10.1088/0004-6256/137/4/3869
- Chu & Kennicutt (1988) Chu, Y.-H., & Kennicutt, Jr., R. C. 1988, AJ, 95, 1111, doi: 10.1086/114706
- Chyży et al. (2011) Chyży, K. T., Weżgowiec, M., Beck, R., & Bomans, D. J. 2011, A&A, 529, A94, doi: 10.1051/0004-6361/201015393
- Cid Fernandes et al. (2021) Cid Fernandes, R., Carvalho, M. S., Sánchez, S. F., de Amorim, A., & Ruschel-Dutra, D. 2021, MNRAS, 502, 1386, doi: 10.1093/mnras/stab059
- Congiu et al. (2023) Congiu, E., Blanc, G. A., Belfiore, F., et al. 2023, A&A, 672, A148, doi: 10.1051/0004-6361/202245153
- Dalcanton (2007) Dalcanton, J. J. 2007, ApJ, 658, 941, doi: 10.1086/508913
- Ferland et al. (1998) Ferland, G. J., Korista, K. T., Verner, D. A., et al. 1998, PASP, 110, 761, doi: 10.1086/316190
- Filipović et al. (2008) Filipović, M. D., Haberl, F., Winkler, P. F., et al. 2008, A&A, 485, 63, doi: 10.1051/0004-6361:200809642
- Hartigan et al. (1987) Hartigan, P., Raymond, J., & Hartmann, L. 1987, ApJ, 316, 323, doi: 10.1086/165204
- Hong et al. (2013) Hong, S., Calzetti, D., Gallagher, John S., I., et al. 2013, ApJ, 777, 63, doi: 10.1088/0004-637X/777/1/63
- Joye & Mandel (2003) Joye, W. A., & Mandel, E. 2003, in Astronomical Society of the Pacific Conference Series, Vol. 295, Astronomical Data Analysis Software and Systems XII, ed. H. E. Payne, R. I. Jedrzejewski, & R. N. Hook, 489
- Karachentsev et al. (2003) Karachentsev, I. D., Sharina, M. E., Dolphin, A. E., et al. 2003, A&A, 398, 467, doi: 10.1051/0004-6361:20021598
- Karczewski et al. (2013) Karczewski, O. Ł., Barlow, M. J., Page, M. J., et al. 2013, MNRAS, 431, 2493, doi: 10.1093/mnras/stt345
- Kobulnicky et al. (1999) Kobulnicky, H. A., Kennicutt, Robert C., J., & Pizagno, J. L. 1999, ApJ, 514, 544, doi: 10.1086/306987
- Kopsacheili et al. (2020) Kopsacheili, M., Zezas, A., & Leonidaki, I. 2020, MNRAS, 491, 889, doi: 10.1093/mnras/stz2594
- Kopsacheili et al. (2021) Kopsacheili, M., Zezas, A., Leonidaki, I., & Boumis, P. 2021, MNRAS, 507, 6020, doi: 10.1093/mnras/stab2395
- Lacey et al. (1997) Lacey, C., Duric, N., & Goss, W. M. 1997, ApJS, 109, 417, doi: 10.1086/312989
- Lee & Lee (2014a) Lee, J. H., & Lee, M. G. 2014a, ApJ, 786, 130, doi: 10.1088/0004-637X/786/2/130
- Lee & Lee (2014b) —. 2014b, ApJ, 793, 134, doi: 10.1088/0004-637X/793/2/134
- Lee et al. (2015) Lee, M. G., Sohn, J., Lee, J. H., et al. 2015, ApJ, 804, 63, doi: 10.1088/0004-637X/804/1/63
- Leonidaki et al. (2013) Leonidaki, I., Boumis, P., & Zezas, A. 2013, MNRAS, 429, 189, doi: 10.1093/mnras/sts324
- Leonidaki et al. (2010) Leonidaki, I., Zezas, A., & Boumis, P. 2010, ApJ, 725, 842, doi: 10.1088/0004-637X/725/1/842
- Li et al. (2011) Li, W., Chornock, R., Leaman, J., et al. 2011, MNRAS, 412, 1473, doi: 10.1111/j.1365-2966.2011.18162.x
- Long (2017) Long, K. S. 2017, Galactic and Extragalactic Samples of Supernova Remnants: How They Are Identified and What They Tell Us (Springer), 2005, doi: 10.1007/978-3-319-21846-5_90
- Long et al. (2018) Long, K. S., Blair, W. P., Milisavljevic, D., Raymond, J. C., & Winkler, P. F. 2018, ApJ, 855, 140, doi: 10.3847/1538-4357/aaac7e
- Long et al. (2022) Long, K. S., Blair, W. P., Winkler, P. F., et al. 2022, ApJ, 929, 144, doi: 10.3847/1538-4357/ac5aa3
- Long et al. (2020) Long, K. S., Blair, W. P., Winkler, P. F., & Lacey, C. K. 2020, ApJ, 899, 14, doi: 10.3847/1538-4357/aba2e9
- Long et al. (2014) Long, K. S., Kuntz, K. D., Blair, W. P., et al. 2014, ApJS, 212, 21, doi: 10.1088/0067-0049/212/2/21
- Long et al. (2019) Long, K. S., Winkler, P. F., & Blair, W. P. 2019, ApJ, 875, 85, doi: 10.3847/1538-4357/ab0d94
- Maggi et al. (2016) Maggi, P., Haberl, F., Kavanagh, P. J., et al. 2016, A&A, 585, A162, doi: 10.1051/0004-6361/201526932
- Manna & Roy (2023) Manna, S., & Roy, S. 2023, ApJ, 944, 86, doi: 10.3847/1538-4357/acaf64
- Martínez-Delgado et al. (2012) Martínez-Delgado, D., Romanowsky, A. J., Gabany, R. J., et al. 2012, ApJ, 748, L24, doi: 10.1088/2041-8205/748/2/L24
- Mathewson et al. (1983) Mathewson, D. S., Ford, V. L., Dopita, M. A., et al. 1983, ApJS, 51, 345, doi: 10.1086/190854
- Mathewson et al. (1984) —. 1984, ApJS, 55, 189, doi: 10.1086/190952
- Mathewson et al. (1985) Mathewson, D. S., Ford, V. L., Tuohy, I. R., et al. 1985, ApJS, 58, 197, doi: 10.1086/191037
- Matonick & Fesen (1997) Matonick, D. M., & Fesen, R. A. 1997, ApJS, 112, 49, doi: 10.1086/313034
- McQuinn et al. (2019) McQuinn, K. B. W., van Zee, L., & Skillman, E. D. 2019, ApJ, 886, 74, doi: 10.3847/1538-4357/ab4c37
- Mezcua et al. (2013) Mezcua, M., Lobanov, A. P., & Martí-Vidal, I. 2013, MNRAS, 436, 2454, doi: 10.1093/mnras/stt1738
- Milisavljevic & Fesen (2008) Milisavljevic, D., & Fesen, R. A. 2008, ApJ, 677, 306, doi: 10.1086/528929
- Moumen et al. (2019) Moumen, I., Robert, C., Devost, D., et al. 2019, MNRAS, 488, 803, doi: 10.1093/mnras/stz1734
- Ou et al. (2018) Ou, P.-S., Chu, Y.-H., Maggi, P., et al. 2018, ApJ, 863, 137, doi: 10.3847/1538-4357/aad04b
- Points et al. (2019) Points, S. D., Long, K. S., Winkler, P. F., & Blair, W. P. 2019, ApJ, 887, 66, doi: 10.3847/1538-4357/ab4e98
- Raymond (1979) Raymond, J. C. 1979, ApJS, 39, 1, doi: 10.1086/190562
- Russell et al. (2020) Russell, T. D., White, R. L., Long, K. S., et al. 2020, MNRAS, 495, 479, doi: 10.1093/mnras/staa1177
- Sacchi et al. (2018) Sacchi, E., Cignoni, M., Aloisi, A., et al. 2018, ApJ, 857, 63, doi: 10.3847/1538-4357/aab844
- Sharp & Bland-Hawthorn (2010) Sharp, R. G., & Bland-Hawthorn, J. 2010, ApJ, 711, 818, doi: 10.1088/0004-637X/711/2/818
- Summers et al. (2003) Summers, L. K., Stevens, I. R., Strickland, D. K., & Heckman, T. M. 2003, MNRAS, 342, 690, doi: 10.1046/j.1365-8711.2003.06590.x
- Vučetić et al. (2015) Vučetić, M. M., Arbutina, B., & Urošević, D. 2015, MNRAS, 446, 943, doi: 10.1093/mnras/stu2093
- Whitney et al. (2008) Whitney, B. A., Sewilo, M., Indebetouw, R., et al. 2008, AJ, 136, 18, doi: 10.1088/0004-6256/136/1/18
- Williams et al. (2019) Williams, B. F., Hillis, T. J., Blair, W. P., et al. 2019, ApJ, 881, 54, doi: 10.3847/1538-4357/ab2190
- Winkler et al. (2017) Winkler, P. F., Blair, W. P., & Long, K. S. 2017, ApJ, 839, 83, doi: 10.3847/1538-4357/aa683d
- Winkler et al. (2021) Winkler, P. F., Coffin, S. C., Blair, W. P., Long, K. S., & Kuntz, K. D. 2021, ApJ, 908, 80, doi: 10.3847/1538-4357/abd77d
- Winkler et al. (2023) Winkler, P. F., Long, K. S., Blair, W. P., & Points, S. D. 2023, ApJ, 943, 15, doi: 10.3847/1538-4357/aca7f9
| Filter | |||||
|---|---|---|---|---|---|
| Telescope | Date | Designation | (Å) | (Å)aaFull width at half maximum. | Exposure (s)b,cb,cfootnotemark: |
| WIYN 3.5m | 2011 Jun 26-28 | [O 3] | 5010 | 60\phn\phn | \phn\phn |
| Green Continuum | 5127 | 100\phn\phn | \phn\phn | ||
| H | 6563 | 27\phn\phn | \phn\phn | ||
| [S 2]ddWIYN Observatory filter W037; other filters used at WIYN were PFW custom ones. | 6723 | 63\phn\phn | \phn\phn | ||
| Red Continuum | 6840 | 93\phn\phn | \phn\phn | ||
| Gemini-N 8.1m | 2021 Apr 6 | H | 6576 | 70\phn\phn | \phn\phn |
| [S 2] | 6719 | 52\phn\phn | \phn\phn | ||
| r | 6311 | 1357\phn\phn | \phn\phn | ||
cccccc \tablewidth0pt \tablecaptionGemini-N/GMOS Spectroscopy Observations of NGC 4449 \tablehead \colheadMode & \colheadGrating Center Position \colheadDate (UT) \colheadTotal Exposure (s)\tablenotemarka
\colhead\colheadR.A.\phn (J2000) Decl. \colhead \colhead \tablewidth0pt \startdataMOS Mask 1, N-S slits B1200 12:28:08.52 \phn 44:05:32.00 2022 Mar 28, Jun 5 3 CWLs
MOS Mask 2, E-W slits B1200 12:28:09.54\phn\phn 44:05:33.94 2022 Apr 1, Jun 5 3 CWLs
\enddata\tablenotetextaNumber of different Central Wavelength (CWL) Settings number of exposures at each CWL individual exposure time (s).
{deluxetable}lrrrccrrrl \tabletypesize \decimals\tablecaptionProperties of Supernova Remnants and Candidates in NGC 4449a \tablehead \colheadSourceb \colheadR.A. \colheadDecl. \colheadDiameter \colheadMorphology \colheadSpectrum \colhead[S 2]:H 0.5 \colhead[O 1]:H0.1 \colheadFWHM90 km s-1 \colheadOther name(s)c
\colhead\colhead(J2000) \colhead(J2000) \colhead(pc) \colheadClass \colhead \colhead \colhead \colhead \colhead \startdataW23-01 12:27:54.58 44:05:13.7 147 A Yes No No No –
W23-02 12:27:54.79 44:05:30.3 98 A Yes Yes Yes Yes –
W23-03 12:28:04.65 44:05:08.7 37 B Yes Yes No Yes –
W23-04 12:28:04.83 44:04:23.2 31 A – – – – –
W23-05 12:28:04.87 44:04:56.6 54 B – – – – –
W23-06 12:28:05.58 44:04:54.8 44 B Yes Yes No Yes –
W23-07 12:28:06.24 44:05:03.0 44 B Yes Yes No Yes –
W23-08 12:28:06.55 44:04:30.9 52 A Yes Yes Yes No –
W23-09 12:28:06.60 44:03:41.2 38 B – – – – –
W23-10 12:28:07.00 44:04:30.7 79 A Yes Yes Yes Yes LBZ22
W23-11 12:28:07.23 44:04:04.4 48 B Yes Yes No No –
W23-12 12:28:07.43 44:05:32.4 64 A – – – – –
W23-13 12:28:07.65 44:04:09.9 71 A Yes Yes Yes Yes –
W23-14 12:28:07.81 44:03:59.7 60 A Yes Yes Yes Yes –
W23-15 12:28:07.84 44:04:25.3 33 A – – – – –
W23-16 12:28:08.75 44:03:57.3 39 B Yes No No No –
W23-17 12:28:09.15 44:05:25.2 22 A – – – – –
W23-18 12:28:09.68 44:05:19.3 21 A Yes No No Yes CW09-07
W23-19 12:28:09.74 44:04:06.3 62 A – – – – –
W23-20 12:28:10.32 44:05:42.6 33 A Yes Yes Yes Yes –
W23-21 12:28:10.66 44:07:16.5 57 A – – – – –
W23-22 12:28:11.09 44:05:37.1 23 A Yes No No Yes nuclear source
W23-23 12:28:11.48 44:05:36.4 12 A Yes No Yes No S03-18; CW09-15
W23-24 12:28:12.12 44:07:34.1 117 A – – – – –
W23-25 12:28:12.37 44:05:18.6 20 B Yes Yes No Yes –
W23-26 12:28:12.84 44:07:06.8 24 B – – – – –
W23-27 12:28:13.00 44:05:16.8 31 A – – – – –
W23-28 12:28:13.10 44:05:37.7 29 A Yes Yes Yes Yes CW09-19
W23-29 12:28:13.30 44:05:14.5 60 A – – – – –
W23-30 12:28:13.38 44:07:18.5 25 B – – – – –
W23-31 12:28:13.44 44:07:31.3 65 A Yes Yes Yes No –
W23-32 12:28:13.69 44:07:17.9 19 B – – – – –
W23-33 12:28:13.69 44:06:10.6 24 B – – – – –
W23-34 12:28:14.45 44:05:17.1 66 A – – – – LBZ66
W23-35 12:28:14.70 44:07:30.1 33 A Yes Yes Yes Yes –
W23-36 12:28:14.95 44:04:32.3 32 A Yes Yes Yes Yes S03-24
W23-37 12:28:15.24 44:07:28.5 76 A Yes Yes Yes No –
W23-38 12:28:15.28 44:07:13.8 36 A Yes Yes Yes Yes –
W23-39 12:28:15.29 44:06:18.1 14 A Yes Yes Yes Yes –
W23-40 12:28:15.59 44:06:28.4 17 A Yes Yes No Yes –
W23-41 12:28:17.61 44:06:36.6 25 B Yes Yes Yes Yes –
W23-42 12:28:18.24 44:06:38.7 32 B Yes Yes Yes Yes –
W23-43 12:28:18.33 44:06:06.8 36 B – – – – –
W23-44 12:28:18.43 44:06:20.2 26 A Yes Yes Yes No –
W23-45 12:28:19.25 44:06:55.4 33 A Yes Yes Yes Yes LBZ57; CW09-26
W23-46 12:28:19.59 44:06:13.6 19 A – – – – LBZ18
W23-47 12:28:21.07 44:06:07.8 44 A Yes Yes Yes Yes –
W23-48 12:28:22.53 44:05:34.2 52 A Yes Yes Yes Yes –
W23-49 12:28:22.79 44:06:40.0 45 A – – – – –
LBZ-49d 12:28:14.20 44:05:10.1 – – Yes No No No –
LBZ-67d 12:28:14.90 44:04:45.9 – – Yes No No No –
\enddata\tablenotetextaNot included in the table is the bright, O-rich SNR-1, located at RA = 12:28:10.93, Dec = 44:06:48.5. It is a bright source at all wavelengths: S03-15 and CW09-12. \tablenotetextbObjects in bold pass all three spectroscopic tests, and hence are almost certainly SNRs. \tablenotetextcPreviously identified objects within 2\arcsec of a SNR candidate. LBZ objects refer to optical SNR candidates identified by Leonidaki et al. (2013); S03 objects refer to X-ray sources (not necessarily SNR candidates) identified by Summers et al. (2003); and CW09 objects refer to radio SNR candidates identified by Chomiuk & Wilcots (2009b). \tablenotetextd Leonidaki et al. (2013) candidates for which we obtained spectra.
{deluxetable}lrr \tabletypesize \decimals\tablecaptionComparison H 2 Regions in NGC 4449 \tablehead \colheadSource \colheadRA \colheadDec
\colhead\colhead(J2000) \colhead(J2000) \startdataH II-01 12:27:54.58 44:05:25.1
H II-02 12:27:55.60 44:05:26.6
H II-03 12:27:56.41 44:04:53.3
H II-04 12:27:56.72 44:05:25.7
H II-05 12:27:59.21 44:05:25.7
H II-06 12:28:01.98 44:06:11.2
H II-07 12:28:03.84 44:05:20.4
H II-08 12:28:08.70 44:03:10.6
H II-09 12:28:08.78 44:03:28.2
H II-10 12:28:10.94 44:06:51.9
H II-11 12:28:11.07 44:07:04.1
H II-12 12:28:16.65 44:06:13.7
H II-13 12:28:21.31 44:05:56.9
\enddata{deluxetable}rrrrrrrrr \tabletypesize \decimals\tablecaptionNGC4449 candidate SNR spectra \tablehead \colheadSourcea \colheadH Fluxb \colhead[O 1] 6300c \colheadH \colhead[N 2] 6584c \colhead[S 2] 6716c \colhead[S 2] 6731c \colheadH FWHMd \colhead[S 2] FWHMd \startdataW23-01 46.10.9 – 300 27.04.5 69.62.2 51.12.1 61.61.3 65.22.0
W23-02 41.50.7 46.52.8 300 34.64.0 91.12.3 73.02.2 95.21.8 101.52.5
W23-03 15.31.1 – 300 41.817.0 130.012.8 69.411.4 222.617.3 212.421.7
W23-06 22.50.6 – 300 47.76.3 95.95.0 82.04.9 112.43.3 123.46.0
W23-07 13.50.5 – 300 66.99.3 128.26.2 99.65.9 142.96.0 90.24.2
W23-08 37.30.8 45.27.8 300 49.35.5 115.02.7 86.92.5 78.72.0 75.11.7
W23-10 230.01.7 57.91.4 300 53.71.8 155.21.3 104.91.2 92.40.8 96.10.8
W23-11 19.40.2 – 300 55.13.0 97.03.3 71.83.1 64.70.9 66.02.2
W23-13 33.80.4 39.35.5 300 72.62.8 155.32.9 114.52.7 110.91.4 123.72.2
W23-14 36.00.6 90.88.5 300 43.24.0 169.23.7 113.33.4 126.62.4 118.32.6
W23-16 52.00.5 – 300 34.32.2 57.21.0 39.90.9 59.70.6 56.60.9
W23-18 2700.036.1 20.60.4 300 58.83.3 78.71.1 65.01.1 136.22.0 112.81.5
W23-20 185.02.6 56.91.7 300 56.93.5 143.81.2 102.51.1 139.62.2 138.01.2
W23-22 6780.042.8 6.50.5 300 43.71.5 46.90.5 38.20.5 101.90.7 111.31.2
W23-23 740.06.2 36.50.7 300 39.92.0 77.01.3 62.41.3 78.70.7 103.71.7
W23-25 266.03.5 22.80.8 300 62.63.2 105.51.5 75.61.4 167.92.5 157.32.1
W23-28 175.02.1 95.71.8 300 47.53.0 174.92.2 125.02.0 110.51.5 124.11.5
W23-31 71.20.7 66.61.3 300 38.02.5 139.51.2 98.61.1 88.61.0 88.10.7
W23-35 55.20.9 36.23.9 300 49.44.1 133.22.9 98.42.7 114.22.2 151.13.2
W23-36 11.90.6 67.114.3 300 59.212.8 140.49.0 107.98.5 112.26.5 114.37.1
W23-37 17.40.2 49.07.5 300 69.82.3 108.82.6 76.02.4 70.50.7 63.31.5
W23-38 74.21.3 56.27.0 300 24.64.2 117.72.6 78.42.4 97.41.9 145.43.3
W23-39 108.01.2 36.91.9 300 77.82.7 122.51.9 88.61.8 92.41.1 82.71.3
W23-40 136.01.7 27.11.9 300 49.03.0 103.71.3 73.51.2 93.11.3 74.20.9
W23-41 693.01.7 38.10.4 300 46.30.6 117.70.4 83.10.4 91.90.3 84.70.3
W23-42 188.02.0 59.41.0 300 49.52.6 126.24.4 123.54.4 95.41.2 107.13.4
W23-44 138.01.1 50.21.4 300 38.32.0 115.91.6 80.91.5 65.10.6 79.31.1
W23-45 104.01.0 49.31.9 300 53.72.3 107.31.2 91.21.2 161.41.7 167.81.7
W23-47 81.50.9 54.51.3 300 39.02.7 125.21.8 86.11.7 94.01.2 93.51.3
W23-48 64.80.8 51.92.8 300 72.22.9 153.22.0 103.71.8 125.31.6 131.21.7
LBZ49e 77.70.6 10.22.9 300 40.91.8 72.21.2 52.51.2 75.80.6 73.81.3
LBZ67e 182.01.3 15.10.9 300 45.31.7 77.00.6 56.40.6 64.00.5 69.30.5
\enddata\tablenotetextaObjects in bold pass all three spectroscopic tests, and hence are almost certainly SNRs. \tablenotetextbFlux in units of 10-17 ergs cm-2 s-1 \tablenotetextcRatio to H flux where, by convention, H is normalized to 300. \tablenotetextdIn units of km s-1. \tablenotetexte Leonidaki et al. (2013) candiates for which we obtained spectra.
{deluxetable}rrrrrrrrr \tabletypesize \decimals\tablecaptionNGC 4449 H 2 region spectra \tablehead \colheadSource \colheadH Fluxa \colhead[O 1] 6300b \colheadH \colhead[N 2] 6584b \colhead[S 2] 6716b \colhead[S 2] 6731b \colheadH FWHMc \colhead[S 2] FWHMc \startdataH II-01 20.40.5 – 300 26.05.7 100.46.1 70.95.7 74.22.0 76.64.6
H II-02 14.90.3 – 300 15.14.2 50.94.4 42.54.2 63.81.2 58.64.8
H II-03 30.80.3 – 300 39.22.0 51.01.9 36.61.8 61.20.6 60.42.2
H II-04 117.00.5 – 300 38.51.0 52.30.9 39.00.9 62.60.3 60.81.0
H II-05 13.00.3 – 300 51.06.0 168.06.8 123.96.4 74.82.1 80.93.2
H II-06 49.10.4 – 300 30.52.1 61.11.5 46.31.4 69.90.7 73.71.7
H II-07 42.30.3 19.03.7 300 49.01.9 79.41.7 57.61.6 76.60.7 75.91.6
H II-08 11.80.3 – 300 37.65.2 96.96.8 54.96.1 64.41.6 60.84.4
H II-09 133.01.6 14.94.4 300 51.73.0 83.72.1 54.11.9 85.11.2 77.82.0
H II-10 963.012.6 4.90.3 300 37.73.2 36.40.5 27.90.5 76.61.1 52.70.7
H II-11 191.00.5 – 300 25.30.7 30.00.4 20.10.4 63.70.2 56.80.8
H II-12 70.00.4 16.41.6 300 45.41.6 82.70.8 60.40.8 69.70.5 64.30.6
H II-13 63.70.2 9.72.0 300 27.10.8 44.10.7 30.90.6 61.90.2 58.20.9
\enddata\tablenotetextaFlux in units of 10-17 ergs cm-2 s-1 \tablenotetextbRatio to H flux where, by convention, H is normalized to 300. \tablenotetextcIn units of km s-1.
{deluxetable}lcccccccc \tabletypesize \decimals\tablecaptionSummary of Tests of SNR Candidates and H II regions in NGC 4449 \tablehead \colheadGroup \colheadSample Size \colhead[S 2]:H \colhead[O 1]:H \colheadFWHMc \colhead[S 2]:H & [O 1]:H \colhead[S 2]:H & FWHM \colhead[O 1]:H & FWHM \colheadAll \startdataSNRs 30 25 20 22 19 20 15 15
Morph(A) 22 18 18 16 17 14 13 13
Morph(B) \phn8 \phn7 \phn2 \phn6 \phn2 \phn6 \phn2 \phn2
H 2 regions 13 \phn3 \phn0 \phn0 \phn0 \phn0 \phn0 \phn0
\enddata\tablenotetext^a[S 2]:H 0.5 \tablenotetext^b[O 1]:H 0.1 \tablenotetext^cFWHM 90 km s-1