Fair Coins Tend to Land on the Same Side They Started: Evidence from Flips
Abstract
Many people have flipped coins but few have stopped to ponder the statistical and physical intricacies of the process. In a preregistered study we collected coin flips to test the counterintuitive prediction from a physics model of human coin tossing developed by Diaconis, Holmes, and Montgomery (D-H-M; 2007). The model asserts that when people flip an ordinary coin, it tends to land on the same side it started—D-H-M estimated the probability of a same-side outcome to be about 51%. Our data lend strong support to this precise prediction: the coins landed on the same side more often than not, , 95% credible interval (CI) [, ], . Furthermore, the data revealed considerable between-people variation in the degree of this same-side bias. Our data also confirmed the generic prediction that when people flip an ordinary coin—with the initial side-up randomly determined—it is equally likely to land heads or tails: , 95% CI [, ], . Furthermore, this lack of heads-tails bias does not appear to vary across coins. Our data therefore provide strong evidence that when some (but not all) people flip a fair coin, it tends to land on the same side it started. Our data provide compelling statistical support for D-H-M physics model of coin tossing.
Introduction
A coin flip—the act of spinning a coin into the air with your thumb and then catching it in your hand—is often considered the epitome of a chance event. It features as a ubiquitous example in textbooks on probability theory and statistics [1, 2, 3, 4, 5] and constituted a game of chance (‘capita aut navia’ – ‘heads or ships’) already in Roman times ([6], 1.7:22).
The simplicity and perceived fairness of a coin flip, coupled with the widespread availability of coins, may explain why it is often used to make even high-stakes decisions. For example, in 1903 a coin flip was used to determine which of the Wright brothers would attempt the first flight; in 1959, a coin flip decided who would get the last plane seat for the tour of rock star Buddy Holly (which crashed and left no survivors); in 1968, a coin flip determined the winner of the European Championship semi-final soccer match between Italy and the Soviet Union (an event which Italy went on to win); in 2003, a coin toss decided which of two companies would be awarded a public project in Toronto; and in 2004 and 2013, a coin flip was used to break the tie in local political elections in the Philippines.
Despite the widespread popularity of coin flipping, few people pause to reflect on the notion that the outcome of a coin flip is anything but random: a coin flip obeys the laws of Newtonian physics in a relatively transparent manner [3]. According to the standard model of coin flipping [7, 8, 9, 10], the flip is a deterministic process and the perceived randomness originates from small fluctuations in the initial conditions (regarding starting position, configuration, upward force, and angular momentum) combined with narrow boundaries on the outcome space. Therefore the standard model predicts that when people flip a fair coin, the probability of it landing heads is 50% (i.e., there is no ‘heads-tails bias’; conversely, if one side of a coin would land on one side more often than the other, we would say there is a ‘heads-tails bias’).111Some even assert that a biased coin is a statistical unicorn—everyone talks about it but no one has actually encountered one [5]. Physics models support this assertion as long as the coin is not bent [11] or allowed to spin on the ground [3, 4].
The standard model of coin flipping was extended by Diaconis, Holmes, and Montgomery (D-H-M; [12]) who proposed that when people flip a ordinary coin, they introduce a small degree of ‘precession’ or wobble—a change in the direction of the axis of rotation throughout the coin’s trajectory. According to the D-H-M model, precession causes the coin to spend more time in the air with the initial side facing up. Consequently, the coin has a higher chance of landing on the same side as it started (i.e., ‘same-side bias’). Based on a modest number of empirical observations (featuring coins with ribbons attached and high-frame-rate video recordings) D-H-M [12] measured the off-axis rotations in typical human flips. Based on these observations, the D-H-M model predicted that a coin flip should land on the same side as it started with a probability of approximately 51%, just a fraction higher than chance.
Throughout history, several researchers have collected thousands of coin flips. In the 18th century, the famed naturalist Count de Buffon collected uninterrupted sequences of ‘heads’ in what is possibly the first statistical experiment ever conducted [13]. In the 19th century, the statistician Karl Pearson flipped a coin times to obtain tails [14]. And in the 20th century, the mathematician John Kerrich flipped a coin times for a total of heads while interned in Nazi-occupied Denmark [15]. These experiments do not allow a test of the D-H-M model, however, mostly because it was not recorded whether the coin landed on the same side that it started. A notable exception is a sequence of coin flips collected by Janet Larwood and Priscilla Ku in 2009 [16]: Larwood always started the flips heads-up, and Ku always tails-up. Unfortunately, the results (i.e., heads by Larwood and tails by Ku) do not provide compelling evidence for or against the D-H-M hypothesis.
In order to provide a diagnostic empirical test of the same-side bias hypothesized by D-H-M, we collected a total of coin flips, a number that –to the best of our knowledge– dwarfs all previous efforts. To anticipate our main results, the data reveal overwhelming statistical evidence for the presence of same-side bias (and for individual differences in the extent of this bias). Furthermore, the data suggested moderate evidence for the absence of a heads-tails bias.
Results
A group of 48 people (i.e., all but three of the co-authors) tossed coins of 46 different currencies denominations and obtained a total number of coin flips. Raw data, video recordings of the coin flips, and the preregistered analysis plan can be found at https://osf.io/pxu6r/. The data confirm the prediction from the D-H-M model: the coins landed how they started more often than 50%. Specifically, the data feature same-side landings from tosses, , 95% CI [, ] (see Table 1 for a by-person summary), which is remarkably close to D-H-M prediction of (approximately) 51%.
In addition, the data show no trace of a heads-tails bias. Specifically, we obtained heads out of tosses, , 95% CI [, ] (see Table 2 in the methods section for a by-coin summary).
A preregistered Bayesian informed binomial hypothesis test222The preregistration can be found at https://osf.io/cf6nw. indicates extreme evidence in favor of the same-side bias predicted by the D-H-M model, . A similar (not-preregistered) analysis yields moderate evidence against the presence of a heads-tails bias, .
| Person | Same side | Flips | Coins | Proportion [95% CI] | |
|---|---|---|---|---|---|
| XiaoyiL | 780 | 1600 | 2 | ||
| JoyceYCP | 1126 | 2300 | 3 | ||
| AndreeaSZ | 2204 | 4477 | 4 | ||
| KaleemU | 7056 | 14324 | 8 | ||
| FelipeFV | 4957 | 10015 | 3 | ||
| ArneJ | 1937 | 3900 | 4 | ||
| AmirS | 7458 | 15012 | 6 | ||
| ChrisGI | 4971 | 10005 | 5 | ||
| FrederikA | 5219 | 10500 | 5 | ||
| FranziskaN | 5368 | 10757 | 3 | ||
| RietvanB | 1801 | 3600 | 4 | ||
| JasonN | 3352 | 6700 | 7 | ||
| PierreYG | 7506 | 15000 | 9 | ||
| KarolineH | 2761 | 5500 | 5 | ||
| SjoerdT | 2510 | 5000 | 5 | ||
| SaraS | 5022 | 10000 | 3 | ||
| HenrikRG | 8649 | 17182 | 8 | ||
| IrmaT | 353 | 701 | 1 | ||
| KatharinaK | 2220 | 4400 | 5 | ||
| JillR | 3261 | 6463 | 2 | ||
| FrantisekB | 10148 | 20100 | 11 | ||
| IngeborgBR | 4340 | 8596 | 1 | ||
| VincentLO | 2475 | 4900 | 5 | ||
| EricJW | 2071 | 4100 | 5 | ||
| MalteZ | 5559 | 11000 | 7 | ||
| TheresaEL | 1769 | 3500 | 4 | ||
| DavidV | 7586 | 14999 | 5 | ||
| AntonJZ | 5069 | 10004 | 2 | ||
| MagdaM | 2510 | 4944 | 6 | ||
| ThomasB | 2540 | 5000 | 5 | ||
| BohanF | 1118 | 2200 | 3 | ||
| JonasP | 5080 | 9996 | 5 | ||
| HannahA | 1525 | 3000 | 4 | ||
| AdrianKM | 1749 | 3400 | 3 | ||
| AaronBL | 3815 | 7400 | 5 | ||
| KoenD | 3309 | 6400 | 7 | ||
| MichelleCD | 2224 | 4300 | 5 | ||
| RoyMM | 2020 | 3900 | 4 | ||
| TingP | 1658 | 3200 | 4 | ||
| MaraB | 1426 | 2750 | 3 | ||
| AdamF | 4334 | 8328 | 2 | ||
| AlexandraS | 9080 | 17434 | 8 | ||
| MadlenFH | 3705 | 7098 | 1 | ||
| DavidKL | 7895 | 15000 | 1 | ||
| XiaochangZ | 1869 | 3481 | 4 | ||
| FranziskaA | 2055 | 3800 | 4 | ||
| JanY | 956 | 1691 | 2 | ||
| TianqiP | 1682 | 2800 | 3 | ||
| Combined | 178078 | 350757 | 46 | [, ] |
Note. ‘Proportion’ refers to the observed proportion of coin flips that landed same-side, corresponds to a Bayesian binomial test of the same side proportion with vs. .
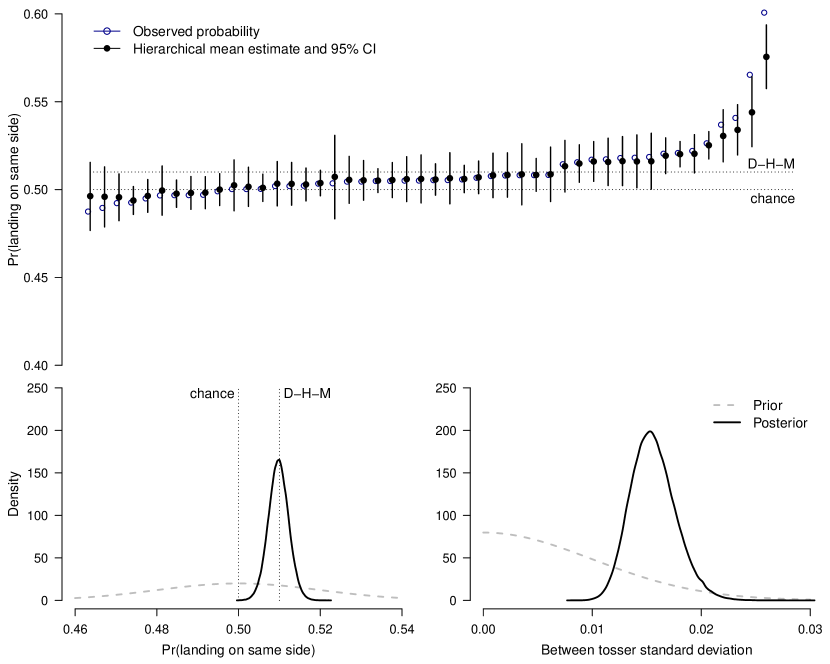
With the data in hand we realized that the same-side bias was possibly subject to considerable between-people heterogeneity. Therefore we specified a more complex Bayesian hierarchical model that includes both heterogeneity in same-side bias between people and heterogeneity in heads-tails bias between coins; this hierarchical model was then used to estimate the parameters and to test the hypotheses using Bayesian model-averaging and inclusion Bayes factors (for details see the methods section). These analyses were not preregistered. The posterior distribution of the same-side bias is slightly wider than in the simple preregistered analysis, , 95% CI [, ], which is caused by the substantial between-people heterogeneity in the probability of the coin landing on the same side, , 95% CI [, ]. The additional uncertainty lowers the evidence for the same-side bias to , which however remains extreme (e.g., when the hypothesis of a same-side bias has a prior probability of , a Bayes factor of about results in a posterior probability of ). Consistent with the visual impression from Figure 1, the hierarchical model reveals overwhelming evidence for the presence of between-people heterogeneity in same-side bias, .
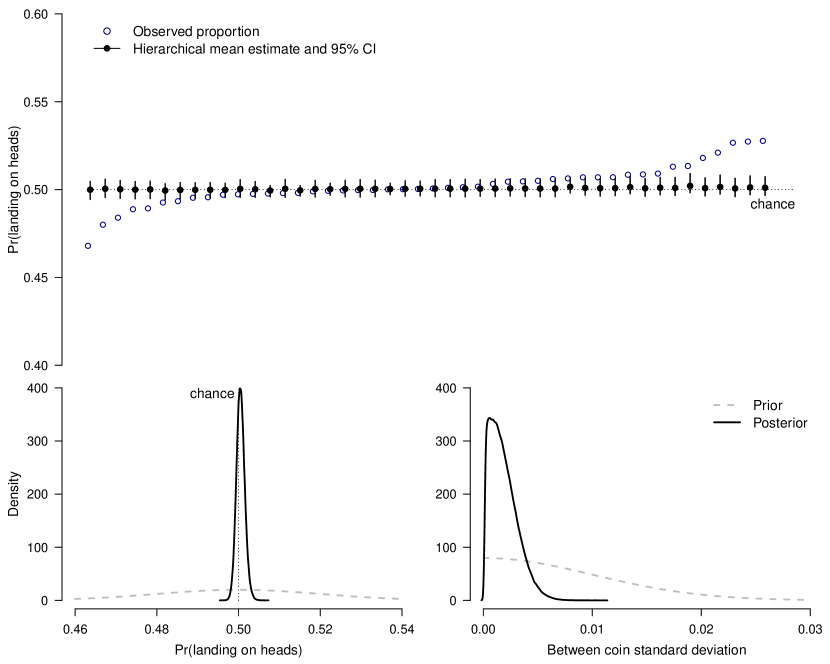
The posterior estimates of the overall probability of heads remains practically unchanged, , 95% CI [, ] with virtually no between-coin heterogeneity, , 95% CI [, ]. The evidence against the presence of heads-tails bias also remains practically unchanged, . The model shows moderate evidence against the presence of between-coin heterogeneity in heads-tails bias, .
We repeated the statistical analyses after excluding four potential outliers with same-side sample proportions larger than 53% (i.e., the four largest and right-most estimates in the top panel of Figure 1) but this does not qualitatively affect the conclusion. The posterior distribution of the same-side bias and the between-people heterogeneity in the probability of the coin landing on the same-side bias decreases, , 95% CI [, ] and , 95% CI [, ], whereas the posterior distribution of the overall probability of heads and the between-coin heterogeneity in the probability of heads remains practically unchanged, , 95% CI [, ] and , 95% CI [, ]. The evidence for the same-side bias and the between-people heterogeneity in the same-side bias decreases but remains extreme, and , whereas the evidence against the heads-tails bias and against between-coin heterogeneity in heads-tails bias remains practically unchanged, and .
Discussion
We collected coin flips and found strong empirical confirmation of the counterintuitive and precise prediction from D-H-M model of human coin tossing: when people flip a coin, it tends to land on the same side as it started. Moreover, the data revealed a substantial degree of between-people variability in same-side bias: as can be seen from Figure 1, some people appear to have little or no same-side bias, whereas others do display a same-side bias, albeit to a varying degree. This variability is consistent with D-H-M model, in which the same-side bias originates from off-axis rotations (i.e., precession or wobbliness), which can reasonably be assumed to vary between people. Future work may attempt to verify whether ‘wobbly tossers’ show a more pronounced same-side bias than ‘stable tossers’. The effort required to test this more detailed hypothesis appears to be excessive, as it would involve detailed analyses of high-speed camera recordings for individual flips (cf. [12]).
In order to ensure the quality of the data, we videotaped and audited the data collection procedure (see the method section for details). However, there remains a legitimate concern: at the time when people were flipping the coins they were aware of the main hypothesis under test. Therefore it cannot be excluded that some of the participants were able to manipulate the coin flip outcomes in order to produce the same-side bias. In light of the nature of the coin tossing process, the evidence from the video recordings, and the precise correspondence between the data and the predictions from D-H-M model, we deem this possibility as unlikely; future work is needed to disprove it conclusively (e.g., by concealing the aim of the study).
Could future coin tossers use the same-side bias to their advantage? The magnitude of the observed bias can be illustrated using a betting scenario. If you bet a dollar on the outcome of a coin toss (i.e., paying 1 dollar to enter, and winning either 0 or 2 dollars depending on the outcome) and repeat the bet times, knowing the starting position of the coin toss would earn you dollars on average. This is more than the casino advantage for deck blackjack against an optimal-strategy player, where the casino would make dollars on a comparable bet, but less than the casino advantage for single-zero roulette, where the casino would make dollars on average [17]. These considerations lead us to suggest that when coin flips are used for high-stakes decision-making, the starting position of the coin is best concealed.
Funding
The authors have no funding to declare, and conducted this research in their spare time.
Author Contributions
Conceptualization: František Bartoš, Alexandra Sarafoglou, and Eric-Jan Wagenmakers.
Data curation: František Bartoš and Amir Sahrani.
Formal analysis: František Bartoš.
Investigation: František Bartoš, Alexandra Sarafoglou, Henrik R. Godmann, Amir Sahrani, David Klein Leunk, Pierre Y. Gui, David Voss, Kaleem Ullah, Malte J. Zoubek, Franziska Nippold, Frederik Aust, Felipe F. Vieira, Chris-Gabriel Islam, Anton J. Zoubek, Sara Shabani, Jonas Petter, Ingeborg B. Roos, Adam Finnemann, Aaron B. Lob, Madlen F. Hoffstadt, Jason Nak, Jill de Ron, Koen Derks, Karoline Huth, Sjoerd Terpstra, Thomas Bastelica, Magda Matetovici, Vincent L. Ott, Andreea S. Zetea, Katharina Karnbach, Michelle C. Donzallaz, Arne John, Roy M. Moore, Franziska Assion, Riet van Bork, Theresa E. Leidinger, Xiaochang Zhao, Adrian Karami Motaghi, Ting Pang, Hannah Armstrong, Tianqi Peng, Mara Bialas, Joyce Y.-C. Pang, Bohan Fu, Shujun Yang, Xiaoyi Lin, Dana Sleiffer, Miklos Bognar, Balazs Aczel, and Eric-Jan Wagenmakers.
Methodology: František Bartoš, Amir Sahrani, David Klein Leunk, Pierre Y. Gui, David Voss, Kaleem Ullah, and Eric-Jan Wagenmakers.
Project administration: František Bartoš.
Resources: Eric-Jan Wagenmakers.
Software: František Bartoš, Amir Sahrani, and Miklos Bognar.
Supervision: Eric-Jan Wagenmakers.
Validation: František Bartoš, Amir Sahrani, David Klein Leunk, Pierre Y. Gui, David Voss, Kaleem Ullah, and Dana Sleiffer.
Visualization: František Bartoš.
Writing - original draft: František Bartoš and Eric-Jan Wagenmakers.
Writing - review & editing: František Bartoš, Chris-Gabriel Islam, Sjoerd Terpstra, Magda Matetovici, Vincent L. Ott, Balazs Aczel, and Eric-Jan Wagenmakers.
(Author contribution generated by tenzing [18].)
Competing Interest
The authors have no competing interest to declare.
Data and Materials Availability
All data and materials are available at https://osf.io/pxu6r/.
Ethical Approval
The research project was approved by the Ethics Review Board of the Faculty of Social and Behavioral Sciences, University of Amsterdam, The Netherlands (2022-PML-15687).
References
- [1] Kerrich JE. An experimental introduction to the theory of probability. E. Munksgaard . 1946.
- [2] Feller W. An introduction to probability: Theory and examples. Wiley . 1957.
- [3] Jaynes ET. Probability theory: The logic of science. Cambridge University Press . 2003.
- [4] Küchenhoff H. Coin tossing and spinning–useful classroom experiments for teaching statistics. In: Physica-Verlag HD. 2008 (pp. 417–426).
- [5] Gelman A, Nolan D. You can load a die, but you can’t bias a coin. The American Statistician 2002; 56(4): 308–311.
- [6] Macrobius AAT. Saturnalia. .
- [7] Vulović VZ, Prange RE. Randomness of a true coin toss. Physical Review A 1986; 33(1): 576–582.
- [8] Keller JB. The probability of heads. The American Mathematical Monthly 1986; 93(3): 191–197.
- [9] Strzałko J, Grabski J, Stefański A, Perlikowski P, Kapitaniak T. Dynamics of coin tossing is predictable. Physics Reports 2008; 469(2): 59–92.
- [10] Strzałko J, Grabski J, Stefański A, Perlikowski P, Kapitaniak T. Understanding coin-tossing. The Mathematical Intelligencer 2010; 32: 54–58.
- [11] Woo DK, Oh CH. Bent coin toss probability. Journal of the Korean Data and Information Science Society 2010; 21(1): 147–153.
- [12] Diaconis P, Holmes S, Montgomery R. Dynamical bias in the coin toss. SIAM Review 2007; 49(2): 211–235.
- [13] Buffon GL. Essai d’arithmétique morale. Supplément à l’Histoire Naturelle 1777; 4: article XXIII.
- [14] Pearson K. The chances of death, and other studies in evolution. Edward Arnold . 1897.
- [15] Kerrich JE. An experimental introduction to the theory of probability. Einar Munksgaard . 1946.
- [16] 40,000 coin tosses yield ambiguous evidence for dynamical bias. https://www.stat.berkeley.edu/~aldous/Real-World/coin_tosses.html; .
- [17] Hannum RC. A guide to casino mathematics. UNLV Gaming Studies Research Center 2003.
- [18] Holcombe AO, Kovacs M, Aust F, Aczel B. Documenting contributions to scholarly articles using CRediT and tenzing. PLoS One 2020; 15(12): e0244611.
- [19] Jeffreys H. Some tests of significance, treated by the theory of probability. Proceedings of the Cambridge Philosophy Society 1935; 31: 203–222.
- [20] Jeffreys H. Theory of probability. Oxford, UK: Oxford University Press. 1 ed. 1939.
- [21] Kass RE, Raftery AE. Bayes factors. Journal of the American Statistical Association 1995; 90(430): 773–795.
- [22] Carpenter B, Gelman A, Hoffman MD, et al. Stan: A probabilistic programming language. Journal of Statistical Software 2017; 76(1): 1–32.
- [23] Stan Development Team . RStan: the R interface to Stan. http://mc-stan.org/; 2018. R package version 2.17.3.
- [24] Raftery AE, Madigan D, Volinsky CT. Accounting for model uncertainty in survival analysis improves predictive performance. In: University Press; 1995: 323–349.
- [25] Hoeting JA, Madigan D, Raftery AE, Volinsky CT. Bayesian model averaging: A tutorial. Statistical Science 1999; 14(4): 382–401.
- [26] Hinne M, Gronau QF, van den Bergh D, Wagenmakers EJ. A conceptual introduction to Bayesian model averaging. Advances in Methods and Practices in Psychological Science 2020; 3(2): 200–215.
Methods
Data collection
We collected data in three different settings using the same standardized protocol. First, a group of five bachelor students each collected at least coin flips as a part of their bachelor thesis project, contributing coin flips in total. Second, we organized a series of on-site “coin flipping marathons” where 35 people spent up to 12 hours coin-flipping (see e.g., https://www.youtube.com/watch?v=3xNg51mv-fk for a video recording of one of the events), contributing a total of coin flips.333Including coin flips collected by the first two authors on a separate occasion. Third, we issued a call for collaboration via Twitter, which resulted in an additional seven people contributing a total of coin flips.
The protocol required that each person collects sequences of 100 consecutive coin flips.444Some sequences slightly varied in length due to issues with keeping track of the number of collected flips in the current sequence. In each sequence, people randomly (or according to an algorithm) selected a starting position (heads-up or tails-up) of the first coin flip, flipped the coin, caught it in their hand, recorded the landing position of the coin (heads-up or tails-up), and proceeded with flipping the coin starting from the same side it landed in the previous trial (we decided for this “autocorrelated” procedure as it simplified recording of the outcomes). In case the coin was not caught in hand, the flip was designated as a failure, and repeated from the same starting position. To simplify the recording and minimize coding errors, participants usually marked sides of the coins with permanent marker. To safeguard the integrity of the data collection effort, all participants videotaped and uploaded recordings of their coin flipping sequences.555There are occasional missing recordings due to failures of recording apparatus/lost files. See https://osf.io/pxu6r/ for the data and video recordings.
Statistical analysis
Preregistered analysis
Prior to data collection, we preregistered (https://osf.io/cf6nw) an informed Bayesian binomial test with same-side outcomes out of trials,
assuming that the coin flips are independently and identically distributed across people and coins. We specified two competing hypotheses for the binomial success parameter , where success denotes the coin landing on the same side it started from,
where instantiates the same-side bias of approximately 51% predicted by D-H-M [12]. We then computed the Bayes factor [19, 20, 21],
in order to quantify the evidence for the competing hypotheses, with indicating evidence for the D-H-M hypothesis and indicating evidence for the null hypothesis.
Exploratory analyses
We performed a similar analysis to test for heads-tails bias. Again we specified an informed Bayesian binomial test with heads outcomes out of trials,
assuming that the coin flips are independently and identically distributed across people and coins. We specified two competing hypotheses in terms of the binomial success parameter , where success denotes the coin landing heads,
where represents the hypothesis that the heads-tails bias is present but very small.
Accounting for dependencies across people and coins
In order to account for possible dependencies between people and coins, we applied the following hierarchical Bayesian logistic regression model to the data. For starting position and landing position (heads: , and tails: ),
where denotes the overall probability of heads, denotes the overall same-side bias, denotes the coin-specific deviations from the probability of heads which are normally distributed with mean zero and variance , and denotes the person-specific deviations from the same-side bias which are normally distributed with mean zero and variance , for the flip of the person with the coin.
For parameter estimation we used Stan [22] via the rstan R [23] package, and assigned the following slightly informed prior distributions to the overall the same-side bias , head-tails bias, , and the people and coin heterogeneity in the respective biases (, ):
which represents a plausible degree of same-side bias and heads-tails bias () and a small between people and coin heterogeneity in the corresponding biases ().
The above model was used to estimate the same-side bias and the heads-tails bias while taking into account the dependency across people and coins. Furthermore, we used the model as a starting point for testing the hypotheses of the same-side bias, , and heads-tails bias, , with the addition of hypotheses about between-people heterogeneity in the same-side bias, , and between-coin heterogeneity in the heads-tails bias, :
Note that for the purpose of hypothesis testing, highly peaked prior distributions could be assigned to the parameters of the alternative hypothesis, including to the between-person and between-coin heterogeneity, with the expected a priori standard deviation equal to 0.5%.
To test the hypotheses while accounting for uncertainty in the model structure, we used Bayesian model averaging [24, 25, 26] and specified 16 possible models as a combination of the different possible hypotheses. For example, specifies the presence of the same-side bias, the presence of the heads-tails bias, the presence of between-people heterogeneity in same-side bias, and the presence of between-people heterogeneity in the heads/tails bias. specifies the presence of the same-side bias, the presence of the heads-tails bias, the presence of between-people heterogeneity in same-side bias, and the absence of between-people heterogeneity in the heads-tails bias. The last model, , then specifies the absence of the same-side bias, the absence of the heads-tails bias, the absence of between-people heterogeneity in same-side bias, and the absence of between-people heterogeneity in the heads/tails bias. The entire model space is listed as follows:
Evidence for the parameters of interest may be quantified across the rival models using inclusion Bayes factors, a generalization of Bayes factors based on the change from prior to posterior odds [26]:
where contains a set of models where a given hypothesis holds and contains the compliment. Specifically, to test for the presence vs. absence of same-side bias implies and ; to test for the presence vs. absence of heads-tails bias implies and ; to test for the between-people heterogeneity in the same-side bias implies and ; and to test for the between-coin heterogeneity in the heads-tails bias implies and . Finally, each of the 16 models are assigned an equal prior model probability, that is,
| Coin | Heads | Flips | People | Proportion [95% CI] | |
|---|---|---|---|---|---|
| 1 DEM | 468 | 1000 | 1 | 1.149 | |
| 0.25 CAD | 48 | 100 | 1 | 0.996 | |
| 20 DEM (silver) | 484 | 1000 | 1 | 0.999 | |
| 5 CZK | 1222 | 2500 | 2 | 1.014 | |
| 0.05 NZD | 984 | 2011 | 1 | 0.985 | |
| 0.10 EUR | 4515 | 9165 | 6 | 1.162 | |
| 50 CZK | 3207 | 6500 | 7 | 0.974 | |
| 1 HRK | 4258 | 8596 | 1 | 0.871 | |
| 1 MXN | 4180 | 8434 | 1 | 0.854 | |
| 1 SGD | 7655 | 15400 | 2 | 0.736 | |
| 5 JPY | 746 | 1500 | 1 | 0.935 | |
| 5 ZAR | 3645 | 7326 | 1 | 0.789 | |
| 2 EUR | 24276 | 48772 | 28 | 0.623 | |
| 0.01 GBP | 498 | 1000 | 1 | 0.954 | |
| 0.50 EUR | 28617 | 57445 | 32 | 0.536 | |
| 1 DM | 1996 | 4000 | 4 | 0.847 | |
| 0.20 EUR | 15665 | 31373 | 20 | 0.503 | |
| 0.25 BRL | 1998 | 4000 | 2 | 0.846 | |
| 0.10 RON | 1000 | 2001 | 1 | 0.913 | |
| 1 CHF | 2249 | 4500 | 4 | 0.831 | |
| 1 EUR | 18920 | 37829 | 25 | 0.458 | |
| 0.20 GEL | 4501 | 8998 | 5 | 0.726 | |
| 1 CAD | 5604 | 11200 | 11 | 0.688 | |
| 2 CAD | 1502 | 3000 | 3 | 0.878 | |
| 2 MAD | 1503 | 3000 | 1 | 0.878 | |
| 100 JPY | 752 | 1500 | 1 | 0.933 | |
| 2 CHF | 2259 | 4503 | 2 | 0.837 | |
| 5 MAD | 1007 | 2001 | 1 | 0.919 | |
| 0.20 GBP | 1516 | 3005 | 2 | 0.902 | |
| 1 CNY | 757 | 1500 | 1 | 0.940 | |
| 1 CZK | 505 | 1000 | 1 | 0.958 | |
| 2 ILS | 506 | 1000 | 1 | 0.960 | |
| 5 SEK | 8052 | 15902 | 7 | 1.366 | |
| 0.25 USD | 2180 | 4300 | 4 | 0.948 | |
| 1 MAD | 1014 | 2000 | 1 | 0.943 | |
| 0.50 RON | 1442 | 2844 | 3 | 0.939 | |
| 0.05 EUR | 3820 | 7513 | 6 | 1.198 | |
| 0.50 GBP | 765 | 1504 | 1 | 0.960 | |
| 2 BDT | 2038 | 4003 | 2 | 1.022 | |
| 5 YEN | 1026 | 2000 | 1 | 1.022 | |
| 10 CZK | 4572 | 8905 | 7 | 3.295 | |
| 0.20 CHF | 518 | 1000 | 1 | 1.011 | |
| 0.50 SGD | 1449 | 2781 | 3 | 1.511 | |
| 0.02 EUR | 158 | 300 | 1 | 0.998 | |
| 1 GBP | 791 | 1500 | 2 | 1.249 | |
| 2 INR | 552 | 1046 | 1 | 1.108 | |
| Combined | 175420 | 350757 | 48 | [, ] | 0.168 |
Note. ‘Proportion’ refers to the observed proportion of coin flips that landed heads, corresponds to a Bayesian binomial test of the heads proportion with vs. .
Audit
We randomly sampled and audited ninety sequences of 100 coin flips. We verified the existence of the video recordings (with occasionally missing video recordings due to file corruption or recording equipment malfunction) and attempted to re-code the outcome of individual coin tosses from the video recordings. We encountered video recordings of varying quality and detail which made one-to-one matching of the original coded sequences and the re-coded audited sequences highly challenging. However, assessing the degree of same-side bias on the original vs. the audited sequences revealed that the original sequences contained a highly similar degree of same-side bias. As such, it seems implausible that the original sequences were affected by coding bias in favor of the same-side hypothesis.