VLASS tidal disruption events with optical flares II: discovery of two TDEs with intermediate width Balmer emission lines and connections to the ambiguous extreme coronal line emitters
Abstract
The multiwavelength properties of radio-emitting tidal disruption events (TDEs) are poorly understood. In a previous paper, we presented the first sample of radio-selected, optically-detected TDEs, which included two events (VT J1008 and VT J2012) associated with late-time ( years post-optical flare) intermediate with emission lines that are largely unprecedented from TDEs. In this paper, we investigate these two events in detail. The multiwavelength properties of these events are otherwise consistent with optically-selected TDEs. They are hosted by green valley, E+A/Balmer dominated galaxies with low star formation rates and black holes masses . The optical flare shapes are fully consistent with those of optically-selected TDEs, although they are slightly faint and cool at peak. The radio emission from both events is consistent with wide-angle, non-relativistic outflows with erg s-1. Balmer and Helium emission lines are detected from both events with full-width-half-maxima km s-1 and asymmetric line profiles. VT J1008 additionally shows coronal line emission with a similar width. The lines from VT J2012 are redshifted by km s-1 relative to the host galaxy. We show that these events share many characteristics in common with the ambiguous class of extreme coronal line emitters. We argue that the lines are likely associated with a radiative shock or dense, photoionized clumps of outflowing gas in the circumnuclear medium.
1 Introduction
Tidal disruption events occur when a star ventures within the tidal radius of a supermassive black hole (SMBH). In the last couple decades, our observational and theoretical understanding of TDEs has dramatically improved, largely thanks to the advent of wide field, time-resolved surveys in the optical and X-ray. Follow-up of optically- and X-ray-selected events at other wavelengths has shed light on the evolution of TDEs but can only provide limited information due to selection biases and limited follow-up resources.
These limitations have particularly impacted our understanding of the radio emission from TDEs. The physical mechanisms generating TDE radio emission are poorly understood as there have been limited detections of radio emission from TDEs. The landscape of TDE radio emission is beginning to evolve, however, as full sky radio surveys come online.
In a previous paper, we presented the first sample of radio-selected TDEs. This sample included all TDE-like radio transient in VLASS with optical counterparts. In Paper I, we discussed the connections between host galaxy properties/optical flares with the presence of radio emission using a sample of radio-selected TDEs with optical flares. We noticed several possible correlations between multiwavelength properties and radio loudness, including possible trends with optical luminosity and host galaxy SMBH mass. One of the most intriguing discoveries from our sample was the detection of intermediate width Balmer emission from the only two events in our sample in quiescent galaxies. Such emission has not been reported for uniformly selected, bona-fide TDEs before (see Yao et al. (2023) for an event discovered simultaneous with our work): the only previous reports of similar emission are from SDSS-selected flaring galaxies, but these events had poorly sampled multiwavelength data, causing ambiguities about the flare origins.
In Paper I, we presented our full sample. In this paper, we delve into the multiwavelength properties and the interpretation of the two events with intermediate width Balmer emission lines.
2 Sample Selection
| VT J1008 | VT J2012 | |
|---|---|---|
| R.A. | ||
| Dec. | ||
| [] | 0.18 | 0.2 |
| 0.045 | 0.053 | |
| [Mpc] | 205 | 244 |
| SFR [] | ||
| VLASS [ erg s-1 Hz-1] |
Our sample selection is described in detail in Paper I; we discuss it briefly here. We identified the two objects described in this work as members of a broader sample of radio-selected TDEs. We compiled this TDE sample from the Very Large Array Sky Survey (VLASS; Lacy et al., 2020). VLASS is observing the sky with at 3 GHz for three epochs with a cadence of years, a per-epoch sensitivity of mJy and a spatial resolution of . The first two epochs were completed in 2017/2018 and 2020/2021. The third epoch is ongoing at the time of writing.
We identified TDE candidates using the transient catalog of Dong et al., in prep., who identified all sources that were detected at in E2 but not significantly detected () in E1; i.e., this catalog contains all transients that are rising between E1 and E2. Details about the transient detection algorithm are described in Somalwar et al. (2021) and Dong et al., in prep. We select TDE candidates from this catalog as sources coincident with PanSTARRS-detected galaxies. The galaxies must show no evidence for strong AGN activity in any public archival data. Among the criteria used to identify AGN, we consider: the position of the source on the WISE W1-W2 and W2-W3 color diagram; any evidence for past optical, X-ray, or radio variability/detections that could indicate AGN activity. The host galaxy must also have a photometric redshift , at which redshifts multiwavelength counterparts and host galaxies are more readily detected with reasonable exposure times. The resulting sample has objects.
In Paper I, we focus on the subset of this sample with associated optical flares in data from the Zwicky Transient Facility (ZTF; bands) and the Asteroid Terrestrial-impact Last Alert System (ATLAS; bands). The resulting sample has six objects, three of which are hosted by weak Seyferts, one by a starforming galaxy, and two by quiescent galaxies. The two objects in quiescent galaxies were also detected to have unusual, intermediate width Balmer lines, and thus are the focus of this work. Details of the rest of the sample are presented in Papers I and III.
The two sources are named using our VLASS transient naming convention: VT J100853.44+424300.22 (VT J1008) and VT J201229.90-170556.32 (VT J2012). We refer to the host galaxies of these objects using the coordinates prefixed with HG (host galaxy; e.g., HG J1008). In plots, we often label the individual transients or host galaxies without the prefixes (e.g., J1008), except when the prefixes are necessary for clarity.
3 Summary of transient properties
In this section, we present observations of VT J1008 and J2012 and briefly summarize the multiwavelength properties of each source. We defer discussion of the optical spectral features, which are the main focus of this paper, to the following section.
3.1 VT J1008
We begin our discussion with VT J1008, the multiwavelength properties of which are summarize in Figure 1. In the following subsections, we break down each panel of Figure 1.
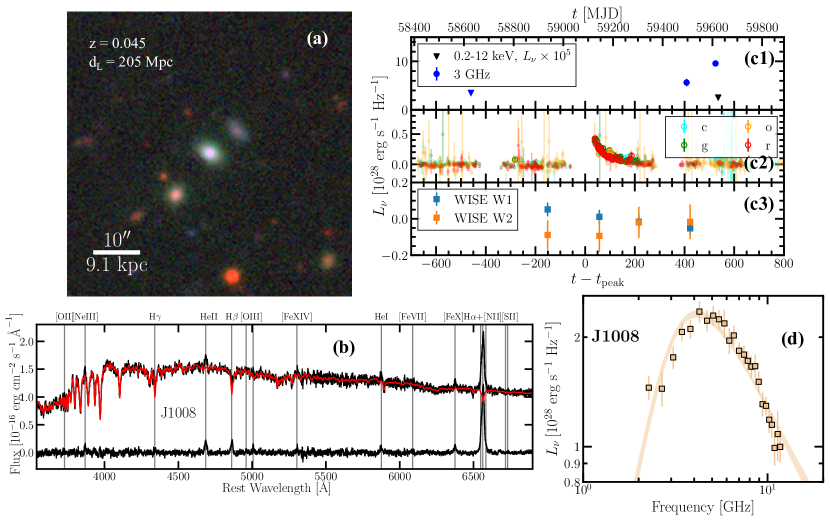
3.1.1 Host galaxy properties
A PanSTARRS optical image of the host galaxy of VT J1008, HG J1008, is shown in the panel a of Figure 1. It is at a redshift , or a luminosity distance Mpc. The host galaxy spectrum is shown in panel b. Note that this spectrum is contaminated by transient features. Based on the H absorption and an upper limit on the H EW (we cannot constrain the H EW exactly because of the transient emission), this galaxy is consistent with being an E+A; i.e., it underwent a starburst in the last Gyr. There is no strong indication of an AGN, although the faint [Ne III] and [O III] emission lines could be produced by a weak AGN. These lines could also be produced by star formation, however.
We performed an SED fit for HG J1008 in Paper I. We briefly review the results here, but refer the reader to Paper I for a detailed description of our methodology. The host galaxy has a stellar mass , and the upper limit on the star formation rate is . This host is consistent with the green valley. It is also consistent with being an E+A galaxy.
These SED fit parameters also set constraints on the SMBH masses. From the stellar mass, we can infer a SMBH mass using the Yao et al. (2023) relation for optical TDE hosts: . Alternatively, Yao et al. (2023) measured a stellar velocity dispersion for this source . Using the relation from Kormendy & Ho (2013), we find , which is consistent with the value measured from the stellar mass. This SMBH mass is small relative to the SMBH masses measured from TDEs by Yao et al. (2023): VT J1008 has a smaller SMBH mass than 27/32 () of their TDEs.
3.1.2 Optical and IR broadband transient emission
In panel c2 of Figure 1, we show the optical lightcurve for VT J1008. This lightcurve was created using the ATLAS111https://fallingstar-data.com/forcedphot/ and ZTF222https://irsa.ipac.caltech.edu/data/ZTF/docs/ztf_forced_photometry.pdf forced photometry retrieved using recommended procedures. Both surveys detected an optical flare from this source starting on MJD. The flare rise was missed, but the decay was well-sampled. Yao et al. (2023) fit this lightcurve as an evolving blackbody with the temperature fixed to that at peak luminosity. They found a peak blackbody luminosity of and peak temperature . The radius at peak luminosity was . The time to rise from half-max-luminosity to max-luminosity was days, and the time to decay from max to half-max was days. This peak temperature is cool for a typical optically-selected TDE: it is cooler than 25/32 () of the optical TDEs in Yao et al. (2023). The peak luminosity is lower than every TDE in the Yao et al. (2023) sample. The rise and decay times are typical of optically-selected TDEs.
During the writing of this work, VT J1008 rebrightened in the optical and has been identified as a repeating partial TDE. Although it is plausible that the repeating nature of this source has affected the emission, we do not consider the rebrightening here and refer the reader to Somalwar et al. (2023a) for details.
In panel c3, we show the IR lightcurve for this source from the NEOWISE survey, processed using the methods described in Somalwar et al. (2023b). We do not see any significant IR variability.
3.1.3 X-ray emission
We checked public X-ray survey data, including the XMM Newton Slew Survey, etc, for archival detections of VT J1008. No detections were reported. The pre-optical-flare X-ray upper limit was erg s-1. The tightest post-optical flare limit is from our Swift/XRT ToO. We obtained X-ray observations of VT J1008 on MJD 59638 using a 3.5 ks exposure with the Swift/XRT telescope (PI Somalwar). The source was not detected, with a luminosity upper limit of erg s-1. This upper limit is shown in panel c1 of Figure 1.
3.1.4 Radio emission
The radio lightcurve for VT J1008 is shown in panel c1. VT J1008 was first observed by VLASS on MJD 58628; this nondetection was days before the optical peak. It was observed again on MJD 59496 ( days post-optical peak) and was detected as a mJy source, corresponding to a 3 GHz luminosity of erg s-1 Hz-1. We observed the source with the VLA on MJD 59612 ( days post-peak) in the CLSX bands. The 3 GHz radio luminosity from this SED had risen since to VLASS observation to erg s-1 Hz-1. If we assume that the radio-emitting outflow was launched at optical peak, this rise corresponds to a power-law evolution, which is consistent with expectations for a constant velocity outflow.
The VLA radio SED is shown in panel d. We modelled the SED as a synchrotron outflow following the methodology described in Appendix E of Paper I, where we assume a spherically symmetric outflow with magnetic field , electron density , and radius . We assume the electrons have a power-law energy distribution with index . We assume equipartition with and , corresponding to the minimum energy solution. The total energy in the outflow is given by . We find a radius , a magnetic field , an electron density , and an energy . Assuming the outflow was launched at the optical peak with velocity , the best-fit radius gives , or km s-1.
The radio SED is thus consistent with a non-relativistic, wide-angle outflow launched near optical peak.
3.2 VT J2012
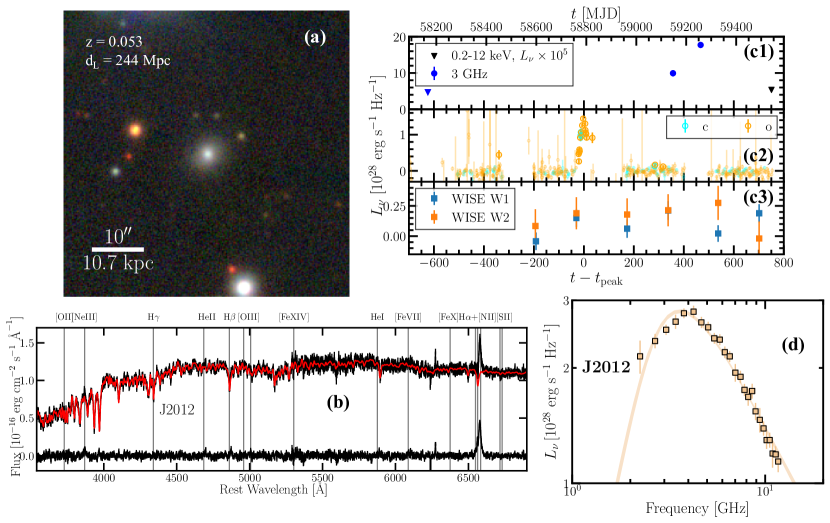
3.2.1 Host galaxy properties
An optical image from the DECam Legacy Survey of HG J2012 is shown in the panel (a) of Figure 2. It is at a redshift , or a luminosity distance Mpc. The host galaxy spectrum (contaminated by transient features) is shown in panel (b). From the H absorption and an upper limit on the H EW, this galaxy is a balmer strong galaxy, which have slightly older stellar population than E+A galaxies. There is no indication of an AGN, although faint [Ne III] emission may be present.
From an SED fit performed in Paper I, the host galaxy has a stellar mass . The upper limit on the star-formation rate is . This host is consistent with the green valley.
From the stellar mass, we can infer a SMBH mass using the Yao et al. (2023) relation for optical TDE hosts: . In paper I, we measured a stellar velocity dispersion for this source . Using the relation from Kormendy & Ho (2013), we find , which is consistent with the value measured from the stellar mass. This SMBH mass is near the median of the SMBH masses from Yao et al. (2023)
3.2.2 Optical and IR broadband transient emission
The optical lightcurve for VT J2012 is shown in panel c2 of Figure 2. This source was only detected by the ATLAS survey, and the lightcurve was created using recommended procedures. The flare was first detected on MJD. Paper I fit this lightcurve to the same model as used for VT J1008, and found a peak blackbody luminosity of and peak temperature . The radius at peak luminosity was . The time to rise from half-max-luminosity to max-luminosity was days, and the time to decay from max to half-max was days. Like VT J1008, this source shows a remarkably cool, faint flare relative to the Yao et al. (2023) sample.
In panel c3, we show the IR lightcurve for this source from the NEOWISE survey, processed using the methods described in Somalwar et al. (2023b). Like for VT J1008, We do not see any significant IR variability.
3.2.3 X-ray emission
We checked public X-ray survey data, including the XMM Newton Slew Survey, etc, for archival detections of VT J1008. No detections were reported. The pre-optical-flare X-ray upper limit was erg s-1. The tightest post-optical flare limit is from our Swift/XRT ToO. We obtained X-ray observations of VT J2012 on MJD 59536 using a 1.6 ks exposure with the Swift/XRT telescope (PI Somalwar). The source was not detected, with a luminosity upper limit of erg s-1. This upper limit is shown in panel c1 of Figure 1.
3.2.4 Radio emission
The radio lightcurve for VT J2012 is shown in panel c1. VT J2012 was first observed by VLASS on MJD 58166 ( days pre-peak) and the luminosity upper limit was erg s-1 Hz-1. It was observed again on MJD 59147 ( days post-optical peak) and was detected as a erg s-1 Hz-1 source (). We observed the source with the VLA on MJD 59258 ( days post-peak) in the CLSX bands, and the 3 GHz radio luminosity had risen to erg s-1 Hz-1. This corresponds to a power-law, which is consistent with a constant velocity.
The VLA radio SED is shown in panel d. We modelled the SED as a synchrotron outflow following the same methodology used for VT J1008. We find a radius , a magnetic field , an electron density , and an energy . Assuming the outflow was launched at the optical peak with velocity , the best-fit radius gives , or km s-1.
Like that of VT J1008, this radio SED is consistent with a non-relativistic, wide-angle outflow launched near optical peak.
3.3 Summary
We conclude with a brief summary of the results from this section:
-
•
VT J1008 and VT J2012 are hosted by quiescent galaxies with no evidence for strong AGN activity. The galaxies are both E+A or Balmer-strong galaxies in the green valley. Both galaxies have SMBH masses .
-
•
VT J1008 and VT J2012 have optical counterparts with peak blackbody luminosities erg s-1 and temperature at peak , which are cooler and fainter than those of typical optically-selected TDEs. The rise and decay times of the optical flares are typical of optically-selected TDEs.
-
•
Neither VT J1008 or VT J2012 have IR or X-ray counterparts.
-
•
VT J1008 and VT J1008 both are associated with radio transients that turned on years post-optical peak. They both have 3 GHz luminosities erg s-1 Hz-1, which is a typical luminosity for optically-selected, radio-detected TDEs. The radio SEDs of both sources are consistent with low velocity , wide angle outflows with energies erg.
4 The transient optical spectral features
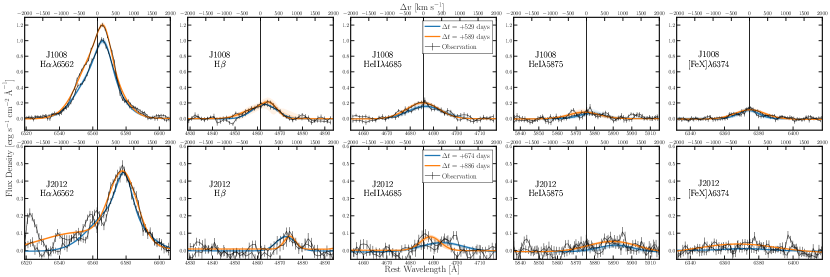
While keeping the broader picture of the multiwavelength properties of our two radio TDEs in mind, we now delve into the intermediate width transient lines, which are the focus of this work. Zoom-ins on these features are shown in Figure 3. In this section, we present our methodology for constraining the emission line properties and present the results. We then briefly compare the observed lines to other transient observations, but defer a detailed discussion of the origins of the lines to Section 5.
4.1 Methodology
We first constrain the properties of the transient spectral lines. We use two sets of observations, which we process separately.
First, we considered low resolution but flux calibrated observations with the Low Resolution Imaging Spectrometer (LRIS) on the Keck I telescope. We observed VT J1008 on MJD 59676 for 20 min. using the slit with the standard star Feige 34 and on MJD 59616 for 10 min. using the standard star G191-B2B. We centered all observations on the galactic nuclei using a parallactic angle. We used the 400/3400 grism, the 400/8500 grating with central wavelength 7830, and the 560 dichroic. The resulting wavelength range was and the resolution . We observed VT J2012 on MJD 59464 for 10 min using the slit with the standard stars BD+28 and G191-B2B for the blue/red sides, respectively, and on MJD 59678 using the standard star Feige 34. We reduced all spectra using the lpipe code with standard settings.
To constrain the properties of the transient spectral lines, we first must remove the host galaxy stellar emission from all the spectra. We fit each spectrum with the ppxf full spectrum fitting tool using the MILES templates (Vazdekis et al., 2010) following the method detailed in Appendix B of Somalwar et al. (2021). The resulting best-fit stellar component is shown, for each source, in red in the panel b’s of Figure 1 and Figure 2. We then create a nebular spectrum by subtracting the stellar component from the galaxy spectrum, and the result is shown at the bottom of the panel b’s of Figure 1 and Figure 2.
With these low resolution emission line spectra in hand, we now can fit the line profiles. We consider the following lines, for reasons that will become clear later in this work: H, H, [O III], [O III], [O II], and He II. We first fit each line to a Gaussian with free centroid, width, and flux. We require the centroid be within km s-1 of the expected wavelength given the host redshift. We set the lower bound of the width to be such that the line FWHM is greater than , corresponding to a rough lower limit on the LRIS resolution. The width upper bound is km s-1, which does not affect the fits. We adopt broad, uninformative priors for the flux: erg cm-2 s-1. For the [O II] complex, we fit a single Gaussian rather than two because we do not expect the doublet to be resolvable given the large LRIS FWHM.
For some of the Balmer lines, this single Gaussian fit produces a statistically inconsistent . In those cases, we run a third fit with two Gaussian components, each with independent widths, amplitudes, and centroids. For J2012, we fix the centroid of one component at the host redshift. This produces a consistent in each case.
From both events, the [O II] doublet is not significantly detected, and the [O III] line is detected with a narrow width km s-1. Given the narrow widths of the [O III] emission, we do not believe it is coming from the same location as the Balmer and Helium emission. Instead, it is consistent with being stable host galaxy emission. To constrain the presence of intermediate width, transient emission at the location of these oxygen lines, we repeat the Gaussian fit but fix the width to FWHM km s-1. In the case of , we do not subtract out the narrow line component before this fit, so the broad fit absorbs the flux from this narrow line. We choose to do this because it produces the most conservative upper limit on the broad line flux for this emission line, even though the resulting fit has a high . Subtracting out the narrow component would not affect our conclusions; it would simply tighten the bound on the presence of transient emission.
The resulting best-fit parameters of the lines from the low resolution spectra are listed in Table 2, and the fits are shown in Figure 3.
In addition to these low resolution spectra, we use high resolution spectra that are not flux calibrated. The high resolution spectra are taken at later times than the low resolution spectra, so they provide constraints on the line profiles over a longer timescale. Moreover, while we cannot set luminosity constraints using the high resolution spectra, we can study the line profiles in detail; in particular, we can distinguish between multiple, blended lines or a single line with a broad profile. We obtained spectra of these obejcts with the Echellette Spectrograph and Imager (ESI) on the Keck II telescope. We used the Echelle mode for all observations. We observed VT J1008 on MJD 59908 for 22.5 min using the slit and the standard BD+28, and on MJD 60029 for 45 min using the slit and the standard BD+33. We observed VT J2012 on MJD 59876 for 20 min using the arcsec slit and the standard BD+28. We reduced the observations using the makee code with standard settings, and removed telluric lines using recommended procedures. For both objects, the H lines fall in a region with strong telluric absorption and bright sky lines. Fortunately, the spectra are of sufficiently high resolution that we can still study the smooth line profiles, but all spikes and other unusual features in the data are due to this contamination.
Zoom-ins on the resulting H line profiles are shown in Figure 4. While other lines are detected (VT J1008: [O III], He II), no other line is detected at a sufficiently high signal-to-noise to allow detailed constraints on its profile.
Because the line profiles observed cannot be well-modelled as Gaussians, we constrain the line profiles using a different methodology from that used for the LRIS data. We aim to constrain the velocity offset of the line peak, the upper FWHM, and the lower FWHM. First, we fit a second degree polynomial in the range of the pixel with the maximum flux. The line centroid is then the wavelength at the peak of the polynomial. We measure the uncertainties on this centroid by repeating this process 1000 times, where each time we randomize the spectrum based on the observed errors. This method of finding the line centroid is approximate: the centroid is not well defined for the unusual profiles observed here. We then measure the upper and lower FWHM as the distance to the pixels on either side of the peak at which the flux levels drop below half of the peak flux. The results are reported in Table 2.
| Name | MJD | Line Name | |||||
|---|---|---|---|---|---|---|---|
| km s-1 | km s-1 | km s-1 | erg cm-2 s-1 | erg s-1 | |||
| VT J1008 | 59676 | [OII] | |||||
| HeII | |||||||
| H | |||||||
| [OIII] | |||||||
| HeI | |||||||
| [FeX] | |||||||
| H | |||||||
| 59616 | [OII] | ||||||
| HeII | |||||||
| H | |||||||
| [OIII] | |||||||
| HeI | |||||||
| [FeX] | |||||||
| H | |||||||
| 59909 | H | ||||||
| 60029 | H | ||||||
| VT J2012 | 59464 | [OII] | |||||
| HeII | |||||||
| H | |||||||
| [OIII] | |||||||
| HeI | |||||||
| [FeX] | |||||||
| H | |||||||
| 59677 | [OII] | ||||||
| HeII | |||||||
| H | |||||||
| [OIII] | |||||||
| HeI | |||||||
| [FeX] | |||||||
| H | |||||||
| 59909 | H |
4.2 Results
In this section, we briefly summarize the results from our emission line analysis. We also perform some basic analysis to constrain the parameters of the emitting region, which uses simple approximations for the emission line parameters. While we do not expect the results of this analysis to be exact, we use them to gain a rough understanding of the physical conditions in the emitting region.
We first consider the recombination lines: the Balmer and Helium emission. Both H and H are detected from VT J1008 and VT J2012 in all observations. The H lines from both objects have luminosities of erg s-1 and they are brightening with time. The H lines are fainter, at erg s-1 and are (insignificantly) fading for VT J2012 and brightening for VT J1008. We will discuss the line profiles in more detail later in this section, but note here that the Balmer lines from both objects have widths km s-1.
He II, and He I lines are strongly detected from VT J1008, and all have luminosities erg s-1 and FWHM km s-1. The lines are brightening with time. The He II line is faintly detected from VT J2012 at a similar width and with a redshift consistent with that of the Balmer emission, although such a component is not detected in the second observation epoch. He I lines are not detected from VT J2012.
Let us assume that these luminosities are entirely produced by recombination in a spherical region. We will discuss a wider range of models in Section 5. With this assumption, we can approximately estimate the mass and volume of the recombining material, following the methodology described in Chapter 13 of Osterbrock & Ferland (2006). The ionized mass is given by
| (1) |
where we have assumed a pure Hydrogen and Helium gas where the Helium density is a tenth of the Hydrogen density and the Helium is equally divided between its two ionization states. Assuming erg s-1 and cm3 s-1, appropriate for case B recombination, we find an ionized gas mass . Note that this analysis is not correct at very high densities , but we include the results to give a rough sense of the expected ionized gas mass. These mass constraints corresponds to radii , assuming a filling factor . Based on the observed variation in the line luminosities and profiles on timescales days, we expect that the emitting region has a size cm, implying cm-3. As we will discuss in detail later, if this gas is stellar debris from a TDE with a star, we require a high density in order that the ionized gas mass be smaller than the stellar mass. Even with that requirement, a large fraction of the stellar debris must be contained in this dense emitting region. This corresponds to an emitting radius cm. If the gas is not stellar debris, it could be from the galaxy circumnuclear medium, in which case lower densities are possible.
We can further constrain the physical parameters of the Balmer emitting region using the Balmer decrement. These observed luminosities imply that the Balmer decrements from both transients are remarkably high and are increasing: that of VT J1008 is during the both epochs and that of VT J2012 is in the first epoch and in the second epoch. Typical Balmer decrements from unextincted, low density, photoionized gas are . If we assume the Balmer emission is produced by recombination in a low density gas (e.g., cm-3), the high Balmer decrement implies strong extinction. Assuming photoionized gas with K and a low density cm-3, the color excess is related to the Balmer decrement as
| (2) |
For VT J1008 (VT J2012), this implies mag.
In addition to dust, high densities and radiative transfer effects can increase the Balmer decrement, although considering the latter is beyond the scope of this work. In AGN broad line regions, which have densities cm-3 the decrement is often observed to reach values . We believe it likely that high densities may contribute high Balmer decrements observed here based on the properties of the other observed emission lines.
First, high densities are favored by the detection of the [Fe X] coronal line from VT J1008. Coronal lines are emission lines with extremely high ionization potentials eV, and they are most often observed from AGN. However, coronal lines from AGN always have [Fe X] to [O III] ratios . We observe a ratio , which is unprecedented for AGN. This high ratio placess VT J1008 in the class of extreme coronal line emitters, which we will discuss in the next section. Here, we use the detection of [Fe X] to constrain the physical parameters of the emitting region. Because the width of the [Fe X] line is similar to the Balmer widths, within a factor of a few, we expect that they are coming from the same distance from the central SMBH, so it is plausible that the conditions of the coronal line emitting gas are similar to those of the Balmer emitting gas. We can constrain the density of the coronal line emitting gas using the lack of an [Fe VII] detection. Generally, the [Fe X] coronal line is accompanied by the detection of [Fe VII] transitions, which have a lower ionization potential, and so would be expected to be stronger. One way to suppress [Fe VII] is to invoke high density gas: the [Fe VII] critical density is cm-3, whereas the [Fe X] critical density is cm-3. Alternatively, the [Fe VII] could be suppressed if the ionizing SED is peaked above 250 eV, although we disfavor this possibility given the detection of low ionization potential lines like H and He II with similar FWHM. Thus, the detection of [Fe X] without [Fe VII] suggests that there is high density gas in the intermediate-line emitting region. Since we now are confident that there is cm-3 gas in the vicinity of the Balmer line emitting region, given the similar line widths of the Balmer and coronal lines, it is plausible that the Balmer emitting region is similarly dense. Note that coronal lines are not detected from VT J2012; however, throughout this paper we will adopt the simplifying assumption that both events are produced by similar mechanisms, so we assume that the previous argument holds for VT J2012 and VT J1008.
A high density would also explain the lack of intermediate width Oxygen lines. We detect neither intermediate width [O II] nor [O III] lines from either VT J1008 and VT J2012. Given that the ionizing source is such that we observe both Balmer and [Fe X] lines, we would expect Oxygen lines to be detectable, given the intermediate ionization potentials of these transitions. The [O III] line has a critical density cm-3; thus, high densities would explain the lack of a detection.
Based on the previous arguments, we consider it very likely that the intermediate line emitting region has a density cm-3 and a radius cm.
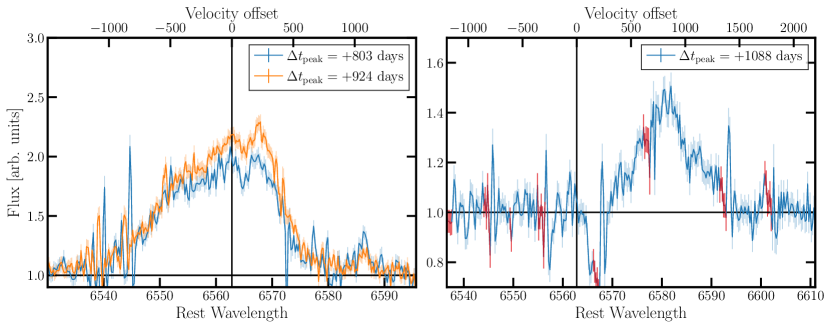
We can further constrain the conditions of the line emitting region using the line profiles. We primarily consider the Balmer line profiles, because these lines are among the brightest. The Balmer line profiles from both objects are asymmetric. The Balmer emission from VT J1008 shows a slightly redshifted peak a long blue tail. VT J2012 shows similarly asymmetric H emission. The observed H emission is narrower and more symmetric, although H is quite faint from VT J2012, so it is possible that the signal-to-noise is affecting our result. In contrast to the Balmer lines from VT J1008, those from VT J2012 are redshifted by km s-1, with no significant evolution in line centroid between epochs.
From the later-time, high resolution spectra, we see that the line profile for VT J1008 shows a broad, flat top, with a long blue tail. In the days between ESI observations, the line profile became slightly more peaked towards the red side. Note that the apparent brightening may not be real the flux is continuum-normalized, but the continuum level is expected to be different in the two observations because the slit orientations were different. In contrast to that of VT J1008, the line profile for VT J2012 is peaked and symmetric.
Based on these line profiles, the emitting region must be aspherical and, in the case of VT J2012, flowing away from the observer.
In summary, VT J1008 and VT J2012 show transient, intermediate width ( km s-1) Balmer, He II, He I, and [Fe X] emission. Based on the observed luminosities and line profiles, we consider it likely that the emission is arising from a dense ( cm-3), compact ( cm), aspherical, outflowing emitting region.
4.3 Comparison to published TDE observations
In the rest of this section, we compare the observed emission lines to observations of published transients. We first compare these objects to TDEs. In the next section, we discuss coronal-line emitting transients, some of which are TDEs and some of which are of ambiguous origin. Then, we compare to non-TDE transients. In this section, because we aim to compare to previous TDEs, we will focus on those lines that have been studied in published TDEs; namely, we focus on the Hydrogen and Helium lines.
We begin by discussing the Hydrogen and Helium lines. Optically-detected TDEs are well-established to produce these transient spectral features. These TDEs can be divided into four classes based on their early time ( month post-optical flare): (1) Hydrogen rich TDEs, which should broad km s-1 Balmer features; (2) Hydrogen and Helium TDEs, which show km s-1 Balmer features and a complex of emission lines near He II, typically including N III and N III ; (3) Helium TDEs, which show only a broad ( km s-1) He II line; and, (4) featureless TDEs, which show no transient spectral features and have brighter optical flares and, typically, higher redshift host galaxies relative to those of the former three TDE classes.
Our events would appear to most closely resemble the Hydrogen and Helium TDEs based on the detection of both Balmer and He II lines. However, there are many differences between our observed lines and those observed from Hydrogen and Helium TDEs. First, we do not observe N III lines. The N III lines are expected to be produced by the Bowen flourescence mechanism, which only operates under specific physical conditions. It is feasible that, at late times, it is not able to operate.
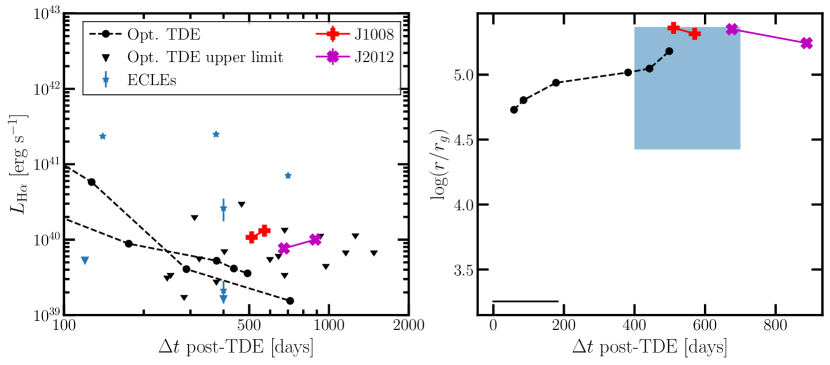
Our observed lines also differ from typical TDEs because of their high luminosities and narrow widths. These are highlighted in Figure 5. The left panel of this figure shows the evolution of H width and luminosity for a sample of optically-selected TDEs. The luminosities of our lines are both erg s-1, and are brightening with time years post-TDE. Very few other optically-detected TDEs have detectable H at such late times: most of the available upper limits are at or below the luminosity detected from our events. The TDEs ASASSN 14li and ASASSN 14ae both have H detections days post-TDE, but the observed luminosities are at least a factor of a few fainter than those from our TDEs, and they both show declining H luminosities whereas our events are brightening.
The right panel of Figure 5 shows the gravitational radius in units of Schwarzschild radii of the H emitting region for our TDEs, ASASSN-14li, and the typical early-time optically-selected TDE. We calculate this radius from the FWHM of the lines as . For the typical early-time optically-selected TDE, we assume km s-1. The H lines from our TDE are much broader than those from ASASSN 14li and those from early-time observations of optically-selected TDEs. Our TDEs have , and the radius is decreasing. The typical optically-selected TDE has . ASASSN 14li has at days post-TDE, although the radius is increasing and it is possible it evolved to match our events after the last observations.
In summary, the lines from our TDEs most closely match those from the Hydrogen+Helium TDE class. However, they are significantly brighter and narrower than any previously observed TDE.
4.4 Comparison to coronal-line emitting transients
There have been a few bona-fide TDEs and a growing sample of ambiguous transients with strong coronal line emission, like that observed from VT J1008. These objects are typically referred to as the extreme coronal line emitters (ECLEs). The first known ECLE, SDSS J0952+2143, was discovered by Komossa et al. (2008, 2009) in a search for galaxies in SDSS with evolving spectral features. This source was associated with X-ray, optical, IR, and UV flares. There is no radio detection reported, although extensive radio follow-up was not performed. The source showed many transient emission lines, including bright coronal, He II and Balmer features. The coronal lines and He II lines are broad, with FWHM km s-1. The Balmer lines were decomposed into multiple components: a narrow component consistent with the host galaxy dispersion and redshift, a redshifted broad component, and two unresolved horns on either side of the rest-frame component. The redshifted, broad Hcomponent had a velocity offset of km s-1, a FWHM km s-1, and a luminosity erg s-1. The redshifted, broad Hcomponent had similar parameters, but with a luminosity implying a Balmer decrement . Both Balmer lines were first detected year after the associated optical flare and remained bright -post optical flare, although they faded in that time.
The cause of this transient emission is unknown. The event could be a TDE, but it also consistent with a supernova with extreme coronal line emission. AGN-like emission lines are detected from the host galaxy, so the emission could also be associated with a flaring AGN. If the source is caused by a TDE, Komossa et al. (2009) argues that the broad lines are likely produced by photoionized stellar debris that has become unbound and forms eccentric streams surrounding the SMBH. They argue that the unresolved, narrow horns are produced by shocks in a neutral medium, but Heng (2010) shows that such a mechanism would require an unreasonable Hydrogen density.
The emission lines from SDSS J0952+2143 are remarkably similar to those observed from VT J1008 and VT J2012, although we do not detect narrow emission at the location of the Balmer lines and the Oxygen lines detected from our sources are much fainter than those from SDSS J0952+2143. We also do not detect multiwavelength flares analogous to those from SDSS J0952+2143. However, it is plausible that some of the differences between our sources and SDSS J0952+2143 could be reconciled by invoking a TDE in a galaxy with pre-existing accretion disk and/or a different line-of-sight.
After the discovery of SDSS J0952+2143, Wang et al. (2012) performed a search for transient coronal-line emitting galaxies in SDSS. They identified a sample of seven non-active galaxies with strong coronal line emission. The host galaxies all had narrow line emission, with six qualifying as BPT H II galaxies and one bordering the LINER and H II regions. Four of the objects showed variations in their optical continua in the months-years before the spectroscopic observations, measured by comparing their SDSS spectral and fiber magnitudes. In five of the seven sources, intermediate width emission lines are detected with FWHM km s-1. The lines were fading in all objects. Broad He II is detected in three objects.
We overlay the luminosities and widths of the H from these ECLEs on the panels in Figure 5. Note that the time since optical flare is very uncertain for these events. We adopted the time between the SDSS spectroscopic and photometric observations for those objects with detected optical flares, and 400 days for those objects without detected optical flares. The broad emission from these events much more closely resembles that from VT J1008 and VT J2012. The primary differences between these ECLEs and our events come from their host galaxies: the Wang et al. (2012) ECLEs and SDSS J0852+2143 show strong nebular emission, whereas are events are in quiescent galaxies. Recent work, however, has suggested that, when considering the full ECLE population, they do tend to have TDE-like host galaxies; i.e., host galaxies that more closely resemble those of VT J1008 and VT J2012.
There is growing evidence that ECLEs are definitive TDEs, primarily based on arguments about the required ionizing flux, the optical light curve shapes for those few events with well-sampled light curves, and the similarities of TDE and ECLE host galaxies (Hinkle et al., 2023). However, most of the known ECLEs are in galaxies with nebular emission lines from the host galaxies, rendering this conclusion uncertain: it is impossible to exclude an AGN origin for these events. We still lack a large sample of bona-fide TDEs with coronal line detections. It is, then, intriguing how closely the multiwavelength, transient properties of ECLEs resemble VT J1008 and VTJ2012, both of which have quiescent hosts, well-sampled optical light curves, and other multiwavelength data that allow us to argue that they are in fact bona-fide TDEs (see Section 5.2).
4.5 Comparison to ambiguous and non-TDE transients
In addition to TDEs and ECLEs, other transients can produce lines similar to those observed here. In particular, our objects resemble some supernovae. In particular, type IIn supernovae have been detected with similar line profiles. For example, SN2012ab is an optically-flaring Type IIn supernovae hosted near the nucleus a spiral galaxy that was discovered by Bilinski et al. (2018). SN2012ab is associated with an intermediate width H component of width km s-1 that is redshifted by km s-1. The intermediate width component was first detected days after the optical flare, alongside a broad H component with FWHM km s-1. The intermediate width component is still detected days post-event. The late-time spectrum is not of sufficiently high signal-to-noise to constrain the presence of a late-time broad component. Bilinski et al. (2018) argues that SN2012ab is a type IIn supernova based on the observed spectral features and the optical light curve. The unusual H emission is caused by interaction with an aspherical circumstellar material. They note that they cannot rule out a TDE origin; however, if the event is a TDE, it would be highly unusual because of the asymmetric material needed to produce the observed emission lines.
Based on the emission lines produced by VT J1008 and VT J2012, we see similar evidence for asphericities as observed for SN 2012ab. In contrast to SN 2012ab, VT J1008 and VT J2012 are hosted by quiescent galaxies. Moreover, no broad H component is detected from our events, although our spectra were taken days post-optical flare, and it is possible that a broad component was present at early times.
4.6 Summary
VT J1008 and VT J2012 are associated with Balmer, Helium, and coronal line emission. The line widths are km s-1, which is much narrower than typical lines detected from optically-selected TDEs. Based on the line parameters, we suggested that the emission comes from a dense cm-3 and compact cm-3 region. The mass of the ionized, recombination line-emitting gas is likely ; i.e., the mass is a large fraction of a solar mass. These emission lines do not resemble those detected from the optically-selected TDE sample. Instead, the observed emission lines most closely resemble those observed from the ambiguous class of ECLEs, which have been proposed, though not confirmed, to be TDEs.
5 Discussion
5.1 Summary
-
•
VT J1008 and VT J2012 are radio-selected transients in the nuclei quiescent, green valley host galaxies. The host galaxies have SMBHs with masses .
-
•
VT J1008 and VT J2012 have optical counterparts, with lightcurves typical of optically-selected TDEs except that they are slightly fainter and cooler at peak. They do not have detectable X-ray or IR counterparts.
-
•
VT J1008 and VT J2012 have radio counterparts with GHz luminosities erg s-1 that have SEDs consistent with wide-angle, low velocity outflows at radii pc.
-
•
VT J1008 and VT J2012 both have transient, intermediate-width Balmer and He II emission detected years post-TDE. Their H luminosities are erg s-1 and are likely increasing. All the lines have FWHM km s-1, and may be broadening slightly with time. VT J1008 also has strong He I and [Fe X] emission with similar line widths.
-
•
The observed transient lines detected from these radio-selected events are reminiscent of Hydrogen+Helium TDEs. However, the lines are much more luminous at late-times than other optically-detected TDEs, and they are narrower than is typically observed from optically-selected TDEs.
-
•
Instead, the observed spectral features more closely resemble the emission lines associated with some extreme coronal line emitters. A subset of these objects are known to have intermediate width lines, in some cases with centroids that are redshifted relative to the host (e.g., J0952+2143).
5.2 Are VT J1008 and VT J2012 tidal disruption events?
Before delving into the origin of the transient emission lines, we briefly consider and rule out the possibility that VT J1008 and VT J2012 are not tidal disruption events. The three most likely origins for these events are: stellar explosions, active galactic nuclei flares, or TDEs. In the following, we consider each of these possibilities. We assume both events are caused by the same type of event, which is justified given the strong similarities in their multiwavelength properties and host galaxies.
Stellar explosions.
We first consider the possibility that these events are stellar explosions. Supernovae can produce radio-loud events with optical flares and transient optical spectral lines. However, the only type of supernovae that has been observed to produce radio outflows with velocities , as observed for our events, are SN Ic-BL, so we only consider this type of event to be possible. There are a number of factors that make VT J1008 and VT J2012 unusual for SNe Ic-BLs. First, these events are in the nuclei of their host galaxies: their offsets in units of the host half-light radii are consistent with zero. SNe Ic-BLs tend to lie in the outskirts of their host galaxies, with a median offset relative to host half-light radius of (Japelj et al., 2018). Second, our events are hosted by non-star forming galaxies, whereas SNe Ic-BL hosts tend to be star-forming ( of core-collapse supernovae hosts are quiescent).
The observed optical light curve is very unusual for SN Ic-BL: these SN often, though not always, show rapid post-peak cooling, which is not present for our events (Taddia et al., 2019). While the late time spectra of SN Ic-BL are not well constrained, intermediate width features such as we see are unprecedented (S. Anand, private communication).
While we cannot definitively rule out a SN Ic-BL origin, there are many factors that would make our events extremely unusual. Hence, we do not believe our events are associated with stellar explosions.
Active galactic nuclei flares.
We next consider active galactic nuclei flares. AGN can produce variability and flaring across the electromagnetic timescale and over a wide range of timescales. The main evidence against an AGN origin for VT J1008 and VT J2012 is the lack of any evidence that there was active accretion prior to the optical flare. The optical spectra do not show any evidence for strong AGN emission. It is possible that the weak [O III] detections are caused with an AGN, but it would imply a very weak AGN. Moreover, that line could also be caused by weak star formation. The IR colors of the host galaxy also show no evidence for AGN activity; likewise, the lack of an X-ray detection and the lack of optical variability support the hypothesis that these are quiescent galaxies.
From the above evidence, we disfavor an AGN origin. Of course, none of these arguments completely rule out the possibility of a very weak, flaring AGN. In this case, some trigger has caused a large amount of mass to be dumped on the central SMBH. Such events are extremely poorly understood: it is not clear whether such events could even happen without a discrete object like a star venturing near the SMBH. However, given the broad consistency of our events with TDEs and the large complications associated with interpreting low luminosity AGN flares, we do not consider this possibility further.
Tidal disruption event.
After ruling out AGN flares and stellar explosions, we are left with TDEs. As we have discussed in this work and in Paper I, the host galaxy, optical lightcurves, and radio emission of VT J1008 and VT J2012 are broadly consistent with optically-selected TDEs. Henceforth, we consider these events to be definitive TDEs.
5.3 The origin of the transient spectral features
In the rest of this paper, we discuss the origin of the transient spectral features. We make the strong but necessary assumptions that (1) the ionization source producing the Balmer emission is the same that produces the higher ionization lines and (2) the same emission mechanism is active in both VT J1008 and VT J2012.
5.3.1 Are the lines associated with a shock?
In both VT J1008 and VT J2012, we know that fast outflows exist given the observed radio emission. It is not a far stretch to imagine that the transient emission lines are also associated with a shocking outflow. Shocks can produce emission lines in multiple ways, depending on the shock velocity and medium density. If the shocked gas can cool efficiently, it will produce strong free-free emission that can photoionize the surrounding medium. Otherwise, the shock is “nonradiative” and primarily emits through collisional ionization.
We can determine if a shock is radiative by comparing the age to the cooling time. To compute the cooling time, we need to know the density and the shock velocity . From the shock velocity, we first must compute the shock temperature :
| (3) |
where is the adiabatic index and we adopt . We consider shock velocities in the range km s-1, which approximately match the observed line widths. Slow shocks km s-1 do not produce km s-1 emission lines.
Then, we must compute the cooling rate , which, following Draine (2011), we approximate as
| (4) |
At high densities, such as those we will consider, the cooling rate can be suppressed because collisional de-excitation reduces cooling through heavy elements. However, at the high temperatures we are consider K, cooling through heavy elements in subdominant and this suppression is minimal (Wang et al., 2014), so we do not consider it further.
With these definitions, the cooling time is given by
| (5) |
If the shock has , then the shock is non-radiative if the density cm-3 and km s-1, or if the shock is near-relativistic and has .
With these constraints on the parameter space, we now explore possible emission mechanisms for both radiative and non-radiative shocks. First, we consider a non-radiative shock. In this case, we know that the density is relatively low ( cm-3) if the shock is non-relativistic. One possible emission mechanism comes from an analogy to type IIn supernova, which produce similar velocity shocks but in such low density material ( cm-3). In these events, Balmer emission resembling that which we observe is produce from Balmer dominated shocks, which occur when the pre-shock material is partly neutral. In this case, we can approximate the mass of H emitting atoms as:
| (6) |
Here, is the average H luminosity and is the duration of the H emission. We adopted fiducial values erg s-1 and year, which are likely correct to within an order of magnitude. is the mass of a neutral Hydrogen atom, eV is the energy of an photon, and is the fraction of excited Hydrogen atom that undergo the H transition. If the density of the emitting region is cm-3, then the size of the emitting region must be pc. Assuming a source age of years, the outflow that produced the Balmer dominated shocks must have a velocity km s-1. This value is inconsistent with the width of the observed lines, which is expected to correspond to roughly the velocity of the shock for Balmer dominated shocks. Because of this inconsistency, we do not consider a Balmer dominated shock a feasible cause of the observed emission. However, most modelling of Balmer dominated shocks, on which we base our discussion, assumes low densities applicable to supernova remnants. It is possible that similar shocks in high density environments could have different properties, in which case something similar to a Balmer dominated shock could produce the observed emission. Further exploration of this is beyond the scope of this work.
We now move to the possibility of a radiative shock. In this case, the shock has caused surrounding gas to heat up to K as described earlier, which is cooling quickly via free-free emission. This emission ionizes the surrounding gas, which is likely at a similar density to the shocked, cooling gas ( cm-3). From Equation 4, the cooling rate for gas at a temperature K is erg cm3 s-1. Assuming cm-3 in a region of radius pc, we have a total luminosity of erg s-1. Most of these photons will be Hydrogen- and Helium-ionizing given the high temperature of the free-free emitting region.
In typical models of the emission lines produced by radiative shocks, Oxygen lines (e.g., Allen et al., 2008) are produced. In this case, we would not expect to see Oxygen lines given the high density of the material and the low critical densities of the typical lines. Instead, we would only expect to see recombination lines, such as the observed Balmer and Helium emission, and lines with very high critical densities, such as [Fe X]. The detailed modelling required to constrain this possibility quantitatively is beyond the scope of this paper, but from this qualitative discussion we believe it feasible that the observed emission could be produced by a radiative shock.
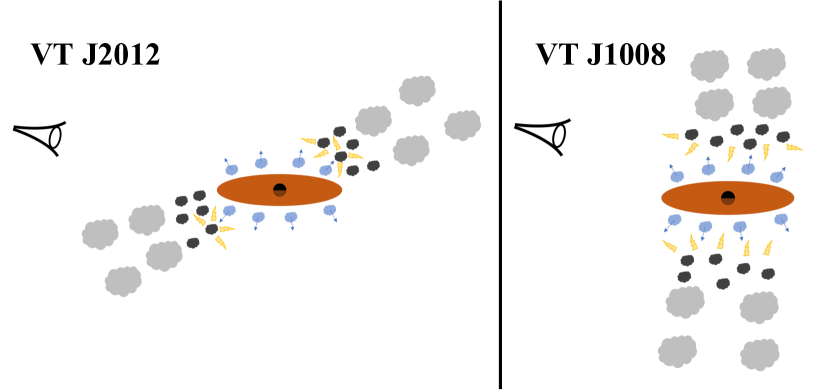
Now that we have established that the observed lines could be produced by a radiative shock, we must consider the centroid offsets from the host redshifts. Discussion of the line profiles is beyond the scope of this work. The intermediate width lines from VT J2012 are redshifted relative to the host galaxy, whereas the lines from VT J1008 are near the host redshift. There are two possible explanations for the line offsets: (1) the SMBH that produces VT J2012 is moving or (2) the emitting gas is outflowing. We are pursuing follow-up to constrain (1) and will consider it in a future paper; here, we consider (2). While it is possible that we do not detect a blueshifted event by chance, with a shock model it is feasible to produce a geometry where only redshifted velocities are possible.
In Figure 6, we show a cartoon of one model that can produce the observed lines (not to scale). First, we suppose that the TDE has produced an accretion disk that is producing disk winds (see Proga, 2007, for possible disk wind launch models). These winds are outflowing, and collide with the circumnuclear medium (CNM) of the galaxy to produce the radiative shocks. While the structure of the CNM is poorly constrained, it is feasible that it is in a torus (or some extended, axisymmetric) structure, as is known to exist in AGN host galaxies. There is no a prior reason that this axisymmetric dust structure need be aligned with the TDE accretion disk: if both the disk and torus orientations are set by the SMBH spin direction, gravitational precession wculd cause it to change relative to when the dusty torus was formed. If the disk orientation is related to the orbit of the disrupted star, it will be independent of the torus orientation. In Figure 6, we show two possible orientations. In the left panel, the torus is inclined relative to the disk, and in the right panel, the disk and torus orientation are perpendicular to each other. In the left panel, the disk wind clouds will tend to collide with the edge of the dusty structure. The clouds that are outflowing away from the observer (redshifted) will be visible, but those flowing towards the observer (blueshifted) are seen through a large column of dust. In the right panel, all of the clouds are visible, but no blueshift or redshift is expected. While this is a cartoon model, and it is unclear whether this dust structure is expected, it could reproduce the observed geometry.
In summary, a radiative shock model invoking an axisymmetric dusty structure misaligned with the TDE accretion disk could reproduce the observed lines, including their widths and offset from host redshift.
5.3.2 Are the lines photoionized by a central source?
If the lines are not associated with the shock, they are likely photoionized by a central source associated with the accretion induced by the TDE, as is observed at early times. The observed lines would thus be the evolved version of the early time lines observed from optically-selected TDEs. This leads to two questions: (1) can the models that produce the early time TDE emission also explain the late-time emission, and (2) why do we detect these lines in these radio-detected, optically-selected TDEs, when they do not seem to be present in most optically-selected TDEs?
The evolution of early-time TDE transient lines is not well explored, but available observations suggest that they tend to fade within year. Before this work, none had been detected above erg s-1 at times year post-optical peak. The only strong detection was from the extensively studied radio-emitting TDE ASASSN 14li, which had an H detection years post-optical peak at a luminosity erg s-1.
The origin of these early-time lines is still debated. Roth & Kasen (2018) presented a model where the lines originate from an extended, optically thick envelope surrounding the SMBH. The envelope reprocesses soft X-ray photons emitted during the accretion of the stellar debris. A percentage of the reprocessed emission produces an optical continuum, corresponding to the observed optical flares. Hydrogen and helium in the envelope become ionized and produce the observed emission lines, but because the envelope is optically thick, the Balmer lines are suppressed relative to the Helium emission. The resulting line profiles were analyzed by Roth & Kasen (2018), who how that an optically-thick envelope will produce km s-1 emission lines due to electron scattering, without requiring high velocity dispersion gas. If the optically-thick envelope is outflowing, the line profile will not be Gaussian but instead will have a blueshifted peak with an extended red wing. With time, the emission lines will narrow as the density decreases and electron scattering reduces. The time evolution of the line luminosities relative to the optical continuum level has not been explored in depth.
Narrower lines may be expected at late times, if the Roth & Kasen (2018) model is correct. The line profiles that we observe, however, do not match those predicted by Roth & Kasen (2018). In the case of stationary gas a symmetric line profile is expected whereas outflowing gas would produce a blueshifted peak with a redshifted tail. In the observations of both VT J1008 and VT J2012, we see a redshifted peak with a blueshifted tail. It is possible that altering the geometry of the envelope could produce the observed emission, but the required modelling is beyond the scope of this work.
Another challenging aspect of a model where the lines are produced by photoionization from a central source is the association with radio emission. There is no reason, a-priori, that we would expect the intermediate width lines to preferentially occur in radio-emitting systems if they are produced by photoionization. One possible explanation is that both these lines and radio-emitting shocks are produced by TDEs with slow accretion rate decays, in which case the photoionizing continuum can remain sufficiently strong at late times to produce the observed emission lines. This explanation is subject to significant theoretical uncertainties; in particular, there is no expectation that events with slower accretion rate decays will tend to cause radio-emission. We also have no direct observational evidence that long-lived TDEs tend to produce radio emission. In Paper I, we saw no significant correlation between the decay of the optical light curve and the presence of radio emission. We do not detect any remarkable X-ray emission from these sources.
Alternatively, we can invoke a gas-rich environment to explain both the radio emission and the spectral features. Such an environment has been invoked for coronal line emitters in the past. Then, the radio detections are caused by shocks in the gas. While this is plausible, it is unclear why this would produce the unusual line profiles that are observed, nor why the emission would be entirely redshifted in the case of VT J2012. Unlike in the case of shock ionization, there is no clear geometry that could produce the observed redshift, unless the SMBH is recoiling or in a binary, which we will constrain in a future paper. This tension becomes stronger if we include events like J0952+2143, which also shows redshifted intermediate width emission. It seems improbable, though not impossible, both of these are TDEs by recoiling or binary SMBHs. Instead, we require dense, rapidly outflowing, asymmetrically-distributed photoionized gas. The gas could be the outflowing stellar debris, but, as we discussed in Section 4, the mass of the ionized gas is a large fraction of a solar mass. Unless these events were caused by the discussion of high mass (a few solar mass) stars, we require that most of the unbound debris remains in a compact region. This is not expected based on current TDE theory.
In summary, while photoionization from a central source is a feasible model, we prefer a shock ionized model. It is possible that detailed models of the evolution of the transient emission lines from TDEs and the dust geometry and kinematics in the circumnuclear medium could reproduce the observed emission, but we do not currently have strong evidence to favor this model.
6 Conclusions
We have presented the multiwavelength properties of two radio-selected TDEs. The TDEs were selected from our sample of six radio-selected, optically-detected TDEs from the VLA Sky Survey. They were the only two TDEs in quiescent galaxies, and they showed unusual, intermediate-width Balmer and Helium emission. These events were otherwise fully consistent with optically-selected TDEs. We discussed the origin of the intermediate width emission lines in detail, and argued that they likely originate from a radiative shock. Alternatively, the lines could originate from outflowing, asymmetric, dense gas in the circumnuclear medium that is photoionized by the TDE, but we marginally disfavor this model.
One of the most intringuing findings in this work is that the transient spectral features observed from these two radio-selected TDEs share many characteristics with those from the ambiguous class of coronal line emitting transients, the ECLEs. This connection provides yet more evidence that ECLEs are caused by TDEs. Moreover, just as early time transient spectral features from TDEs allow the events to be subdivided into classes with different properties, these late-time spectral features may allow for a new TDE classification system: featureless late-time spectra, the extreme coronal line emitters with intermediate width recombination lines, and the extreme coronal line emitters without intermediate width recombination lines. These different classes likely correspond to physically different events; e.g., events with different amounts of circumnuclear material and/or those that do and do not allow for the launch of outflows. In future work, we hope to obtain late-time spectra for a large sample of TDEs, with the aim of further developing classification system and pinning down the physical causes of the late-time emission.
References
- Allen et al. (2008) Allen, M. G., Groves, B. A., Dopita, M. A., Sutherland, R. S., & Kewley, L. J. 2008, ApJS, 178, 20, doi: 10.1086/589652
- Bilinski et al. (2018) Bilinski, C., Smith, N., Williams, G. G., et al. 2018, MNRAS, 475, 1104, doi: 10.1093/mnras/stx3214
- Brown et al. (2017) Brown, J. S., Holoien, T. W. S., Auchettl, K., et al. 2017, MNRAS, 466, 4904, doi: 10.1093/mnras/stx033
- Draine (2011) Draine, B. T. 2011, Physics of the Interstellar and Intergalactic Medium
- Hammerstein et al. (2022) Hammerstein, E., van Velzen, S., Gezari, S., et al. 2022, arXiv e-prints, arXiv:2203.01461. https://arxiv.org/abs/2203.01461
- Heng (2010) Heng, K. 2010, PASA, 27, 23, doi: 10.1071/AS09057
- Hinkle et al. (2023) Hinkle, J. T., Shappee, B. J., & Holoien, T. W. S. 2023, arXiv e-prints, arXiv:2303.05525, doi: 10.48550/arXiv.2303.05525
- Japelj et al. (2018) Japelj, J., Vergani, S. D., Salvaterra, R., et al. 2018, A&A, 617, A105, doi: 10.1051/0004-6361/201833209
- Komossa et al. (2008) Komossa, S., Zhou, H., Wang, T., et al. 2008, ApJ, 678, L13, doi: 10.1086/588281
- Komossa et al. (2009) Komossa, S., Zhou, H., Rau, A., et al. 2009, ApJ, 701, 105, doi: 10.1088/0004-637X/701/1/105
- Kormendy & Ho (2013) Kormendy, J., & Ho, L. C. 2013, ARA&A, 51, 511, doi: 10.1146/annurev-astro-082708-101811
- Lacy et al. (2020) Lacy, M., Baum, S. A., Chandler, C. J., et al. 2020, PASP, 132, 035001, doi: 10.1088/1538-3873/ab63eb
- Osterbrock & Ferland (2006) Osterbrock, D. E., & Ferland, G. J. 2006, Astrophysics of gaseous nebulae and active galactic nuclei
- Proga (2007) Proga, D. 2007, in Astronomical Society of the Pacific Conference Series, Vol. 373, The Central Engine of Active Galactic Nuclei, ed. L. C. Ho & J. W. Wang, 267, doi: 10.48550/arXiv.astro-ph/0701100
- Roth & Kasen (2018) Roth, N., & Kasen, D. 2018, ApJ, 855, 54, doi: 10.3847/1538-4357/aaaec6
- Somalwar et al. (2023a) Somalwar, J., Ravi, V., & others. 2023a
- Somalwar et al. (2021) Somalwar, J. J., Ravi, V., Dong, D., et al. 2021, arXiv e-prints, arXiv:2108.12431. https://arxiv.org/abs/2108.12431
- Somalwar et al. (2023b) Somalwar, J. J., Ravi, V., Dong, D. Z., et al. 2023b, ApJ, 945, 142, doi: 10.3847/1538-4357/acbafc
- Taddia et al. (2019) Taddia, F., Sollerman, J., Fremling, C., et al. 2019, A&A, 621, A71, doi: 10.1051/0004-6361/201834429
- Vazdekis et al. (2010) Vazdekis, A., Sánchez-Blázquez, P., Falcón-Barroso, J., et al. 2010, MNRAS, 404, 1639, doi: 10.1111/j.1365-2966.2010.16407.x
- Wang et al. (2012) Wang, T.-G., Zhou, H.-Y., Komossa, S., et al. 2012, ApJ, 749, 115, doi: 10.1088/0004-637X/749/2/115
- Wang et al. (2014) Wang, Y., Ferland, G. J., Lykins, M. L., et al. 2014, MNRAS, 440, 3100, doi: 10.1093/mnras/stu514
- Yao et al. (2023) Yao, Y., Ravi, V., Gezari, S., et al. 2023, arXiv e-prints, arXiv:2303.06523, doi: 10.48550/arXiv.2303.06523