Observations of a PT-like phase transition and limit cycle oscillations in non-reciprocally coupled optomechanical oscillators levitated in vacuum
Abstract
We explore the collective non-Hermitian dynamics of a pair of non-conservatively coupled optomechanical oscillators. The oscillators consist of silica nanoparticles optically levitated in vacuum in two parallel pairs of interfering counter-propagating laser beams. By adjusting the relative phase, polarization, and separation of the trapping laser beams, we set the optical interaction between the particles to be purely non-reciprocal. Continuously varying the relative power of the trapping beams over a predefined range takes the system through transition, analogous to a parity-time (PT) phase transition. Decreasing the dissipation rate within the non-equilibrium phase induces a Hopf bifurcation resulting in the formation of collective limit cycle oscillations similar to those observed in phonon lasers. Such systems provide a novel platform for exceptional point optomechanical sensing and due to their wide flexibility and tunability of the interactions can be extended to multi-particle systems, paving the way for the development of topological optomechanical media.
I Introduction
The ability of focused laser beams to confine, manipulate, and control the motion of mesoscopic particles under vacuum conditions has turned the field of levitational optomechanics into a powerful tool for addressing crucial questions in the physical sciences, ranging from the macroscopic limits of quantum mechanics to the thermodynamic limits of computation Millen and Stickler (2020); Gonzalez-Ballestero et al. (2021). Of particular significance are the recent achievements of ground state cooling of single Delić et al. (2020) and multiple Piotrowski et al. (2023); Pontin et al. (2023) degrees of freedom of isolated particles. These experiments exploit the potential-like, conservative properties of optical forces, which ensure a base level of dynamic and thermodynamic stability.
However, since light is a flow of momentum, optical forces are intrinsically non-conservative Sukhov and Dogariu (2017). Recent work emphasises this characteristic Li et al. (2021), which appears whenever simple symmetries are broken. Examples include isotropic particles in circularly polarized beams Svak et al. (2018), birefringent or non-spherical particles in linearly or circularly polarized beams Arita et al. (2020, 2023); Hu et al. (2023), and optically interacting particles in beams with phase decoherence Rieser et al. (2022). The forces in these systems can be locally described by a generalized Hooke’s law, having a non-symmetric stiffness matrix, resulting in biased stochastic motion Simpson and Hanna (2010). For sufficiently high driving, or low dissipation, this bias grows until inertial forces overcome attractive forces causing a bifurcation, the formation of a limit cycle oscillation Simpson et al. (2021) and, in multi-particle systems, synchronization Brzobohatý et al. (2023).
These effects can be conveniently situated within the framework of non-Hermitian physics Ashida et al. (2020); El-Ganainy et al. (2018); Feng et al. (2017); Öztürk et al. (2021); Miri and Alù (2019), which is used to describe open systems (that exchange energy with their environments) in both the quantum and classical domains. In the latter case, complex photonic systems have received great attention Feng et al. (2017), with steadily growing interest in mechanical materials Huber (2016); Mao and Lubensky (2018); Brandenbourger et al. (2019). The ever-present effects of viscous drag mean that levitational optomechanics is trivially non-Hermitian. However, dissipative forces alone do not generate the exotic phenomena of interest here. Physical phenomena become more interesting, and applications more plentiful, for systems featuring both gain and loss mechanisms. Of particular interest are non-Hermitian systems with PT symmetry, i.e. those with Hamiltonians that commute with the parity-time () operator. In the quantum domain, such systems constitute a generalization of conventional Hermitian systems, having real-valued spectra, which correspond to observable quantities, without the requirement of being self-adjoint i.e. they describe systems that are intermediate between closed (i.e. isolated) and open (i.e. exchanging energy with their environment) systems Bender and Boettcher (1998). In complex photonic media, and in systems of coupled classical oscillators, this requirement is met by balancing optical gain and loss Özdemir et al. (2019); Bender et al. (2014). Here, we are particularly concerned with a key feature common to PT symmetric systems, the PT phase transition. By continuously varying a parameter controlling the non-Hermiticity, it is sometimes possible to take a system from an equilibrium state, described by eigenvalues that are real and distinct, to a non-equilibrium state for which the eigenvalues are no longer purely real. Firstly, two (or more) real eigenvalues coalesce at an exceptional point (EP). As the non-Hermiticity parameter is varied further, the eigenvalues form a complex conjugate pair, the imaginary parts being connected with non-equilibrium behaviour. In the classical regime, this intriguing effect has been studied extensively for photonic media El-Ganainy et al. (2018), with fewer examples in mechanical oscillators Bender et al. (2013). A comprehensive theoretical study of classical PT symmetric oscillators has been undertaken by Bender et al. Bender et al. (2014, 2013). In analogy with photonic media, the required symmetry is enforced by balancing positive and negative dissipation, and transitional behaviour is induced by tuning the coupling strength Bender et al. (2014).
In many-body systems non-Hermitian properties, exemplified by those outlined above, underpin non-trivial topological effects such as the non-Hermitian skin effect (NHSE) Zhang et al. (2022a) or time crystallinity Sacha and Zakrzewski (2017); Wilczek (2012); Shapere and Wilczek (2012). Particularly relevant here, is the recent work of Zheludev, demonstrating discrete photonic time crystals Liu et al. (2023), the underlying mechanism for which is rooted in non-reciprocal forces similar to those discussed here Raskatla et al. (2023). In this article, we explore the stochastic dynamics of a pair of optomechanical oscillators with non-reciprocal coupling, optically levitated in vacuum. Although our system does not possess true PT symmetry (even when the weak dissipation is ignored) it exhibits key characteristics of a PT symmetric system. In particular, it undergoes a PT-like transition, in which the system is taken from an equilibrium phase, with real and distinct eigenvalues, into a non-equilibrium phase, associated with complex conjugate eigen values. The main influence of the weak viscosity is to stabilize this latter phase. We probe its stochastic dynamics, observing a Hopf bifurcation which appears as the pressure (and therefore drag) is reduced, and results in the formation of a noisy limit cycle oscillation, involving the collective motion of both particles.
II Results
Our experimental system consists of a parallel pair of counter-propagating (CP) linearly polarized Gaussian optical beams with wavelength nm, and beam waist radius, m, separated by a distance, in the direction. The total trapping power mW is divided into two independent optical traps in a vacuum chamber, which allows us to independently set the trapping stiffness of both traps , see Fig. 1a and Methods. Each counter-propagating beam consists of stacks of interference fringes oriented normally to the beam axes with axial separation , and with transverse circular cross-sections, within which the optical intensity has a Gaussian profile. A silica nanosphere with radius, nm, is confined by optical gradient forces within the middle fringe of each CP beam. Due to the shape of the local intensity distribution, the gradient of the force in the axial direction is much higher than that in transverse directions Liška et al. (2023). When the polarization direction is normal to the beam separation (i.e. parallel to the direction), optical interactions between the spheres are maximized Rieser et al. (2022); Liška et al. (2023), see Fig 1a. The dynamical effects of interest are most conspicuous in the direction in which the mechanical susceptibility is greatest. That is, the vibrational amplitudes are greatest in the direction, with non-equilibrium motion in the direction Rieser et al. (2022) also being present, but with an amplitude suppressed by the higher stiffness. The stochastic motion is qualitatively determined by the linearized Langevin equation, which in time domain is
| (1) |
and its Fourier space image is
| (2) |
where and are the coordinates of the particles in the time and frequency domains respectively and and are the corresponding noise terms, is a stiffness matrix representing the linearised force Svak et al. (2018); Arita et al. (2020) and is the Stokes drag, proportional to pressure in the regime of interest. A thorough analysis of the general form of the stiffness matrix, , in both the dipole approximation and Mie regimes, describing conservative and non-conservative contributions, and their variation with optical power distribution and overall trap geometry is provided in Supplementary Note 2.
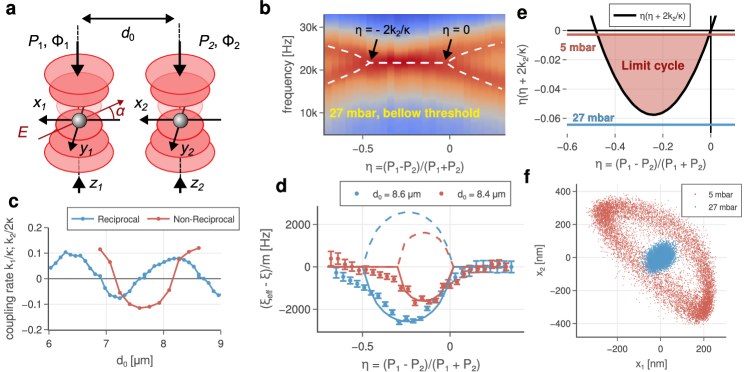
For the current purposes, we adjust the spacing between the traps to suppress the conservative contribution to the stiffness (in the experiment this corresponds to a default value of m, see Fig. 1c), and set the relative phase of the beams, , to , maximising the non-conservative coupling Rieser et al. (2022). This leaves a purely non-reciprocal interaction,
| (3) |
Here, the power detuning is , where is the optical power in traps 1 and 2, is the non-reciprocal coupling rate and is the relative optical phase of the beams. Neglecting, for the moment, the small, finite viscous drag, , we can write a Hamiltonian for the system using the anisotropic kinetic energy formalism of Berry and Shukla Berry (2020); Berry and Shukla (2015),
| (4) |
where is the momentum of the first and the second particle and the potential, is,
| (5) |
We note that, under a range of conditions, this formulation can be extended to include non-linear forces, and quantify conserved quantities, see Supplementary Note 6 for more details. It is clear that is not symmetric under the combined operations of parity reflection (P) and time reversal (T),
since the kinetic energy term is invariant with respect to time reversal, , but reverses sign under (in this formulation). Nevertheless, if we temporarily neglect the small viscous drag, we see that the secular equation for the oscillation eigen-frequencies is purely real, although the system is non-Hermitian. Since this is a defining characteristic of PT symmetric systems Bender and Mannheim (2010), we anticipate that our system will behave in similar ways. Under the condition, , the oscillation eigen-frequencies in Eq. (2), are determined by the purely real, secular equation, . The corresponding oscillation eigen-frequencies are,
| (7) |
where , and are the eigenvalues of the power normalized stiffness, ,
| (8) |
Now, when or , the eigenvalues are purely real and degenerate with . Between these EPs, they form a complex conjugate pair, , and outside this range, they are real and distinct. Similarly, the oscillation eigen-frequencies, Eq. (7), are either real and distinct, or form complex conjugate pairs. In the latter case, the imaginary parts of the represent gain or loss, depending on the sign. Positive values of relate to free oscillations in which the motion of the non-conservative force works against the motion of the particles, reducing their kinetic energy so that they spiral into the fixed point at . For , the force drives the particles which increase in kinetic energy and spiral outwards (Supplementary Note 6). These processes should be contrasted with the classical PT symmetric oscillators discussed by Bender et al. Bender et al. (2014), for which the gain and loss mechanisms derive from positive or negative dissipation (i.e. drag). This transitional behaviour is experimentally explored in Figs. 1b-d. Figure 1b, shows the sum of the power spectral densities (PSDs) of the particles, revealing the PT-like transition itself, bounded by the exceptional points (EPs) at and . By measuring the range of between the EPs, and comparing with the oscillation frequencies, we can estimate the coupling constant, , and the trap stiffness, (Supplementary Note 5). A plot of as a function of separation, , is shown in Fig. 1c (red curve), compared with values obtained for the purely reciprocal coupling (blue curve), (Supplementary Note 2) Liška et al. (2023). Figure 1d compares two measures of the effective damping in the system. The continuous and dashed lines show values of evaluated from the measured values of , and the detuning , Eq. (8). The experimental data points show a second estimate of the effective damping, taken from the decay rate of the auto-correlation, see Fig. 1d. (Supplementary Note 5). Figures 1e,f demonstrate the stabilizing effect of the viscous drag. When is included in Eq. (2), the oscillation eigen-frequencies are approximately,
| (9) |
see Supplementary Note 4. Now, all of the can remain positive, so that the fixed point remains stable, even when the eigenvalues of the stiffness are complex conjugates. The stability condition with finite viscosity can be written as
| (10) |
This condition is shown graphically in Fig. 1e. For higher pressures, where exceeds the threshold value, the coordinates of the particles fluctuate around the stable fixed point, . As the pressure is lowered, there is an abrupt change, as the inertial forces overcome the gradient forces resulting in a Hopf bifurcation Simpson et al. (2021). The amplitudes of the oscillations grow until non-linearities in the forces permit the formation of stable, self-sustained oscillations, or limit cycles, which combine motions of both particles, see Fig. 1f.
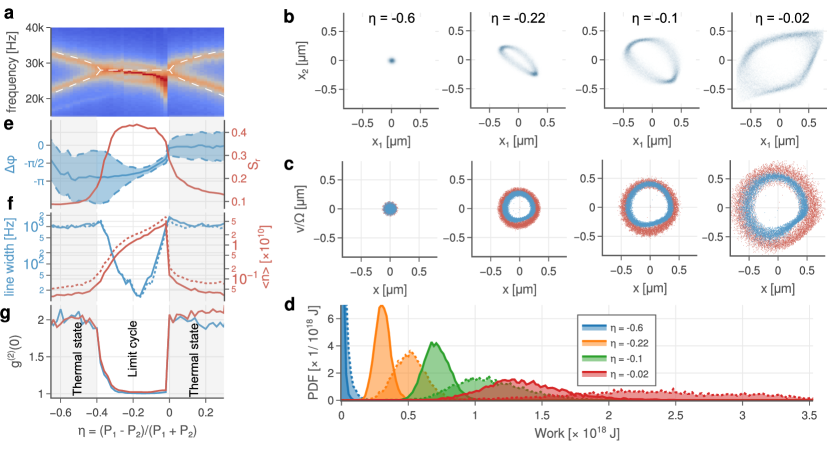
After the Hopf-bifurcation the system exhibits some of the statistical properties characteristic of phonon lasers Kuang et al. (2023); Pettit et al. (2019); Zheng et al. (2023); Vahala et al. (2009); Sharma et al. (2022), i.e. it has a threshold condition for lasing, a narrowing line width and coherent oscillations quantified by the value of the second-order autocorrelation function at zero time delay. We note that the physical mechanisms behind the statistics are fundamentally different. While the phonon laser is excited by a negative dissipation, proportional to velocity, our system is driven by non-conservative Newtonian forces. Figure 2 illustrates the behaviour of our system above threshold, after the Hopf bifurcation (at pressure 5 mbar), following the formation of the noisy limit cycles. In this regime, the oscillation frequencies (shown in the summed PSDs in Fig. 2a) are slightly modified due to the non-linearities in the force that become significant as the oscillation amplitude grows, but retain the topological features they had at higher pressure (Fig. 1b). These limit cycles consist of closed loops in a four dimensional phase space, . Figures 2b,c show sections through this phase space, as the power detuning, , is varied. Although it is challenging to directly measure the optical forces, we can measure the work that they do over the course of a limit cycle. For stability, the work done by the non-conservative optical forces must be balanced, on average, by the energy dissipated into the surrounding gas, i.e.
| (11) |
Figure 2d shows the distribution of this work, , calculated from the trajectories of the particles over one time period . For an ideal system, with perfectly non-reciprocal forces, the energy dissipated by the first particle is the same as that dissipated by the second (Supplementary Note 7). However, small non-idealities in our system result in differential dissipation rates, with the non-conservative force performing more work in one trap than the other. In general, both the dissipated energies and their respective variances increase as approaches the second EP at .
In Figures 2e-g, we probe the statistics of these noisy limit cycle oscillations with several revealing metrics. Figure 2e, shows the relative phase of the oscillations of the particles, which varies from to , across the region of degeneracy, as predicted by the theoretical model (Supplementary Note 3). We also plot the relative Shannon entropy Tass et al. (1998); Brzobohatý et al. (2023). In this context, measures the strength of phase locking between the coupled oscillations, taking values between zero and one, where a value of one indicates perfect locking. Figures 2f,g focus on an analogy between our system and the phonon laser. In Figure 2f, we show the line width of the PSD, decreasing significantly from kHz to Hz. We also show the phonon population, , where is probability density function calculated from the total energy of the particle, i.e. . The oscillatory frequency, , was determined from the fit of autocorrelation function calculated from particle trajectory. The phonon population mainly carries information about the increase of the limit cycle amplitude. We note that this parameter varies gradually across the region of degeneracy, but shows an abrupt transition at the second EP (at ). In the terminology of phonon lasers the second-order auto-correlation is used to characterize the transition from a thermal state () to a coherent one (). In our system we observed a similar transition from thermal state (out of the degeneracy region) to coherent state in the degeneracy region where the limit cycle is stable, see Fig. 2g. Even though the underlying physical mechanisms are fundamentally different, we observe a striking similarity between the stochastic dynamics observed in our system, and that measured for phonon lasers Kuang et al. (2023); Pettit et al. (2019); Zheng et al. (2023).
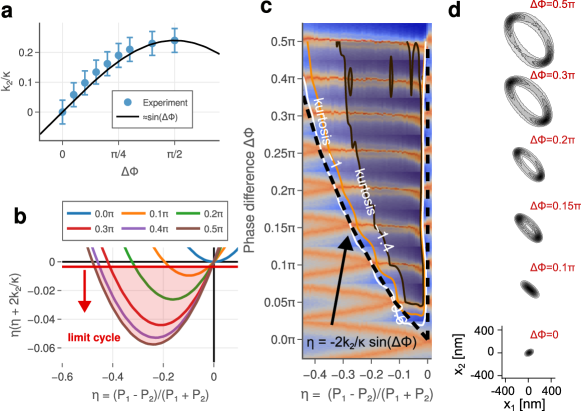
In Figure 3 we demonstrate the extraordinary tunability of our system. We vary the strength of the non-reciprocal coupling. In Fig. 3a, we plot against , revealing a sinusoidal variation, consistent with that predicted by the simple dipole model, Supplementary Note 2. For comparison, Fig. 3b shows the theoretical stability condition for varying . Figure 3c shows the summed PSDs for various values of between 0 and . Also shown on this plot is the excess kurtosis, which has zero value for a normal distribution and negative values about -1 when limit cycles are formed, proving the theoretical prediction given in Fig. 3b. Figure 3d illustrates emergence and expansion of limit cycle for increased phase difference at particular value of power detuning .
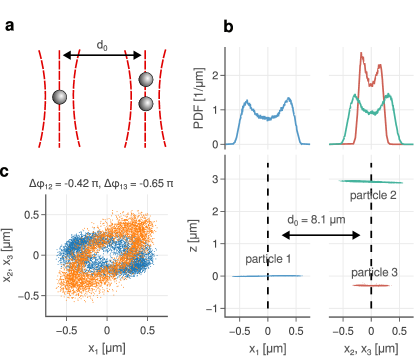
Finally, the CP beams consist of stacks of interference fringes, allowing us to trap multiple particles, with complex, non-reciprocal interactions. Figure 4a shows an example of the two-dimensional configuration of three particles. The two-dimensional position distribution showing both the collective limit cycle of all particles and strong localization of particles in the standing wave in direction is shown in Fig. 4b. Analogically to the system of two particles we show here the collective limit cycle using a combined plot of coordinates, see Fig. 4c. Here, pairs of particles oscillate with stable but different phase delays (see values of ).
III Conclusion
In conclusion, we present a flexible, scalable and reconfigurable optomechanical system capable of the supporting the rich dynamical effects associated with the coupled oscillations of multiple mesoscopic particles having controllable level of non-reciprocal coupling that range from purely conservative to purely non-reciprocal. Here we have focused on a non-reciprocally coupled dimer, later demonstrating an extension of the basic principle to a trimer.
Intriguingly, the dimer system exhibits a PT-like transition without itself possessing PT symmetry. That is, variations in power detuning take the system from an equilibrium phase (connected with real and distinct eigen-values) through a non-equilibrium phase (connected with complex conjugate eigenvalues), before returning to an equilibrium phase. It is revealing to compare our system with a truly PT symmetric system of coupled classical oscillators, e.g. Bender et al. (2014, 2013). For the true PT system, the required symmetry is imposed by a balance of positive and negative dissipation, and the associated phase transition occurs when the coupling between the oscillators is varied. In our system, gain and loss mechanisms arise due to the ways in which different oscillations interact with the non-conservative force: those that move with the force, or are driven by the force, are amplified while those that run counter to the force are damped. By contrast to the true PT system, the transition we observe is induced by tuning the resonant frequencies of the coupled oscillators; the non-reciprocal coupling remains approximately constant. In our system, the non-equilibrium phase is stabilized by the finite viscosity. At higher pressures, it is characterised by biased stochastic motion with fluctuations about a stable fixed point. Reducing the pressure destabilizes the fixed point, precipitating a Hopf bifurcation and the formation of a noisy limit cycle oscillation in which the motions of both particles are combined.
The behaviour of the system is analogous to that of the phonon laser Kuang et al. (2023); Pettit et al. (2019); Zheng et al. (2023); Vahala et al. (2009); Sharma et al. (2022), with the statistics of the excited, non-equilibrium state being very similar, despite differences in the underlying physical mechanisms (i.e. the phenomena we observe derive from non-conservative Newtonian forces, rather than positive and negative dissipation, as before).
Finally, the wide tunability of optical interaction between levitated nanoparticles enables the relatively easy extension to many particle systems, providing a platform for the exploration of higher-order exceptional points with possible sensing applications Hodaei et al. (2017), and the engineering of discrete optomechanical mechanical media with topological properties such as the non-Hermitian skin effect Zhang et al. (2022a, b); Liang et al. (2022); Zou et al. (2021), or even optomechanical time crystals similar to those demonstrated by Zheludev Liu et al. (2023); Raskatla et al. (2023), but levitated in vacuum.
Note: We are aware of similar findings of Reisenbauer et al. Reisenbauer et al. (2023) where the interaction of nanoparticles levitated in optical tweezers in vacuum are investigated along optical axis.
IV Methods
IV.1 Experimental details
IV.1.1 Experimental set-up
A collimated Gaussian beam (vacuum wavelength 1550 nm) propagating from a laser (Koheras Adjustik) was expanded by a telescope (lenses L1 and L2 of focal lengths mm and mm) and projected on a digital micromirror device (DMD, Vialux).
The amplitude mask encoded at the DMD diffracted the beam into the diffraction orders that were used to generate the two counter-propagating trapping beams and to control the phase, distance, and balance of power among optical tweezers. Through our unique DMD-based optical trapping setup we were able to conduct our experiments with high precision and flexibility.
These beams passed through the aperture placed in the focal plane of the lens L3 ( mm) while the zeroth and higher orders were blocked here.
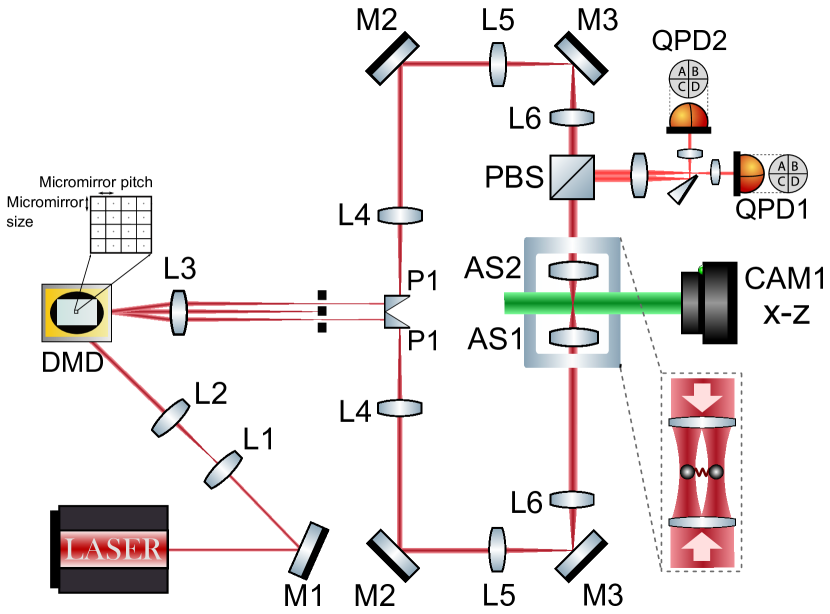
The two transmitted beams were reflected from prisms P1 and collimated by lenses L4 ( mm). These lenses formed telescopes together with the lens L3 and ensured that the DMD and mirrors M2 planes become conjugated. Similarly, telescopes consisting of lenses L5 ( mm) and L6 ( mm) ensured conjugation of mirror M2 planes with the back focal planes of aspheric lenses AS1 ( mm, maximal NA = 0.5). We used Thorlabs achromatic doublets AC254-XXX-C (L1 – L6) and aspheric lenses C240TME-C (AS1) with antireflection coatings and dielectric mirrors BB1-E04 (M1 – M3). AS1 focused the beams inside the vacuum chamber and together with the DMD diffraction patterns provided the total trapping power and the beam waist radii of mW and m, respectively.
IV.1.2 Particles loading
Silica particles (Microparticles, mean diameter 611 nm) were dispersed in isopropyl alcohol and sonicated for min. The suspension was loaded onto the ultrasonic nebulizer (Beurer IH 50) and the formed droplets containing the particles were sprayed into the trapping region in the vacuum chamber. By controlling the concentration and flow rate we ensured the regular loading of two particles into the optical traps. We initially trapped a single nanoparticle within one optical tweezer, then meticulously adjusted the nebulizer’s flow rate to capture a second particle in an additional trap, ensuring that this process did not disrupt the positioning of the first nanoparticle. When evacuating the vacuum chamber, we switched to cross-polarized beams, repositioning the particles into the center of the overlapping beams. Following this, we revert back to a standing wave configuration to ensure the stability of the trapped particles.
IV.1.3 Particles position detection
Two quadrant photo-diodes (Hamamatsu Photonics, G6849) QPD1,2 coupled with a d-shaped edge mirror were used to record independently but synchronously the motion of the particles in plane. This setup allowed us to discern the signal from the two particles separately. The QPDs detected light scattered by the trapped particles and generated signals corresponding to the particle positions. The d-shaped edge mirror enabled the separation of signals from each particle, thereby reducing cross-talk and providing more accurate measurements. The sampling frequency was 400 kHz.
In parallel, the particles were illuminated by an independent laser beam (Coherent Prometheus, vacuum wavelength 532 nm, beam waist radius m, power 5 mW at the sample) which enabled imaging and recording the motion of the particles in plane by a fast fully calibrated CMOS camera (Vision Research Phantom V611, the exposure time and frame rate were set 2 s and 400 kHz, respectively). The low power of the illuminating laser ensured negligible contribution to the net optical force acting on the particles. Typically, 100 000 frames provided sufficiently long trajectories for the analysis of motional dynamics of coupled particles. By comparing the parallel records from the camera and the QPDs we also calibrated the QPDs signals.
The offline tracking of the particle position from the high-speed video recordings was based on the determination of symmetries in the particle images Leite et al. (2018). Briefly, since a spherical particle produces an azimuthally invariant image, we used the shift property of the Fourier transform and looked for the best horizontal and vertical symmetries in the particle image, which provided us with the information about the in-plane and coordinates.
IV.1.4 Coulomb interaction
Each particle is randomly charged. To estimate the magnitude of the Coulomb interaction between the particles we performed charge calibration Magrini et al. (2021); Liška et al. (2023). The typical number of elementary charges on the particles was determined to be less than 100 and thus the magnitude of coupling rate , for Coulomb interaction Rudolph et al. (2022); Rieser et al. (2022) is 3 order of magnitude smaller than that one obtained for optical binding interaction Liška et al. (2023).
V Acknowledgement
The Czech Science Foundation (GF21-19245K); Akademie věd České republiky (Praemium Academiae); Ministerstvo Školství mládeže a tělovýchovy ().
References
- Millen and Stickler (2020) J. Millen and B. A. Stickler, Contemporary Physics 61, 155 (2020).
- Gonzalez-Ballestero et al. (2021) C. Gonzalez-Ballestero, M. Aspelmeyer, L. Novotny, R. Quidant, and O. Romero-Isart, Science 374, eabg3027 (2021).
- Delić et al. (2020) U. Delić, M. Reisenbauer, K. Dare, D. Grass, V. Vuletić, N. Kiesel, and M. Aspelmeyer, Science 367, 892 (2020).
- Piotrowski et al. (2023) J. Piotrowski, D. Windey, J. Vijayan, C. Gonzalez-Ballestero, A. de los Ríos Sommer, N. Meyer, R. Quidant, O. Romero-Isart, R. Reimann, and L. Novotny, Nat. Phys. 19, 1009 (2023).
- Pontin et al. (2023) A. Pontin, H. Fu, M. Toroš, T. S. Monteiro, and P. F. Barker, Nat. Phys. 19, 1003 (2023).
- Sukhov and Dogariu (2017) S. Sukhov and A. Dogariu, Reports on Progress in Physics 80, 112001 (2017).
- Li et al. (2021) X. Li, Y. Liu, Z. Lin, J. Ng, and C. T. Chan, Nat. Commun. 12, 6597 (2021).
- Svak et al. (2018) V. Svak, O. Brzobohatý, M. Šiler, P. Jákl, J. Kaňka, P. Zemánek, and S. H. Simpson, Nature Commun. 9, 5453 (2018).
- Arita et al. (2020) Y. Arita, S. H. Simpson, P. Zemánek, and K. Dholakia, Sci. Advances 6, eaaz9858 (2020).
- Arita et al. (2023) Y. Arita, S. H. Simpson, G. D. Bruce, E. M. Wright, P. Zemánek, and K. Dholakia, Communications Physics 6, 238 (2023).
- Hu et al. (2023) Y. Hu, J. J. Kingsley-Smith, M. Nikkhou, J. A. Sabin, F. J. Rodríguez-Fortuño, X. Xu, and J. Millen, Nature Communications 14, 2638 (2023).
- Rieser et al. (2022) J. Rieser, M. A. Ciampini, H. Rudolph, N. Kiesel, K. Hornberger, B. A. Stickler, M. Aspelmeyer, and U. Delić, Science 377, 987 (2022).
- Simpson and Hanna (2010) S. H. Simpson and S. Hanna, Physical Review E 82, 031141 (2010).
- Simpson et al. (2021) S. H. Simpson, Y. Arita, K. Dholakia, and P. Zemánek, Physical Review A 104, 043518 (2021).
- Brzobohatý et al. (2023) O. Brzobohatý, M. Duchaň, P. Jákl, J. Ježek, M. Šiler, P. Zemánek, and S. H. Simpson, Nat. Commun. 14, 5441 (2023).
- Ashida et al. (2020) Y. Ashida, Z. Gong, and M. Ueda, Advances in Physics 69, 249 (2020).
- El-Ganainy et al. (2018) R. El-Ganainy, K. G. Makris, M. Khajavikhan, Z. H. Musslimani, S. Rotter, and D. N. Christodoulides, Nature Physics 14, 11 (2018).
- Feng et al. (2017) L. Feng, R. El-Ganainy, and L. Ge, Nature Photonics 11, 752 (2017).
- Öztürk et al. (2021) F. E. Öztürk, T. Lappe, G. Hellmann, J. Schmitt, J. Klaers, F. Vewinger, J. Kroha, and M. Weitz, Science 372, 88 (2021).
- Miri and Alù (2019) M.-A. Miri and A. Alù, Science 363, eaar7709 (2019).
- Huber (2016) S. D. Huber, Nature Physics 12, 621 (2016).
- Mao and Lubensky (2018) X. Mao and T. C. Lubensky, Annual Review of Condensed Matter Physics 9, 413 (2018).
- Brandenbourger et al. (2019) M. Brandenbourger, X. Locsin, E. Lerner, and C. Coulais, Nature communications 10, 4608 (2019).
- Bender and Boettcher (1998) C. M. Bender and S. Boettcher, Physical review letters 80, 5243 (1998).
- Özdemir et al. (2019) Ş. K. Özdemir, S. Rotter, F. Nori, and L. Yang, Nature materials 18, 783 (2019).
- Bender et al. (2014) C. M. Bender, M. Gianfreda, and S. Klevansky, Physical Review A 90, 022114 (2014).
- Bender et al. (2013) C. M. Bender, B. K. Berntson, D. Parker, and E. Samuel, American Journal of Physics 81, 173 (2013).
- Zhang et al. (2022a) X. Zhang, T. Zhang, M.-H. Lu, and Y.-F. Chen, Advances in Physics: X 7, 2109431 (2022a).
- Sacha and Zakrzewski (2017) K. Sacha and J. Zakrzewski, Reports on Progress in Physics 81, 016401 (2017).
- Wilczek (2012) F. Wilczek, Physical review letters 109, 160401 (2012).
- Shapere and Wilczek (2012) A. Shapere and F. Wilczek, Physical review letters 109, 160402 (2012).
- Liu et al. (2023) T. Liu, J.-Y. Ou, K. F. MacDonald, and N. I. Zheludev, Nature Physics 19, 1 (2023).
- Raskatla et al. (2023) V. Raskatla, T. Liu, J. Li, K. F. MacDonald, and N. I. Zheludev, (2023), 10.48550/arXiv.2310.10747.
- Liška et al. (2023) V. Liška, T. Zemánková, V. Svak, P. Jákl, J. Ježek, M. Bránecký, S. H. Simpson, P. Zemánek, and O. Brzobohatý, Optica 10, 1203 (2023).
- Berry (2020) M. Berry, Journal of Physics A: Mathematical and Theoretical 53, 415201 (2020).
- Berry and Shukla (2015) M. Berry and P. Shukla, Proceedings of the Royal Society A: Mathematical, Physical and Engineering Sciences 471, 20150002 (2015).
- Bender and Mannheim (2010) C. M. Bender and P. D. Mannheim, Physics Letters A 374, 1616 (2010).
- Kuang et al. (2023) T. Kuang, R. Huang, W. Xiong, Y. Zuo, X. Han, F. Nori, C.-W. Qiu, H. Luo, H. Jing, and G. Xiao, Nat. Phys. 19, 414 (2023).
- Pettit et al. (2019) R. M. Pettit, W. Ge, P. Kumar, D. R. Luntz-Martin, J. T. Schultz, L. P. Neukirch, M. Bhattacharya, and A. N. Vamivakas, Nat. Photonics 13, 402 (2019).
- Zheng et al. (2023) Y. Zheng, L.-H. Liu, X.-D. Chen, G.-C. Guo, and F.-W. Sun, Phys. Rev. Res. 5, 033101 (2023).
- Vahala et al. (2009) K. Vahala, M. Herrmann, S. Knünz, V. Batteiger, G. Saathoff, T. W. Hänsch, and T. Udem, Nature Phys 5, 682 (2009).
- Sharma et al. (2022) S. Sharma, A. Kani, and M. Bhattacharya, Phys. Rev. A 105, 043505 (2022).
- Tass et al. (1998) P. Tass, M. Rosenblum, J. Weule, J. Kurths, A. Pikovsky, J. Volkmann, A. Schnitzler, and H. Freund, Phys. Rev. Lett. 81, 3291 (1998).
- Hodaei et al. (2017) H. Hodaei, A. U. Hassan, S. Wittek, H. Garcia-Gracia, R. El-Ganainy, D. N. Christodoulides, and M. Khajavikhan, Nature 548, 187 (2017).
- Zhang et al. (2022b) K. Zhang, Z. Yang, and C. Fang, Nature communications 13, 2496 (2022b).
- Liang et al. (2022) Q. Liang, D. Xie, Z. Dong, H. Li, H. Li, B. Gadway, W. Yi, and B. Yan, Phys. Rev. Lett. 129, 070401 (2022).
- Zou et al. (2021) D. Zou, T. Chen, W. He, J. Bao, C. H. Lee, H. Sun, and X. Zhang, Nat Commun 12, 7201 (2021).
- Reisenbauer et al. (2023) M. Reisenbauer, H. Rudolph, L. Egyed, K. Hornberger, A. V. Zasedatelev, M. Abuzarli, B. A. Stickler, and U. Delić, (2023), arXiv:2310.02610 [physics.optics] .
- Leite et al. (2018) I. T. Leite, S. Turtaev, X. Jiang, M. Šiler, A. Cuschieri, P. S. J. Russell, and T. Čižmár, Nat. Photon. 12, 33 (2018).
- Magrini et al. (2021) L. Magrini, P. Rosenzweig, C. Bach, A. Deutschmann-Olek, S. G. Hofer, S. Hong, N. Kiesel, A. Kugi, and M. Aspelmeyer, Nature 595, 373 (2021).
- Rudolph et al. (2022) H. Rudolph, U. Delić, M. Aspelmeyer, K. Hornberger, and B. A. Stickler, Phys. Rev. Lett. 129, 193602 (2022).