Interpreting the Value of Flexibility in AC Security-Constrained Transmission Expansion Planning via a Cooperative Game Framework
Abstract
Security-constrained transmission expansion planning (SCTEP) is an inherently complex problem that requires simultaneously solving multiple contingency states of the system (usually corresponding to N-1 security criterion). Existing studies focus on effectively finding optimal solutions; however, single optimal solutions are not sufficient to interpret the value of flexibility (e.g., from energy storage systems) and support system planners in well-informed decision making. In view of planning uncertainties, it is necessary to estimate the contributions of flexibility to various objectives and prioritise the most effective investments. In this regard, this work introduces a SCTEP tool that enables interpreting the value of flexibility in terms of contributions to avoided load curtailment and total expected system cost reduction. Inspired by cooperative game theory, the tool ranks the contributions of flexibility providers and compares them against traditional line reinforcements. This information can be used by system planners to prioritise investments with higher contributions and synergistic capabilities.
Index Terms:
Flexibility, security-constrained optimal power flow, Shapley value, stochastic optimisation, transmission network planning.Submitted to the 23rd Power Systems Computation Conference (PSCC 2024). Corresponding author: Andrey Churkin andrey.churkin@manchester.ac.uk
I Introduction: The Need for Interpretable Security-constrained Planning
Security-constrained transmission expansion planning (SCTEP) is becoming increasingly important as the integration of uncertain renewable energy sources (RES) accelerates [1]. To guarantee cost-effective and reliable (e.g., N-1 secure) operation of future power systems, it is necessary to develop accurate SCTEP models capable of identifying potential congestion and voltage issues and finding optimal investments in assets (such as line reinforcement) and flexibility (energy storage systems, demand response programs, etc.).
Power system planning with N-1 security constraints is an inherently complex problem, as it requires simultaneously solving normal system conditions alongside multiple contingency states. This is recognised by existing security-constrained optimal power flow (SCOPF) literature, as SCOPF models used for verifying the feasibility of network plans for selected contingencies have high computational costs associated with large numbers of variables, nonlinearities and nonconvexities of the optimisation problems [2, 3, 4].
To overcome the above challenges, existing studies focus on simplifying the SCTEP formulation, e.g., via power flow linearisations and metaheuristic algorithms [5, 6, 7]. These models allow system planners to approximate single optimal SCTEP solutions and develop investment portfolios. However, a single optimal solution is not sufficient to interpret the value of flexibility and support well-informed decision making. That is, it is unclear how flexibility providers contribute to the economic efficiency and N-1 security of a system, and how effective they are compared to traditional line reinforcement. Without this information, system planners cannot prioritise investment options (to deploy first the solutions that bring more value) and analyse their potential synergies. Prioritising investments becomes especially important in multi-stage planning, where uncertainties from later stages or years can compromise the adequacy of the planning decisions being made now.
In this regard, this work introduces an open-source SCTEP tool for interpreting the value of flexibility:
https://github.com/AndreyChurkin/iSCTEP/
The tool enables interpreting the value of flexibility in terms of contributions to avoided load curtailment and total expected system cost reduction. Inspired by cooperative game theory [8], the tool ranks the contributions of flexibility providers and compares them against traditional line reinforcements. This information allows system planners to prioritise investments with higher contributions and synergistic capabilities, i.e., the largest contributions in combination with other investments.
Specifically, the tool formulates a cooperative game among selected investment options (line reinforcements and flexibility providers) and iteratively solves a SCTEP model to estimate the value of investments in different coalitions (combinations of investments). The planning model is based on an exact nonlinear stochastic AC SCOPF formulation, adapted from previous work [4], which enables finding accurate AC-feasible solutions for multiple post-contingency states and incorporating uncertainties from RES. Then, marginal contributions of investments to coalitions are estimated and the Shapley value, a popular valuation concept from cooperative game theory [8], is computed to provide a single-valued estimation of the usefulness of investments. As demonstrated through simulations in Section III, cooperative game theory provides a natural framework for analysis of investment options in the SCTEP problem, giving unique insights into the contributions of investments and their synergistic capability.
Similar coalitional analyses and Shapley value applications have been done in power systems research. In [9], solution concepts from cooperative game theory were applied for the identification of critical parameters affecting power system small-disturbance stability. In [10], the Shapley value was used to estimate the impact of various components of flexible multi-energy systems on their reliability. In [11], the usefulness of the Shapley value was demonstrated for estimating the criticality of flexibility providers in active distribution networks. In [12], cooperative game theory was applied to rank the usefulness of fast-ramping flexibility providers in transmission expansion planning. Even though exploring a similar flexibility valuation concept, study [12] is different from current work, as it: 1) relies on a linear optimisation model, 2) does not consider contingencies, and 3) does not compare investment in flexibility against line reinforcement options.
The usefulness of the Shapley value has also been recognised beyond power systems research. For example, it has been demonstrated that the Shapley value and its approximations can be used to effectively interpret machine learning models and solve data valuation problems [13, 14]. Similar to the SCTEP problem, complex machine learning models, typically formulated as black-box models, can provide a single solution to a classification or prediction problem. However, a single solution is not enough to interpret the outcome of the learning model and the value of the input data and its features. Therefore, interpretable machine learning models based on the Shapley value are getting increasing attention.
This work combines recent advances in SCOPF and SCTEP modelling and concepts from interpretable models (using cooperative game theory) and makes the following contributions:
-
•
A new SCTEP planning tool is developed for interpreting the value of flexibility in terms of contributions to avoided load curtailment and total expected system cost reduction via the coalitional analysis of investment options, allowing system planners to prioritise investments with higher contributions and synergistic capabilities. To the authors’ knowledge, no such analysis has been performed in the context of SCTEP. Compared to relevant studies, such as [12], the developed tool is based on the exact nonlinear stochastic AC SCOPF formulation, adapted from [4].
-
•
The proposed cooperative game formulation considers investment options as players, which enables comparing the value of flexibility against traditional line reinforcement. In contrast to works such as [9, 10], the tool not only identifies critical system components and contingencies but also suggests investments that effectively deal with potential system operation problems.
The proposed SCTEP tool is demonstrated with a simple 5-bus system and a realistic 30-bus UK electricity transmission system. The performed coalitional analysis for the selected investment options provides the following findings:
-
•
Investments in flexibility and line reinforcement offer vastly different values depending on the objectives of the system planner. Flexibility providers consistently reduce load curtailment in many coalitions, as they can directly reduce peak load demand at specific locations. Line reinforcements tend to offer lower costs by facilitating the transfer of power from cheaper generators.
-
•
Individual contributions of investment options cannot always be used to correctly estimate the entire range of possible contributions. That is, traditional sensitivity analyses (exclusion of certain investments) can lead to an incorrect assessment of the investment’s value and synergistic capability. A thorough coalitional analysis is required to prioritise investment options.
II Modelling Framework: Coalitional Analysis for the SCTEP Problem
This section first introduces the SCTEP problem formulation as a nonlinear optimisation model and defines the objective functions used to assess the planning solutions. Then, a cooperative game among investments is formulated to interpret their value and identify investments with the highest contributions to the selected objectives.
II-A SCTEP Formulation
A nonlinear stochastic AC SCOPF model, originally introduced and tested in [4], is adapted in this work to develop the SCTEP tool. The SCOPF model is extended by explicitly including planning decision variables: additional line capacities due to reinforcements and capacities of flexibility providers.111Note that investment options are defined as continuous variables (MVA capacity increase for lines and flexibility providers), while in practice these variables are discrete. The inclusion of integer and binary variables will be considered in future research. The complete model formulation is presented in (1a)-(1l), where variables and constraints are defined for each scenario and state of the system . To ease the notation (to avoid duplication of similar constraints), all considered system states are denoted by . Yet, within the tool, indicates the normal operation and indicates contingency states.
Constraints (1c) and (1d) represent active and reactive power balance equations for each node of the system, which include active and reactive power flows defined in (1a) and (1b). In (1e), limits of active and reactive power are defined for each generator . Network operation constraints, congestion and voltages, are imposed in (1f) and (1g). Operation limits of flexibility providers are defined by the set of constraints (1h), (1i). Investments in line reinforcement and flexibility providers are capped with (1j) and (1k). Finally, (1l) defines limits of load curtailment and RES power curtailment. Note that curtailments of RES and loads (and the associated penalties) are introduced to prevent infeasibility of the AC SCOPF model at the system operation stage.
| Variables: (for scenario and state ) | |||||
| Constraints: (for scenario and state ) | |||||
| (1a) | |||||
| (1b) | |||||
| (1c) | |||||
| (1d) | |||||
| (1e) | |||||
| (1f) | |||||
| (1g) | |||||
| (1h) | |||||
| (1i) | |||||
| (1j) | |||||
| (1k) | |||||
| (1l) | |||||
Two objective functions are considered in this work for the SCTEP problem formulation. The first objective is the minimisation of load curtailments for all scenarios and states, which corresponds to robust system planning:
| (2) |
The second objective is the minimisation of the total expected system cost:
| (3) |
This objective comprises the cost of generation (given by function ), penalties associated with load curtailment and RES power curtailment, , , cost of flexible power production, , and investments in line reinforcement and flexibility providers (with levelised costs and ). The probability of occurrence of scenario for state is given by . In the simulations presented in this work, for simplicity reasons, all scenarios and contingencies are assumed equiprobable. The probability of a contingency state is assumed to be 0.05 while the normal state has a probability of 0.95.
II-B Coalitional Analysis: Interpreting SCTEP Solutions via Cooperative Game Theory
Cooperative game theory offers a natural framework to analyse the contributions of investment options to the defined objectives [8, 12]. For this purpose, different investments are represented as players jointly contributing to various coalitions (combinations of investments). Specifically, a cooperative game in SCTEP can be formulated as follows:
-
•
is a finite set of players (investment options considered in the STEP problem). A subset of is called a coalition. The largest possible coalition containing all players is called the grand coalition. The collection of all coalitions is denoted by .
-
•
is the characteristic function associating each coalition with a real number , which is a metric describing the value of a coalition.
In this work, the defined objective functions (2) and (II-A) are used to characterise the value of coalitions in terms of maximum load curtailment and total expected system cost. That is, the optimal solution for the SCTEP problem with a coalition of investments , minimised curtailment or minimised expected cost, defines the value of the coalition. Then, the marginal contribution to coalition by player is estimated as the difference in the coalition’s value with and without the player:
| (4) |
By comparing the differences between multiple optimal SCTEP solutions, marginal contributions calculated in (4) represent maximum avoided load curtailment and total expected cost reduction driven by the investments. Analysis of contributions of the investments to all coalitions enables accurately estimating their usefulness and synergistic capabilities, i.e., potential contributions in combination with other investments. As a single-valued estimation of the contributions by player , the Shapley value, the weighted average of player’s marginal contributions to all possible coalitions, can be calculated:
| (5) |
A simplified analysis of coalitions can be done by considering only players’ contributions to the grand coalition and their individual contributions (to coalitions with only one player). That is, a truncated coalitional structure can be considered, for example, to perform the initial screening of investment options and select investments with the highest contributions for more detailed coalitional analysis. This corresponds to the traditional planning approach, where the system planner can perform a sensitivity analysis of the optimal solution by excluding one of the investment options (or excluding all but one investment). However, as will be demonstrated by the simulations, such a simple sensitivity analysis can lead to an incorrect assessment of the investment’s value and its synergistic capability.
III Results and Discussion
This section demonstrates the proposed flexibility valuation approach for two test transmission systems: a 5-bus illustrative network and a 30-bus UK system. For each system, the impacts of investments in line reinforcement and flexibility are analysed in terms of avoided load curtailment and expected system cost reduction. Then, insights into the value of flexibility, coalitional game formulations, and other modelling features are discussed. All simulations have been performed with JuMP 1.11.0 for Julia 1.6.1 language and Ipopt 3.14.4 solver.
III-A Case Study: Illustrative 5-bus System
To illustrate the principles of flexibility valuation in SCTEP, the developed tool is first applied to a simple 5-bus system with 6 lines, as shown by its single-line diagram in Fig. 1. This system has been originally introduced in [3, 4] to test AC SCOPF models. There are three generators, each with a maximum capacity of 1500 MW and 750 MVar, supplying two loads (demand of 1100 MW and 400 MVAr at bus 1 and demand of 500 MW and 200 MVAr at bus 2).
A set of 6 contingencies is considered, corresponding to the tripping of every line (N-1 conditions). The 5-bus system is modified by setting a maximum transmission capacity of 800 MVA for each line, which makes some contingencies binding, i.e., resulting in load curtailment. To avoid potential load curtailment due to contingencies, it is necessary to upgrade the system and solve the SCTEP problem. It is assumed that the system planner has the following investment options: 1) each line can be reinforced by a maximum additional capacity of 100 MVA, as shown by the dashed lines in Fig. 1, 2) flexibility (e.g., energy storage systems) can be built at bus 1 and bus 2, with a maximum capacity of 100 MW. The investment cost for flexibility, , and levelised cost of transmission lines, , are assumed to be 5 €/MWh. Generators have quadratic cost functions as given in [3], with the generator at but 3 being the cheapest one. Flexibility providers are expected to provide power at the price of 30 €/MWh. Penalty cost for load curtailment, , is set at €/MWh.
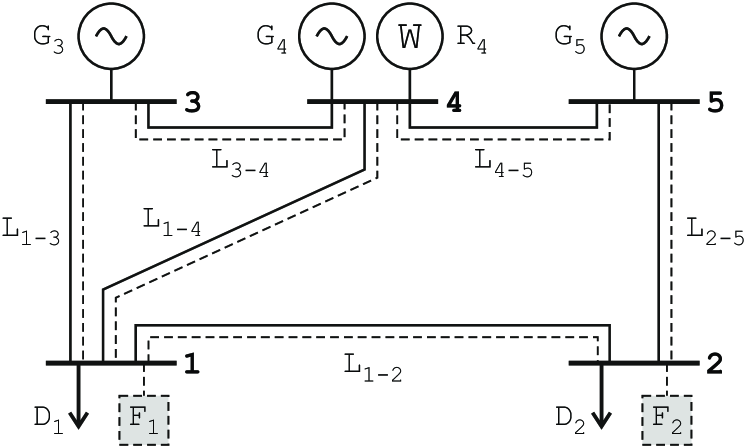
To introduce uncertainties in the system operation, bus 4 is assumed to have RES, a wind farm (denoted by “W”) with a maximum capacity of 500 MW and a generation profile given by two scenarios. The optimal solution to the SCTEP model (1a)-(1l) with cost-minimising objective function (II-A) recommends upgrading lines, 1-3, 1-4, 2-5, and investing in both flexibility providers to their maximum capacities. These investments allow reducing the total expected system cost by 8.5%, from 0.621 to 0.568 mln€/h. However, this solution is not sufficient to interpret the value of flexibility in the considered planning problem. To deal with planning uncertainties, the system planner needs to prioritise the investment options and address the following questions before accepting the optimal expansion plan. How do flexibility providers contribute to avoiding potential load curtailment and reducing the total expected system cost? How effective are flexibility investments compared to line reinforcement? Which investment options jointly contribute to the defined objectives and thus have the highest synergistic capabilities in SCTEP? To address these questions and provide additional information for the system planner, the developed flexibility valuation tool was applied and the coalition analysis of the investment options was performed.
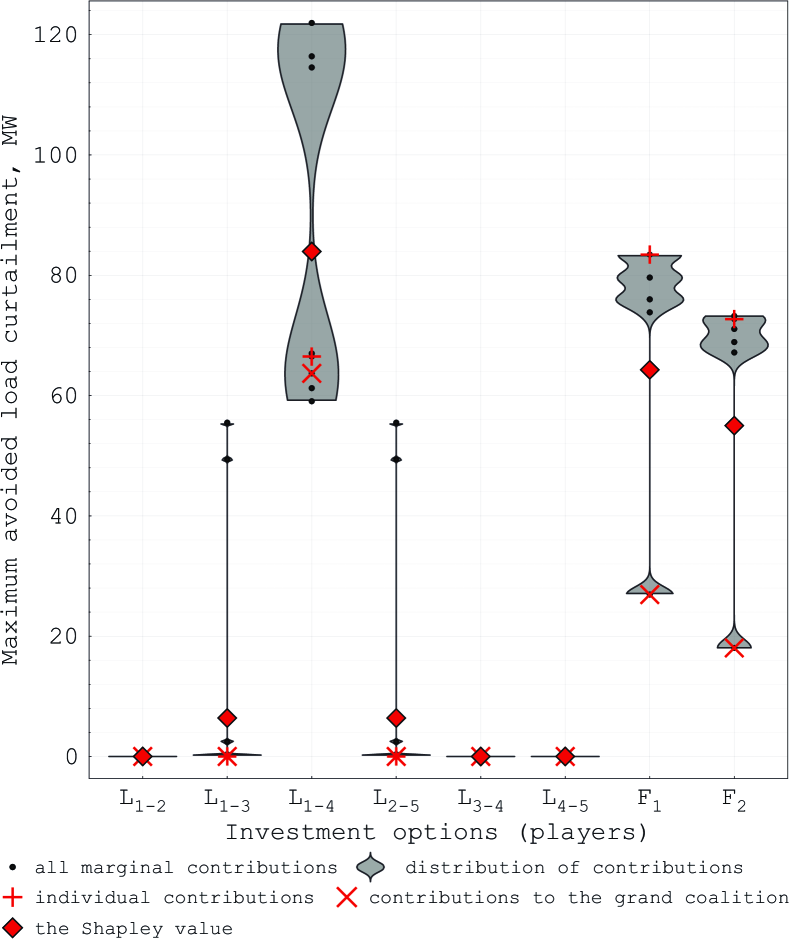
The assumed investment options lead to a cooperative game with 8 players (six line reinforcements and two flexibility providers), which is feasible to analyse by considering a total of coalitions. First, the curtailment-minimising objective function (2) was selected to solve the SCTEP model (1a)-(1l). For each coalition, the maximum avoided load curtailment was estimated to characterise its value. Then, the marginal contributions of players were calculated using (4) and the Shapley value (5) was computed to represent the weighted average contribution to all possible coalitions. The results are presented in Fig. 2 as violin plots showing the distribution of the players’ marginal contributions. As a single-valued estimation of contributions, the Shapley value is displayed by a single point (red diamond marker) for each player.
The performed coalition analysis demonstrates vast differences in the contributions of investment options to the maximum load curtailment. Reinforcements of lines 1-2, 3-4, and 4-5 make no positive contributions, regardless if considered individually or in combination with other investments. Therefore, they can be excluded from the investment portfolio. Lines 1-3 and 2-5 can contribute to avoiding load curtailment, but most of their contributions are low compared to other investment options. Line 1-4 appears to be the best investment option for load curtailment reduction, with the highest synergistic capability, that is, the largest contributions in combination with other investments.222Note that the maximum marginal contribution of line 1-4 exceeds its capacity of 100 MVA. This indicates that this line greatly contributes to other investment options which cannot maximise their curtailment reduction without line 1-4 reinforcement. Flexibility providers at buses 1 and 2 can lead to significant load curtailment reductions and have a similar distribution of their contributions. It can be concluded that, if targeting the maximum load curtailment reduction, line 1-4 should be given priority in the system expansion planning. This justifies the need for a thorough coalitional analysis to prioritise investment options.
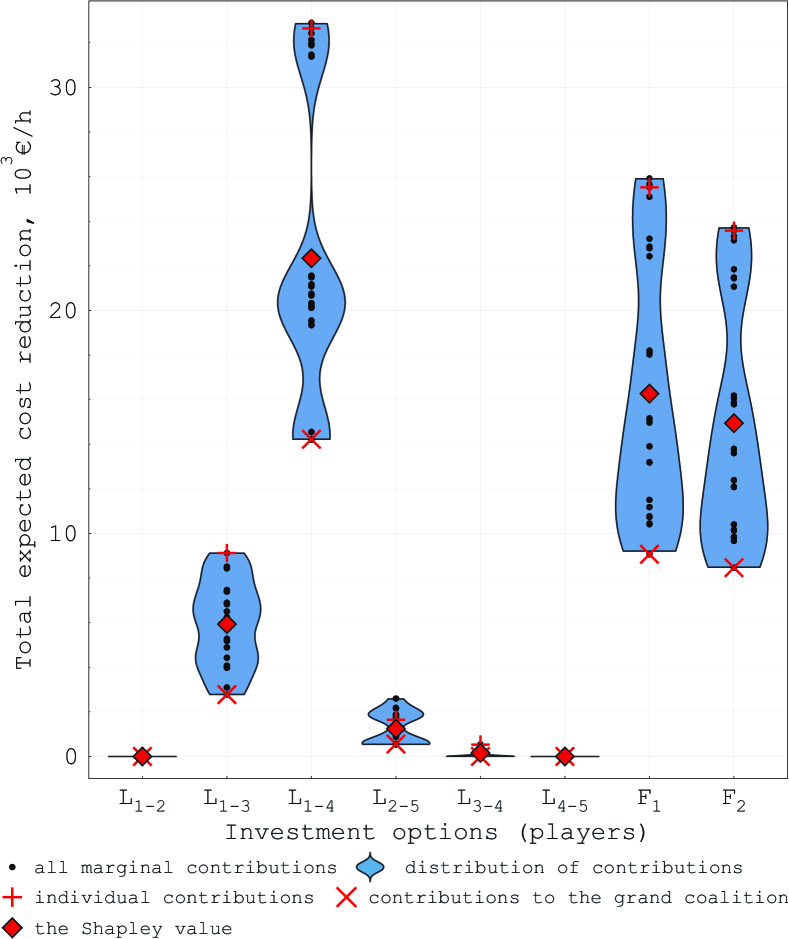
Second, objective function (II-A) was selected to solve the SCTEP model (1a)-(1l) while minimising the total expected system cost. Analysis of the players’ contributions to the expected cost reductions is shown in Fig. 3. Similar to the load curtailment analysis presented in Fig. 2, line 1-4 and flexible units at buses 1 and 2 make the highest contributions, therefore offering the highest synergistic potential. Yet, the distribution of contributions is different as the cost-minimising simulations depend on cost assumptions and minimise both load and wind curtailment, as well as generation and investment costs. For example, line 1-3 makes consistent contributions to the total expected cost reduction by increasing the energy export from the cheap generator at bus 3.
The results illustrate how the value of flexibility in SCTEP can be interpreted as contributions to avoided load curtailment or total expected system cost reduction. Depending on the objective function and cost assumptions, the system planner can prioritise investments with higher synergistic capabilities and make well-informed decisions.
An important aspect of the performed simulations is the analysis of marginal contributions to all possible coalitions. Specifically, the range of all possible contributions is compared with the individual contributions of investments and their contributions to the grand coalition. This demonstrates that a simple sensitivity analysis, which excludes one of the investment options (or all but one investment), can lead to an incorrect assessment of the investment’s value and its synergistic capability. For example, when analysing individual contributions to avoided load curtailment presented in Fig. 2, the system planner may decide that flexibility at bus 1 should be prioritised. Yet, the entire range of contributions and the Shapley value confirm that reinforcement of line 1-4 is the most effective investment. Therefore, it is necessary to perform a thorough coalitional analysis to accurately prioritise investment options.
III-B Case Study: UK Electricity Transmission System
To demonstrate the scalability of the flexibility valuation to larger systems, a simplified transmission system of the UK was selected [15]. This system, representing the UK transmission grid in 2020, has 30 buses, 100 lines, and a total power demand of 57.2 GW and 16.3 GVAr.333Note that the UK system has many parallel lines connecting the same buses. In the SCTEP, only one of the parallel circuits will be considered tripped to simulate contingencies and analyse N-1 security of the system. The system is visualised in Fig. 4 as a graph where the size of nodes represents the nodal demand and the colour scheme indicates the location of generation capacity. A set of 50 contingencies (N-1 criterion) is considered in the SCTEP problem. To analyse a case with potential load curtailment due to contingencies, it is assumed that the planning horizon is 2050, where the total electricity demand will increase by 93% compared to 2020 levels [16]. The total generation capacity is assumed to increase by 54%, which is aligned with the UK’s generation expansion plan in 2035. Thus, the planning problem corresponds to the planning between 2035 and 2050, when investments in line reinforcement and flexibility are needed to meet the growing power demand and guarantee N-1 security of the system.
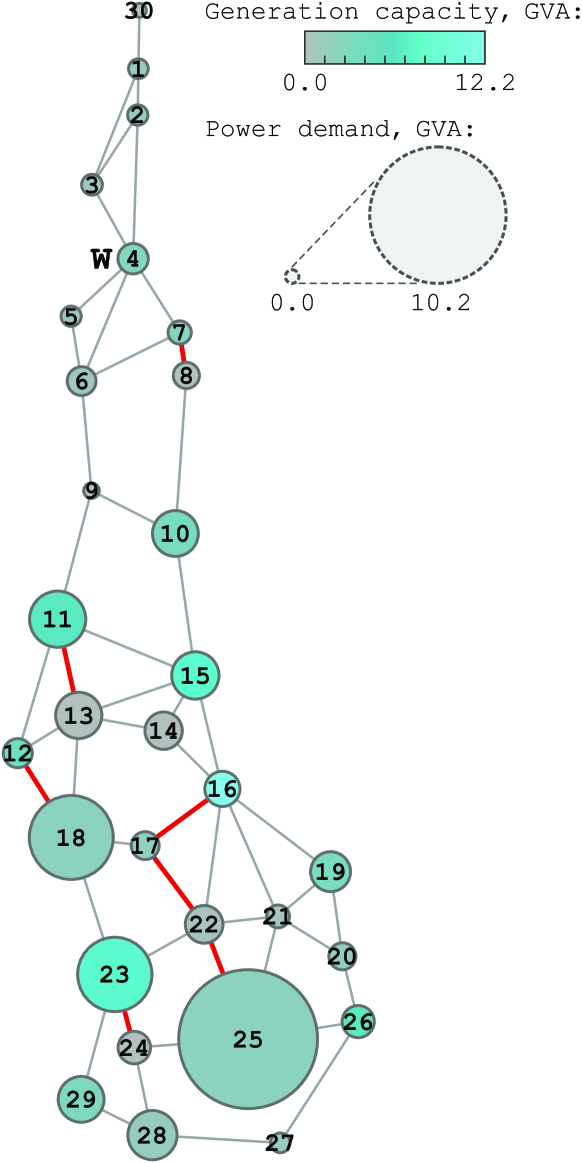
Uncertainties associated with RES operation are introduced by considering 3 GW of wind capacity at bus 4 (denoted by “W”) given by a set of 10 scenarios.444The wind capacity assumption does not correspond to the total forecast wind generation in the UK, which is expected to reach dozens of GW. This assumption allows to demonstrate explicit modelling of uncertain generation in SCTEP, focusing on load curtailment rather than wind curtailment. Similar to the 5-bus system case study, the investment cost for flexibility, , and levelised cost of transmission lines, , are assumed to be 5 €/MWh. Generators have linear cost functions in the range of 1-70 €/MWh. Flexible power price is 30 €/MWh. Penalty cost for load curtailment, , is set at €/MWh.
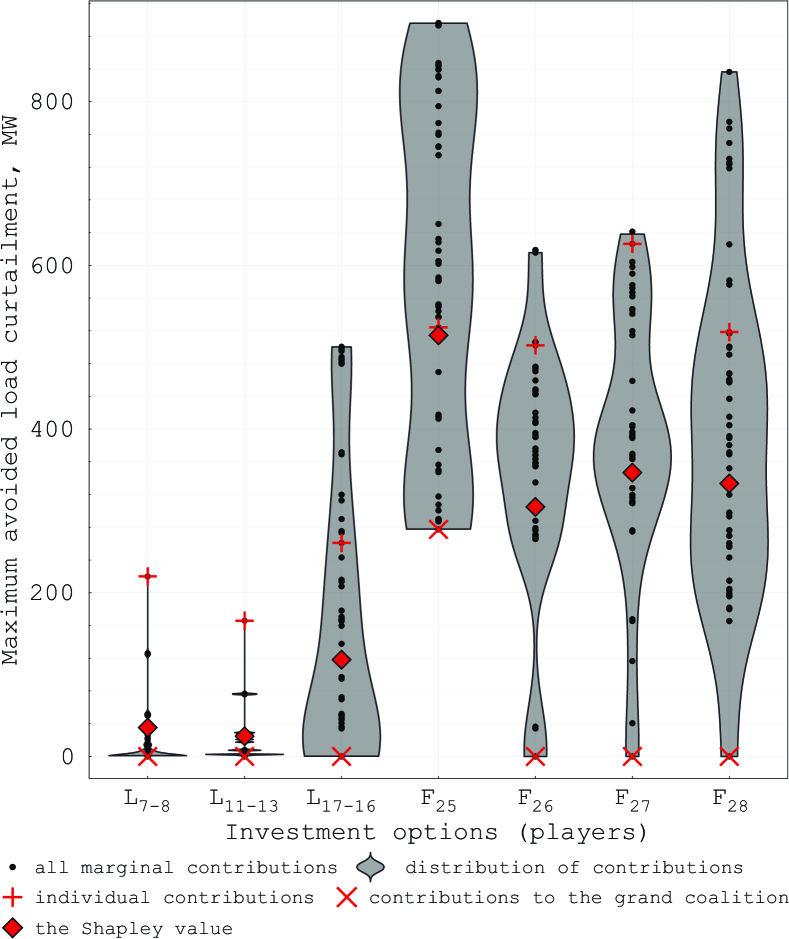
In total, 51 lines are assumed available for reinforcement by a maximum additional capacity of 1000 MVA, and all buses are considered for flexibility investments with a maximum capacity of 1000 MW. This leads to a set of 81 investment options, which are too many for a coalitional analysis. Therefore, a screening of the initial investment options was performed by measuring the individual contributions of these options to maximum avoided load curtailment. That is, SCTEP model (1a)-(1l), (2) was solved for coalitions of one player. Among the line reinforcement options, only three lines, 7-8, 11-13, and 17-16, have positive contributions and therefore are selected for further analysis. All 30 flexibility locations have positive impacts on avoided load curtailment. Among them, the four locations with the highest marginal contributions, buses 25, 26, 27, and 28, are selected. The resulting cooperative game has 7 players and can be solved by analysing coalitions.
Analysis of the marginal contributions to avoided load curtailment for the selected investment options is presented in Fig. 5. It can be concluded that investing in the flexibility provider at bus 25 should be prioritised as this option has the highest synergistic capability to avoid load curtailment. Among the line reinforcements, line 17-16 should be prioritised as it makes consistent positive contributions.
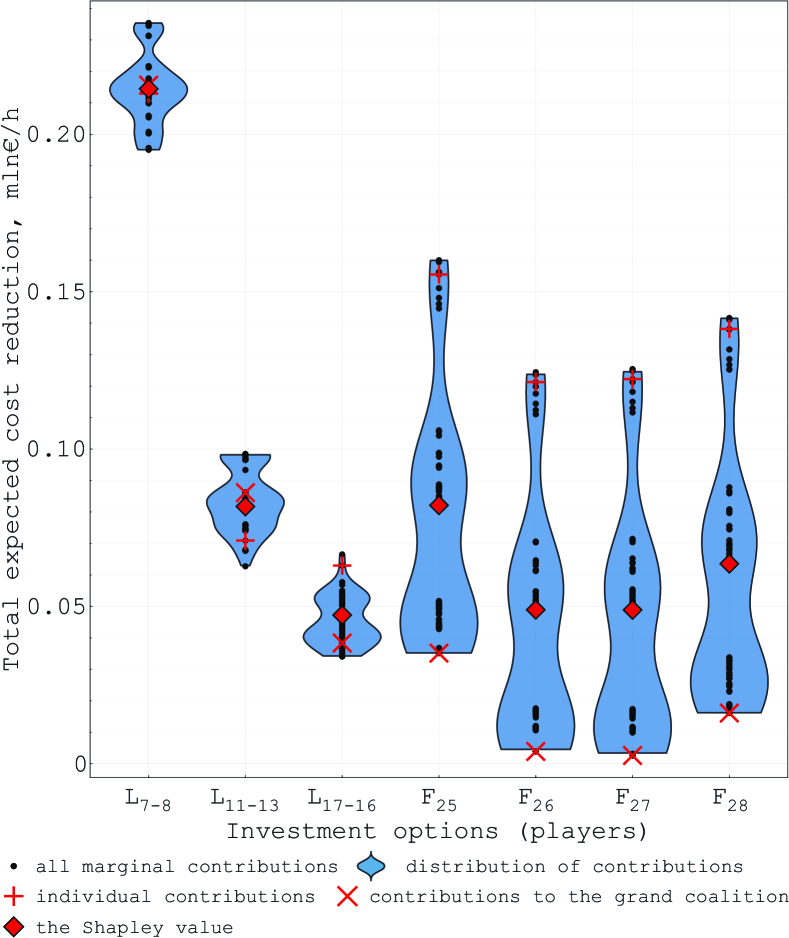
The cost-minimising SCTEP model (1a)-(1l), (II-A) recommends investments in 12 line reinforcements and 8 flexibility providers, with the optimal capacities ranging between 22-1000 MW. The optimal expansion plan allows to reduce the total expected cost by 3%, from 28.6 to 27.7 mln€/h. Analysis of the marginal contributions to the total expected system cost reduction for the selected investment options is presented in Fig. 6. In contrast to the load curtailment analysis, line reinforcement options make more significant contributions in terms of costs. For example, line 7-8 has the highest contributions to the total expected cost reduction since it reduces wind curtailment at bus 4 and enables the transfer of cheaper power from the northern part of the system. It follows that, if focusing on the total expected cost minimisation, the system planner should prioritise reinforcing this line.
III-C Discussion
The developed SCTEP tool enables interpreting the value of flexibility as contributions to avoided load curtailment or total expected system cost reduction and comparing it against line reinforcements. This information allows system planners to prioritise investments with higher contributions and synergistic capabilities. The proposed flexibility valuation approach is not only a post-processing of the optimal SCTEP solution, but a comprehensive analysis of multiple solutions corresponding to various coalitions of investment options. Solving security-constrained problems is known to be computationally expensive for large systems with many scenarios [4]. Therefore, the scalability of the proposed approach is a major limitation, as coalitions have to be simulated to estimate all contributions for the selected investment options.
Nevertheless, there exist two ways to overcome the scalability issue and apply the developed SCTEP tool to large systems. First, as simulations of different coalitions are not interdependent, the process can be greatly parallelised to compute the value of coalitions using multiple cores and processors, thus reducing the computational time for coalition analysis. Second, recent studies on the Shapley value applications have demonstrated that coalitional analysis can be performed accurately enough by considering a strategically selected limited number of coalitions [13, 14, 17]. That is, a truncated coalitional structure can be used to estimate players’ contributions and approximate the Shapley value. Moreover, coalitional analysis can be performed in several stages, where investment options are screened by limiting the number of coalitions. Then, the options with less significant contributions are discarded, and the analysis is repeated for a cooperative game with fewer players.
The aim of this work is to illustrate the concept of flexibility valuation in SCTEP and explain the usefulness of this information for system planning. Therefore, not all the computational aspects have been thoroughly analysed. Future work will further explore the scalability of the developed tool by testing larger systems with multiple uncertainties, including multi-period optimisation with intertemporal constraints and energy storage systems.
IV Conclusion
Accurate N-1 secure planning of future transmission systems is becoming increasingly important as the integration of uncertain RES accelerates. To guarantee reliable and cost-effective system operation, system planners exploit SCTEP models and optimise investments in line reinforcement and flexibility. Being a complex optimisation problem, SCTEP is typically solved once to find the optimal investment strategy. However, a single optimal solution is not sufficient to interpret the value of flexibility in transmission planning and support well-informed decision making.
In this regard, this work introduces a SCTEP tool that enables interpreting the value of flexibility in terms of avoided load curtailment and total expected system cost reduction. Inspired by cooperative game theory, the tool ranks the contributions of flexibility providers in SCTEP and compares them against traditional line reinforcements. This information can be used by system planners to prioritise investments with higher contributions and synergistic capabilities. The proposed flexibility valuation approach is demonstrated for two transmission systems (illustrative 5-bus system and UK’s 30-bus system). It is found that, depending on the objectives considered by the system planner, investments in flexibility and line reinforcement can have vastly different values. Flexibility providers tend to make consistent contributions to avoided load curtailment, while line reinforcement can outperform investments in flexibility in terms of total expected system cost reduction. The distribution analysis of the players’ contributions also showed that individual contributions of investment options cannot always be used to correctly estimate the entire range of possible contributions. That is, a simple sensitivity analysis for traditional planning models (exclusion of certain investments) can lead to an incorrect assessment of the investment’s value and its synergistic capability. This justifies the need for a thorough coalitional analysis to prioritise investment options.
Future work will further investigate the computational aspects and scalability of the proposed approach by considering the Shapley value approximations, testing larger systems with multiple uncertainties, including multi-period optimisation with intertemporal constraints and energy storage systems.
Acknowledgements
The authors would like to thank (i) the European Union’s Horizon 2020 research and innovation programme for their financial support under grant agreement No. 864298 (project ATTEST) and (ii) the UK’s EPSRC for their financial support under grand agreement EP/W019795/1 (project ModFlex).
References
- [1] P. V. Gomes and J. T. Saraiva, “State-of-the-art of transmission expansion planning: A survey from restructuring to renewable and distributed electricity markets,” International Journal of Electrical Power & Energy Systems, vol. 111, pp. 411–424, 2019.
- [2] F. Capitanescu, J. Martinez Ramos, P. Panciatici, D. Kirschen, A. Marano Marcolini, L. Platbrood, and L. Wehenkel, “State-of-the-art, challenges, and future trends in security constrained optimal power flow,” Electric Power Systems Research, vol. 81, no. 8, pp. 1731–1741, 2011.
- [3] F. Capitanescu, Challenges Ahead Risk-Based AC Optimal Power Flow Under Uncertainty for Smart Sustainable Power Systems. Wiley-IEEE Press, 2018, ch. 7, pp. 149–176.
- [4] M. I. Alizadeh, M. Usman, and F. Capitanescu, “Envisioning security control in renewable dominated power systems through stochastic multi-period AC security constrained optimal power flow,” International Journal of Electrical Power & Energy Systems, vol. 139, p. 107992, 2022.
- [5] H. Zhang, V. Vittal, G. T. Heydt, and J. Quintero, “A mixed-integer linear programming approach for multi-stage security-constrained transmission expansion planning,” IEEE Transactions on Power Systems, vol. 27, no. 2, pp. 1125–1133, 2012.
- [6] E. G. Morquecho, S. P. Torres, F. Astudillo-Salinas, C. A. Castro, H. Ergun, and D. V. Hertem, “Security constrained AC dynamic transmission expansion planning considering reactive power requirements,” Electric Power Systems Research, vol. 221, p. 109419, 2023.
- [7] M. I. Alizadeh and F. Capitanescu, “A tractable linearization-based approximated solution methodology to stochastic multi-period AC security-constrained optimal power flow,” IEEE Transactions on Power Systems, pp. 1–13, 2022.
- [8] A. Churkin, J. Bialek, D. Pozo, E. Sauma, and N. Korgin, “Review of Cooperative Game Theory applications in power system expansion planning,” Renewable Sustain. Energy Rev., vol. 145, 2021.
- [9] K. N. Hasan, R. Preece, and J. Milanović, “Application of game theoretic approaches for identification of critical parameters affecting power system small-disturbance stability,” Int. J. Electr. Power Syst., vol. 97, 2018.
- [10] M. Cao, C. Shao, B. Hu, K. Xie, J. Zhou, H. Leng, and W. Zhang, “Reliability tracing of the integrated energy system using the improved Shapley value,” Energy, vol. 260, p. 124997, 2022.
- [11] A. Churkin, W. Kong, J. N. M. Gutierrez, E. A. M. Ceseña, and P. Mancarella, “Tracing, ranking and valuation of aggregated DER flexibility in active distribution networks,” IEEE Transactions on Smart Grid, 2023.
- [12] M. Kristiansen, M. Korpås, and H. G. Svendsen, “A generic framework for power system flexibility analysis using cooperative game theory,” Appl. Energy, vol. 212, 2018.
- [13] R. Jia, D. Dao, B. Wang, F. A. Hubis, N. Hynes, N. M. Gurel, B. Li, C. Zhang, D. Song, and C. Spanos, “Towards efficient data valuation based on the Shapley value,” in AISTATS 2019 - 22nd International Conference on Artificial Intelligence and Statistics, 2020.
- [14] R. Mitchell, J. Cooper, E. Frank, and G. Holmes, “Sampling permutations for Shapley value estimation,” Journal of Machine Learning Research, vol. 23, no. 43, pp. 1–46, 2022.
- [15] E. Martinez-Ceseña and W. Kong, “Simplified electricity transmission system from UK (2020) - ATTEST project data set,” 2022. [Online]. Available: https://doi.org/10.25747/z85s-se29
- [16] National Grid Electricity System Operator, “Future Energy Scenarios,” 2023. [Online]. Available: https://www.nationalgrideso.com/future-energy/future-energy-scenarios/documents
- [17] S. Cremers, V. Robu, P. Zhang, M. Andoni, S. Norbu, and D. Flynn, “Efficient methods for approximating the Shapley value for asset sharing in energy communities,” Applied Energy, vol. 331, p. 120328, 2023.