A JWST survey of the Trapezium Cluster & inner Orion Nebula
We present a near-infrared survey of the Trapezium Cluster and inner Orion Nebula using the NASA/ESA/CSA James Webb Space Telescope. The survey with the NIRCam instrument covers arcminutes ( pc) in twelve wide-, medium-, and narrow-band filters from 1–5 m and is diffraction-limited at all wavelengths, providing a maximum spatial resolution of 0.063 arcsec at 2 m, corresponding to au at Orion. The suite of filters chosen was designed to address a number of scientific questions including the form of the extreme low-mass end of the initial mass function into the planetary-mass range to 1 and below; the nature of ionised and non-ionised circumstellar disks and associated proplyds in the infrared with a similar resolution to prior HST studies; to examine the large fragmented outflow from the embedded BN-KL region at very high resolution and fidelity; and to search for new jets and outflows from young stars in the Trapezium Cluster and the Orion Molecular Cloud 1 behind. In this paper, we present a description of the design of the observational programme, explaining the rationale for the filter set chosen and the telescope and detector modes used to make the survey; the reduction of the data using the JWST pipeline and other tools; the creation of large colour mosaics covering the region; and an overview of the discoveries made in the colour images and in the individual filter mosaics. Highlights include the discovery of large numbers of free-floating planetary-mass candidates with masses as low as 0.6 , a significant fraction of which are in wide binaries; new emission phenomena associated with the explosive outflow from the BN-KL region; and a mysterious “dark absorber” associated with a number of disparate features in the region, but which is seen exclusively in the F115W filter. Further papers will examine those discoveries and others in more detail.
Key Words.:
Telescopes – Surveys – HII regions – Brown dwarfs – Protoplanetary disks – Jets and outflows1 Introduction
The constellation of Orion the Hunter is one of the best-known in the northern winter and southern summer skies and its asterism is instantly recognisable. In more detail, the handle of the sword hanging below Orion’s belt looks nebulous to the naked eye and unsurprisingly drew the attention of the earliest telescopic observers from 1610 onwards, including Galileo, Fabri de Peiresc, Cysat, and Huygens, later notably joined by Parsons and Herschel. The so-called Orion Nebula was seen at its core to have a small group of stars which became known as the Trapezium, and the combined system became the forty second in Messier’s famous list.
Astrophysical studies of the region arguably started with the first photographs (Draper 1880) and spectroscopy (Huggins 1865), revealing a mix of stars and gas which Huggins speculated could indicate “a more advanced state towards the formation of a number of separate bodies, such as exist in our sun and in the stars”. The Orion Nebula became recognised as one of the nearest regions to Earth with massive stars that were likely only a few million years old which illuminate their surroundings, and continued to draw the attention of observers as telescope and instrument technology improved. Detailed photography led to the recognition of a significant number of fainter stars in a roughly 0.3 parsec region around the Trapezium, the so-called Trapezium Cluster (Trumpler 1931; Baade & Minkowski 1937), while early infrared studies of the region revealed a number of bright sources without optical counterparts embedded in the Orion Molecular Cloud 1 (OMC-1) core behind the optical nebula (Becklin & Neugebauer 1967; Kleinmann & Low 1967), sources often collectively referred to as BN-KL, painting a picture of ongoing star formation in the region.
Extensive imaging and spectroscopic studies of the nebular gas and dust have been made over the decades leading to a basic model of the Orion Nebula as an ionised blister on the face of the giant molecular cloud OMC-1, albeit with significant geometric, ionisation, and velocity structure (see Peimbert 1982; O’Dell 2001a, b, for reviews). Conversely, the presence of the bright nebula made detailed studies of the lower-mass young stellar population challenging until the advent of red-sensitive digital detectors and the use of narrow-band filters to suppress the nebular emission lines, making it possible to detect cool low-mass stars through the reddening of the region (Herbig & Terndrup 1986). Later detailed optical imaging photometry and spectroscopy elucidating the mass function and star formation history of the wider Orion Nebula Cluster (ONC) and the inner Trapezium Cluster, both part of the part of the Orion OB1 association (Hillenbrand 1997). Long time-baseline photographic surveys also enabled the study of proper motions of both stars and nebular features (Jones & Walker 1988; van Altena et al. 1988; Walker & Jones 1988).
Near-infrared mapping (Lonsdale et al. 1982), raster scanning (Hyland et al. 1984), and then true imaging with infrared array detectors revealed the full extent of the stellar and brown dwarf population around the Trapezium (McCaughrean 1988; Zinnecker et al. 1993; McCaughrean & Stauffer 1994; Hillenbrand & Carpenter 2000; Lucas & Roche 2000; Lucas et al. 2001; Muench et al. 2002), with subsequent deeper infrared and spectroscopy with the new generation of 8–10 m class telescopes reaching well into the planetary-mass domain, discovering and characterising free-floating objects with masses as low as 3–5 (McCaughrean et al. 2002; Lada et al. 2004; Slesnick et al. 2004; Lucas et al. 2005; Meeus & McCaughrean 2005; Lucas et al. 2006; Riddick et al. 2007; Weights et al. 2008). More recent infrared imaging surveys have also extended well beyond the inner Trapezium and Orion Nebula Clusters, helping place them in the wider context of star formation across the Orion molecular clouds (Megeath et al. 2012; Drass et al. 2016; Meingast et al. 2016; Großschedl et al. 2019), while observations at high-energy wavelengths have provided complementary information on the properties of the stars and their immediate circumstellar environments (e.g., Getman et al. 2005).
The same advancements in infrared technology brought increased insight into to the sources embedded in the molecular cloud behind the Orion Nebula and Trapezium Cluster, OMC-1. The region around BN-KL was gradually resolved into a number of point sources, some only seen at longer thermal-infrared wavelengths (Rieke et al. 1973; Werner et al. 1983; Wynn-Williams et al. 1984; Minchin et al. 1991; Dougados et al. 1993; Gezari et al. 1998; Robberto et al. 2005), accompanied by substantial extended emission. In addition to reflection nebulosity and thermal continuum emission, the detection of significant luminosity in emission lines of molecular hydrogen (Gautier et al. 1976; Beckwith et al. 1978) led to the discovery of a large, explosive outflow system comprising many “fingers” of emission emanating from the core of BN-KL and extending over 90∘ to both the N and W, as well as to the S and E (Taylor et al. 1984; Burton et al. 1991; Allen & Burton 1993; McCaughrean & Mac Low 1997; Kaifu et al. 2000; Bally et al. 2011, 2015). The fingers are also well traced in other molecular lines (e.g., Zapata et al. 2009; Bally et al. 2017), and some extend into the Orion Nebula where they are seen as Herbig-Haro objects (Axon & Taylor 1984; Bally et al. 2000). Embedded infrared point sources and molecular outflows are also seen associated with a secondary cloud core, OMC-1S, roughly 0.2 pc south of BN-KL, another region of considerable interest (Bally et al. 2000; Doi et al. 2002; Zapata et al. 2004; Smith et al. 2004; Getman et al. 2005; Zapata et al. 2005; Robberto et al. 2005; Zapata et al. 2006; Henney et al. 2007; Rivilla et al. 2013).
Another key to the advancement of optical and near-infrared studies of the Orion Nebula and Trapezium Cluster has been the Hubble Space Telescope, launched in April 1990 on STS-31. The first observations of the cluster were made using WF/PC and were impacted by the spherical aberration of the improperly-polished 2.4 m primary mirror (Prosser et al. 1994; O’Dell et al. 1993), limiting the spatial resolution, image quality, and point source sensitivity.
Following the installation of WFPC-2 and its corrective optics during Servicing Mission 1 (SM1) in 1993, however, the inner Orion Nebula and its associated population of young stars could finally be seen with the full diffraction-limited resolution of the telescope. One major finding was the confirmation of the so-called ‘proplyds’ — photoevaporating, externally-ionised circumstellar disks (O’Dell & Wen 1994; Bally et al. 2000) — confirming the essential predictions of prior ground-based optical and radio observations, as well as the aberrated HST images, in spectacular visual detail (Laques & Vidal 1979; Churchwell et al. 1987; Garay et al. 1987; O’Dell et al. 1993). A population of circumstellar disks seen in silhouette against the bright background emission of the Orion Nebula was also discovered (O’Dell & Wen 1994; O’Dell & Wong 1996; McCaughrean & O’Dell 1996; Bally et al. 2000), and many new jets and outflows emanating from the young stars of the region were identified in these surveys (Bally et al. 2000; O’Dell & Henney 2008).
Near-infrared observations of the stellar and substellar population in the inner region and some key objects became possible with the installation of NICMOS during SM2 in 1997 (Luhman et al. 2000; Chen et al. 1998; Throop et al. 2001; Andersen et al. 2011), while further servicing missions and instrument upgrades to HST including ACS (SM3B) and later WFC3 (SM4) lead to public surveys in the optical and near-infrared covering a much larger region, out to arcmin or pc (Da Rio et al. 2009; Robberto et al. 2013). These wide-field HST surveys yielded larger catalogues of ionised and silhouette disks (Ricci et al. 2008), and an extension of the sub-stellar and planetary-mass population detected by HST (Da Rio et al. 2010, 2012), ultimately to roughly the same limit seen in prior ground-based observations (Robberto et al. 2020).
By way of an introduction to our new JWST survey of the inner Orion Nebula and Trapezium Cluster, this is by necessity a very incomplete survey of the vast literature on optical and infrared studies of the nebula, the background molecular cloud, and their associated stellar populations, and the broad and important work done at high-energy, far-infrared, millimetre, and radio wavelengths to understand the region is only briefly mentioned. The reader is referred to the reviews of O’Dell (2001a, b); Bally (2008); O’Dell et al. (2008); Muench et al. (2008) among others for more detail, for how these observations have helped inform our understanding of H II regions, PDR’s, and molecular cloud cores on one hand, and of the properties and evolution of the stellar and sub-stellar content in young star-forming regions on the other.
The remainder of this paper is organised as follows: Section 2 gives a broad overview of JWST and its instrumentation, in particular NIRCam, as a background to the design of our Orion imaging survey observations; Section 3 describes the key scientific questions we wanted to address and how the observational programme was designed to meet them; Section 4 describes the data reduction, photometry, and creation of the large colour composite images presented here; and Sections 5–14 give top-level summaries of some of the features seen in the images and discoveries made from them. More complete analyses and context covering individual topics will be presented in future (e.g., Pearson & McCaughrean 2023, submitted, and others in preparation).
Finally, throughout this paper, we shall assume the distance of pc to the Orion Nebula and Trapezium Cluster recently derived from a Gaia EDR3-based study by Maíz Apellániz et al. (2022), which is excellent agreement with the Gaia DR2 value of pc of Kounkel et al. (2018). These Gaia studies have resulted in a significant revision of the previous radio parallax distance of 414 pc (Menten et al. 2007; Kim et al. 2008) most commonly used in recent literature on the Orion Nebula.
2 JWST and its instruments
The NASA/ESA/CSA JWST is a cryogenic infrared observatory built under the responsibility of prime contractor Northrop-Grumman with Ball Aerospace providing the Optical Telescope Element (OTE) and the Integrated Science Instrument Module (ISIM), under the management of NASA Goddard Space Flight Center, Greenbelt, USA (Gardner et al. 2023). The observatory was launched towards its home in orbit around the Sun-Earth L2 point on an Arianespace Ariane 5 (VA-256) from the Centre Spatiale Guyanais in Kourou, French Guiana, at 12:20UTC on Christmas Day (25 December) in 2021, and is operated by the Space Telescope Science Institute, Baltimore, USA.
The primary mirror comprises 18 hexagonal gold-coated beryllium segments and spans a diameter of approximately 6.5 m. The primary mirror and other optical components of JWST are figured, polished, and aligned to yield diffraction-limited resolution at all wavelengths above 1.1 m, better than the design specification of m (Rigby et al. 2023). Located above Earth’s atmosphere and passively cooled behind its very large deployed sunshield to K, the full near- and mid-infrared wavelength range is accessible without the atmospheric absorption bands that characterise ground-based infrared astronomy and the background flux is reduced far below that experienced by ground-based telescopes due to atmospheric OH airglow, and atmospheric and telescope thermal emission, with JWST’s near-infrared background level set by the zodiacal light in the solar system.
Via the secondary mirror and so-called aft optics, which includes the fine steering mirror, the light collected from astronomical targets is sent to the focal plane in the ISIM and into the entrance apertures of the four science instruments provided by the three space agencies and ESA member states. Three of those instruments collect and analyse light in the far-red optical and near-infrared from 0.6–5.3 m (NIRCam, NIRISS, and NIRSpec), while MIRI covers the mid-infrared range from 4.9–27.9 m.
For the current near-infrared imaging survey of the inner Orion Nebula, only NIRCam was used. Built by The University of Arizona and Lockheed Martin, NIRCam is the workhorse near-infrared imager of JWST and provides a wide range of observational modes spanning scientific imaging, coronography, and low-dispersion spectroscopy for sensing the wavefront of the JWST OTE (Rieke et al. 2023).
Given the critical function provided by the latter mode, considerable redundancy is built in to NIRCam, including the provision of two completely separate camera modules (side A and side B) which can be used simultaneously to observe two adjacent arcmin fields separated by a 44 arcsec intra-module gap.
Because JWST is diffraction-limited, the angular resolution is linearly dependent on the wavelength and thus some optimisation of the pixel scale is needed across the 0.6–5.0 m wavelength range of NIRCam. As a result, within each module the light is split with a dichroic between Short Wavelength (henceforth SW) and Long Wavelength (LW) channels covering 0.6–2.3 m and 2.4–5.0 m, respectively, both of which observe simultaneously.
The SW channel has a nominal pixel scale of 0.031 arcsec, designed to Nyquist sample the 0.063 arcsec diffraction-limited resolution of JWST at 2 m, while the LW channel has a pixel scale of 0.063 arcsec to sample the 0.127 arcsec resolution limit of the telescope at 4 m. Thus to cover the arcmin field of a given module, the LW channel uses a single pixel H2RG array provided by Teledyne Technologies, with the mercury-cadmium-telluride (HgCdTe) detector layer optimised with a wavelength cut-off at 5 m, while the SW channel uses four pixel H2RG array with the HgCdTe material optimised to cut-off at 2.5 m. In the latter case, the detectors are separated by gaps of 4–5 arcsec.
The multi-modular design of NIRCam, with a total of ten H2RG detectors across the two modules and two channels simultaneously observing at two wavelengths across overlapping but non-contiguous fields-of-view has considerable consequences for the design of an observational programme to survey a region larger than the instrument field-of-view, as well as for the subsequent data reduction and analysis. Further constraints and considerations arise due to the minimum read-out and thus integration time of 10.737 seconds when reading out a full NIRCam detector, especially in regions like the Orion Nebula and Trapezium Cluster, has many stars at brightnesses up to magnitude 4 and above, as well as very bright structured nebular emission. In addition, the L2 orbit of JWST and the relatively small semiconductor bandgap of the HgCdTe detectors can yield a significant flux of cosmic ray events.
The Astronomers Proposal Tool (APT) used to design JWST observations provides a number of modes for setting the integration time and non-destructively reading out the NIRCam detectors, for choosing the filters used simultaneously in the SW and LW channels, for rejecting cosmic rays, and for orienting and moving the telescope and/or the fine-steering mirror to cover the inter-detector gaps, the inter-module gaps, and to make a mosaic covering the desired area of the sky. It is also recommended to take multiple images at any given location with small dithers on pixel and sub-pixel levels to further help eliminate bad pixels and fully sample the resolution of the telescope. A further consideration is the overall amount of data being generated as part of the daily JWST downlink allowance, which may also influence the choice of observing mode and scheduling constraints. This is particularly important for NIRCam given the very large data volume that can be generated by reading out ten detectors every 10.7 seconds.
This survey lies squarely in one of the four key pillars identified in the science case for JWST (Gardner et al. 2006), namely the birth of stars and protoplanetary systems. It makes use of several of the core technical capabilities of the observatory, namely the use of a large collecting area and diffraction-limited spatial resolution to detect very faint, very low-mass young brown dwarfs and planetary-mass objects, as well as to examine detailed structures in disks, jets, and outflows. A cryogenic space telescope gives access to key parts of the electromagnetic spectrum either blocked by Earth’s atmosphere or rendered challenging by high sky and thermal background flux.
And although the current survey only uses one of JWST’s four scientific instruments, NIRCam, follow-up spectroscopic observations of the lowest-mass brown dwarfs and planetary-mass objects detected here will be conducted with NIRSpec in JWST Cycle 2 (Programme 2770)111https://www.stsci.edu/jwst/science-execution/program-information?id=2770 . There is of course an excellent case for studies in Orion using MIRI for both imaging and imaging spectroscopy of the deeply embedded star formation associated with OMC-1 and OMC-1S, as well as the driving sources of lower-mass outflows newly revealed below. Conversely, it is worth noting the slitless spectroscopic mode of NIRISS is likely to be significantly compromised by the bright nebulosity of the region, while the originally-planned tuneable filter imager mode would have been ideal for identifying and classifying young low-mass objects via their atmospheric absorption bands, the method used here employing NIRCam imaging instead.
This information helps set the scene for the way we designed our observations for the Orion Nebula, as described in the following section.
3 Programme design
There were three key scientific goals behind this survey which informed the choice of NIRCam filters used:
-
1.
The discovery and initial characterisation of candidate objects at the low-mass end of the brown dwarf regime and into the planetary-mass domain, potentially at 1 and below. At an age of Myr, objects between 1––13 are expected to have effective temperatures of –2520 K (Phillips et al. 2020) and thus have atmospheres similar to older late M, L, and T field dwarfs showing absorption due to water and, at the lower masses and temperatures, methane, allowing them to be identified against a potential population of more distant field stars seen through the molecular cloud. The cooler objects will also radiate most of their bolometric luminosity at longer wavelengths in the NIRCam bands. Other issues are the possibility of infrared excess emission from warm circumstellar material and reddening due to the dust in the parent molecular cloud. These considerations led to the selection of wide-band filters to measure the overall spectral energy distribution from 1–5 m (F115W, F277W, F444W) and groups of medium-band filters in and straddling the atmospheric water and methane absorption features (F140M, F162M, F182M for H2O and F300M, F335M, F360M for CH4).
-
2.
The measurement of the sizes of circumstellar disks seen as silhouettes against the bright background of the nebula at near-infrared wavelengths, for comparison with their sizes in HST images at visible wavelengths, in order to characterise the dust properties. Commensurate with the discovery images made with HST in the H n=3–2 line of ionised hydrogen at 656.3 nm, the best option with JWST is the Paschen- n=4–3 line at 1875 nm or 1.875 m (F187N). The brightness of the nebula in this line, along with the narrowness of the F187N filter, ensures the maximum contrast of dark silhouettes against the background and minimises the continuum flux from the parent stars. In the Pa line, the diffraction-limited spatial resolution of the 6.5 m JWST is 59 milliarcsec, almost identical to the 56 milliarcsec resolution of the 2.4 m HST in the H line.
-
3.
Detailed imaging of the explosive outflow “fingers” from the BN-KL region in OMC-1 behind the Trapezium Cluster to examine structure, excitation, and extinction, along with making proper motion measurements with respect to extant high-resolution ground- and space-based imaging. Also, the intention was to survey for other outflows from young stars and embedded sources in the region. The key emission line tracer for the BN-KL outflow is molecular hydrogen, with ground-based observations generally focussing on the v=1–0 S(1) ro-vibrational line at 2.12 m (F212N), but as a cryogenic telescope above Earth’s atmosphere, JWST also offers narrow-band filters centred on longer-wavelength lines such as the 1–0 O(5) line at 3.23 m (F323N) and the 0–0 S(9) line at 4.69 m (F470N). For this survey, we used F212N and F470N, while knowing that the 3.23 m line also appears in the F335M filter. Similarly, another key tracer of the BN-KL outflow is the forbidden [Fe II] line at 1.64 m, which predominantly appears near the tips of the various fingers. JWST does have a corresponding narrow-band filter (F164N), but here we rely on that line also appearing in the F162M filter, while another [Fe II] line at 1.257 m appears in the F115W filter, as do other key H II region and outflow tracers including the He I line at 1.083 m and Paschen- at 1.282 m. Finally, where flows emerge into the H II region, they can be ionised by the UV radiation field of the central OB stars and will thus be detectable in the F187N filter, among others.
It is worth noting that beyond the core scientific goals elucidated above, the same filter set should permit a wide range of other purposes. As just one example, the F335M filter also covers the bright polycyclic aromatic hydrocarbon (PAH) emission feature at 3.3 m, as is very evident in the data described below, while the F444W filter covers not only the 4.69 m line of H2, but also many lines of CO (1–0) R- and P-branch emission, which is known to be a complementary tracer of young outflows probing different excitation regions (see, e.g., Ray et al. 2023). Thus our survey should have considerable legacy potential.
As NIRCam allows for simultaneous observations in the SW and LW channels, we chose the following six pairs of filter for our survey: F187N + F470N, F212N + F300M, F140M + F335M, F162M + F360M, and F182M + F277W. Central wavelengths, bandwidths, and cut-on/cut-off wavelengths are given in Table 1, along with the nominal integration times outside overlapping and gapped regions, point-source detection limits in low-nebulosity regions, and the utility of the filter in the context of this survey.
| Filter | Pivot | Bandwidth | Blue cut-on | Red cut-off | Integration time | Saturation | Limiting | Purpose |
|---|---|---|---|---|---|---|---|---|
| ( m) | ( m) | ( m) | ( m) | (sec) | magnitude | magnitude | ||
| F115W | 1.154 | 0.225 | 1.013 | 1.282 | 515.365 | 18.1 | 29.2 | Continuum, He I, [Fe II], Pa- |
| F140M | 1.404 | 0.142 | 1.331 | 1.479 | 773.064 | 17.4 | 28.3 | H2O absorption set |
| F162M | 1.626 | 0.168 | 1.542 | 1.713 | 773.064 | 16.8 | 27.5 | H2O absorption set, [Fe II] |
| F182M | 1.845 | 0.238 | 1.722 | 1.968 | 773.064 | 16.6 | 26.3 | H2O absorption set |
| F187N | 1.874 | 0.024 | 1.863 | 1.885 | 773.064 | 15.7 | 25.5 | H+ n=4–3 Pa- |
| F212N | 2.120 | 0.027 | 2.109 | 2.134 | 773.064 | 16.2 | 24.9 | H2 v=1–0 S(1) |
| F277W | 2.786 | 0.672 | 2.423 | 3.132 | 773.064 | 16.4 | 23.6 | Continuum |
| F300M | 2.996 | 0.318 | 2.831 | 3.157 | 773.064 | 16.3 | 23.8 | CH4 absorption set |
| F335M | 3.365 | 0.347 | 3.177 | 3.537 | 773.064 | 15.8 | 23.3 | CH4 absorption set, PAH, H2 v=1–0 O(5) |
| F360M | 3.621 | 0.372 | 3.426 | 3.814 | 773.064 | 15.6 | 22.7 | CH4 absorption set |
| F444W | 4.421 | 1.024 | 3.881 | 4.982 | 515.265 | 14.9 | 22.6 | Continuum, CO (1–0) |
| F470N | 4.707 | 0.051 | 4.683 | 4.733 | 773.064 | 14.3 | 22.0 | H2 v=0–0 S(9) |
3.1 Region surveyed
While the Orion Nebula is very large, with the so-called Extended Orion Nebula or EON covering roughly 0.5∘ or 3.5 pc in diameter, the relatively limited observing time available to a JWST Science Working Group Interdisciplinary Scientist meant that only section of the region could be surveyed at this point.
Nevertheless, the great bulk of the stellar and substellar population of the Trapezium Cluster at the heart of the Orion Nebula is concentrated in and around the arcmin (0.6 pc) diameter Huygens Region, the brightest part of the nebula centred on the Trapezium OB stars. Extending a little further then covers the Huygens Region and the associated Bright Bar and Dark Bay regions to the south-east and east/north-east of the Trapezium, respectively, along with most of the Trapezium Cluster, but also covering the BN-KL region and the full extent of the outflow fingers, and the OMC-1 ridge with the OMC-1S and other embedded sources to the west. The latter ridge also extends to the north towards OMC-2 and contains a plethora of young embedded stars, but will need to be covered in a future survey.
In addition, the quantised nature of the NIRCam field-of-view and the need to come up with a scheme that fills the inter-module and inter-detector gaps while maximising the efficiency of the survey, plus the quantised nature of the NIRCam read-out patterns introduces a series of “steps” in the time needed as the survey expands both spatially and in terms of sensitivity. After experimenting with various possibilities and trading off the additional science versus the time required, we decided to cover a contiguous region that is arcmin in right ascension that is centred E-W along the OMC-1 ridgeline through BN-KL and OMC-1S, and arcmin in declination that is centred N-S just north of the Trapezium, to cover the full extent of the BN-KL outflow to the north and most of the Bright Bar to the south. For reference, the nominal central JWST pointing coordinate for the survey was: 05h 35m 14.1140s, ∘ 23′ 14.45″[] (J2000.0).
Covering this region required a mosaic of NIRCam pointings arranged in 2 columns and 5 rows, with the telescope at a position angle (V3PA) of 270∘, meaning that the columns and rows extended in and , respectively. The overlap between the 5 rows was set at only 2% to ensure maximum E-W coverage while maintaining a small overlap between rows; the spacing between the columns was set to 50% to maximise N-S coverage while filling the inter-module gap222The following parameters were used for the main NIRCam mosaic in APT: Rows = 5, Columns = 2, Row overlap = 2%, Column overlap = 58%, Row shift = , Column shift = 0.5, V3PA = 270∘. .
This scheme was used for five out of the six filter pairs described above. For the F115W + F444W pair, we created a slightly wider mosaic with a 30% overlap between the rows, i.e., a position arrangement333Similarly, the following APT parameters were used for the F115W + F444W mosaic: Rows = 7, Columns = 2, Row overlap = 30%, Column overlap = 58%, Row shift = , Column shift = 0.5, V3PA = 270∘. . The aim here was to deliver good sampling of the stellar field with more overlap, to ensure that a very accurate astrometric registration could be achieved could be built across the various sections of the mosaic, to enable further proper motion studies, for example. As described below, this proved unnecessary for the present work, as a carefully-adjusted selection of Gaia stars delivered a mosaic that is accurate at the arcsec level, but the F115W and F444W mosaics were still used scientifically.
Finally, to cover the small inter-detector gaps, remove bad pixels, and provide some better sampling of the PSF, we used the INTRAMODULEX dithering pattern with 6 dithers for the main survey and 4 dithers for the F115W + F444W pair. No sub-pixel dithering was used. Figure 1 shows a schematic overview of the coverage of NIRCam detector footprints over the region surveyed.
3.2 Integration times
In deciding the integration time to be used, several constraints came into play:
-
•
The predicted fluxes of the faintest targets being sought, i.e., planetary-mass objects at 1 and less, at an age of Myr, and at the distance of the Orion Nebula, in each of the key filters;
-
•
The impact on the sensitivity of the observations given the high and variable brightness of the nebular background on one hand, and the variable reddening seen towards objects at different locations and depths into the background molecular cloud on the other;
-
•
The extreme range of stellar and nebular brightnesses in the region and the desire to avoid saturation as far as possible on targets of interest at the bright end;
-
•
The total amount of time available, balancing the depth at any given location, the area to be surveyed and thus the chances of finding potentially rare objects, and the filters to be used to maximise the scientific return;
-
•
The data downlink budget.
While a range of models have been developed over the years converting the interior and atmospheric properties of brown dwarfs and planetary-mass objects as a function of their evolution into predicted observational fluxes (e.g., D’Antona & Mazzitelli 1994; Chabrier et al. 2000; Baraffe et al. 2003; Marley et al. 2007; Baraffe et al. 2015; Marley et al. 2021; Chabrier et al. 2023), the variable nebular brightness and reddening are harder to account for in a strictly quantitative way, especially in filters without good precursor imaging (e.g., F335M). Therefore we used our pre-existing VLT near-infrared (J, H, & Ks band) imaging of the Orion Nebula and Trapezium Cluster to make approximate adjustments between the predictions of the exposure time calculators (including the JWST ETC) and actual detections of objects down to in Orion, accounting for the increased spatial resolution of JWST (a crucial advantage in pulling faint point sources above the nebula background), the lower sky background seen by JWST, plus rough extrapolations for the likely nebular brightness, the underlying dust reddening law, and so on.
Very crudely, indications were that 1 objects would be detectable through moderate extinction in 10–15 minutes of integration time in the key medium-band filters, with less time required to detect the same point sources in the wide-band filters and reduced sensitivity in the narrow-band filters, although they were primarily intended for extended targets.
However, single exposures of this duration would clearly be impossible in the region, leading to saturation for many stars and substellar objects, as well as on the nebula background over a wide region, plus excessive cosmic ray hits. At the other extreme, using the NIRCam RAPID read-out mode would deliver a new image every 10.737 seconds, the minimum full-frame time, but would quickly overwhelm the JWST Solid State Recorder and the available downlink budget.
Balancing these constraints, we chose to use the sample-up-the-ramp non-destructive read-out modes of NIRCam that measures the charge collected on a pixel every 10.737 seconds until the integration is terminated and the pixel reset. The brightness of the flux arriving at each pixel is calculated from the slope fitted to the sequence of read-outs. With at least three frames, anomalies in the slope can be detected and thus the impact of cosmic rays mitigated. Similarly, if a pixel saturates after several read-outs, a change in slope is seen and the brightness of the source determined by fitting only the unsaturated samples.
To further reduce the data volume, we used the SHALLOW2 read-out mode, which co-adds the first two frames separated by 10.737 seconds (a so-called group), skips three frames, co-adds the next two frames as another group, skips three frames, and so on. In this way, with the first two frames combined into a single group, the minimum integration time would be 21.474 seconds: anything that saturates in that time would be lost. The next group would only be complete after 75.159 seconds, meaning many other objects could become saturated in that time.
However, all of the co-added read-out modes in NIRCam also save and downlink the initial frame, the so-called Frame 0, which yields an effective minimum integration time of 10.737 seconds and thus significantly expands the dynamic range. Anything that is bright enough to saturate in less than 10.737 seconds is lost, but anything that saturates after that is essentially recoverable.
In the end, for the main survey, we used SHALLOW2 mode with three groups (NGRPS = 3), yielding a maximum on-chip integration time of 128.844 seconds. Rather than use a longer sequence of groups and risk saturating more pixels (thus essentially wasting observing time), we elected to dither then start a new integration. For the main survey, we used six dithers and thus the effective integration time at one pointing is 773.064 seconds.
For the F115W + F444W astrometric observations, we used the BRIGHT2 mode, which co-adds sequential pairs of frames without skipping any, and also saves Frame 0. With NGRPS = 6, this also yields 128.844 seconds on-chip and with four dithers, a total integration time of 515.365 seconds
Given our mosaicing scheme as described above, the bulk of the region surveyed then has the full integration time of 773 seconds (or 515 seconds for F115W + F444W), with the exception of a arcmin strip stretching across the whole 11 arcmin E-W region where the integration is doubled thanks to the scheme used to fill the inter-module gap. Conversely, there are narrow strips all over the survey where the integration time is reduced due to the inter-detector gaps, as is also the case along the edges of the mosaic and most notably in the four corners.
Summing over all individual integrations, filter pairs, dithers, and mosaic positions, the total on-source science time for the survey was 12.76 hours.
For the main survey, 480 images were taken for each SW filter (10 mosaic positions 6 dithers 8 detectors) and 120 for each LW filter (10 mosaic positions 6 dithers 2 detectors), yielding 3000 images overall. The F115W + F444W survey yielded a further 560 images (14 mosaic positions 4 dithers 10 detectors), for a combined total of 3560 images.
3.3 Scheduling
Given the distance between the pointings of the survey ( for F115W + F444W), each of the 10 (14) pointings became a separate JWST visit, and despite the use of the SHALLOW2 read-out mode and its reduced data rate, the volume of data produced meant that the visits could not all be scheduled consecutively and were in fact executed over a week. In principle, that could be problematic for photometry of young stars such as those in Orion, since they are well-known to be variable on similar timescales. However, as ten of the twelve filters, including the key medium-band ones, are observed in a single visit, the maximum time between photometry for a single object is nominally only hrs.
Specifying a fixed telescope orientation (V3PA = 270∘) for all of the visits to ensure the maximum area was covered in the allocated time without leaving gaps in the mosaic necessarily constrained the schedulability of the programme. On top of which, as Orion lies within 30∘ of the ecliptic, the windows are quite narrow, just a three weeks in September-October each year, 3 months before the “classical” northern midwinter ground-based observing season for Orion (JWST does not point in the anti-Sun direction but roughly orthogonally to the Sun-Earth-L2 line).
In the end, the observations for this programme444https://www.stsci.edu/jwst/science-execution/program-information?id=1256
were made between 13:39:59UTC on 26
September 2022 and 03:24:08UTC on 2 October 2022555More detailed timings for the individual visits can be found at:
https://www.stsci.edu/jwst/science-execution/program-information?id=1256.
Including all telescope pointings, acquisitions, and movements, the nominal total amount of
wall clock time as calculated by APT and charged to this programme was 34.33 hours. Combined
with the total amount of on-source science time from above, that yields an efficiency of 37%.
4 Data reduction
4.1 Customising the JWST pipline
To reduce the observations, we retrieved the Stage 0 data products for JWST Programme ID 1256 from the Barbara A. Mikulski Archive for Space Telescopes (MAST)666http://dx.doi.org/10.17909/vjys-x251.
We then ran the Stage 1, 2, and 3 reduction steps using a custom version of the JWST 1.11.3 pipeline (Bushouse et al. 2023) and Calibration Reference Data System mapping jwst pmap_1100. Stage 1 was run using the optional step argument det1.ramp_fit.suppress_one_group = False. Stage 2 was run using the default reduction pipeline. A custom version of the Stage 3 pipeline was used to align the individual images to Gaia Data Release 3 (GDR3, Gaia Collaboration et al. 2016, 2023) and combine the images into the final full mosaics, as described below.
When downloading the data from MAST, it was noted that the World Coordinate System (WCS) of Visit 2 for the ten filters in the main survey and Visit 7 of F115W + F444W were found to be in error by arcsec, resulting in major discontinuities in the mosaics. The error was adjusted by manually adding an offset to the WCS data stored in data model in the asdf tree in the header of each _cal.fits file. This approximate correction did not not take into account distortion effects, but significantly reduced the search radius needed for subsequent finer alignment.
Despite having taken the F115W + F444W with an overlapping mosaic pattern to ensure a good astrometric calibration, we decided to start by aligning the F470N data to GDR3, as the images in this filter had the largest overlap between the faintest Gaia stars and unsaturated JWST sources. We compiled an absolute reference catalogue of high-quality GDR3 sources that excluded flagged binaries, close pairs, extended galaxies, and knots of nebulosity, the latter being a major source of contamination in this region.
For each of the Stage 2 _cal.fits images, we compiled an individual source catalogue. The coordinates of the centre of the corresponding GDR3 sources were determined using a non-pipeline recentring routine. Each source was also weighted depending on the quality of the fit and whether it was found to be saturated in the _cal.fits data. The Stage 3 TweakReg routine was then run on each of the _cal.fits individually. The absolute reference catalogue was passed to the TweakReg routine using the tweakreg.abs_refcat = path-to-file step argument. The source catalogues were saved as .ecsv files and were passed to the TweakReg routine by updating the asn with the file path. This process was repeated for each _cal.fits file individually as the pipeline defaults to expanding the absolute reference catalogue, which causes alignment errors. The individually aligned files were then resampled into a full combined F470N mosaic using step arguments: tweakreg.skip = True, skymatch.skip = True, resample.fillval = ’nan’.
From this F470N mosaic, a new absolute reference catalogue of sources was constructed. There was significantly more overlap of non-saturated sources between this catalogue and those constructed for the other 11 filters than there was between those filters and GDR3, resulting in an improved alignment. The F470N catalogue was used to repeat the above process for the remaining 11 filters, in each aligning the individual _cal.fits files to the F470N absolute reference catalogue before combining and resampling them into full mosaics.
MacBook Pro M1 laptops were used for the pipeline processing. While the full LW filter mosaics could be combined in one go, the SW filter mosaics were too big and thus were split into two sections of 3 rows and 2 columns, one comprising the easternmost 3 rows and the other the 3 westernmost rows. These could be readily combined as there was a full row of overlap, but this was only done at the final colour composite mosaic stage as described below.
4.2 Source detection, cataloguing, and aperture photometry
Sources were detected in the Level 3 mosaics produced by Stage 3 of the pipeline. First, the two-dimensional background of each image was estimated and subtracted using the DAOPHOT MMM algorithm as implemented in Astropy (Bradley et al. 2023; Astropy Collaboration et al. 2022) using a pixel box and a pixel filter. We used the MMMBackground algorithm to divide the input data into a grid of pixels boxes and then used its mode estimator of the form to calculate the background level of each box, thus creating a low-resolution background map. This image was then median filtered to suppress local under or over estimations, with a window of size of pixels. The final background map was calculated by interpolating the low-resolution background map.
Sources were then identified using DAOStarFinder with a threshold of and a model PSF for each of the 12 JWST filters employed (Perrin et al. 2014). Sources that were detected in filters were then added to a preliminary source catalogue which was checked by eye against the images to remove spurious sources, such as bad pixels, knots of nebulosity, diffraction spikes, and persistence spots that had been erroneously flagged as point sources. The by-eye examination was also used to visually classify other sources including proplyds, outflows, and galaxies. The final catalogue contains 3090 sources.
Aperture photometry was performed using Photutils package (Bradley et al. 2023) in Astropy (Astropy Collaboration et al. 2022). We used the aperture_photometry routine to obtain fluxes for all of the sources in our catalogue, using apertures of 2.5 and 4.5 pixels radius for the sources while the background was measured in an annulus with inner and outer radii of 5 and 10 pixels, respectively, using a sigma-clipped median. The PIXAR_SR header keyword was used to convert from surface brightness (MJy sr-1) to point source flux (Jy) and then to Vega magnitudes using the zeropoints provided by the Spanish Virtual Observatory (SVO) filter profile service (Rodrigo & Solano 2020). To convert the aperture magnitudes to total magnitudes, we used the aperture corrections provided by the JWST reference files for the respective filter, interpolated to the corresponding aperture radius.
By examining the differences in magnitude measured in the 2.5 and 4.5 pixel radius apertures, we were able to distinguish between point and extended sources. Point sources should have the same magnitudes through both apertures after the corrections above, while extended sources such as galaxies and nebular knots will appear brighter in the larger aperture. Sources where the median difference between the apertures across all filters in which they were detected exceeded 0.1 magnitudes were classified as extended. Sources with a neighbour within 1 arcsec were excluded from this automated classification and checked manually.
Given the large collecting aperture of JWST, the high spatial resolution, and the relatively long minimum on-chip integration time, point sources saturate at fairly faint brightnesses. Across the 12 filters, this also depends on wavelength and bandwidth, but for example the saturation limit lies at for F115W, for F182M, for F335M, and for F470N (all Vega magnitudes). Very roughly, this corresponds to masses higher than –1.4 in the narrow-band filters, –0.2 in the medium-band filters, and –0.15 in the wide-band filters, assuming zero extinction.
A summary of the limiting magnitudes and saturation limits for each filter is given in Table 1.
One particular issue which delayed some aspects of the data analysis was a bug in the pipeline implementation of the Frame 0 dynamic range extension which was only rectified in July 2023. Prior to this, particularly bright regions close to saturation were seen to be “wrapped” in intensity, with a sudden drop in brightness and then a subsequent increase: see Figure 2. It was evident that there was more dynamic range to be had and once the pipeline had been fixed, this problem was eliminated.
4.3 Scaling, cleaning, and combination for colour mosaics
The flux- and astrometrically-calibrated FITS mosaics for each of the twelve filters are the primary source for the scientific analysis described here and in future papers in this series. However, the same mosaics can be adjusted to compress the dynamic range, aligned, and combined into colour composites for outreach purposes, but also to elucidate key aspects of the science and even make discoveries.
From this point, all processing of the FITS files output by the pipeline was performed using IRAF (Tody 1986, 1993).
4.3.1 Cropping
The twelve SW mosaics (two overlapping sections for each filter) and six LW mosaics were carefully examined and cropped to sizes which lacked any missing data. In particular, the use of only four primary dithers for the F115W and F444W imaging resulted in a small periodic data loss along the upper and lower edges of the SW F115W mosaics, due to incomplete coverage of the inter-detector gaps. Excluding all rows affected by these periodic indents results in a loss of % in declination coverage in the F115W mosaic compared to all of the other SW channels mosaics and it was thus not included in the final SW colour composite. It nevertheless remains very important for the science described below.
4.3.2 Dynamic range compression
The dynamic range in the images between the central OB stars and brightest nebulosity on one hand and the for western corners and Dark Bay on the other is very high and this was compressed by taking the common logarithm of the data values, making sure to adjust the lower tail of the background sky histogram to be above zero beforehand to avoid clipping.
4.3.3 Saturation
Even after the successful inclusion of the Frame 0 processing to extend the dynamic range, the cores of many stars and even some nebulosity in the wide-band filters remained saturated. The default setting of the pipeline is to set saturated pixels to NaN and thus to enable further processing outside the scientific environment, these pixels needed to be set to a high positive value in order to avoid them appearing as black craters in the middle of bright stars.
For each mosaic individually, the brightest valid pixels were identified and that value was then substituted for every instance of NaN. Given the high base level of nebulosity and the way that the NIRCam read-out scheme and pipeline use slope fitting to establish brightnesses, this is not entirely valid across the whole mosaic, but it is good enough for cosmetic purposes. Future PSF-fitting photometry to the wings of such stars may make it possible to “fill” the saturated cores with more appropriate brightness extensions.
4.3.4 Residual noise and other non-astronomical features
Imaging in the infrared in a region with many bright stars inevitably leads to undesirable effects, not least persistence in the HgCdTe detectors. Careful examination of every mosaic revealed a plethora of residual features that had not picked up by the pipeline when aligning, stacking, and combining the many images, including:
- Persistence:
-
it is well-known that HgCdTe detectors exhibit a persistence effect in which illumination in one image can fill traps in the detector material which later decay and cause residual signals in subsequent ones for several minutes. This effect is particularly noticeable when very bright stars leave ghost images of themselves in later images taken at different pointings (Smith et al. 2008). Of course, the Trapezium Cluster is full of extremely bright stars and imprinted persistence patterns were a major concern ahead of the observations. Fortunately, the overall bright nebulosity appears to have ameliorated the impact, restricting persistence to just a few specific cases. First, many of the bright stars in the darker SW part of the survey were seen to have ghost images at around 8 arcsec (and occasionally at 18 arcsec also) exactly at 45∘ to the NW, and in some cases, a faint trail could be seen connected the ghost to the star distinct from the JWST diffraction spikes at 30∘. These are evidently residuals and may be linked to dither pattern steps, although they would then be expected to the NE, SW, and SE as well. In some cases, the residuals had been removed by the pipeline, but in many others not. Second, there were also some very major persistence ‘tracks’ closer to an E-W orientation and only partly repaired by the pipeline. These may be related to the initial pointing at the Trapezium Cluster as it was acquired for each visit. Third, some major patches of nebulosity were seen apparently randomly strewn across the mosaics These were only seen in a couple of filters and were heavily mottled, unlike any astrophysical source elsewhere in the images, and they had a broadly common appearance. We concluded that these were also persistence artefacts, perhaps from the very bright nebular regions around the Trapezium and BN-KL.
- 1/f noise:
-
the NIRCam detectors are known to exhibit 1/f or pink noise (Rauscher et al. 2011) manifesting itself as row-to-row offsets and thus striping. The visibility of these stripes is a function of the background flux: the lower it is, the stronger they become. Therefore the striping is more prevalent in the SW channel images, as each pixel subtends just one quarter of the solid angle of a single LW pixel, in narrow-band images like F212N, and towards the edges of the survey where the nebular background is low. Given our chosen telescope orientation at V3PA = 270∘, those stripes are vertical in declination.
- Snowballs:
-
these are large circular transient features with slightly elevated fluxes above the background that occur in images made with HgCdTe arrays. It is not known whether these features are a result of radioactive alpha decay due to impurities in the detectors or cosmic rays (Cillis et al. 2018). While multiple dithers allow them to be substantially removed, often a faint caldera-like structure remains visible with a slight rise in intensity above the background to a “crater rim”, with the flux dropping back to background levels inside the crater. Residual snowballs are particularly evident in regions with low background near the edges of our survey.
- Cosmic rays:
-
the majority of cosmic rays are eliminated by the sample-up-the-ramp non-destructive read-out modes used by NIRCam and the image stacking process, but some escape and need to be removed. Care needs to be taken though as single pixel cosmic ray events can become blurred out into multiple pixel events in the process of resampling and drizzling, meaning that they can be mistaken for very faint point sources or vice versa.
- Fake cosmic rays:
-
at the time of writing, there is a bug in the JWST pipeline that appears to inject random hot pixels into one of the H2RG detectors (A2) of the SW channel during the blotting component of the OutlierDetection routine. This leads to periodic regions of the mosaics that appear to be peppered with large numbers of cosmic rays. While this has been reported to the pipeline developers, no fix has been implemented as yet. As with real cosmic rays, these can be blurred out and mimic faint astrophysical point sources, so care must be taken when cleaning them.
- Optical ghosts:
-
in a very small number of cases next to the brightest isolated stars like Ori A and Ori B there appear to be bright ghosts which resemble the 18 segment JWST primary. Similarly, Ori A lies close to the edge of a detector in one of the mosaic/dither positions and optical ghosting is evident which leads to a poor intensity match when stacked with other images.
- Other artefacts:
-
we do not see any clear evidence for other NIRCam scattered light artefacts777https://jwst-docs.stsci.edu/jwst-near-infrared-camera/nircam-instrument-features-and-caveats , including the so-called “claws”, “wisps”, “dragon’s breath” or “ginkgo leaves”, despite the fact that the latter two effects in particular are due to bright stars just outside the NIRCam field-of-view and that the Trapezium Cluster is full of very bright stars. It is possible, however, that these low-level artefacts are lost in the complex nebulosity of the region and/or that they have been removed by dithering. It is also possible that some of the artefacts seen around Ori A and Ori B in some filters are related to Type 1 dragon’s breath.
To remove these residual, post-pipeline artefacts for cosmetic reasons, the individual filter, logarithmically-scaled FITS mosaics were first converted to 16-bit PNG files using the ImageMagick package. Cleaning was then done using a combination of GIMP with the G’MIC-Qt package installed, Adobe Lightroom, and Adobe Photoshop, as follows.
The first step was removing 1/f noise from the images where it was noticeable: in practice that meant all SW channel images, plus F300M and F470N. The G’MIC-Qt “Banding Denoise” algorithm was used in tiled mode, with its various parameters specifically tuned for each image. Particular care was taken to avoid overly aggressive application of the algorithm so as not to introduce additional artefacts (e.g., negative ‘trails’ above and below small extended sources like galaxies and ‘shadows’ above and below features in bright horizontal diffraction spikes) or to eliminate real structures like the short vertical diffraction spikes due to the secondary support structure.
In general, this step removed all trace of the 1/f noise with the exception of the F212N images, where the striping was very strong in the darker parts of the surveyed region. In this case, wide residual bands were visible and these were reduced using very slight adjustments to the background brightness levels in and out of the bands using a brush mask in Lightroom.
As described above, residual real and fake cosmic rays in the data were not always easily distinguishable from faint point sources as they were blurred out in the resampling and drizzling steps in the pipeline. Experiments were made with automated cleaning in IRAF, but no parameters could be found which removed most cosmic rays without also removing faint sources.
Therefore the spot healing tool of Lightroom was used to manually clean the residual cosmic rays, both real and fake, along with snowballs and persistence features, including faint spots, trails, and large-scale features. The user clicks on a feature using an adjustable radius circle, the tool finds a nearby region with similar noise properties, and generates a seamless ‘patch’ to the region selected. Largely this works very cleanly, but has to be taken that the tool does not choose a region that contains another source, otherwise it becomes cloned. Whenever there was a question about the reality of a faint point source or other feature, images at other wavelengths were checked: there are very few if any real astrophysical sources which only appear in a single filter.
This cleaning approach meant a careful and methodical manual inspection of all twelve SW mosaics and all six LW mosaics at high magnification, a process that took a total of fourteen days work in August 2023888Credit is due to the musicians and curators of the various Japanese ambient and Shibuya-kei playlists on Spotify which helped the first author remain mostly sane during this otherwise soul-destroying period..
Finally, there were a few obvious large-scale patches in some of the mosaics due to intensity steps at the edges of individual images which had not been appropriately matched by the pipeline. These features were eliminated by the application of regional masks and slight exposure adjustments in Adobe Photoshop. Similarly, some very abrupt steps in intensity in a few wavelengths around Ori A and Ori B were removed via cloning and masking of other sections of PSF of the stars, taking care not eliminate nearby fainter point sources.
The cleaned mosaics were primarily prepared for combination into colour composites, but can also be used for certain scientific projects, as the overall intensity scaling can be inverted and the original flux-calibrated intensities recovered. However, for obvious reasons, any potential discoveries made in these mosaics would need to checked against the original Stage 2 or Stage 3 pipeline products.
4.4 Colour composites
The cleaned, logarithmically-scaled mosaics for the various filters were then used to create two colour composites, one each for the SW channel and LW channel, as shown in Figures 3 and 4, respectively.
For the LW channel composite, the six mosaics were opened in Photoshop and aligned as layers in a single image. Despite the same Gaia stars having been used to define the astrometric reference frame for all wavelengths, it turned out that in addition to slight pixel shifts between the mosaics, very small scale adjustments were also needed in some cases to ensure that stars lined up across the whole region. Using the F277W mosaic as a base, the F300M and F360M mosaics aligned with just pixel shifts, while the F335M, F444W, and F470N mosaics need to be rescaled by 1–3 pixels in and to line up properly, so by roughly 0.02% across the whole pixel mosaic. No rotations were needed to align the layers.
For the SW channel, two separate composites were made using the E and W overlapping sections initially. As with the LW composite, some slight adjustments to the scale on the order of 0.01–0.02% were needed to ensure the various wavelengths lined up: using F140M as the fiducial, F162M lined up with just an shift, while the remaining wavelengths all needed small, different scale adjustments. As with the LW composite, no rotations were needed between wavelengths. The E and W sections of the SW mosaics were then combined after the following stage.
With the different wavelength images aligned, each layer could be assigned colours and their intensities adjusted to create an aesthetically pleasing and as far as possible, scientifically meaningful colour composite.
For the LW composite, all six filters were used and colours assigned in order of wavelength, with RGB values and notional colour names999Colour names from: https://colornamer.robertcooper.me as follows: F277W (52,0,255) electric ultramarine; F300M (0,0,255) blue; F335M (0,255,0) green; F360M (255,255,0) yellow; F444W (255,122,0) heatwave; F470N (255,0,0) red.
For the SW composite, only five filters were used, with F115W left out because of the gaps along its northern and southern edges (see Section 4.3.1), which would have yielded a smaller mosaic. Colours were assigned in order of wavelength with one exception: F187N, the Pa- line should be yellow or orange in principle, but was set to a medium grey-blue instead. The rationale for doing so is to make a visual reference to the colour scheme often used for ground-based near-infrared images of the Orion Nebula (e.g., McCaughrean 1989; Kaifu et al. 2000; McCaughrean et al. 2002; Tamura et al. 2006; Drass et al. 2016) with the J-band as blue, H-band as green, and K-band as red. As Pa- is not visible from the ground, the diffuse ionised gas of the region is represented by the Pa- line of hydrogen instead at 1.282 m, thus in the J-band and blue. As we do not include the F115W filter and thus Pa- in the colour composite, this is reasonable substitution. The full set of filter RGB values and notional colour names is: F140M (0,0,255) blue; F162M (0,255,0) green; F182M (148,132,0) medusa green; F187N (85,95,233) flickering sea; F212N (255,255,0) red.
In practice, careful inspection of the colour composites revealed a small number of outlier objects seen in one filter only, likely due to the misidentification of cosmic rays as real sources or the inadvertent cloning a star while cleaning, along with other artificial features, so the individual wavelength mosaics were iteratively recleaned and recombined several times before the final composites were arrived at.
Once the two colour composites were finalised, they were imported into Lightroom for final processing involving slight adjustments to the global intensity mapping and relatively small local adjustments to contrast using the Texture and Clarity settings to bring out some of the more delicate features in the region.
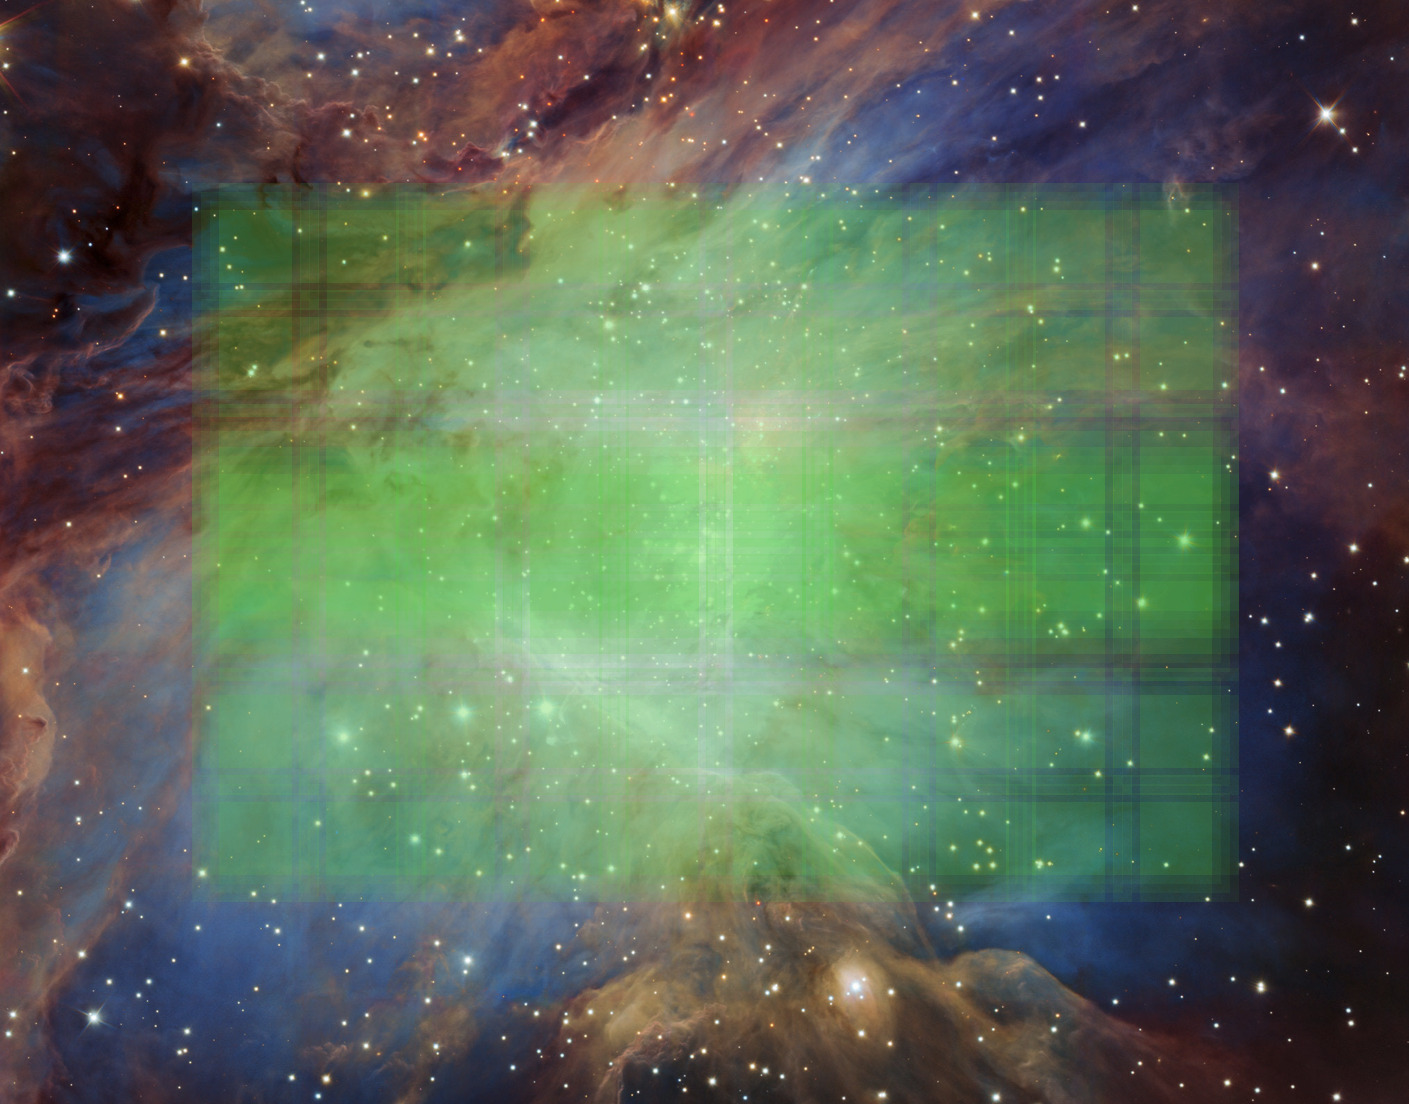
The final colour composite images are shown in reduced form here: Figure 3 shows the Short Wavelength (SW) channel mosaic, combining the F140M, F162M, F182M, F187N, and F212N images as described above, while Figure 4 shows the Long Wavelength (LW) channel mosaic combining the F277W, F300M, F335M, F360M, F444W, and F470N images as described. Note that the full images do not cover precisely the same area of sky, mainly because the LW composite is rotated by 0.5∘ clockwise with respect to the SW composite due to a slight difference in the orientations between the SW and LW channels of NIRCam.
In their full original resolution (31.2275 mas/pixel for the SW image and 62.9108 mas/pixel for the LW image), the mosaics span pixels and pixels, respectively. Both are available for download at full size and explorable at full resolution using pan-and-zoom technology at the following web locations:
-
•
https://www.esa.int/Science\_Exploration/Space\_Science/Webb/Webb\_s\_wide-angle\_view\_of\_the\_Orion\_Nebula\_is\_released\_in\_ESASky
-
•
https://www.esa.int/ESA\_Multimedia/Images/2023/09/Orion\_Nebula\_in\_NIRCam\_short-wavelength\_channel
-
•
https://www.esa.int/ESA\_Multimedia/Images/2023/09/Orion\_Nebula\_in\_NIRCam\_long-wavelength\_channel
-
•
https://sky.esa.int/?jwst\_image=webb\_orionnebula\_shortwave
-
•
https://sky.esa.int/?jwst\_image=webb\_orionnebula\_longwave
The latter links are to ESA’s ESASky portal, which also allows the overlay of other images and catalogue information, so should be of scientific use also (http://sky.esa.int, Giordano et al. 2018).
5 The Orion Nebula
In the introduction to this paper (Section 1), we gave a broad but necessarily incomplete review of observational studies of the Orion Nebula and associated stellar populations, the latter being a main focus of our JWST survey. However, the nebula itself is also of great interest, with its extended emission and absorption due ionised, atomic, and molecular gas, plus obscuration by and emission from dust, as reviewed by (Peimbert 1982; O’Dell 2001a, b; O’Dell et al. 2008).
The JWST images provide excellent high-spatial resolution and high-fidelity imaging of the inner nebula in ionised, atomic, and molecular gas as well as dust, in tracers and at wavelengths that are complementary to the extensive HST visible, Spitzer mid- and long-wavelength infrared, interferometic millimetre, and radio observations. In some cases, comparisons should enable a better understanding of the excitation and extinction conditions in the nebula (e.g., comparing ionised hydrogen emission in H with Pa-, molecular hydrogen emission at 2.12 and 4.69 m), detailed morphology across tracers of different temperature and density conditions (e.g., in the Bright Bar PDR and around the Dark Bay), and dynamics by measuring proper motions seen over the almost 30 year HST–JWST observational time baseline. Here we only wish to draw attention to some of the general features of the nebula as seen in the JWST images –– future studies using these data will go far deeper.
The SW colour composite looks broadly similar to ground-based three-colour near-infrared images made using the broad-band J-, H-, and K-band filters as blue, green, and red, respectively, with a general blue-purple haze due to ionised hydrogen emission. Of course, as described in Section 4.4, this partly by design, with the assignment of the Pa- line to blue tones, in place of Pa- which lies in the J-band filter. In the JWST data, Pa- lies in the F115W filter, which is not used in the colour composite. However, there is clearly far more small-scale detail seen in the JWST SW images due to the higher-spatial resolution, which also serves to yield significantly smaller stellar point-spread functions, thus further emphasising the nebula emission.
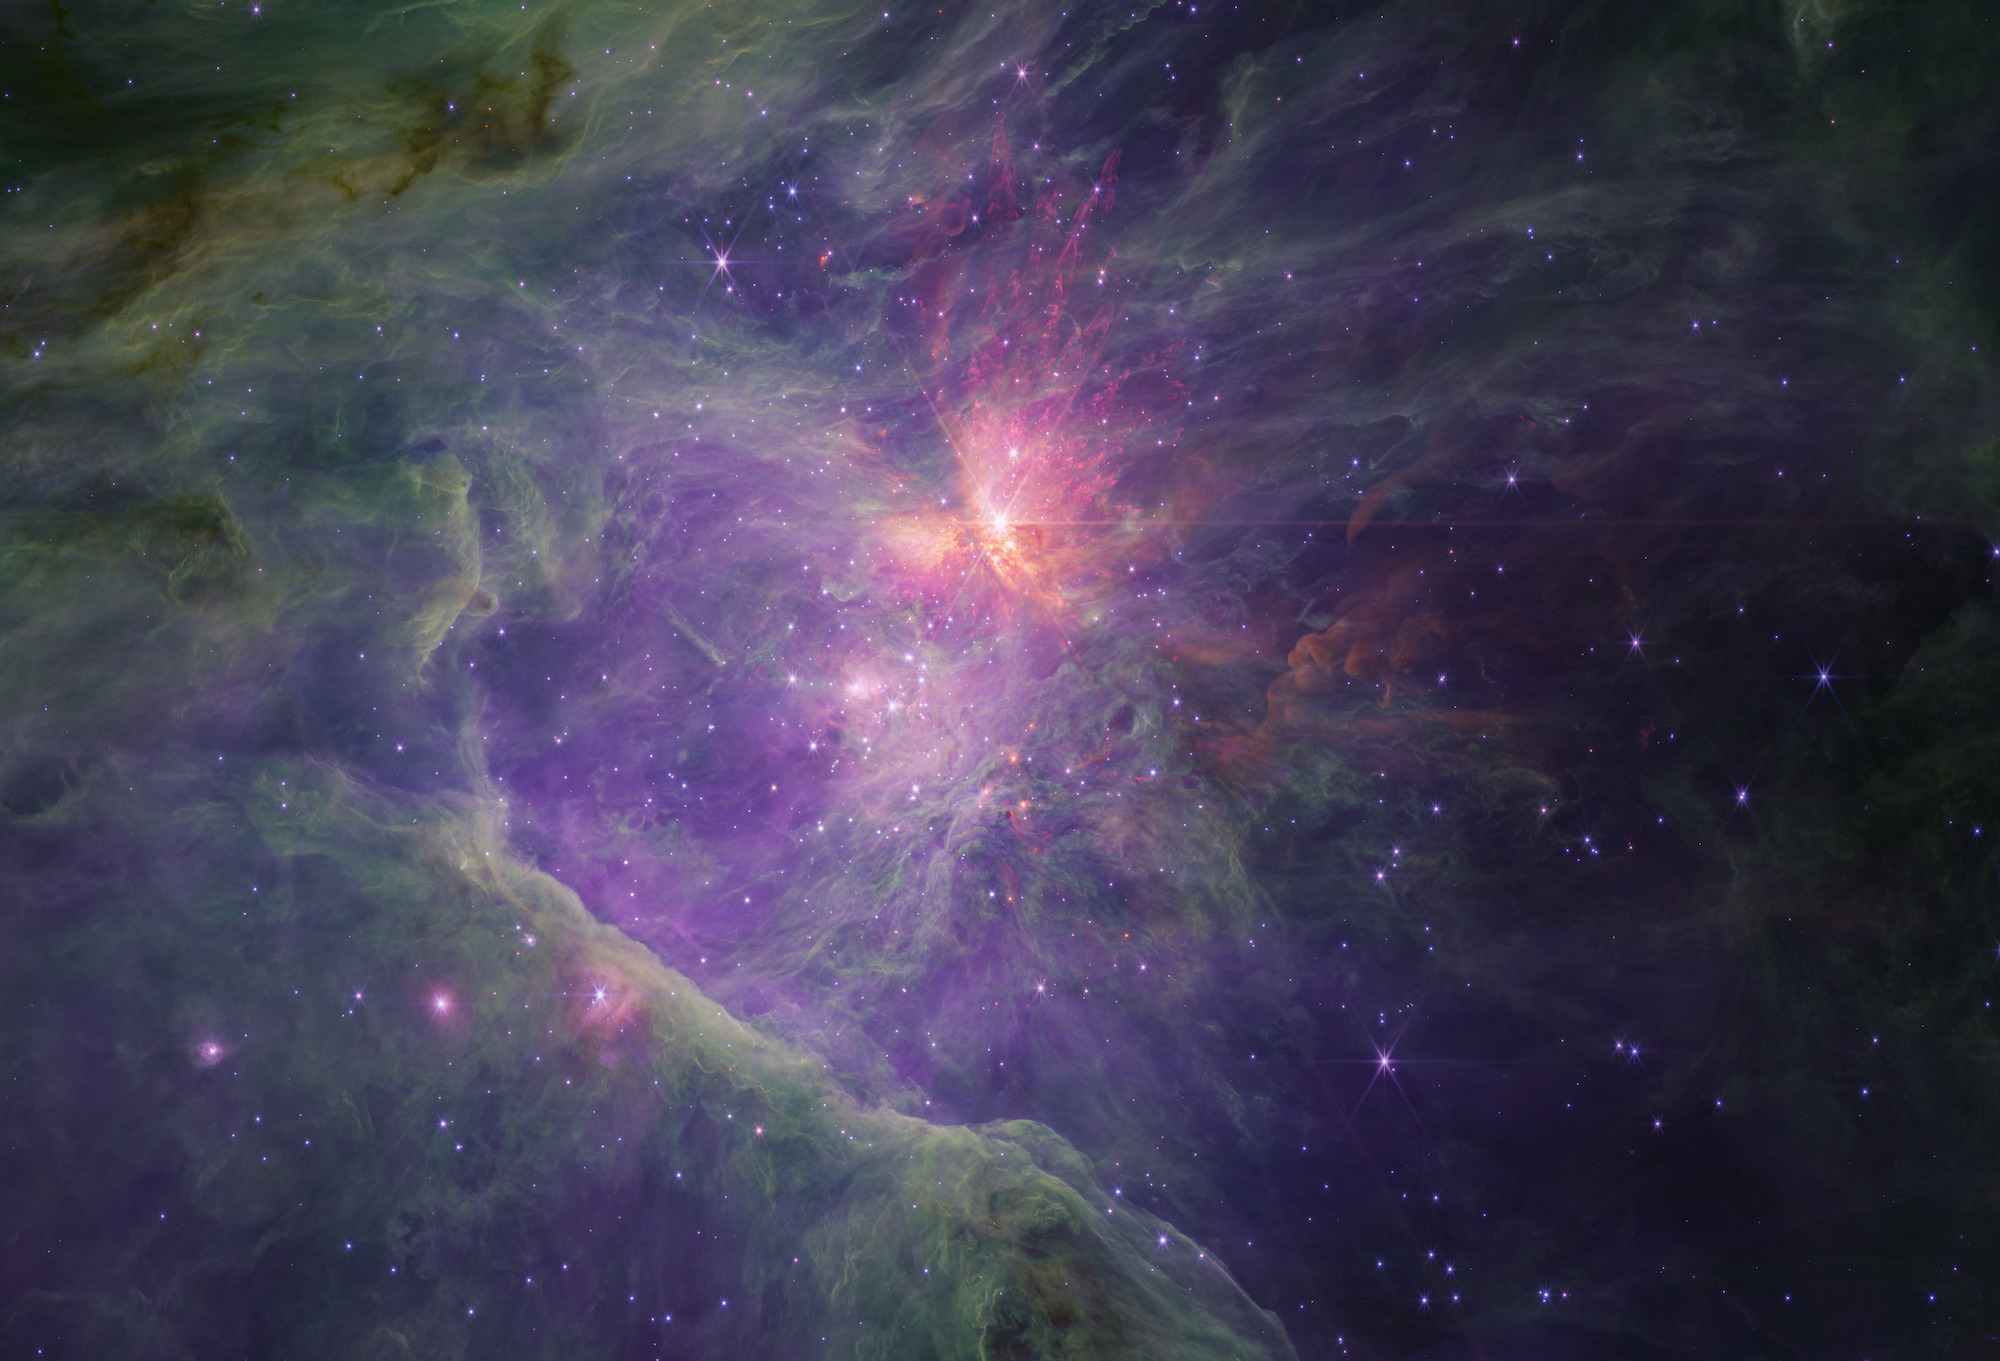
The LW colour composite by comparison looks very different, stars taking another step further back. The image is dominated by purple ionised emission in the central region around the Trapezium stars, with browner emission due to dust even closer in, as described in Section 6. There is a significant green in the image due to PAH emission at 3.3 m in the F335M filter. This is particularly bright along the Bright Bar PDR described below, but also up into the Dark Bay to the E and NE, and with the central region too. The latter takes on an almost 3D appearance, suggestive of the back wall of the ionised blister around the Ori stars. There are also holes and bubbles in the PAH emission, some apparently related to outflows from the BN-KL and OMC-1S regions embedded behind the blister, as described in more detail in Sections 9 and 11 below. Finally, there are some peculiar brown “smooth clouds” to the W of the Trapezium and another N of BN-KL, both also hinted at in the SW composite.
5.1 The Bright Bar
The Bright Bar is photodissociation or photon-dominated region (PDR), running from NE to SW between the Ori and Ori stars. In the SW composite, a very fine transition is seen between the predominantly blue-purple ionised gas, to greener and then red emission, the latter dominated by 2.12 m H2. The latter has an almost 3D appearance of clouds being illuminated from afar, in strong visual agreement with the finding that external FUV radiation from the OB stars is responsible for the emission in the Bright Bar and that the H2 emission is fluorescent, not shocked as seen elsewhere in the region (Tielens et al. 1993). In the LW image, a well-defined interface is seen between the ionised gas in purple and the PAH emission in green — the latter also has a yellow tinge along the brightest part of the Bar perhaps, which may be due to a contribution from CO emission in the F444W filter.
Substantial work has been done to combine infrared and millimetre observations of the Bar to arrive at a comprehensive picture of an edge-on PDR showing the transition from ionised to atomic to molecular gas (e.g., Tauber et al. 1994; Young Owl et al. 2000; Pellegrini et al. 2009; Goicoechea et al. 2016), and a comprehensive study of the PDR is the subject of a dedicated JWST near- and mid-infrared programme which will doubtless make use of these wider-field data (Berné et al. 2022), so further discussion is referred there.
One interesting point in our images, however, is that the 2.12 m H2 emission in the colour composite and even more clearly the F212N image appears to delineate the surface of a tapering pillar with its narrow end near Ori A, and from the illumination of the various clouds and clumps along the pillar, the latter star also appears to be making significant contributions to the UV radiation, not just the Trapezium.
5.2 Eastern pillars
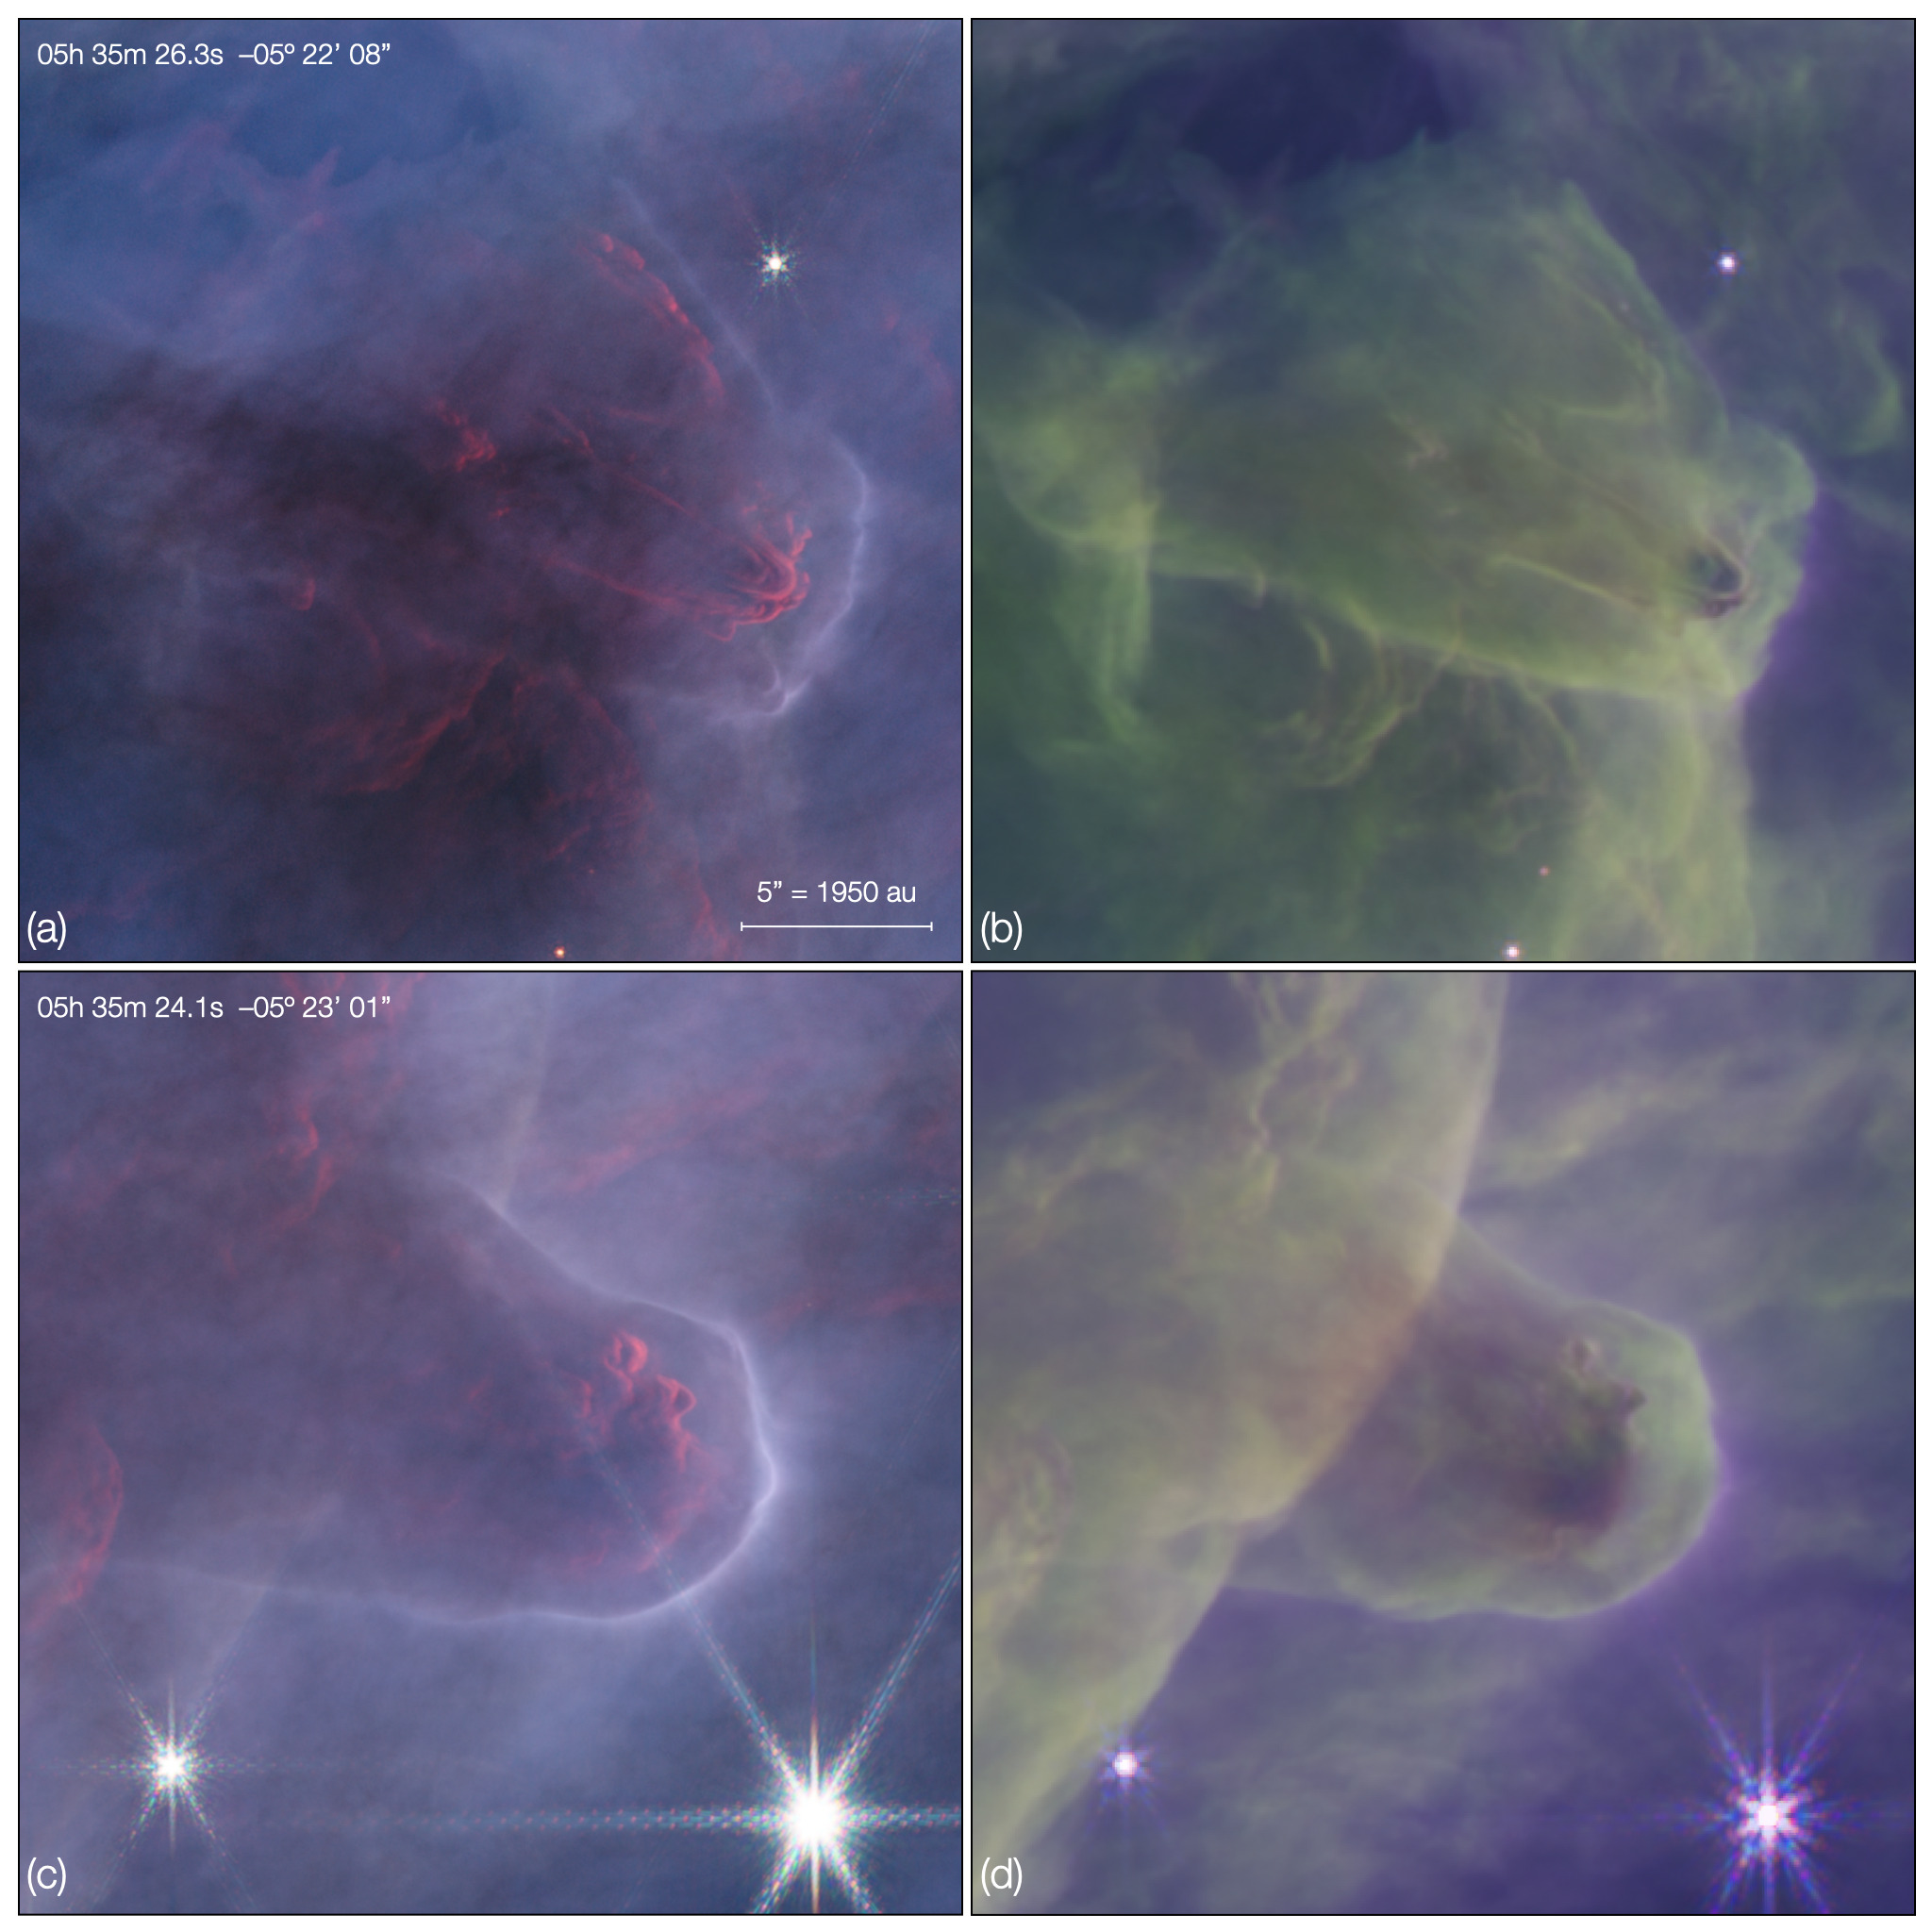
On a much smaller scale, but perhaps simpler geometrically and thus more accessible to modelling, there are two pillars seen to the E of the Trapezium, above the Bright Bar and in the Dark Bay, which are also clearly being impacted by the intense UV radiation from the OB stars (Figure 5).
These pillars are large enough to be evident in ground-based infrared images (e.g., McCaughrean et al. 2002; Drass et al. 2016), and the South Pillar is seen in the HST Treasury survey at visible wavelengths as a half-hidden red rim (Robberto et al. 2013), but the JWST images reveal them as au or 0.03 pc long protrusions from a wider molecular cloud along the edge of the ionised region.
Their appearance is particularly dramatic in the SW composite, with bright ionised rims seen in blue-white facing towards the Trapezium and then roughly 1–1.5 arcsec (390–585 au) behind that there are clumps and sub-pillars rimmed with the red of H2 at 2.12 m, presumably UV-excited and fluorescing. The extended sub-pillars are particularly clear in the North Pillar and similar red-rimmed clouds are seen along the cloud from which the pillars protrude.
In the LW composite, the pillars are again rimmed with ionised emission, this time seen in purple with the interiors of the pillars glowing green in PAH emission. The clumps and sub-pillars illuminated red in the SW composite now take on a browner, dustier appearance, implying that, as expected, these are higher density structures inside the main pillars. These structures cannot be very dense down their entire length, however, as the South Pillar appears to be transparent near the base, with stronger PAH emission from a rim on the parent cloud apparently shining through. There is no obvious equivalent to the strong red rims in the 4.69 m line of H2.
In more detail, a careful comparison shows that the outer rim of the green PAH emission seen in the LW composite lies slightly inside ionised rim seen in the SW composite: the offset is on the order of 0.1–0.2 arcsec or –80 au. These observations seem particularly amenable to modelling of the pillar structure, factoring the radiation field of the Trapezium stars and plausible density profiles for the pillars.
6 The Trapezium region
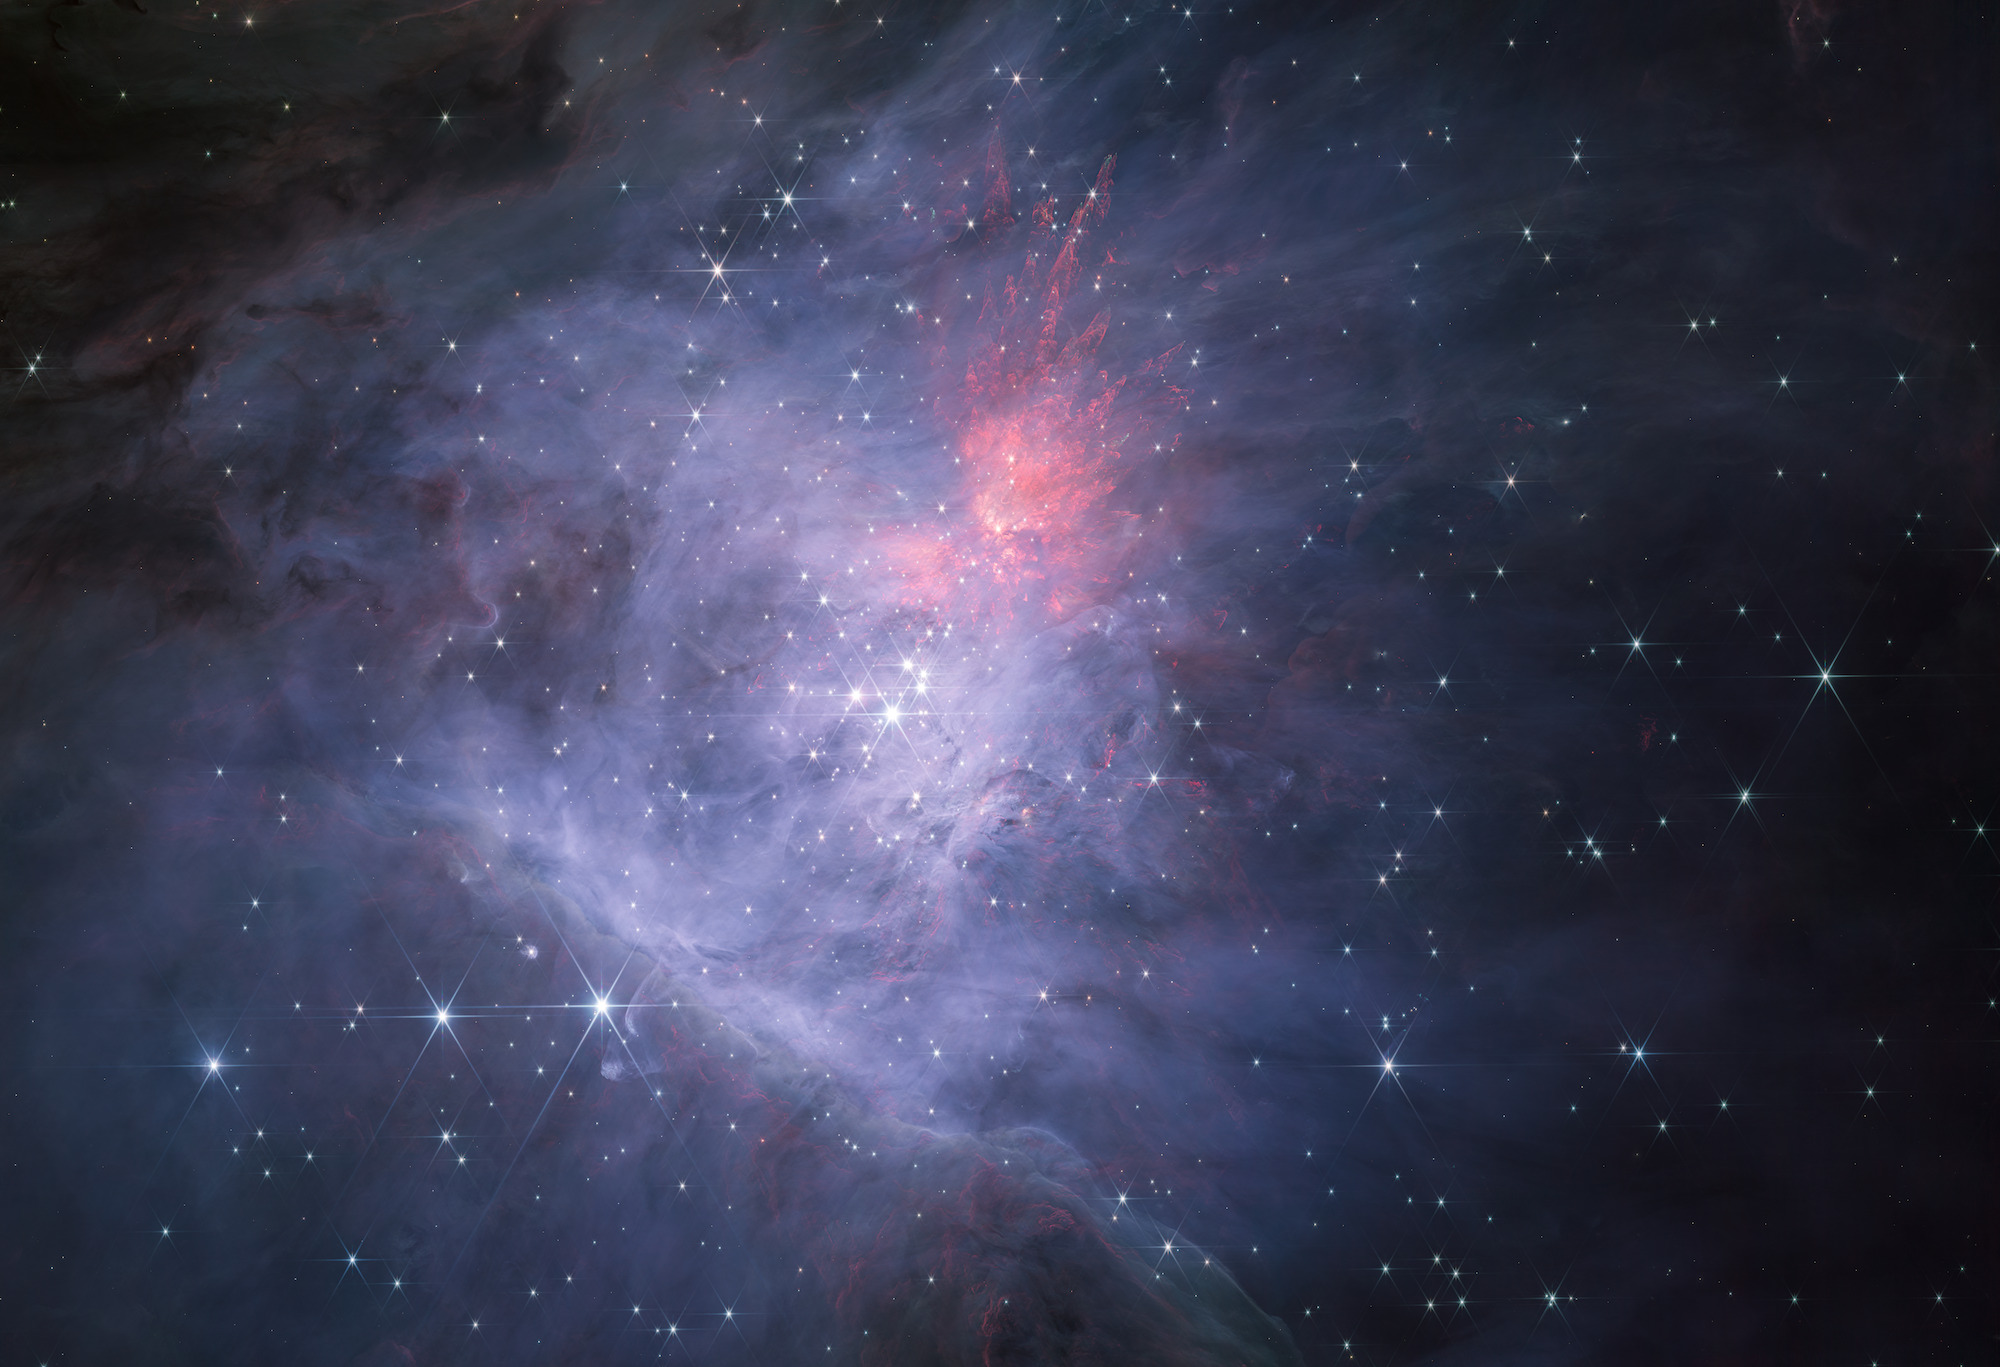
The massive Trapezium OB stars, Ori, lie at the heart of the Orion Nebula and provide much of the ionising flux and wind that illuminates and shapes the nebula, along with the Ori stars below the Bright Bar. The region is much more complex than the nominal four stars of the Trapezium would suggest, with each of the massive stars being a hierarchical multiple system (e.g., Preibisch et al. 1999; Grellmann et al. 2013; GRAVITY Collaboration et al. 2018), and a high density of lower-mass stars being arrayed around them (McCaughrean & Stauffer 1994). In addition to their wide-reaching impact on the scale of the full Orion Nebula, the OB stars have a significant impact on the stars local to them and the protoplanetary disks. The proplyds are disks that are being externally photoevaporated and ionised by the OB stars, yielding characteristic ‘tadpole-shaped’ nebulae as material flowing away is shaped by the radiation and winds from the same stars. The objects were initially detected in ground-based optical emission-line imaging by Laques & Vidal (1979) and also at radio and x-ray wavelengths (Churchwell et al. 1987; Garay et al. 1987; Felli et al. 1993), but it was the post-refurbishment Hubble Space Telescope images of O’Dell et al. (1993); O’Dell & Wen (1994); Bally et al. (2000) that revealed their full structure, with many proplyds around the Trapezium with tails pointing away from the OB stars. The OB stars also heat dust in the region, perhaps generated by the photoevaporated disks, resulting in the Ney-Allen nebula at thermal-infrared wavelengths, a series of shells and arcs curving away from Ori C, with a significant concentration of emission coming from around Ori D (Ney & Allen 1969; Wynn-Williams & Becklin 1974; McCaughrean & Gezari 1991; Hayward 1994; Hayward et al. 1994; Smith et al. 2004, 2005; Robberto et al. 2005).
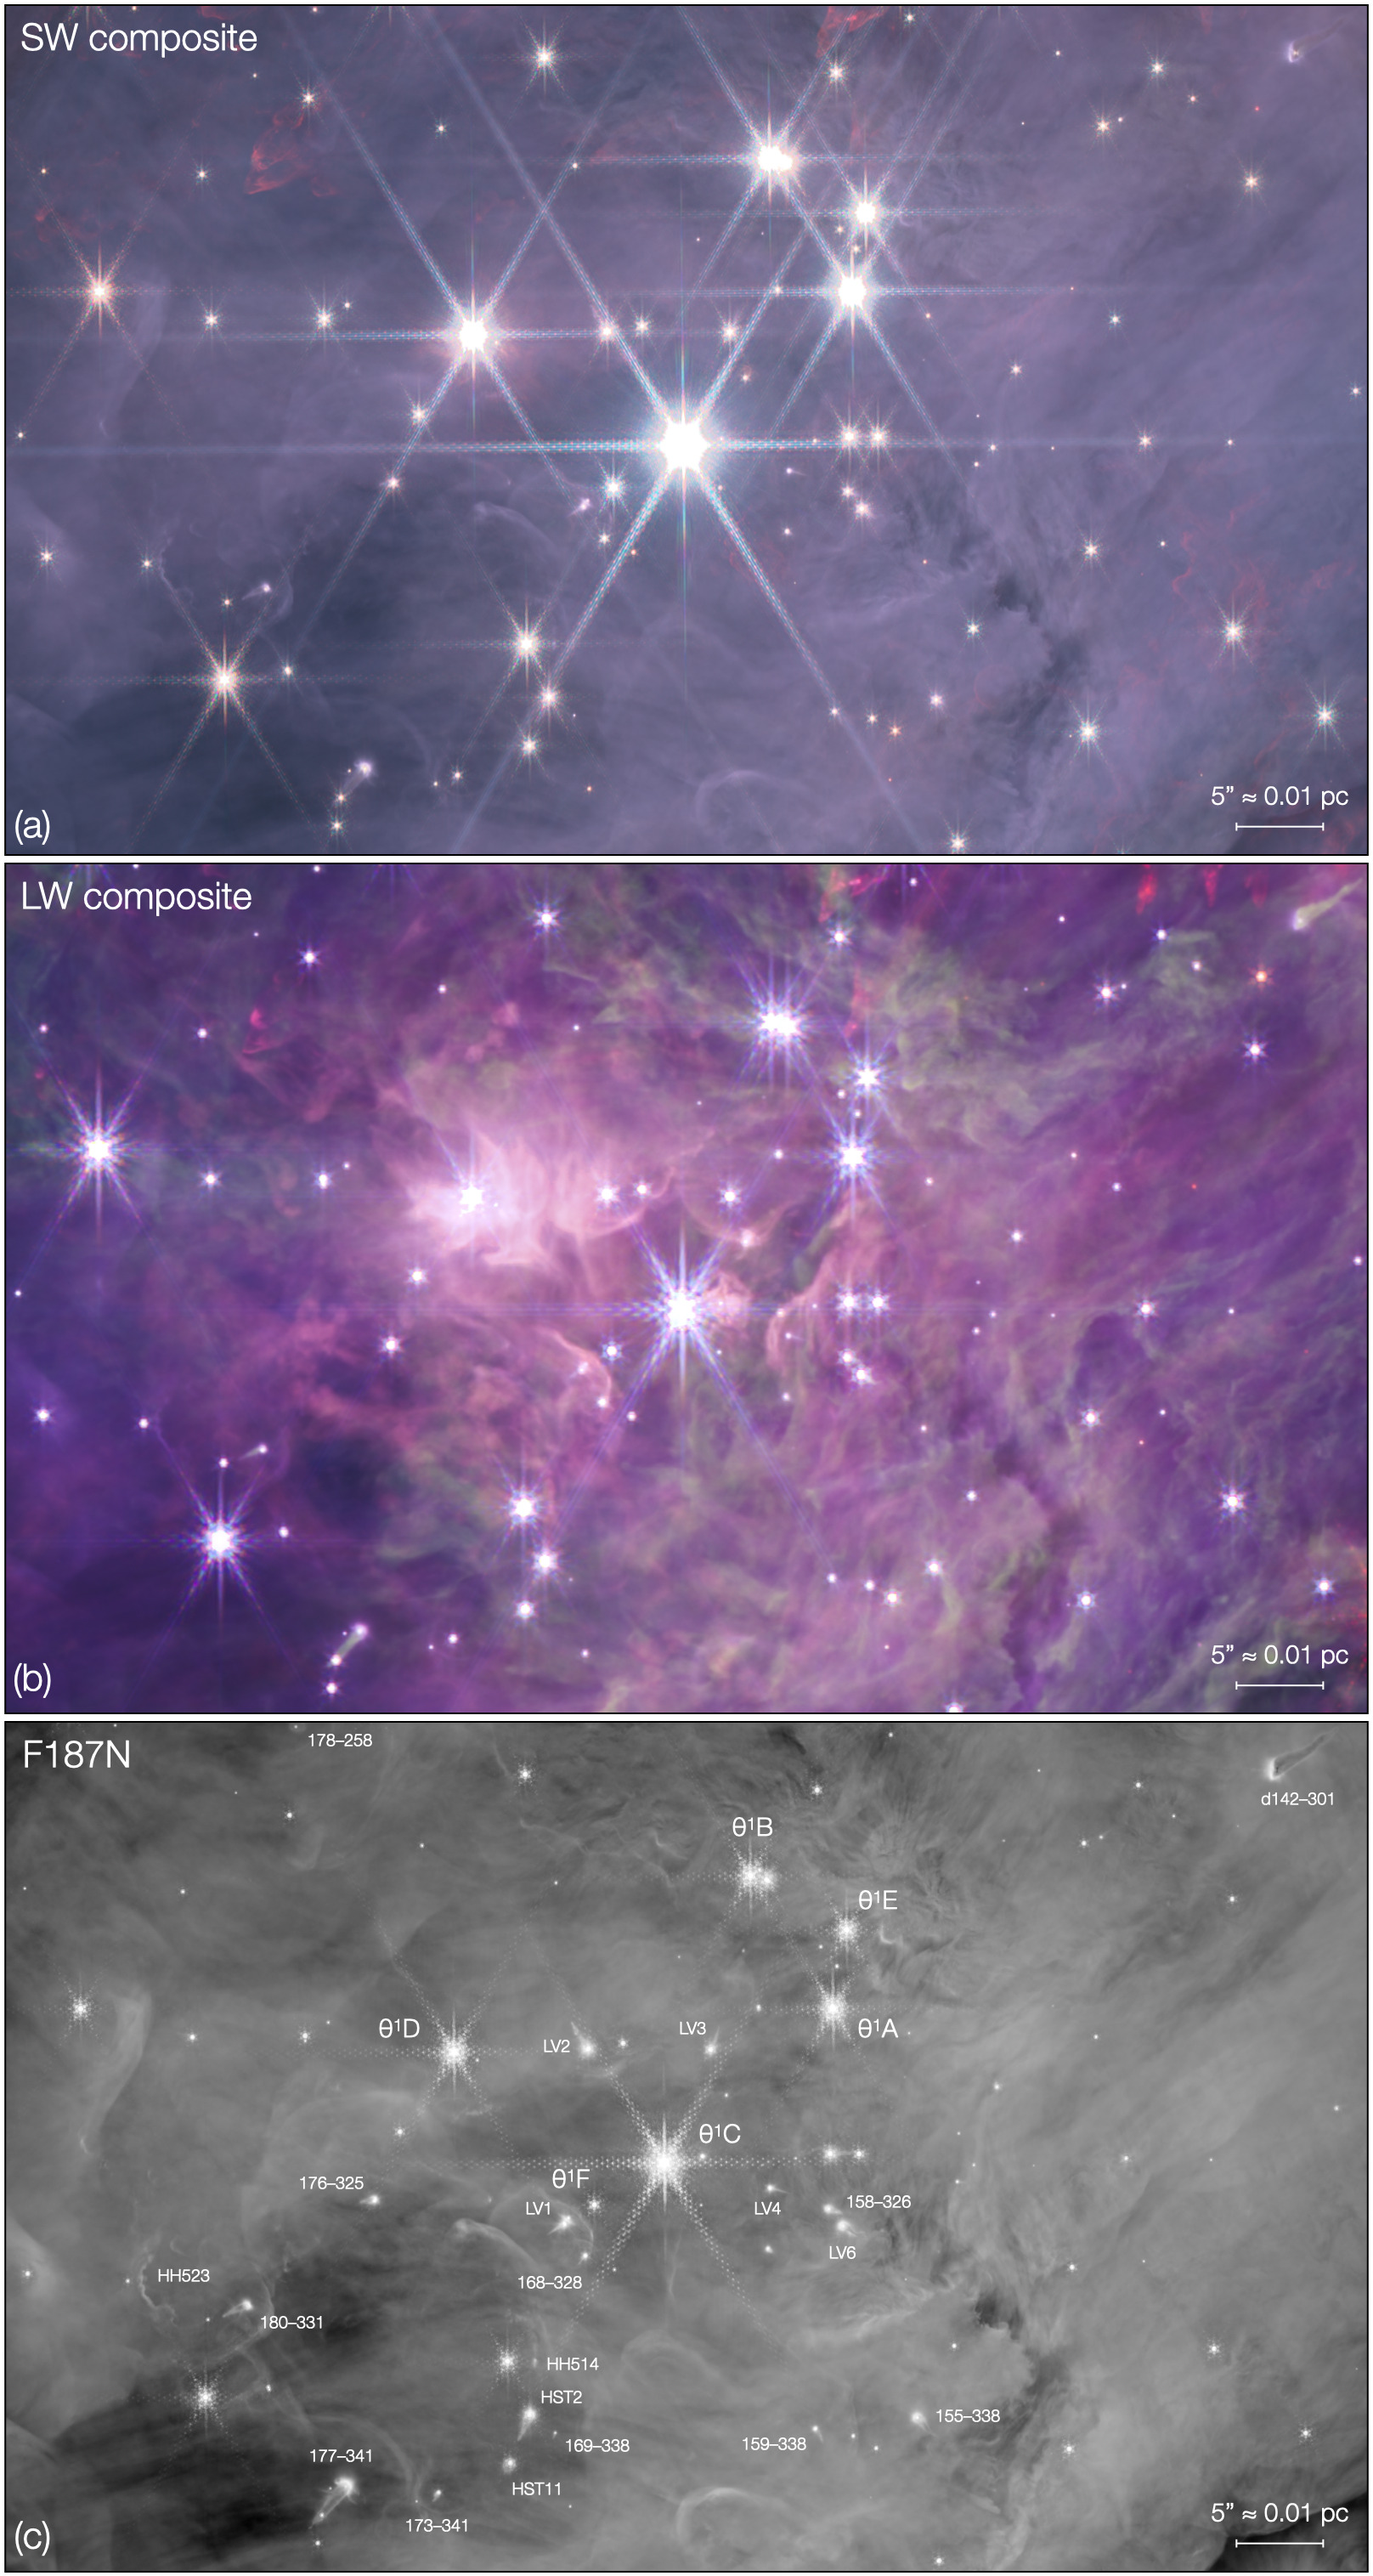
Figure 6 shows cut-outs from the SW and LW composites centred on Ori C (panels (a) and (b), respectively), albeit with the dynamic range and contrast adjusted to see more detail. In addition, a similar cut-out from the Pa- F187N mosaic is shown (panel (c)), as this suppresses the continuum emission from stars while better emphasising the ionised gas emission. The latter is annotated with the names of the Ori OB stars, as well as many of the ionised proplyds around them.
The proplyds and stand-off ionisation fronts are also seen in the SW composite cut-out at lower contrast, along with the first hint of red nebulosity around Ori D (cf. McCaughrean & Stauffer 1994), and some of the southward fingers of shocked H2 emission from the OMC-1 outflow discussed in more detail in Section 10. Many of the proplyds are also seen in the LW cut-out and some show green tails, indicative of PAH emission in the material being swept back from the circumstellar disk by the OB stars.
The LW image also provides the highest-ever resolution image of the dust shells which comprise the Ney-Allen nebula. The previously most-detailed images were taken on the 8-m diameter Gemini-S at 11.7 m, yielding a maximum spatial resolution of 0.35 arcsec (Smith et al. 2005), while the resolution of the JWST images is 0.127 arcsec at 4 m. Against that, the stars are still moderately bright at 4 m, while at 10 m and beyond, the dust arcs dominate entirely. As the temperature of the dust in the region is around 300 K (Hayward 1994), we are likely seeing a mix of thermal emission, reflected light, and perhaps PAH emission associated with the dust. The brown colour of the shells and arcs, indicating more emission at longer wavelengths, fading away at pc radius from Ori C to be replaced by green PAH emission, would tend to support that. There is green PAH emission nearer Ori C also, but that may be a projection effect, if the Trapezium stars are embedded in a 3D dust pocket.
The brightest region in the JWST LW image coincides, as expected, with Ori D, which Robberto et al. (2005) suggest may harbour a photoevaporating disk, releasing dust, while Smith et al. (2005) favour scenario where Ori D is located closer to the background ionisation wall and PDR on the Orion Nebula. Another prominent arc to the SE of Ori C is associated with IRS4 of Wynn-Williams & Becklin (1974), which is in turn almost identical in shape to the ionisation front in the Pa image between proplyd LV1 (aka 168–326), Ori F, and ultimately Ori C. The same arc is seen in the HST H and [O III] images. The other obvious dust arcs in the LW image can similarly be identified with the proplyds LV2 (167–317), LV3 (163–317), and LV4 (161–324), although not all show bright ionisation fronts. These coincidences confirm the model proposed by Smith et al. (2005) in which the dust is being lit up at the point where material flowing away from the photoevaporating disks collides with the stellar wind of Ori C. More detailed modelling and follow-up NIRSpec and MIRI IFU spectroscopy should provide excellent probes of the excitation and radiation processes at work in this region.
7 Brown dwarfs and planetary-mass objects in the Trapezium Cluster
One of the main scientific drivers for this JWST survey of the Trapezium Cluster was the search for candidate planetary-mass objects (PMOs) extending well below the achieved in ground-based imaging surveys. The Orion Nebula is well out of the galactic plane and has a dense molecular cloud behind it, so background field star contamination should be limited, while the close distance to Orion also mitigates against substantial foreground contamination by field brown dwarfs. Indeed, over much of the survey region, there is no evidence for a large population of faint objects at the limit of sensitivity, suggesting both that the initial mass function does not continue to extremely low-masses in large numbers and conversely that the survey is not significantly polluted by the field. On top of which, it is possible to use the large variety of filters in NIRCam to provide an initial discrimination between young, low-mass objects in Orion and field contaminants on the basis of their spectral energy distributions.
Young ( Myr) PMOs with masses between 1 and 13 have effective temperatures of 890–2520 K (Phillips et al. 2020), which means that an equivalent blackbody spectral energy distribution (SED) would peak between 1.15–3.3 m, i.e., covered by our JWST NIRCam wavelength range. In fact, much like the spectra of late M, L, and T field dwarfs spanning the same range of effective temperatures (albeit at higher surface gravities), the cool atmospheres of young PMOs are nothing like blackbodies and are dominated by broad bands of atmospheric H2O and CH4 absorption. These strong bands of molecular absorption confine the spectrum to a series of narrow peaks which can be identified using photometry through an appropriate set of medium- and wide-band filters, providing a robust method for distinguishing PMOs from more massive, distant, and reddened background objects. The molecular absorption bands of H2O and CH4 are shown as grey bars in Figure 7, while the nine medium- and wide-band NIRCam filters used to measure their strength are shown along the bottom of the plot.
The power of utilising these absorption features for identifying PMOs is demonstrated in Figure 7. In the top panel, the blue lines show NIRCam photometry for a sample of our candidate brown dwarfs and PMOs with decreasing brightness. The dashed grey lines show the corresponding best-fitting models for 1 Myr objects (Chabrier et al. 2023; Baraffe et al. 2015), assuming a distance of 390 pc and allowing the reddening to vary during the fit. The resulting best fit masses for this illustrative sample range from 0.07 to 0.001 or approximately 70 to 1 .
The evolution of the H2O and CH4 bands as sampled by the nine filters is clearly demonstrated in the sequence as a function of decreasing mass from brown dwarfs to PMOs. The H2O absorption features at 1.4 and 1.9 m are present at the star to brown dwarf transition and strengthen with decreasing mass. At lower effective temperatures and thus masses below 5 , CH4 absorption at 3.3 m becomes a defining characteristic of the SED, and continues to strengthen with decreasing temperature.
For comparison, the red lines in the bottom panel show a ‘control sample’ of candidate reddened background stars seen in our survey, with fitted effective temperatures of –30 000 K. In contrast to the brown dwarf and PMO candidates, the reddened background star candidates do not show molecular absorption feature, rather having much smoother SEDs that are well fit by a reddened blackbody model (dashed grey lines). This demonstrates that our multi-filter technique is effective at weeding out background stars and identifying a cleaner sample of genuine Orion brown dwarfs and PMOs, although definitively confirming these candidates will require spectroscopy – we will be obtaining NIRSpec MSA prism (R100) spectroscopy for many of our candidates in JWST Cycle 2.
In this way, we have identified several hundred candidate PMOs in our survey region. A brief description of the methodology and top-level results are given here, but the reader is referred to Pearson & McCaughrean (2023, submitted) for a full presentation of the results and analysis.
A total of 540 candidates have been identified with masses below 13 , of which 168 are at 5 or less. At higher masses, our PMO candidates recover the objects found in previous deep infrared surveys of the Trapezium Cluster and Orion Nebula Cluster (McCaughrean et al. 2002; Lada et al. 2004; Slesnick et al. 2004; Lucas et al. 2005; Meeus & McCaughrean 2005; Lucas et al. 2006; Riddick et al. 2007; Weights et al. 2008; Drass et al. 2016; Robberto et al. 2020), but the higher spatial resolution and lower background of JWST allow us to extend greater than –5 mag deeper in apparent magnitude and thus easily to 1 Mjup: in extremum, we have discovered candidates at 0.6 or roughly 2 Saturn masses. Such masses are well below the classical minimum mass of 7–10 thought to arise from 3D opacity limited fragmentation in molecular clouds (e.g., Rees 1976; Low & Lynden-Bell 1976; Silk 1977; Boss 1988; Whitworth 2018), and even below the minimum mass of 2.6 that might occur under well-tuned conditions in a 2D shock-compressed layer (Boyd & Whitworth 2005; Whitworth et al. 2007): this poses a problem if these objects formed directly from molecular clouds.
It is always possible of course that some of the very low mass objects seen in our JWST survey could have formed as planets in circumstellar disks around young stars before being ejected due to interactions in the disk (Parker & Quanz 2012; van Elteren et al. 2019; Scholz et al. 2022). However, another discovery made in our survey poses a conundrum for such a solution. Namely that there is a significant population of low-mass PMOs down to 1 which are found in au binary systems. There are 40 such systems in our data and two triple systems, yielding a wide binary fraction of 9%. This is quite unexpected given that the fraction for field and cluster brown dwarfs over similar separations is close to zero.
Figure 8 shows a remarkable sample of five 3–7 binaries in a small region to the east of the Trapezium. Given the generally rather low density of the cluster and field star populations at such separations, as is evident in the figure, these are clearly real pairs, not chance alignments. We have coined the acronym “JuMBO” for Jupiter-Mass Binary Object for these systems.
The formation mechanism for JuMBOs is unknown. Can pairs of planets be ejected from a circumstellar disk and remain bound? Or perhaps new theoretical models may be needed to explain not only how 1 objects can form in isolation, below the usual minimum mass limits, but also that they can form as binaries. The particular conditions in the highly dynamic and energetic environment of the Orion Nebula can help (see, e.g., Whitworth et al. 2007), or perhaps unconventional mechanisms such as the fragmentation of low-mass starless disks must be invoked (e.g., Bodenheimer 1978): searching for similar objects in other young star-forming regions with varying densities may help discriminate between potential models.
In any case, the larger number of such objects allows to examine the extreme low-mass end of the IMF in Orion, but also the planetary-mass binary fraction and other statistical properties, extending the many earlier studies on stellar and brown dwarf binaries in Orion and other young star-forming regions (e.g., Petr-Gotzens 1998; Petr et al. 1998; Scally et al. 1999, 2005; Reipurth et al. 2007; Petr-Gotzens et al. 2008; Kounkel et al. 2016a, b; Duchêne et al. 2018; Jerabkova et al. 2019; Tokovinin et al. 2020; Strampelli et al. 2020; De Furio et al. 2022b, a), and these issues are addressed in more detail by Pearson & McCaughrean (2023, submitted).
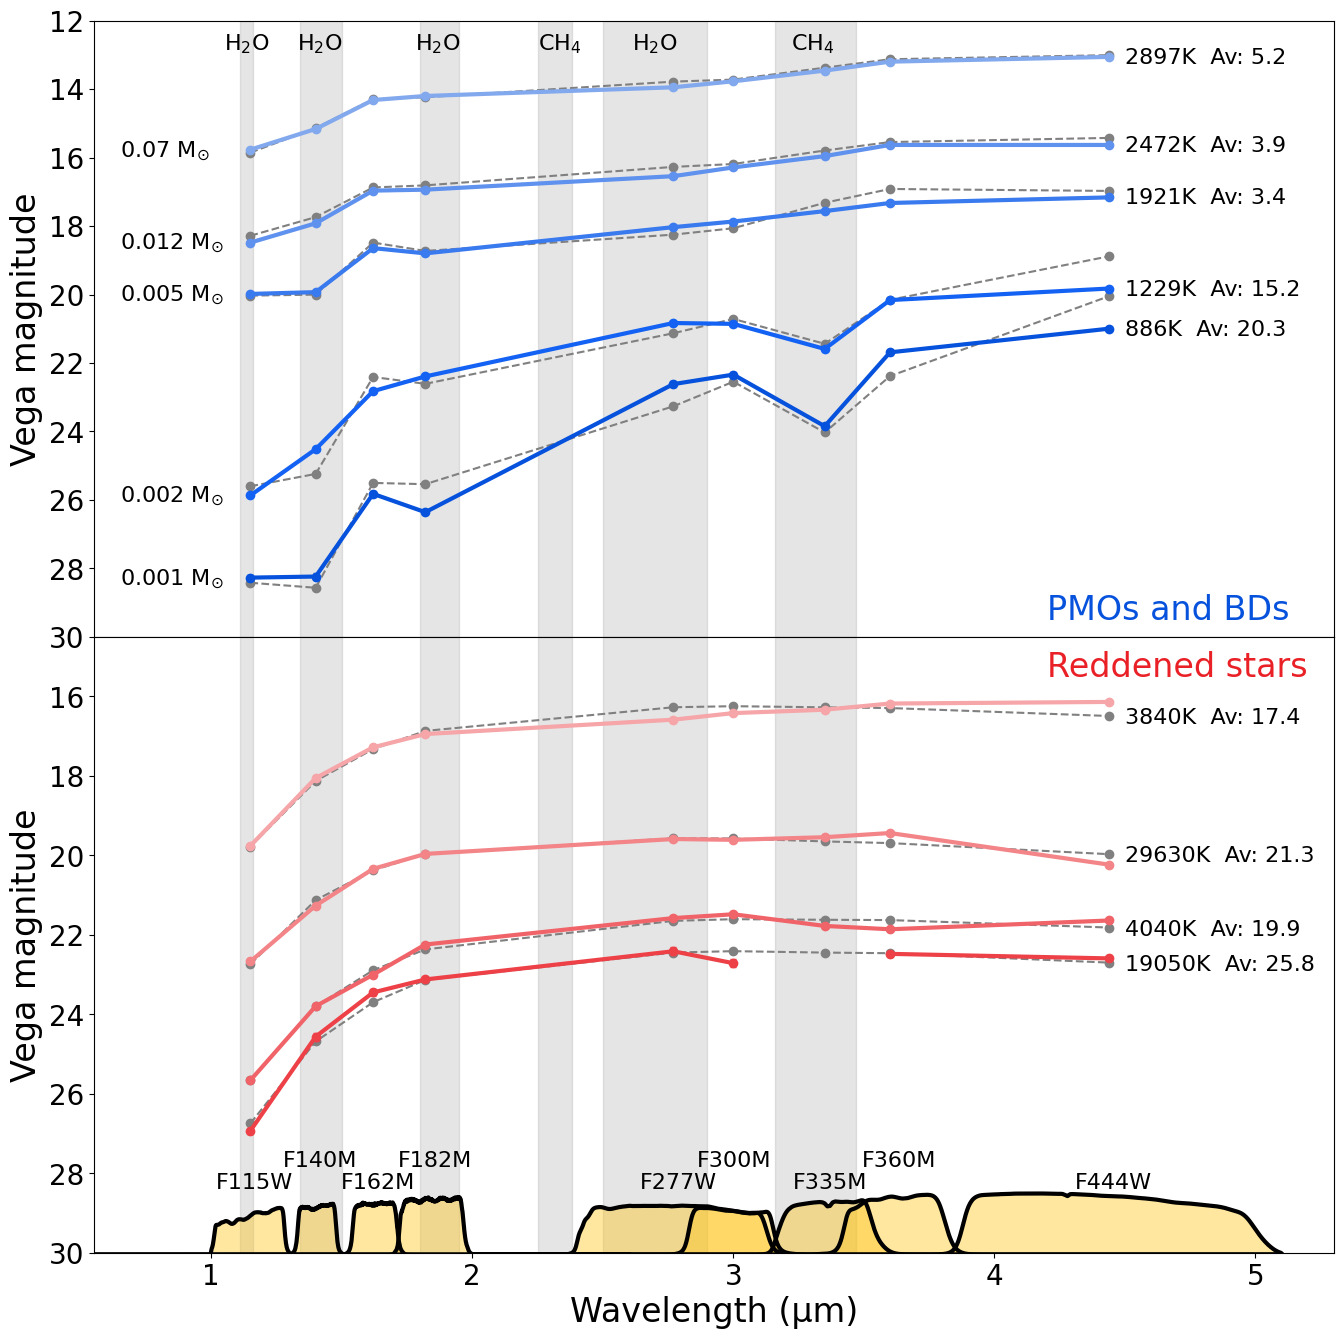
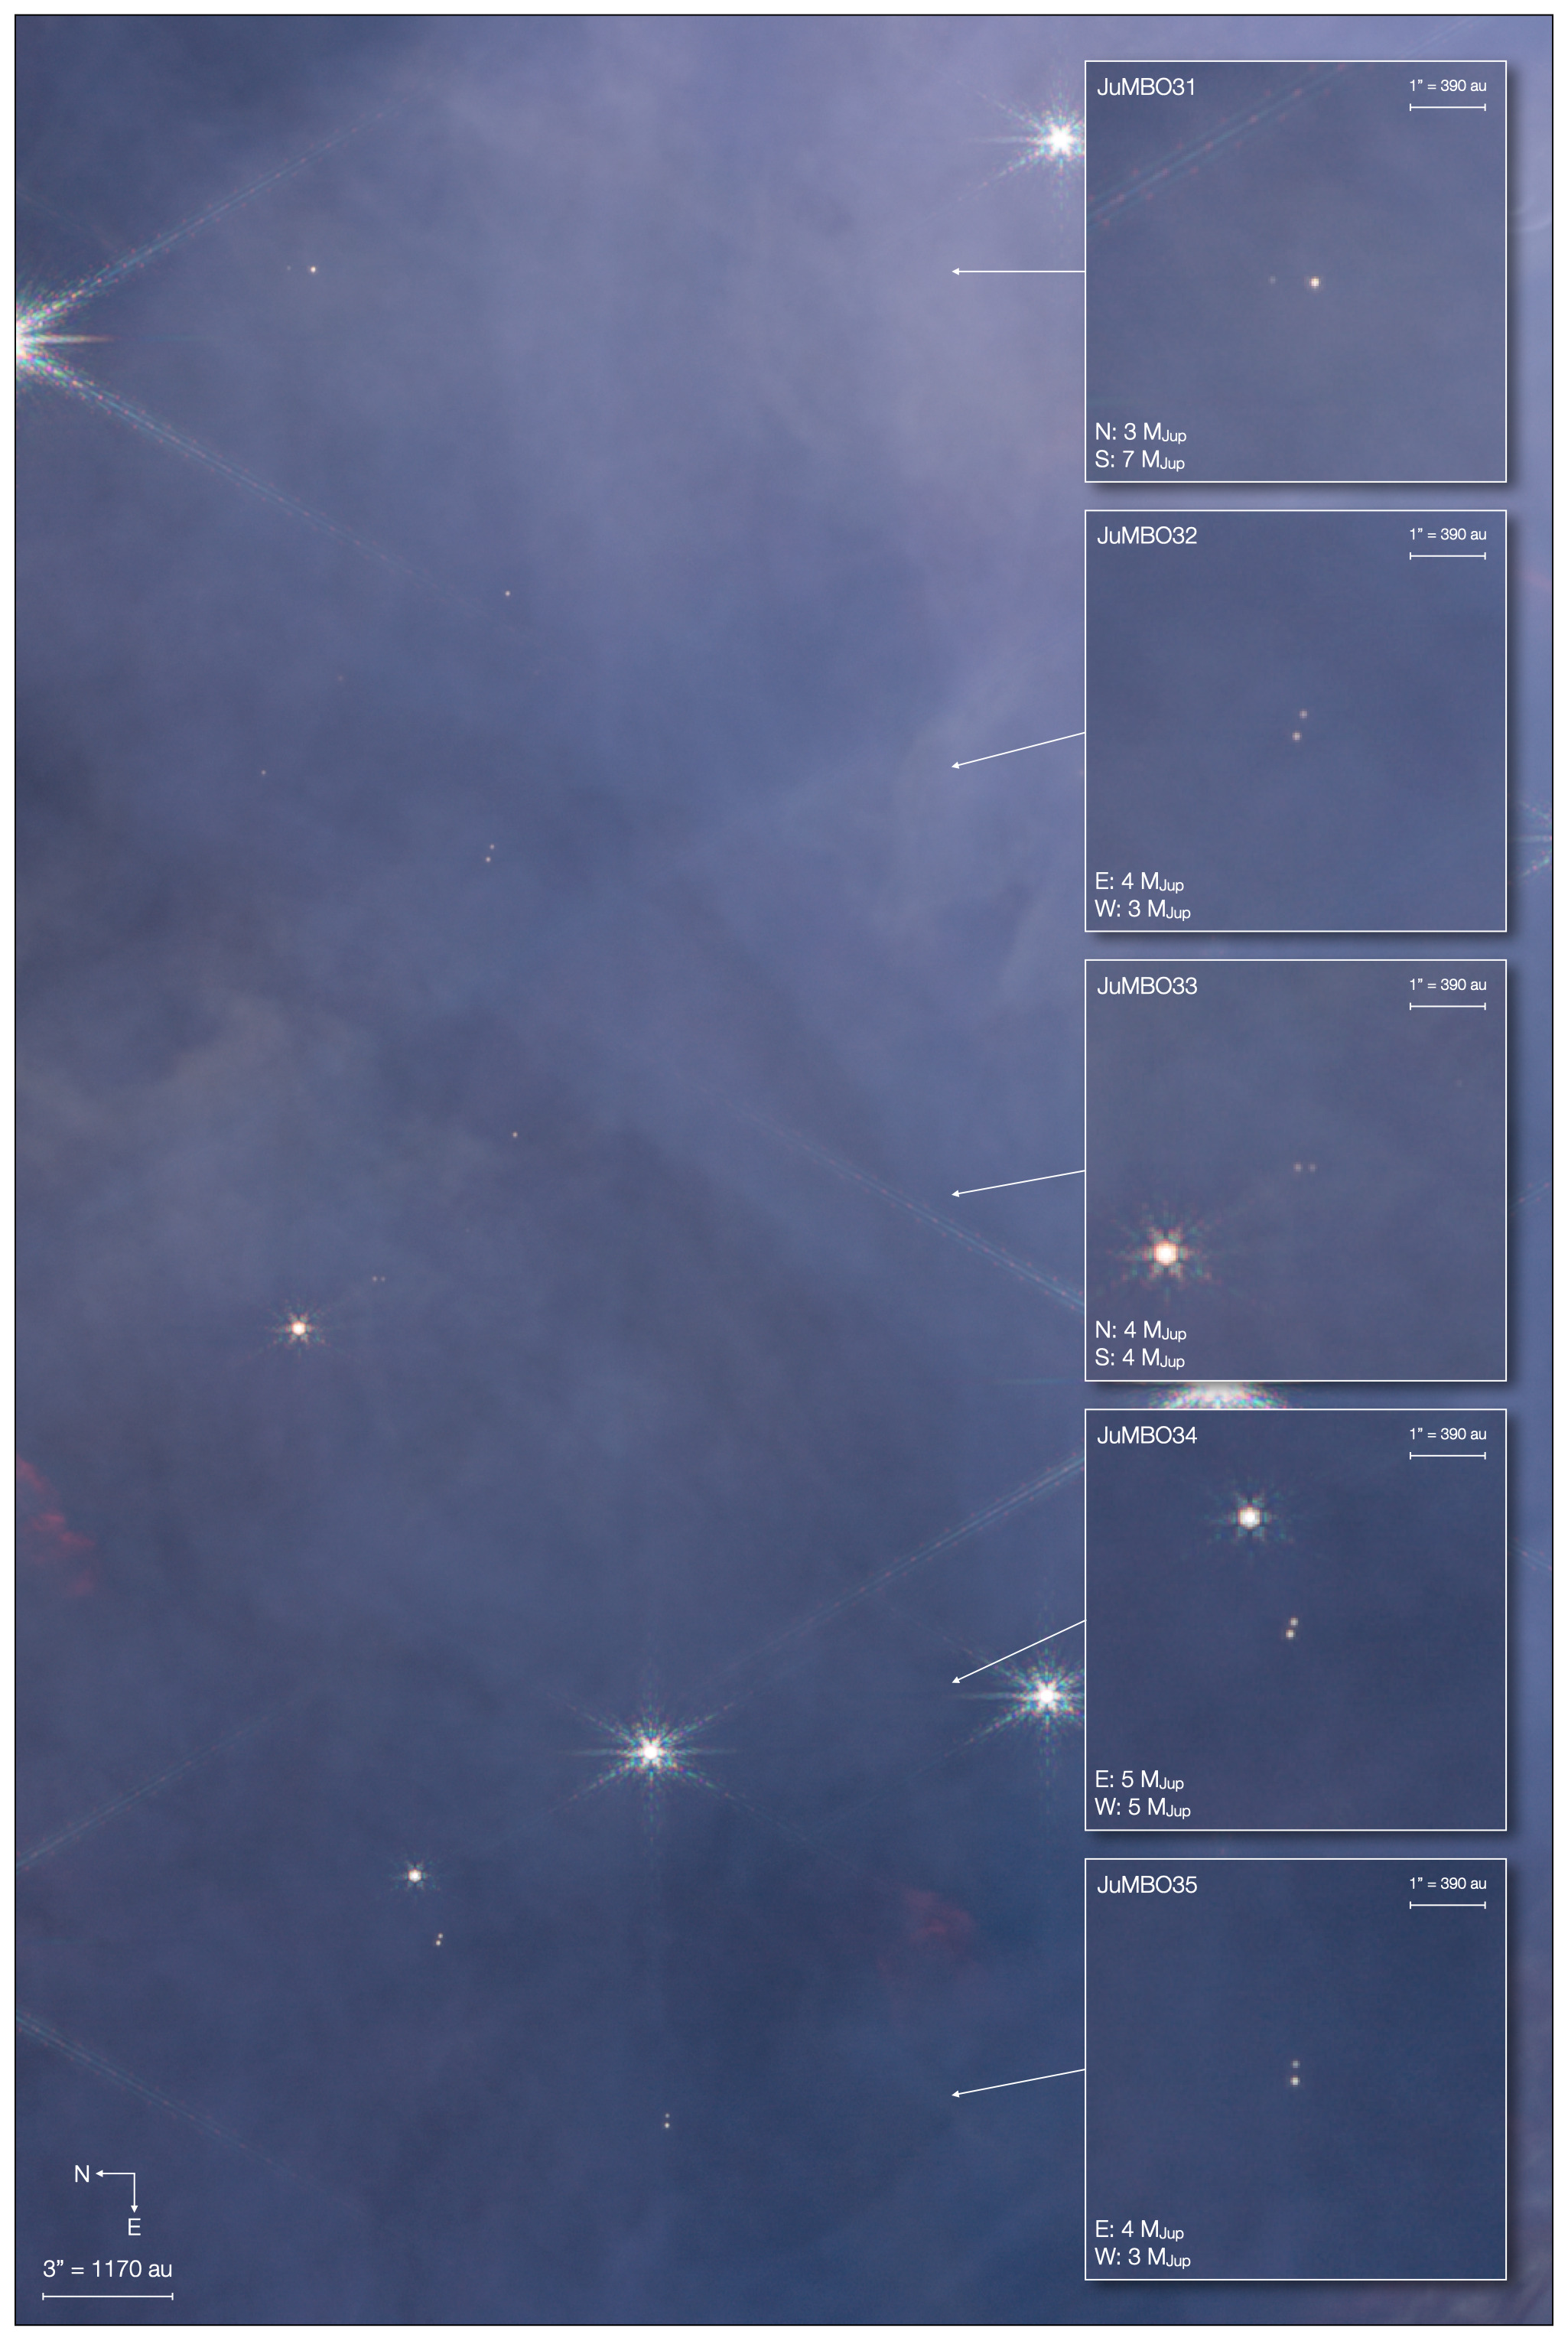
8 Circumstellar disks and proplyds
Virtually all of the circumstellar disks and ionised proplyds previously discovered by (O’Dell & Wen 1994; McCaughrean & O’Dell 1996; Bally et al. 2000; Ricci et al. 2008) and others in the region covered by the JWST survey are seen in many our images spanning the 1–5 m range, apart from in a small number of cases where the central star has become so bright in the near-infrared as to swamp the silhouette and/or ionised emission. Equally, there are not many new discoveries in this region, as the spatial resolution of JWST in the near-infrared is very close to that of HST at the key wavelengths around H.
That said, the new near-infrared images have an unprecedented combination of spatial resolution, sensitivity, and fidelity at these wavelengths, as well as tracing a variety of ionised, fluorescent, and shocked species that can deliver new insights into the nature of young protoplanetary disks in the region and how, in many cases, they are being impacted by their proximity to intense sources of UV radiation and strong stellar winds.
We have selected six previously known disks seen as silhouettes against the background nebula to illustrate the kinds of features that are seen in the JWST and which will be studied in more detail in future papers. Figure 9 shows these disks in the same combined short-wavelength colour scheme as in the main mosaic (Figure 3), while Figure 10 shows the same six disks as imaged in F187N, where the narrow filter isolates the Pa- line and reduces continuum contamination, this often yielding the best contrast between the silhouette disk and any other sources. These and many other disks and proplyds are also seen in many of the LW filters, albeit at lower spatial resolution and often with even more contamination due to the central star. Thus we do not show those images in this overview paper but do describe interesting features seen in them for these disks, and it is clear that those data will also be important to studies of the proplyds, including measurements of mass loss due to photoionisation and ablation.
- d114–626:
-
This is by the largest silhouette disk known in the Orion Nebula, spanning almost 1000 au in diameter, including tendrils seen to the NE, and can be seen in ground-based seeing limited images of the region. The disk is near edge-on and no trace of the central star is seen directly: its presence is revealed by polar reflection nebulae above and below the plane of the disk. In F187N, these are barely visible, showing the silhouette in best detail. Preliminary measurements of the intensity profile across the horizontal plane suggest that it is the same size as measured in the H line (McCaughrean & O’Dell 1996), confirming the results from earlier, lower-resolution Pa- measurements made using NICMOS on HST (McCaughrean et al. 1998; Throop et al. 2001). This achromatic profile was taken as an indication of significant growth in the dust grains in the disk beyond typical interstellar sizes, but truncation of the disk by external forces likely also plays a role at least at the southwest end.
In the SW colour image, the extremities of the silhouette look substantially similar to the F187N image and there is no strong evidence for colour shifts in the tenuous edges. Across the middle, the polar hoods have grown much brighter thanks to the inclusion of wider filters, but they are also very wide and relatively linear. There are significant colour shifts moving away from the midplane, from red to neutral, to blue on the E side, and from green to neutral to blue on the W side. This might indicate that the W is tilted slightly towards the observer, but caution is needed not to over-interpret colour shifts at the pixel level, as the SW colour composite was registered globally, not locally. The star in the NE corner appears reasonably well registered, but a better job could be done with local sub-sampling and registration.
- d182–413 (HST10) and d183–419 (HST17):
-
the former object is one of the best known proplyds in Orion (O’Dell et al. 1993) and is remarkable for the fact that its classic teardrop is not oriented away from Ori C or Ori A, the two dominant ionising sources in the region, and it may indeed be shaped by both (Shuping et al. 2014). Our new images confirm the essential near-infrared emission-line features revealed by NICMOS on HST (Chen et al. 1998) and the ground-based Keck laser AO observations by Shuping et al. (2014), but much more clearly. Namely a ionised outer shell with a brighter edge to the N, bright H2 emission surrounding the dark edge-on silhouette disk, and PAH emission (as seen in F335M) from the disk (there is no evidence of a dark core in the JWST PAH data as seen by Shuping et al. (2014), but perhaps the 10-m diameter of Keck wins over the 6.5-m diameter of JWST in this case) and along the E side of the body, There are bright ionised tendrils or spikes extending away from the main body of the ionised shell, predominantly to the N, and there are bright neutral spots on either side of the dark disk which are likely polar reflection nebulae. Further out, the southern knots of the HH517 outflow driven by d182–413 (Bally et al. 2000) are clearly seen in the F187N data and there is an ionised knot roughly the same distance to the N as HH517 s3 is to the S which might be the counterflow. d183–419 or HST17 lies just below d182–413 in projection and also shows a silhouette disk with polar reflection nebulae. The ionised envelope looks quite different though with more of a jellyfish shape, the top of the jellyfish pointing NW toward Ori C and the SE end much more open. There is tentative evidence for a spike emerging orthogonal to the disk to the NW, perhaps indicating a jet. The JWST F212N image also shows a clear H2 envelope surrounding the dark disk, as also noted by Chen et al. (1998).
- d072–135:
-
this is a beautiful example of a circumstellar disk undergoing photoevaporation combining many key features. It was first detected by (Bally et al. 2000) and imaged again in the visible by the HST Orion Treasury Programme (Ricci et al. 2008; Robberto et al. 2013), but is now revealed in much more detail by JWST. The disk is seen clearly as a silhouette with the central star and/or a polar reflection nebula on the S side, indicating the tilt of the disk. In the F187N image, there is a classic teardrop-shaped ionised shell oriented toward Ori C with the rounded front side very close to the edge of the disk and the tadpole tail behind. There are faint spikes of ionised emission pointing orthogonal to the shell, as seen for d182–413. Approximately 1000 au ahead of the star there is a clear ionised bowshock. In the SW colour image, much more is seen, with a layer of H2 emission on the S side of the disk and also extending into the tail of the tadpole. On the N side of the disk, there is blue-green emission, indicating a mix of ionised hydrogen and [Fe II]. This also extends into the tail, but separately from the H2 emission. Finally, the tail of d072–135 is uniformly green in the LW composite, indicating PAH emission in the F335M filter.
- d294–607:
-
another classic example of an edge-on circumstellar disk seen in absorption against the background nebula, with polar reflection nebulae on either side, a little brighter on the N side indicating a slight tilt. In the F187N image, there is nothing else to be seen and since disk is relatively far from any other sources, an early preview of this image released on social media garnered some philosophical attention (e.g., Koren 2022). But the addition of the other wavelengths tells a slightly different story. d294–607 is not just a passive protoplanetary system far from the madding crowd: first, it has a clear evidence for a faint jet in F162M, indicating [Fe II] emission, extending roughly an arcsecond to the N, with a slight hint of a counterjet to the S. And the whole disk is wrapped in mix of blue and red emission, indicating both ionised and molecular hydrogen, with a well-defined edge to the WNW in the direction of Ori A, which lies at a projected distance of pc away. So even at this distance, the OB stars can impact the evolution of protoplanetary systems.
- d203–506:
-
this is a rather unusual system close to the Bright Bar and thus not that far from the Trapzium, but which seems to show no evidence for an ionised shell or rim. Rather, the silhouette disk seen clearly in F187N is wrapped in a ‘shroud’ of H2 emission, albeit in a peculiar shape that is extended on the NW side where also a bright white region is seen, likely a polar reflection nebula, with a fainter counterpart on the SE side. There is a narrow [Fe II] spike emerging to the NW and connected to a flask-shaped region of more [Fe II] emission starting roughly 500 au to the NW, and there is the slightest hint of green to the SE. Combined, these make up the HH520 jet. This whole system has recently been the subject of comprehensive studies with the VLT by (Haworth et al. 2023) and JWST as part of the Early Release Science programme PDRs4All (Berné et al. 2022, 2023). Interestingly, the star to the NNW of d203–506 also hosts a proplyd, 203–504, with a classic teardrop shape oriented towards Ori A. There is only a slight hint of this proplyd in the JWST data thanks to brightness of the central star, a reminder of the limitations of near-infrared imaging observations.
- d142–301:
-
another of the very large proplyds with a silhouette disk embedded in an ionised shell, discovered in the original HST surveys (Bally et al. 2000). The outer shell has a blunt head parallel to the plane of the disk, rather than a rounded one such as seen in d072–135, and it has a very long, wiggling tail with a bright rim and dark core in F187N. There is clear evidence for an ionised jet extending perpendicular to the disk to the E and well beyond the main ionisation front, and as with some of the other ionised proplyds, there are spikes of ionised emission from the shell. In the SW colour image, the tail turns brown-ish, suggesting extinction against the background nebula, while in the LW image, it is uniformly green, again indicative of PAH emission (see the top-right corner of Figure 6b).
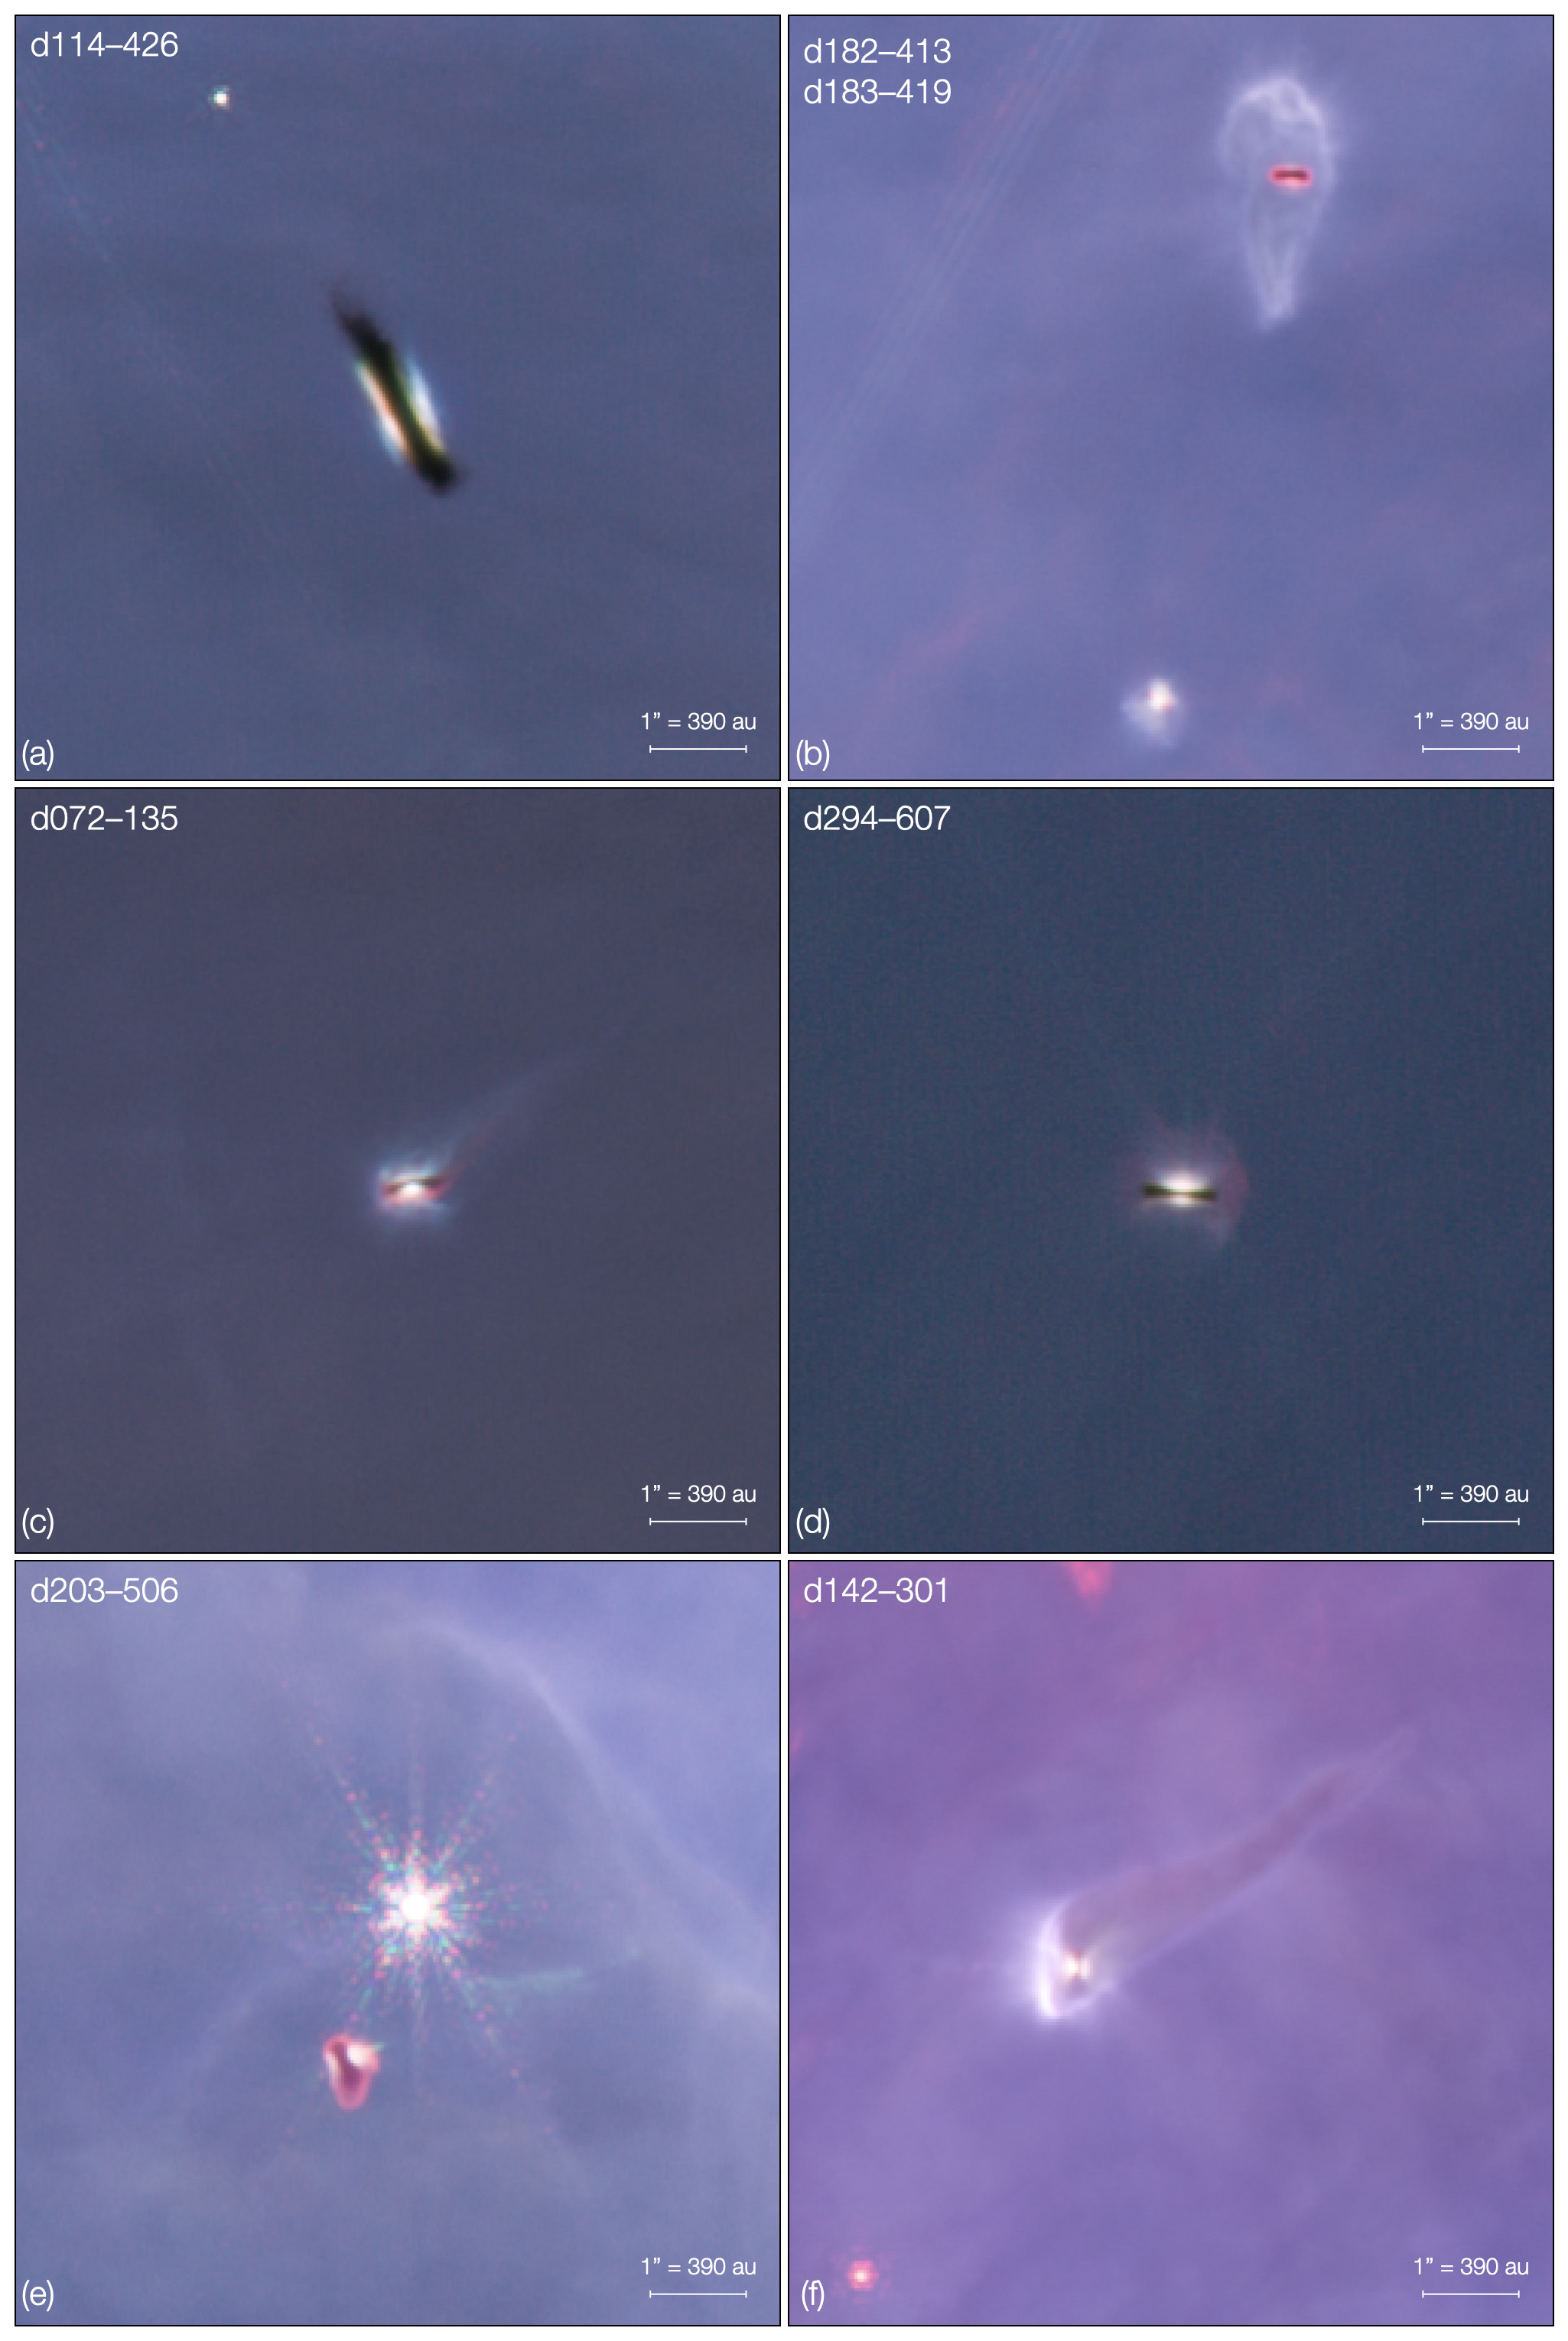
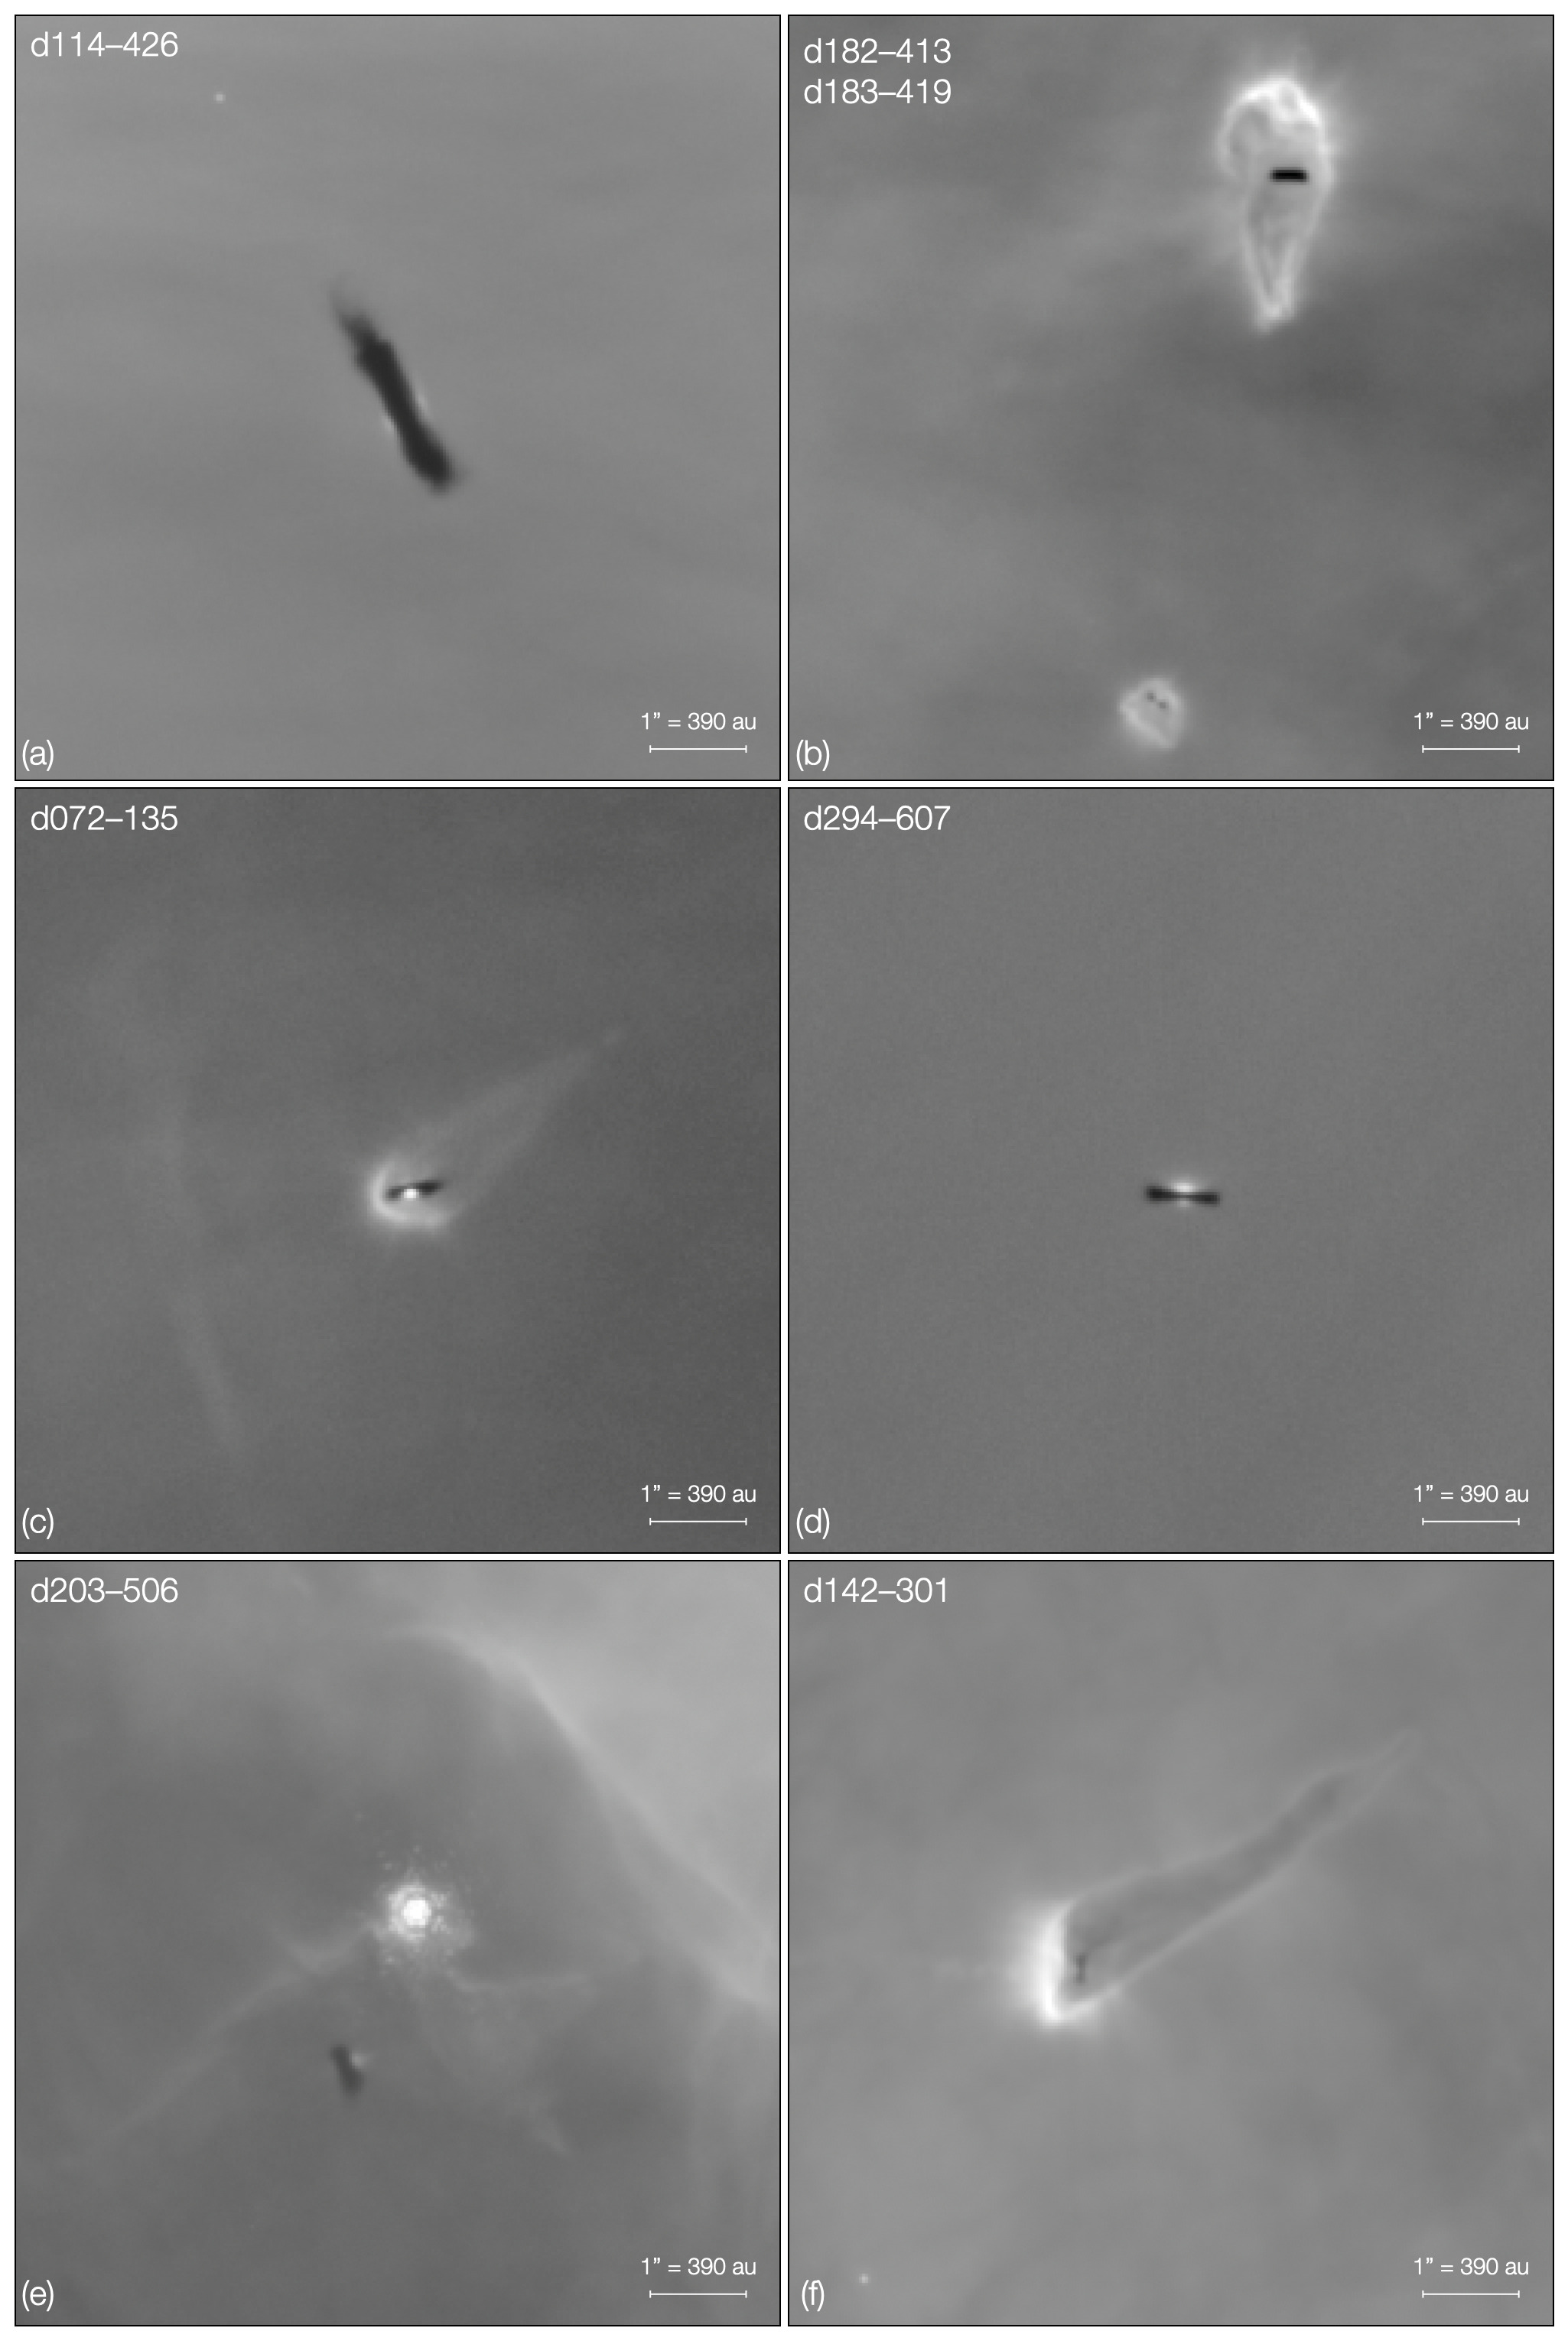
9 The BN-KL region
The development of infrared astronomy through sensitive detectors and telescopes placed on high, dry sites, made it possible to start surveying star-forming regions. One of the earliest discoveries was of an bright near-infrared source to the NW of the Trapezium stars without an optical counterpart: this became known as IRc1 or more commonly, BN for the discoverers (Becklin & Neugebauer 1967). Longer wavelength observations made soon after revealed a more extended region of mid- to far-infrared emission that is known as KL, also for its discoverers (Kleinmann & Low 1967).
The combined BN-KL region is a region of star formation embedded in a molecular ridge, OMC-1, behind the Orion Nebula and Trapezium Cluster, and subsequent surveys at ever higher sensitivity and spatial resolution using the largest telescopes, latest detector technology, and advanced imaging techniques in the near-, mid-, and far-infrared, and in the radio, have revealed a complex region containing multiple embedded sources, some point-like, some extended, with a prodigious combined infrared luminosity (Rieke et al. 1973; Downes et al. 1981; Lonsdale et al. 1982; Minchin et al. 1991; Dougados et al. 1993; Menten & Reid 1995; Gezari et al. 1998; Robberto et al. 2005; Sitarski et al. 2013).
Our JWST data cover the region from 1–5 m and document the huge shift from the Orion Nebula region being dominated by the Trapezium OB stars at the shortest wavelengths to the BN-KL region taking over in the background beyond 3 m. Figure 11 shows extracts from the SW and LW composites with the dynamic range and contrast adjusted to reveal the key features in more detail, with a closer zoom into the LW composite to identify the various sources in the heart of BN-KL. BN itself is detected at all JWST wavelengths, starting as an innocuous faint point source with a small nebulosity to its NE in the F115W image, growing brighter and illuminating what appears to be a large-scale turbulent reflection nebula extending NE and W, with fainter nebulosity to the NW, then to the SSW, and at longer longer wavelengths to the E. This nebulosity is seen in yellow and orange colours both the SW and LW composites.
Superimposed on that is a deeper red and crimson in both composites, with a rather different turbulent: this is emission from shocked molecular hydrogen in the F212N (SW) and F335M, F444W, and F470N (LW) that extends into huge fingers of emission to the N to W quadrant and also in the S to E quadrant above the Trapezium: this is the famous high-speed “explosion” from the BN-KL region revealed early infrared imaging observations of the region as described by Allen & Burton (1993). We discuss this in more detail below in Section 10.
In the LW composite, BN is dominant and there is a clearer separation between the yellow-orange reflection nebulosity and the crimson H2 emission, with clear effects due to dust extinction in a belt extending NE–SW across the KL region to the SE of BN. Many of the sources in the inner region are bright and saturated in much of the LW data, but it is still possible to make a clean identification of many of the well-known sources and place them in context with the extended nebulosity. The presumed central engine of the region, Source I (Menten & Reid 1995) remains invisible, as it was in the higher spatial resolution Keck AO images of Sitarski et al. (2013). But the much greater fidelity of the JWST imaging and sensitivity to the extended nebula should help with the modelling of the region, with the red ridge around the location of Source I thought to represent one side of a dense circumstellar disk surrounding it.
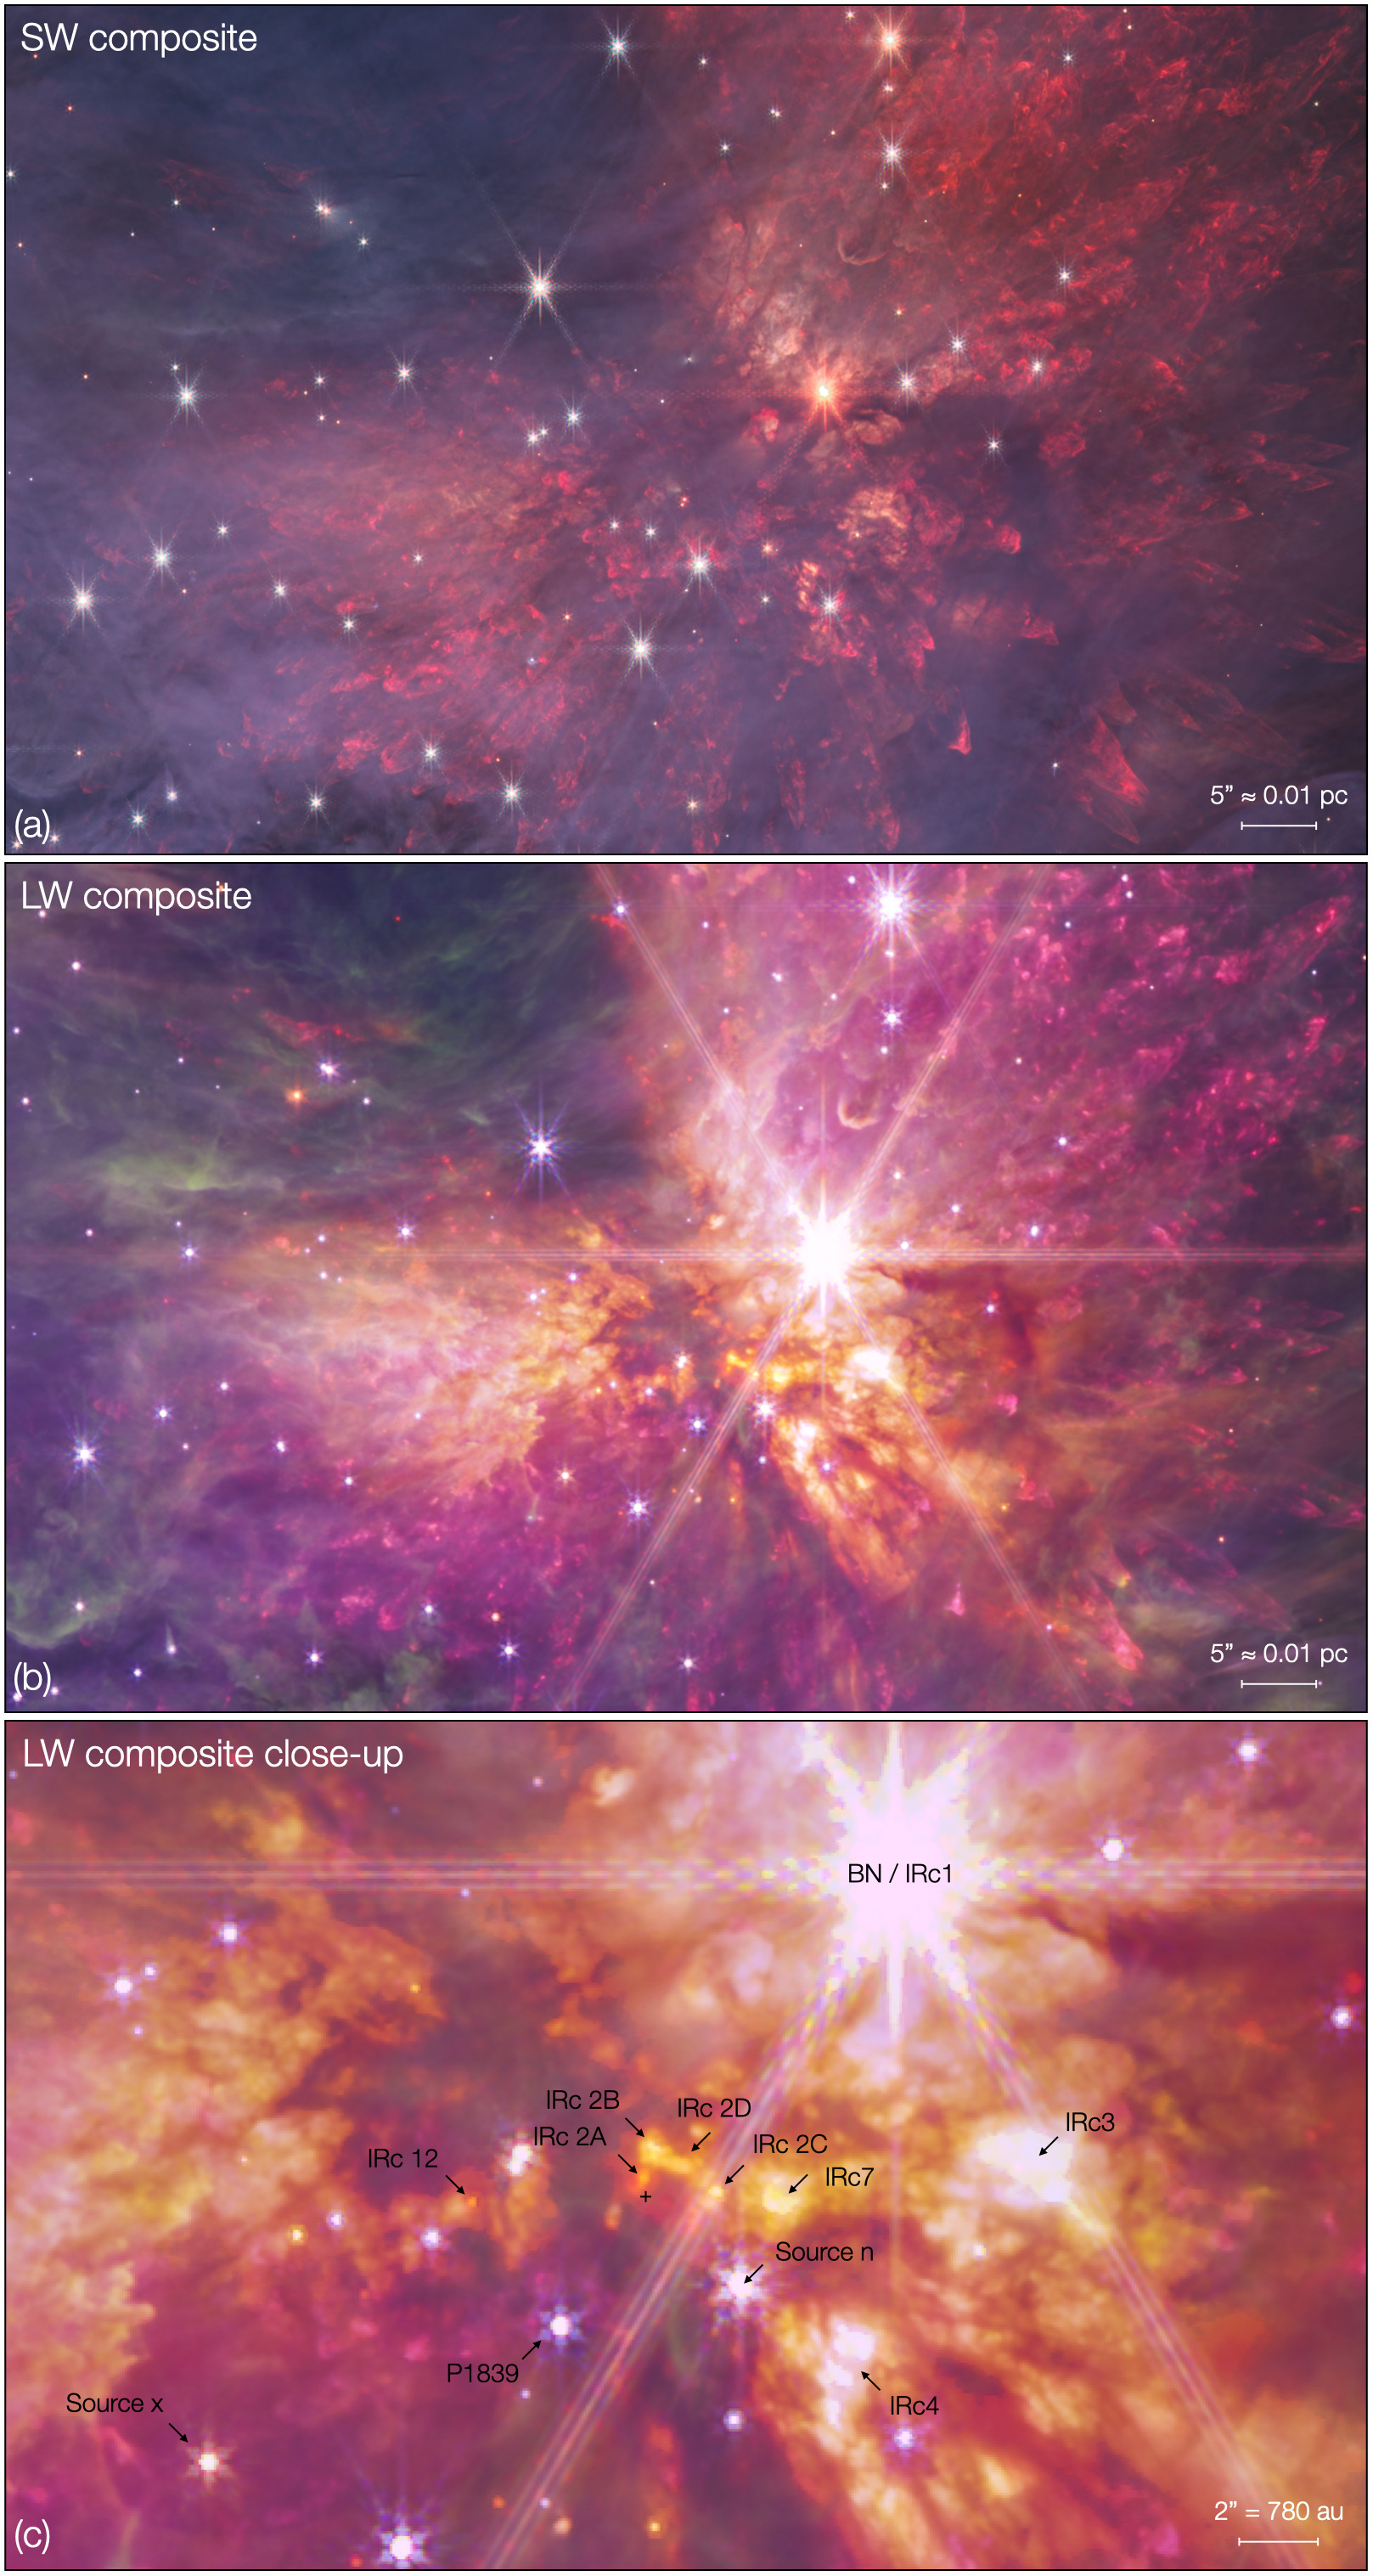
10 The OMC-1 outflow
The BN-KL region has long been known to be associated with molecular emission, with two broad peaks of near-infrared H2 emission to the NW and SE of BN seen in early infrared maps (Gautier et al. 1976; Grasdalen & Joyce 1976; Beckwith et al. 1978), and broad, high-velocity CO emission in millimetre maps (Kuiper et al. 1975; Kwan & Scoville 1976). Modelling of the line intensities showed that shocks were involved, yielding an excitation temperature of around 2000 K (Beckwith et al. 1978), as opposed to radiative excitation and fluorescence (Black & Dalgarno 1976). Beckwith et al. (1978) concluded that the constant luminosity of the infrared sources in the region were insufficient to power the emission and that “a cataclysmic event such as supernova explosion” must be responsible.
The presence of outflows to the NW of the Trapezium was first noted through the discovery of optical Herbig-Haro objects (Axon & Taylor 1984), while higher spatial resolution raster mapping in the v=1–0 S(1) line of H2 at 2.12 m suggested that that emission also broke up into a series of “fingers” or “molecular jets” (Taylor et al. 1984). Subsequent infrared imaging confirmed that these fingers were a series of bowshocks and wakes over a wide range of angles, trailing behind fast-moving “shrapnel” from an explosive event (Allen & Burton 1993). The “bullets” were seen to be emitting in the higher-excitation [Fe II] line at 1.64 m, but their origin remained unclear: they may be discrete objects flung from the source of the explosion, or they may arise in a highly-energetic fragmenting stellar wind bubble more distant from the source of the explosion (Stone et al. 1995; McCaughrean & Mac Low 1997; Dempsey et al. 2020).
Proper motion analyses showed that the [Fe II] bullets and trailing H2 wakes are expanding at speeds on the order of 200 km s-1, albeit some are expanding more slowly, which may be due to a projection effect, given the wide angle over which the fingers extend (Lee & Burton 2000; Bally et al. 2011). These velocities and the spatial extent of the fingers from the source region suggest ages significantly less than 1000 years, although in more detail, the range of dynamical ages determined in this way is inconsistent with a single explosive event and ballistic motion. These differences can be reconciled when the interaction between the shrapnel and the surrounding medium is taken into account (Rivera-Ortiz et al. 2019).
The fingers, bullets, and wakes have also been studied extensively in the near-infrared through polarimetry and spectroscopy (e.g., Burton et al. 1991; Minchin et al. 1991; Tedds et al. 1995, 1999; Youngblood et al. 2016), as well as ever higher spatial resolution narrow-band H2 imaging (Stolovy et al. 1998; Kaifu et al. 2000; Cunningham 2006; Bally et al. 2011, 2015). Combined with similarly high-resolution molecular maps (Zapata et al. 2009; Bally et al. 2017) and the link to optical Herbig-Haro objects thought to arise where some outflow fingers emerge from the molecular cloud and into the Orion Nebula (Graham et al. 2003), these studies have revealed the full outflow complex and its properties in much more detail.
The current best scenario for its origin involves an interaction and/or merger between massive stars in the OMC-1 core about 500 years ago (Tan 2004; Bally & Zinnecker 2005; Zapata et al. 2009), ejecting BN and Source I at high velocity, the liberated energy powering a large-scale “Hubble flow” within 50 arcsec of the origin, and bullets and wakes extending at high speed further out to the N and NW, as well as to the S and SE (Bally et al. 2017). Source x (see Figure 11) is also moving at high velocity away from the centre of the explosion and may also have been involved in the dynamical decay.
Our new JWST images of the outflow show it in unprecedented high resolution and high fidelity across the 1–5 m range. The large SW and LW composites (Figures 3 and 4 show the full extent of the fingers, mostly traced in the H2 lines of v=1–0 S(1) at 2.12 m and v=0–0 S(9) at 4.69 m in the F212N and F470N filters, respectively, but with additional emission in the wide- and medium-band filters, including the v=1–0 O(5) 3.23 m H2 line in F335M, [Fe II] at 1.64 m in F162M, and the CO (1–0) R- and P-branch bands in F444W. There is also some ionised hydrogen emission at the very tips of the fingers due to Pa- at 1.87 m in F187N. Given this mix of filters and lines, H2 emission is mostly red in the SW composite and more purple in the LW composite. [Fe II] shows up as green in the SW image, while the tips turn green-white once Pa- emission is added, and CO shows up as yellow in the LW composite.
The extent of the outflow to the N and NW is clear in both composites, but the counterflow to the S and SE can also be traced through fingers behind the Trapezium, as seen more clearly in the ALMA molecular images. The inner part of the flow to the NW, within arcsec of Source I and thus coincident with the inner Hubble Flow of Bally et al. (2017), appears more complex and turbulent, and in the LW composite, many of the purple H2 shocks have more yellow tips, indicating additional CO emission, similar to that seen in the brightest bowshocks of the much less energetic HH211 protostellar outflow in Perseus also recently studied with JWST (Ray et al. 2023). This can be seen more clearly in panel (b) of the blow-ups of the BN-KL region (Figure 11).
By contrast, the extended fingers to the northwest are perhaps best seen in the SW composite, as shown in Figure 12, not least because of the higher diffraction-limited resolution. The dominant hue is red due to the 2.12 m H2 line, but many of the bowshocks show a more yellow rim, likely indicative of other, lower intensity H2 lines in the shorter wavelength filters. The tips of many of the fingers turn green, indicative of [Fe II] 1.64 m emission, and green-white at the tips as Pa- 1.87 m is added. A particularly notable case in HH603, where green [Fe II] knots appear to be detached and extended well beyond the initial finger, although it is also possible that two separate outflow components are seen superimposed along the line of sight.
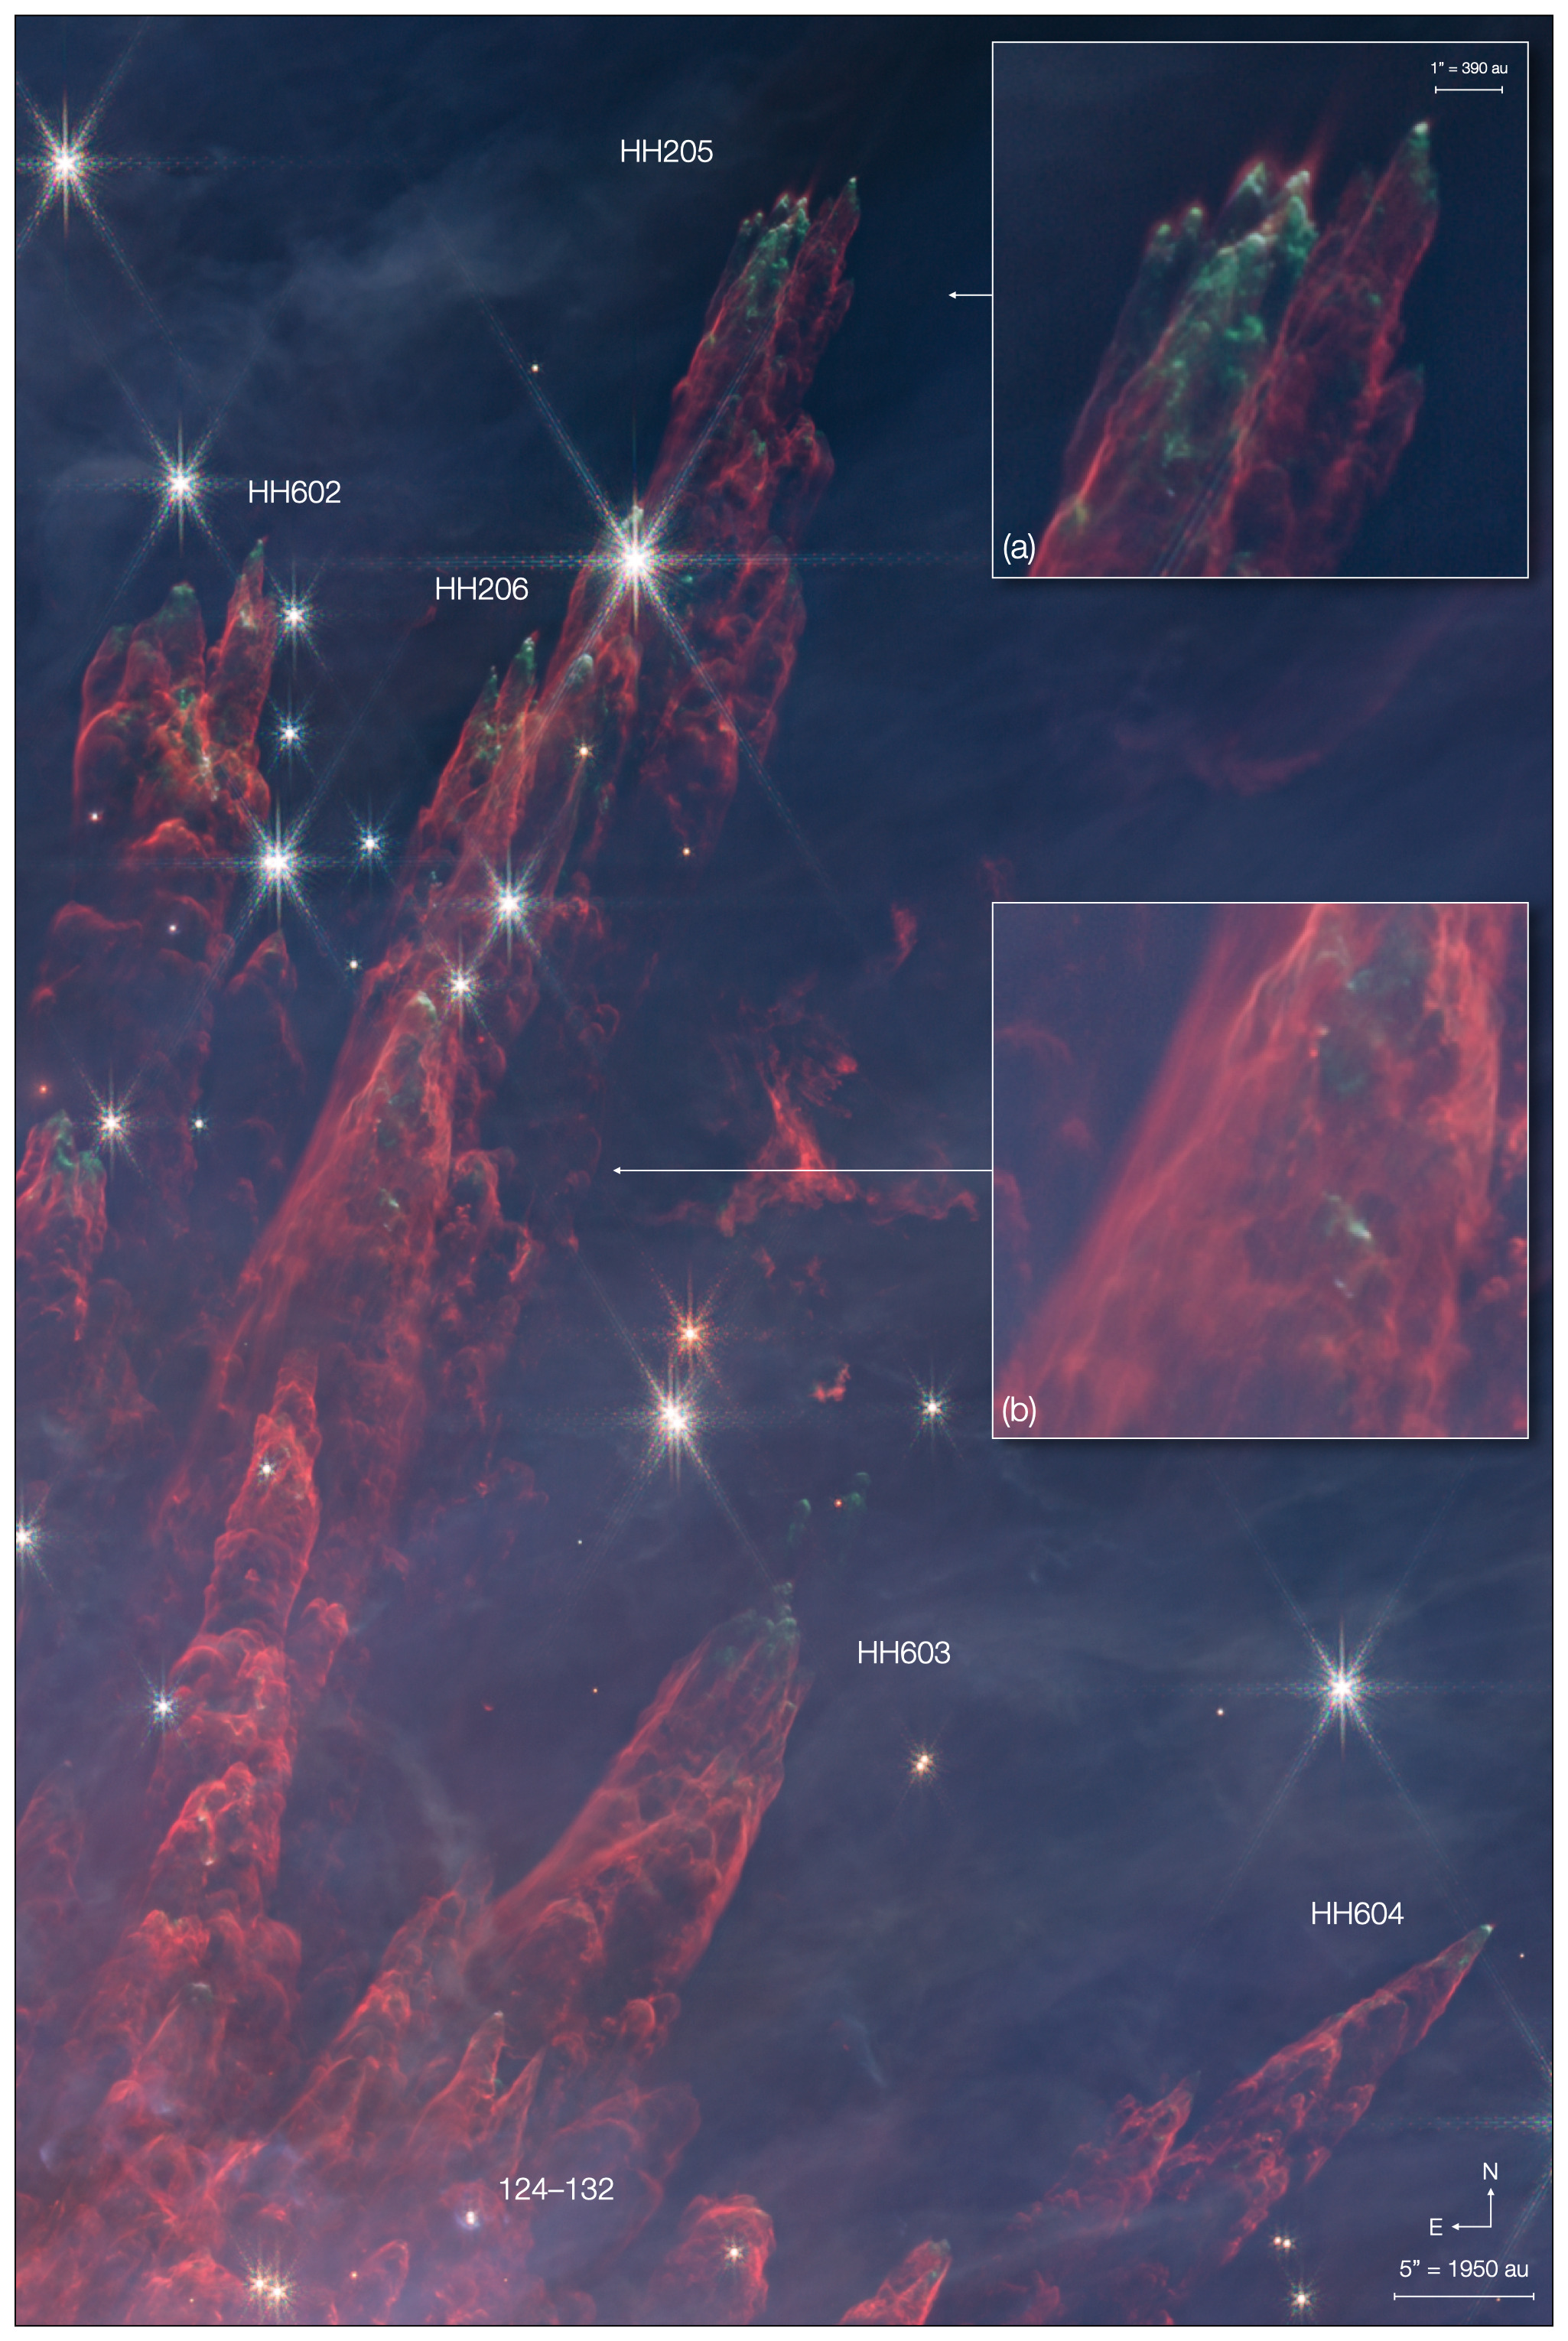
The decline in H2 emission towards the tips is thought to be due to the dissociation of molecular hydrogen at the higher temperatures there, but unexpectedly and remarkably, the JWST images show red molecular hydrogen emission appearing beyond the [Fe II] in many cases. This H2 emission appears to be wrapped around the tips and even extending in spikes of up to 200 au in the direction of motion of the fingers. This most clearly seen in HH205 (Figure 12(a)), but HH206 and HH602 show the same effect, albeit with the H2 spikes slightly off the corresponding expansion vectors.
One possible origin for this additional “pre-shock” H2 emission may be fluorescence from molecular hydrogen in the molecular cloud ahead of the shock, excited by intense emission from the tips of the bullets. One of the visible Herbig-Haro objects in the region, HH210 (Axon & Taylor 1984; Taylor et al. 1986), is moving at 425 km s-1 and is known to emit soft x-rays (Grosso et al. 2006). HH210 is clearly seen in the full SW composite to the E of the largest H2 fingers, but almost entirely in green, i.e., in [Fe II] and Pa-: there is no associated H2, as HH210 has fully emerged into the Orion Nebula. As Dempsey et al. (2020) note, it is possible that the bullets associated with the H2 fingers also emit in x-rays, but the latter are sufficiently absorbed by the intervening molecular cloud to render them invisible. Why the “pre-shock” H2 forms spikes in the direction of expansion remains to be investigated.
Finally, it is worth briefly mentioning the structure of the fingers further down the H2 wakes. These are mostly turbulent, breaking up into multiple arcs and bowshocks, consistent with the idea that the H2 is shock excited. But the high resolution of JWST also reveals that in some places, the H2 emission is much smoother, almost laminar in appearance (see Figure 12(b)). This may yield further insight into the propagation of the bullets and their wakes through the molecular cloud and how the H2 is excited.
Beyond that, comparison of these new images with archival high-resolution AO observations of the fingers in H2 (e.g., Bally et al. 2015) should give us a more accurate picture of the velocity field on much smaller scales than previously possible (Bally, McCaughrean, & Pearson 2023, in preparation). Follow-up second-epoch JWST observations in future years will improve matters even further.
11 Other jets and outflows
While the massive OMC-1 outflow is most eye-catching in these new JWST images, it is by no means the only one in the region, as many young low-mass stars and embedded sources are also active. A wide array of optical jets and outflows have been catalogued and studied (e.g., Axon & Taylor 1984; Bally et al. 2000; O’Dell 2001b; O’Dell & Doi 2003; Henney et al. 2007; O’Dell & Henney 2008; O’Dell et al. 2008) and many of them have counterparts in the JWST data, mostly seen in ionised tracers including Pa- and [Fe II]. Making detailed comparisons between the optical and infrared emission to study excitation, extinction, and dynamics will necessarily have to be left to a future dedicated paper. Here though we draw attention to a number of flows that show shocked H2 emission in the JWST data, although these are just a subset and many others can be readily identified in the images. We have chosen seven example flows associated with apparently low-mass stars or binaries and also show the region surrounding OMC-1S and to its west, illustrating the great complexity there due to many overlapping flows. The flows are shown in Figure 13 and described below: the putative source of each flow is labelled using the nomenclature scheme of O’Dell & Wen (1994) with a prefix of ‘o’ for outflow.
Several of these flows are bent or C-shaped, similar to some seen in HST visible imaging of irradiated flows in the outskirts of the Orion Nebula (Bally & Reipurth 2001; Bally et al. 2006). It will be interesting to see whether the same proposed bending mechanisms invoked for the irradiated jets also apply to outflows seen in molecular material and thus presumably more embedded. At first sight, this may not be the case, as the C-shaped outflows described below do not bend away from the Trapezium stars.
- o057–305:
-
This object is identified as a point source in many previous surveys, but is clearly seen in the JWST images as a small reddened bipolar reflection nebula, with a more extended, bluer bipolar nebula extending to at least 750 au on either side. There is no evidence for a silhouette disk in F187N, but the western inner nebula is the brighter of the two, indicative of the tilt of the disk. Correspondingly, a series of H2 knots and bowshocks are seen to the W, clearly curving southwards in a C-shaped flow. There is another larger knotty bowshock to the SW au from the source. There are two candidates for counterflows on the E side: one is a small region of H2 roughly equidistant to the SSE, which indicate the jet bends southward on that side two, but the other candidate is a peculiar umbrella-like H2 object to the NE, with a ‘handle’ and semi-circular ‘canopy’. In that case, the flow would bend N on the E side. Of course, it is entirely possible that neither object is related to 057–305. A molecular cloud core was detected at the location of the central source by Shimajiri et al. (2015).
- o4538–311:
-
This is a textbook example of a circumstellar disk seen edge-on, with two extended, slightly flaring reflection nebulae with hints of reddening towards the disk plane. The new JWST images show this in much more detail than the HST discovery images (Ricci et al. 2008). The reflection nebulae are roughly 0.8 arcsec or au in diameter. Unlike many similar disks in the Orion Nebula, however, there is no evidence for a silhouette disk in F187N simply because it lies far from the core region and the ionised background is weak there. There are two large outflow lobes signalled by H2 emission extending au to the NE and SW, with a brighter, more neutral knot at the end of the NE lobe, implying emission from other lines there. There is no Pa- emission associated with the outflow, however. The S-shaped mirror symmetry in the two lobes might be indicative of precession at the source. There are two additional H2 knots (one just outside the frame) to the NE, although not along the apparent axis of the main flow. The bright horizontal green stripe is a diffraction spike from a nearby star.
- o013–220:
-
This system is a close binary system surrounded by another large bipolar nebula extending to at least 2000 au on either side. It has a complex asymmetric structure near the centre, much brighter on one side of the binary than the other. Similarly, the faint H2 emission seen inside the reflection nebulae appears to show a bent, C-shaped flow, with each side again bending to the S. There is a bright H2 bowshock 2500 au out on the W side of the flow. X-ray emission has been detected from the central system (COUP155, Getman et al. 2005).
- o011–304
-
: The central source is a relatively bright M dwarf variable, V2107 Ori, seen in many optical, infrared, and x-ray surveys (e.g., JW202, COUP149, Jones & Walker 1988; Getman et al. 2005). There is no evidence for resolved circumstellar material in any of our images, but it easily be swamped by the bright star. It could also be that the true source lies behind the optical star in the molecular cloud. In any case, there is a clear H2 outflow extending at least 5000 au to the E and W, and yet again bent in a C-shape to the S on both sides with an angle between the two lobes of ∘. There are knots of ionised emission to the NW, but these are likely unrelated.
- o002–409:
-
The central source is another M-type variable, V2099 Ori, with a fainter companion 1.5 arcsec to the N (source 2290 of Da Rio et al. 2009). There is a clear H2 flow to the N with two sections extending to au, again bending in a C-shape, but this time to the W. From the geometry, it seems clear that the brighter source is driving the flow. There is some very faint emission in H2 to the S, but no obvious counterflow.
- o132–425:
-
This is another known low-mass star seen in the optical and infrared (Muench et al. 2002, MLLA200) which is now seen to exhibit extended structure more reminiscent of young outflows with cavities expanding away from the source to the NE and SW before converging again in brighter bowshocks. The flow does not bend like many others in Orion, but is asymmetric in length, extending 3400 au to the NE and almost twice that distance to the SW. The SE bowshock is bright and only emitting in F212N; the NE bowshock shows some hint of green [Fe II] emission as well.
- o038–454:
-
The driving source here is another bright M-dwarf variable, V375 Ori, also seen in many optical, infrared, and x-ray surveys (e.g., JW236, COUP200, Jones & Walker 1988; Getman et al. 2005). There are H2 knots on either side extending to at least 4000 au, with a possible further knot to the SW at double that distance. Once again, the jet is C-shaped, bending downwards to the S on both sides, The well-known windblown bowshock and flow around the bright star LL Ori (Bally et al. 2000) is seen in the same region: the bright high proper motion knots n1 and n2 are seen clearly emitting in [Fe II], as are knots s1 and s2 (out of the frame). The broader ionised flows linked to LL Ori are also seen, with n3 lying beyond 038–454. Finally, there is an interesting linear filament to the NNE of 038–454 which is emitting in [Fe II] (green) with a roughly parallel H2 partner (red) just to its E. Geometrically at least, these filaments appear unrelated to any of the sources in the field.
- OMC-1S flows:
-
Finally, we include an image of the region around the young star-forming complex OMC-1S, roughly 90 arcsec S of BN-KL, as an illustration of the complexity than can arise when there are multiple overlapping flows likely driven by several separate embedded sources. Many large-scale flows thought to emanate from the region have been studied in the visible using multi-epoch HST imaging, including HH202, HH203, HH204, HH269, HH507, HH529, and HH530, and some have molecular outflow counterparts (Henney et al. 2007; O’Dell et al. 2008). The existence of shocked molecular hydrogen jets and flows heading W and NW from OMC-1S was noted by Kaifu et al. (2000); Stanke et al. (2002) (flows 2–6 and 2–5, respectively, in the latter paper) and these are revealed by much greater detail now. The NW flow seems intimately connected to the peculiar dark cavity also seen in HST images and named HH625 by O’Dell & Doi (2003), but there is also H2 emission around the rim of that cavity and elsewhere in the OMC-1S that might be excited by fluorescence due to the relatively nearby Trapezium stars, rather than through shocks. The same cavity features prominently in a further discussion of HH625 below, in Section 12. Discerning which are moving flows as opposed to externally-illuminated gas will likely require follow-up images with JWST in the future to establish proper motions and velocities.
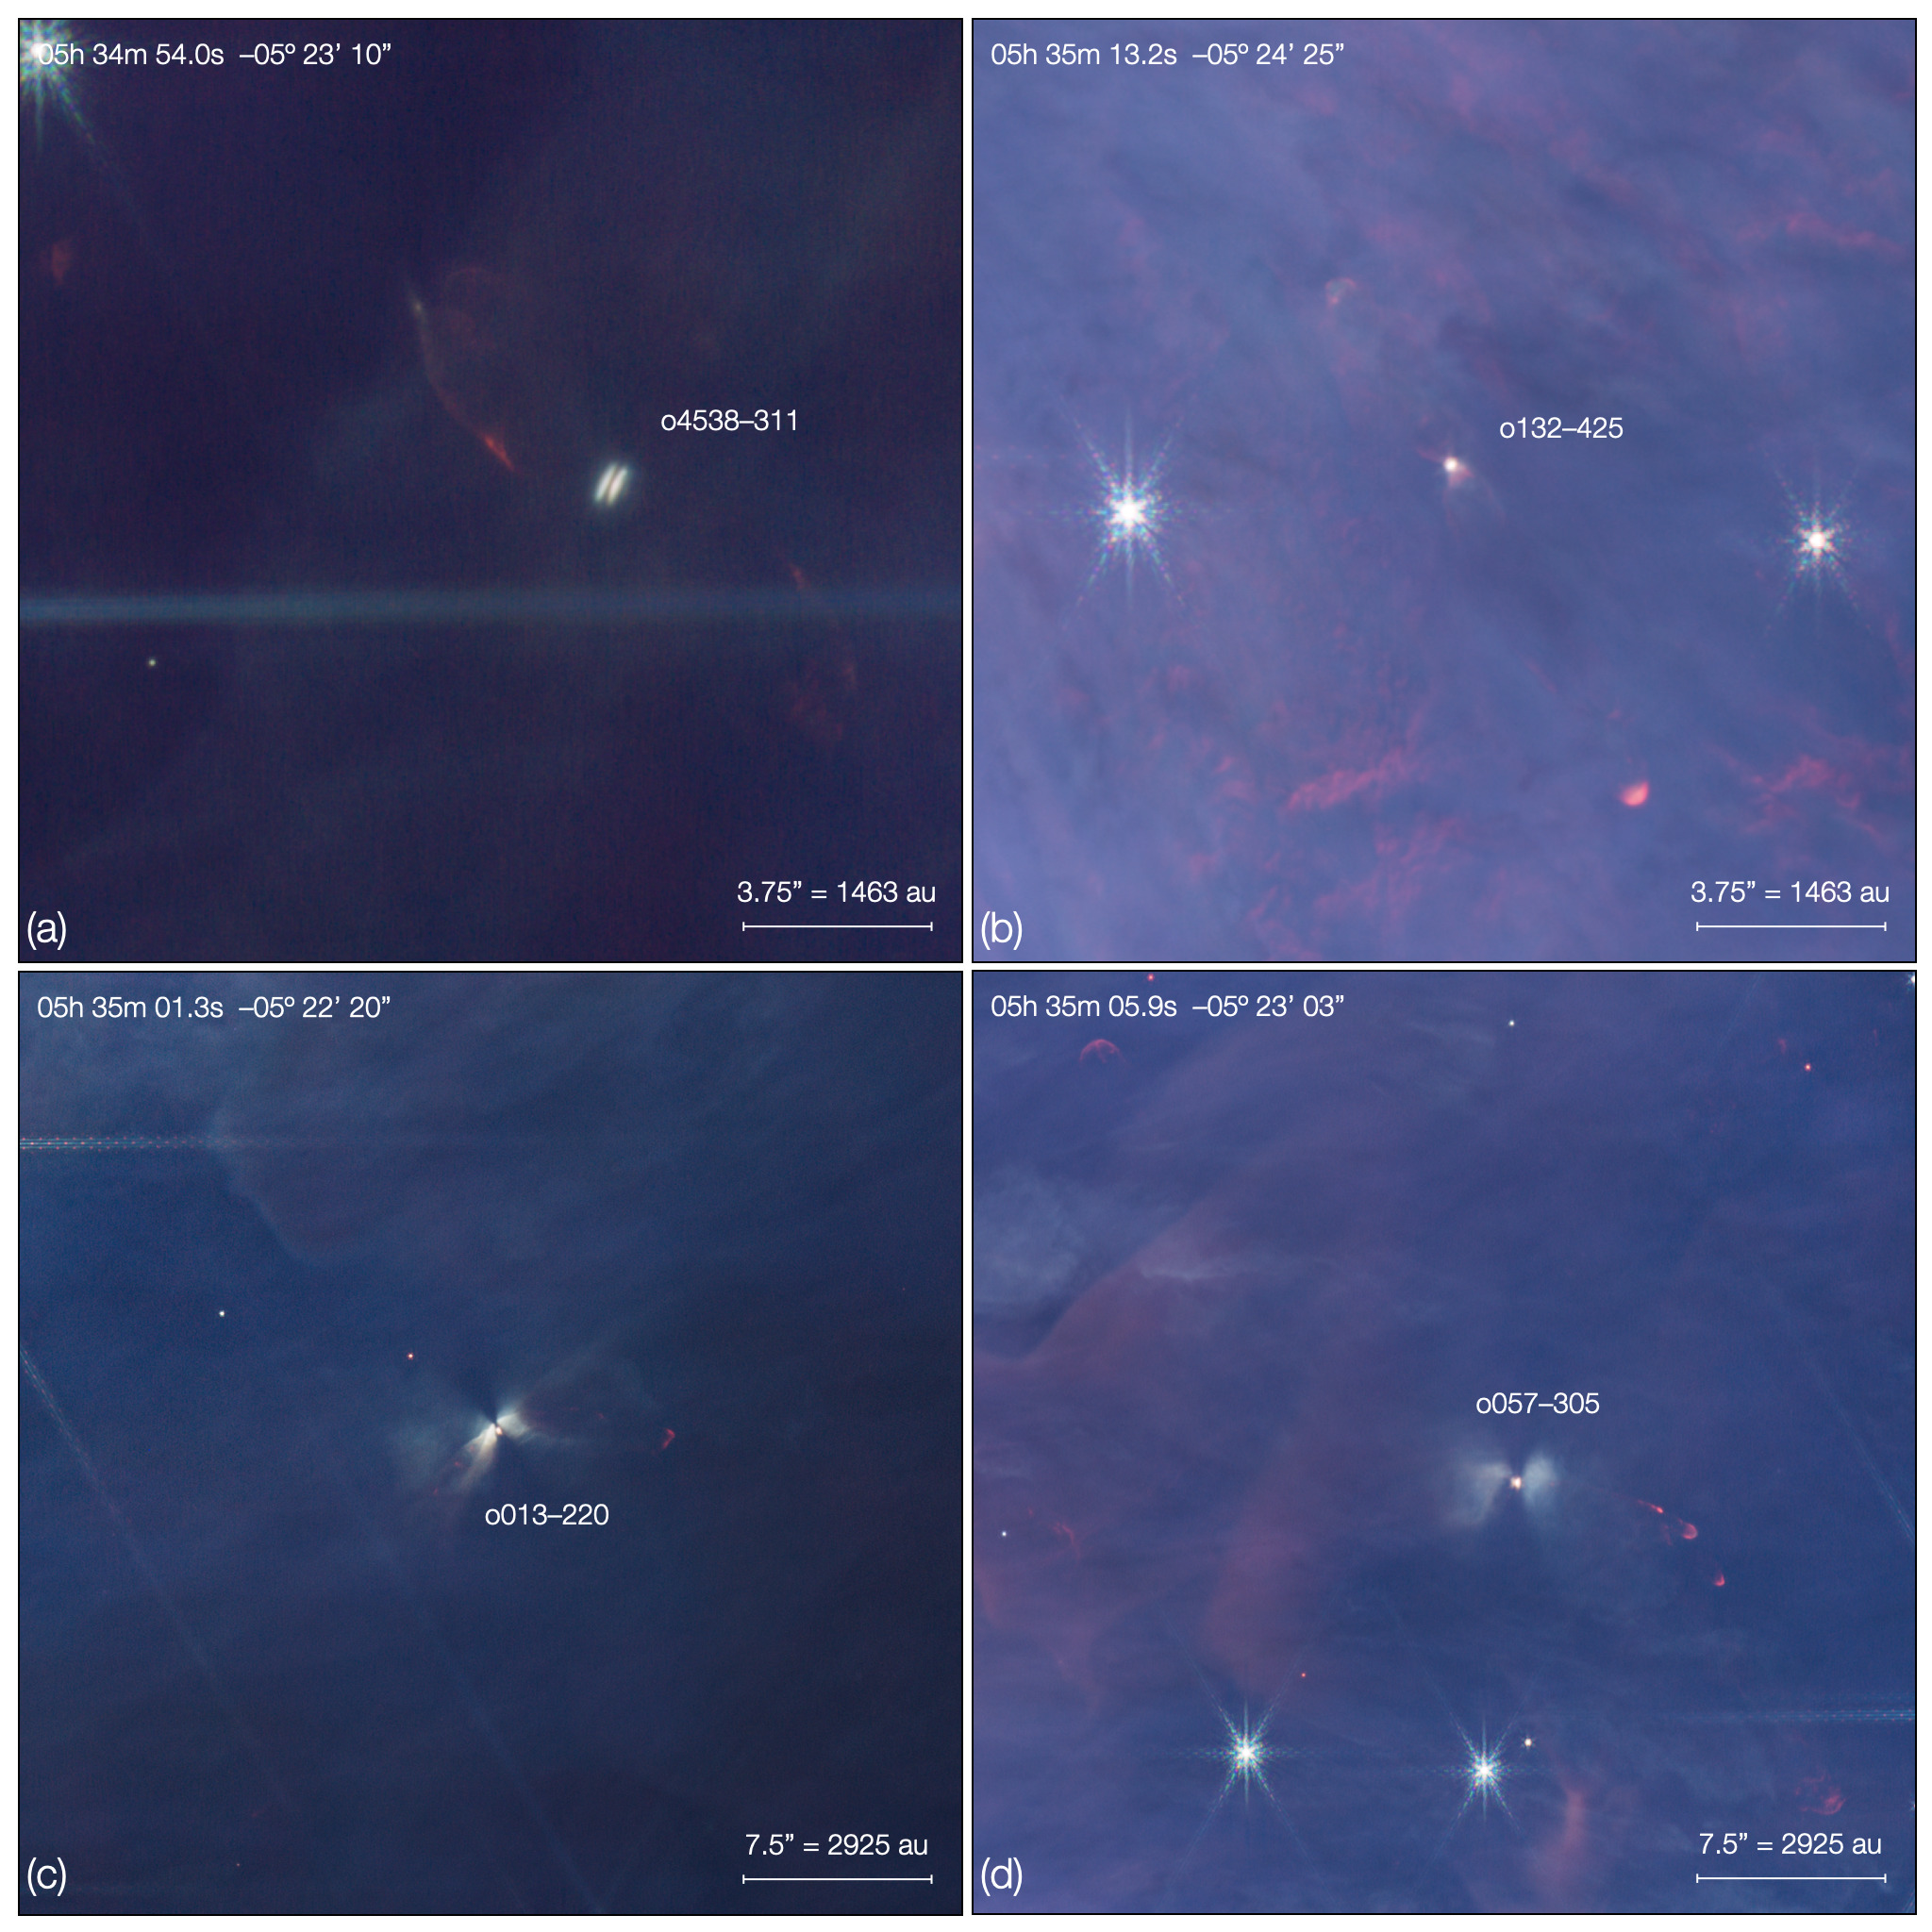
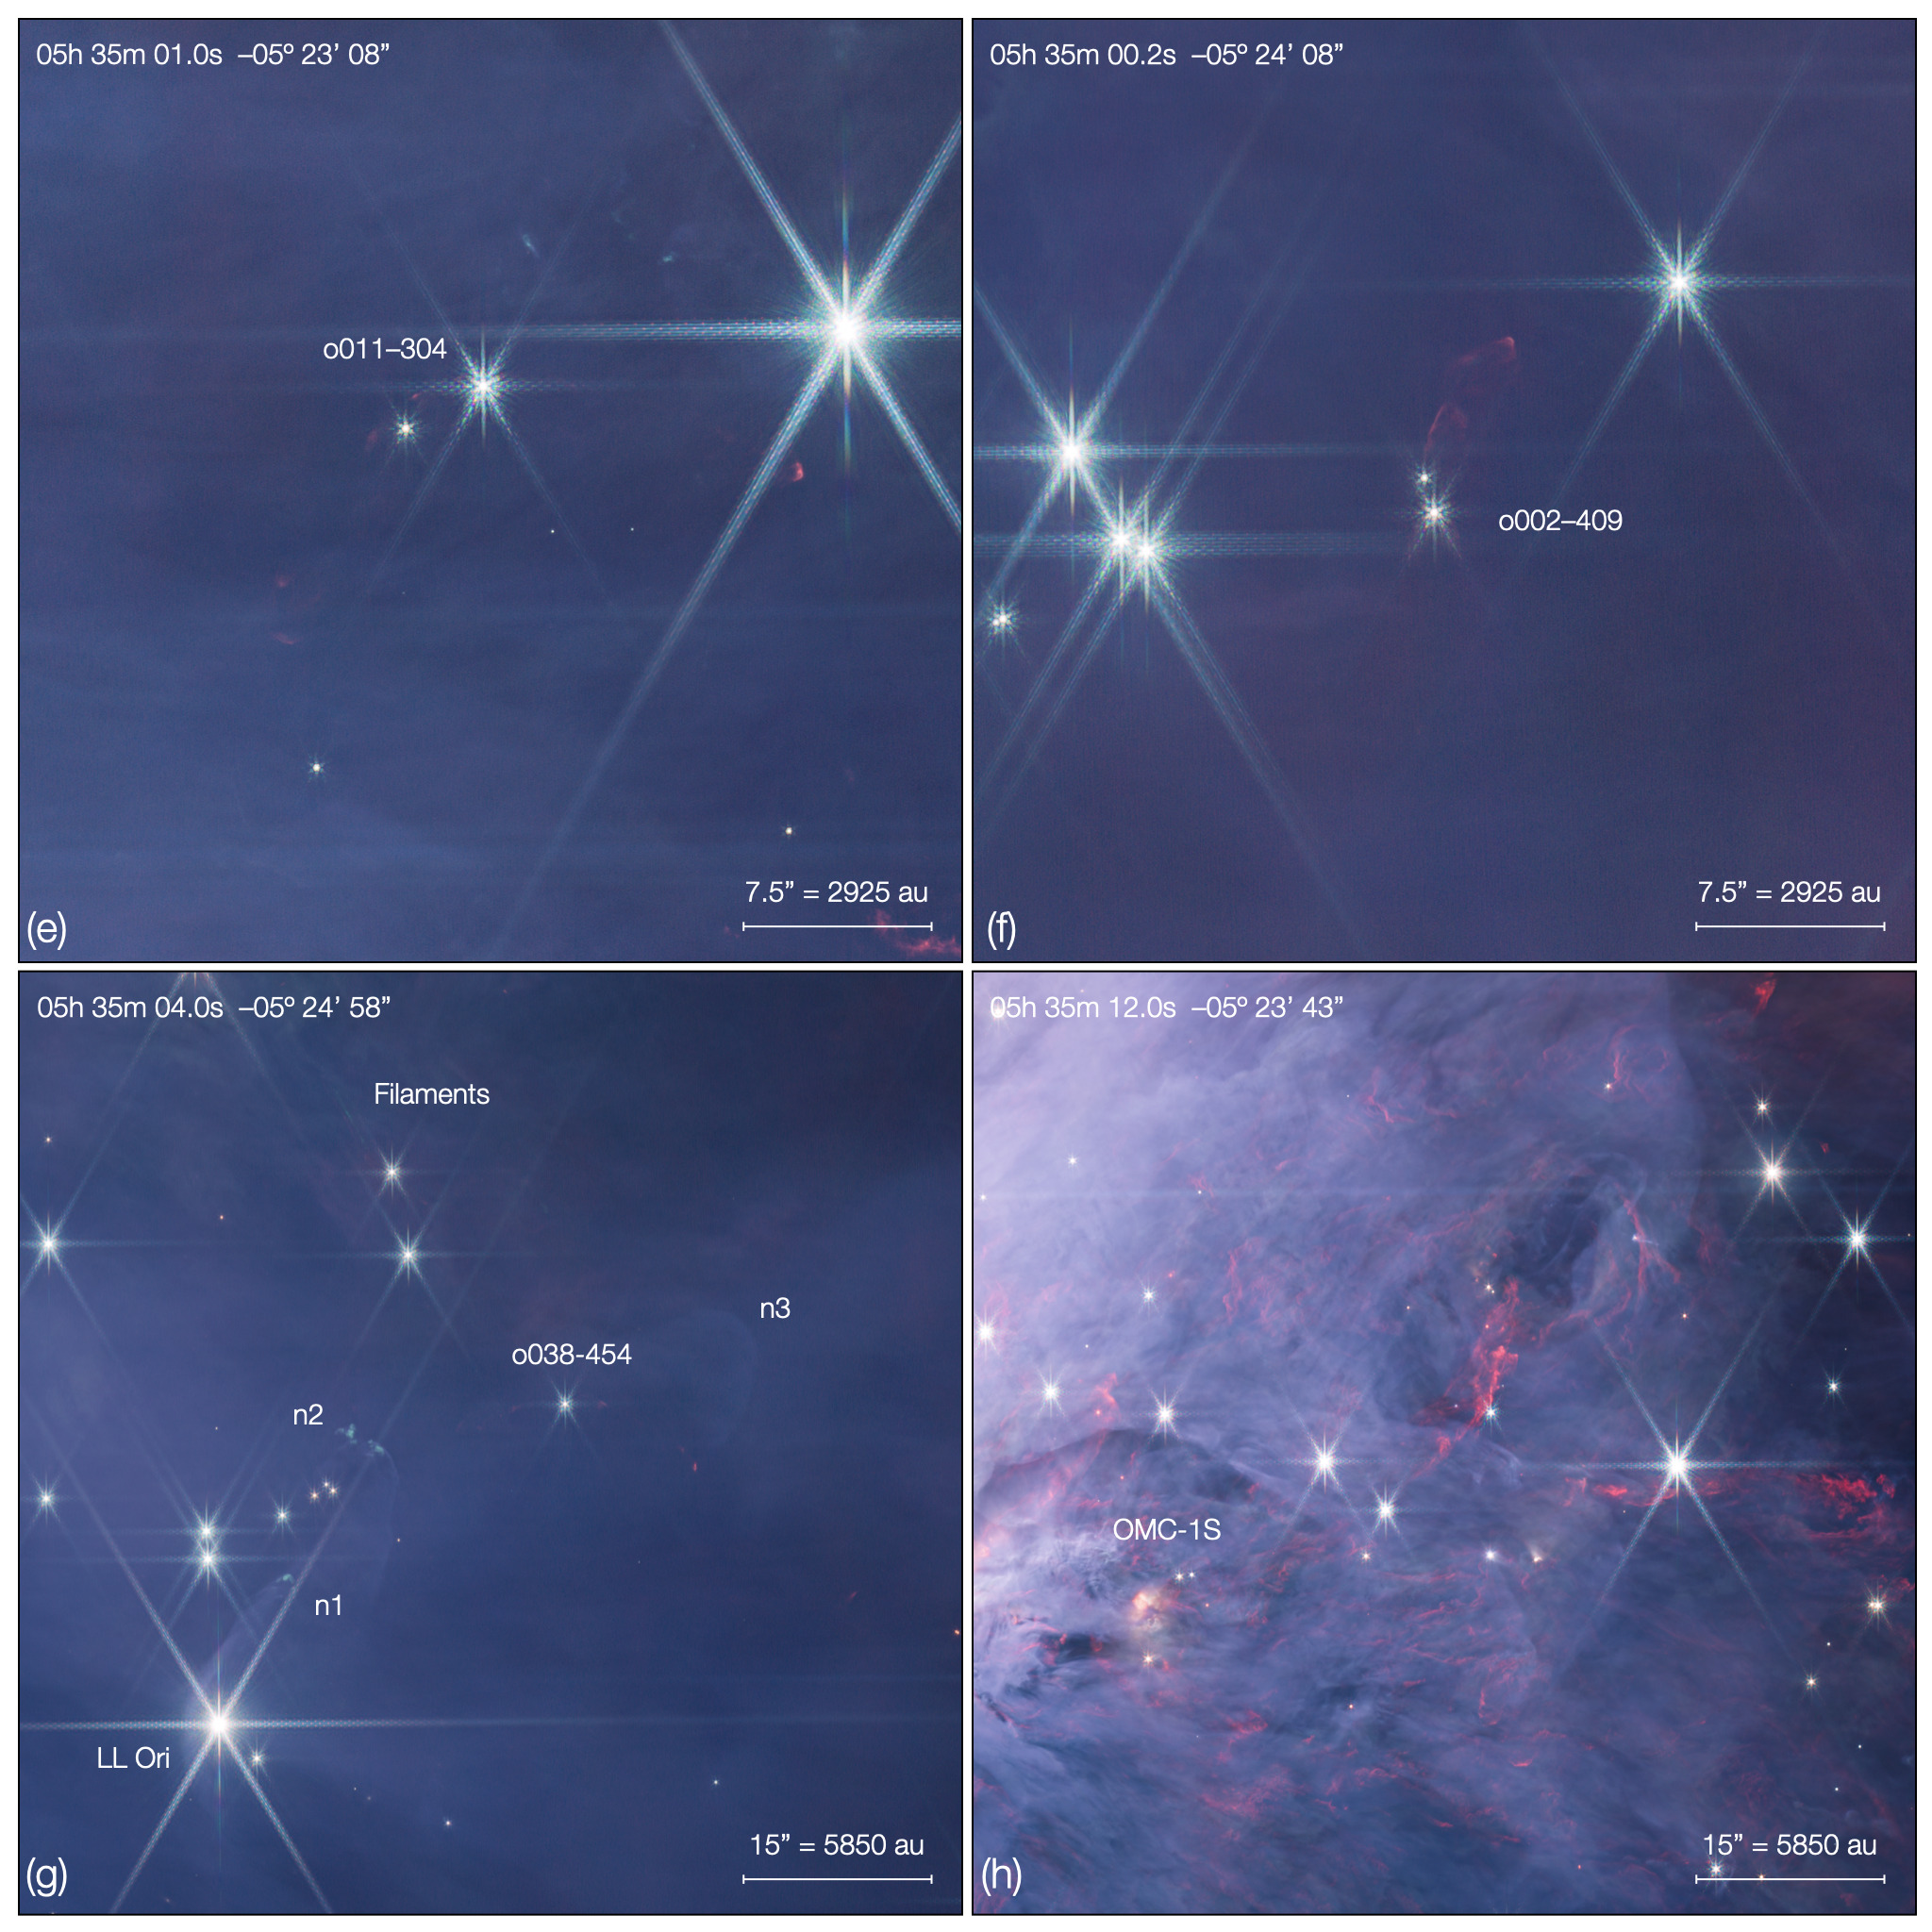
12 A mystery “dark absorber”
While inspecting and cleaning all of the filter individual mosaics, some unexpected and interesting features were discovered in the F115W data. The first was that some stars N and E of the Trapezium within the brightest parts of the Huygens Region were seen be surrounded by dark “coffee stains”, broadly circular, relatively large (5–10″ in diameter), and often fairly sharply defined regions where the nebular emission was depressed in intensity by about 10–20% relative to the surroundings. The dark structures around other stars are more arc-like and may have additional tendrils, plus there are many smaller structures around other stars. Examples are shown in Figure 14.
On seeing these features, thoughts immediately turned to the “socket stars” discovered by Feibelman (1989), where some stars in star-forming regions including the Orion Nebula apparently showed “empty spaces” a few arcseconds in size around them in visible wavelength photographs. Initial follow-up studies (e.g., Castelaz 1990) showed that many of the socket stars exhibited infrared excess emission suggesting that the wider sockets might also be dust-related, but subsequent optical and infrared imaging with digital detectors revealed the sockets to be chimeras, artefacts of photographic processing (Schaefer 1995), and they were declared dead (Trimble & Leonard 1995).
While the dark features seen in the JWST F115W images are definitely real, they are not associated with the same stars as Feibelman’s sockets, so we are not reviving that story as such. Nevertheless, the phenomenon deserves further investigation, not least as there are other important findings related to them: these dark features are not seen in any other JWST filter — it is strictly confined to the F115W filter — and other “dark in F115W only” structures are seen against the nebular background elsewhere in the F115W mosaic, deepening the mystery.
First, there are a few examples of much more concentrated dark shadows around faint stars, with Figure 15(a) showing a particularly striking one. Initially, this object was mistaken for one of the classical silhouette circumstellar disks in the group just to the SE of the Trapezium, namely d183–405 (McCaughrean & O’Dell 1996). But the latter lies further south (marked in the image) and this new object is only dark in F115W: in all other filters, the faint central source is in emission and slightly nebulous, and there is no suggestion of the larger dark shadow.
Second, some of dark shadows exhibit quite peculiar shapes around stars, e.g., the objects we have christened the “Stupa” (Figure 15(b)) and the “Bat” (Figure 15(c)). The former appears as a series of wide, almost linear structures on one side of the central star and a series of narrower bubble-like structures on the other. The latter appears as a kind of “anti-bipolar nebula” with two almost symmetric dark ‘wings’ and a ‘head’, but with no associated outflow at any wavelength. Third, in addition to wisps around many stars, there are quite a few locations where blobs of darkness are seen against the H II region without any obvious association with point local sources, as if shards of molecular clouds are being seen against the nebula (e.g., Figure 15(d)).
compelling
Finally and perhaps most compelling of all, there are number of jets and outflows in the region where part is seen as a dark shadow against the background nebulosity in F115W, with a turbulent appearance down the main outflow axis before terminating in a bright shock, or where the jet seen in emission is surrounded by a dark “sheath”. Figure 16 shows four examples, as follows:
- Dark Outflow 1:
-
A complex object showing a whole set of characteristic features. The source is a star in the middle of a near edge-on circumstellar disk seen as a silhouette (d143–522, Bally et al. 2000) in most wavelengths, but with a bright cocoon of H2 emission in F212N. The whole system is surrounded by an ionised rim oriented towards Ori A as seen by (Bally et al. 2000), but no mention is made there of the faint jet emerging to the NE as seen here. The flow was subsequently identified by (O’Dell & Henney 2008) and named HH997. There is a dark “sheath” of absorption around the initial jet and further along, the outflow appears only as a dark, turbulent shadow against the background nebulosity, before ending in a bright ionised knot and bowshock (149–513). The emitting parts of the outflow are seen at other JWST wavelengths, but not the dark shadow. There are no obvious signs of an outflow in the opposite direction to the SW, but the region is confused with lots of ionised emission associated with the Bright Bar. In passing, it is worth noting that another silhouette disk, d141–520, lies 5 arcsec to the NW of this object, but is completely swamped by its central star in the JWST data, leaving only evidence for the surrounding ionised proplyd in F187N. Just beyond that to the NW is the large outflow complex HH516 (Bally et al. 2000) seen in the JWST data in both ionised hydrogen and [Fe II] emission.
- Dark Outflow 2:
-
A similar dark outflow terminating in a bright ionised knot at the NE end, although the bright bowshocks there are likely related to a separate source. There an ionised jet closer to the source, presumed to be the bright star to the SW (2009, Parenago 1954). The jet is seen clearly in F187N, but less so here in the SW composite and F115W images, as the jet lies close to one of the star’s diffraction spikes. Again, there is no trace of a counterflow to the southwest.
- Dark Outflow 3:
-
Another complex system with a star, silhouette disk and bright jet, this time bipolar. The source star is proplyd 109–327 and the jet emerging to the E is HH510 (aka j109–327, Bally et al. 2000). To the WSW, there is a bright ionised cocoon which appears to focus into a pair of bright ionised knots with another possible diffuse knot further along, outside the frame, thus suggesting that the overall outflow is bipolar, counter to the claim by Bally et al. (2000) that this is a one-sided system. To the ENE, the bright HH510 jet is initially surrounded by a dark sheath in the F115W image, seemingly superimposed on the bright rim of an expanding cavity seen at visible wavelengths and given the name HH625 (O’Dell & Doi 2003; O’Dell et al. 2008). As the jet continues to the ENE across the cavity, the ionised knots s1 and s2 of Bally et al. (2000) are also seen.
- Dark Outflow 4:
-
A star with two ionised spikes, brighter to the S and fainter to the N, appears to be surrounded by a darker region. The southern spike was seen in H by Bally et al. (2000) and identified as a one-sided microjet which they named j131–247 and HH511. There is no further sign of bright emission in either direction, but both sides of the flow appear to terminate in strange dark shapes, a pointed arrow to the N and an elongated shadow and hammerhead further to the S.
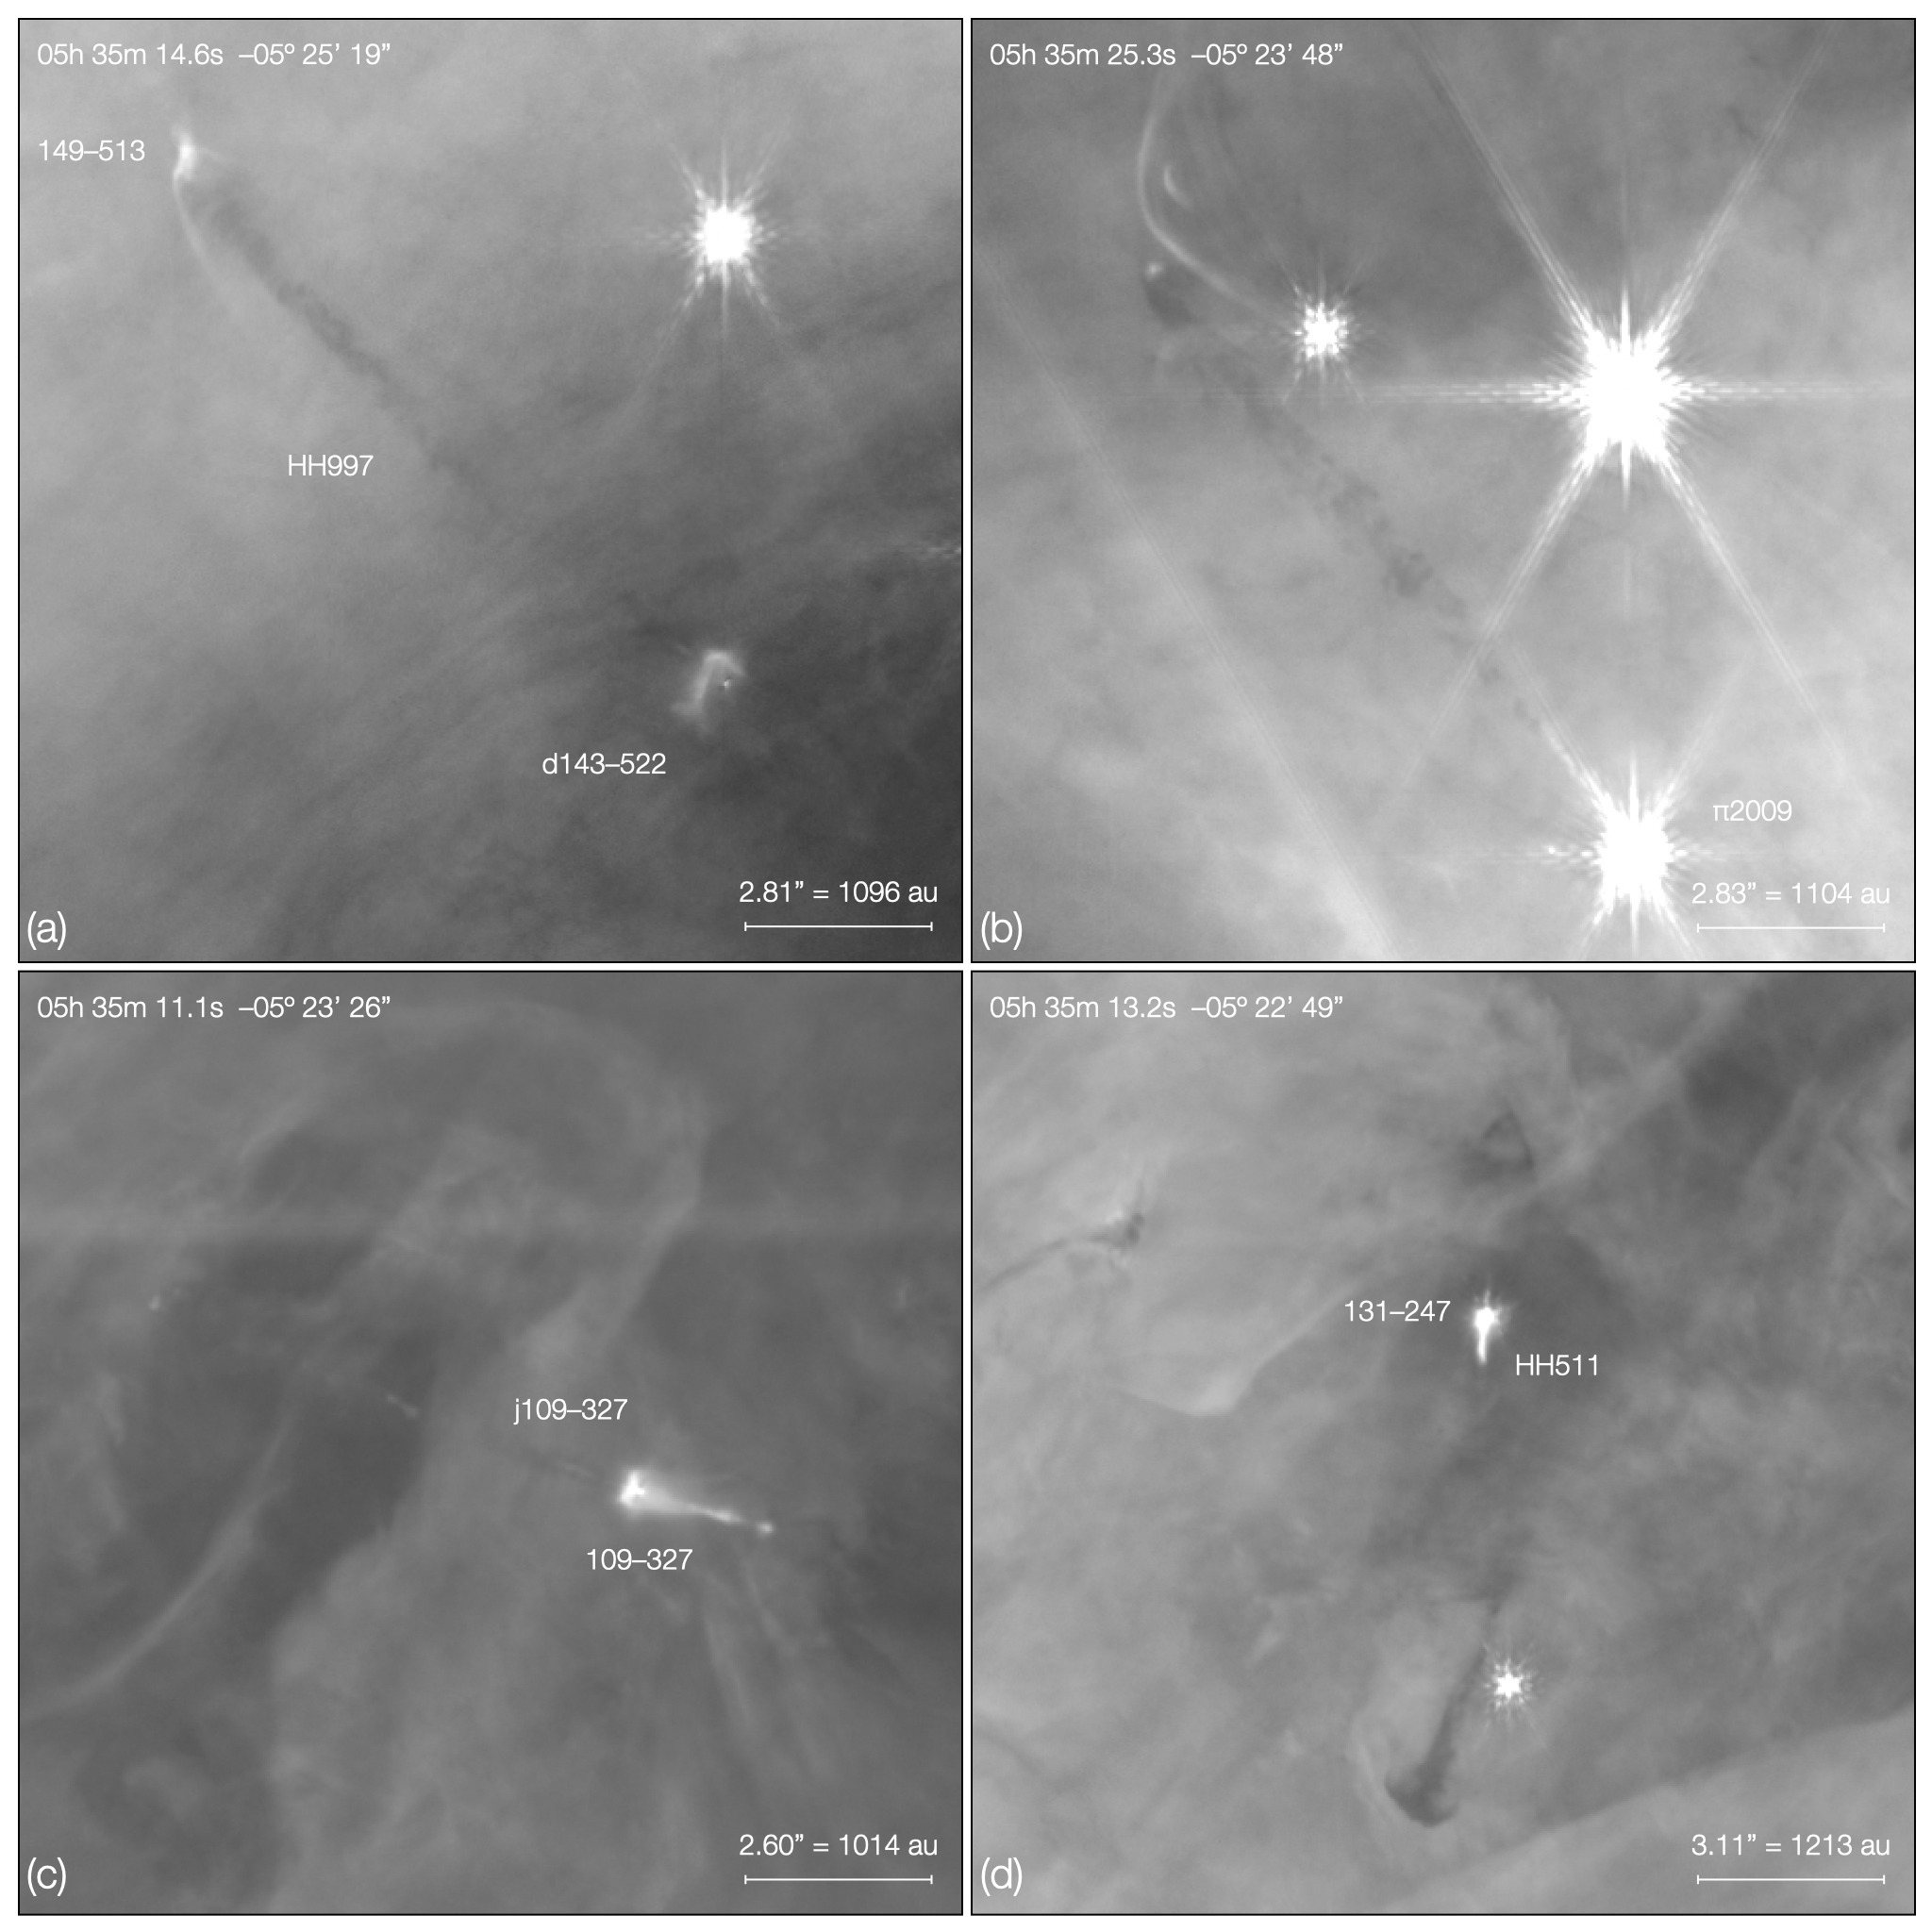
Again, in all of these cases, the dark feature is only seen in the F115W filter in our JWST survey and we have been unable to find any other images (e.g., HST imaging at visible wavelengths) where the same features show. That immediately suggests two things: first, it is unlikely that the feature is due to dust absorption. Even though there can be strong features in the scattering phase function of dust (Baes et al. 2022), it is very unlikely that dust could yield absorption in F115W but in no other wavelength, including the adjacent F140M filter. Second, the fact that the F115W filter is quite wide suggests that absorption of broad continuum nebulosity by lines in atomic or molecular gas would have to remarkably effective to yield a % decrease in the flux in the band. In addition, the feature is not readily apparent in archival J-band images of the Orion Nebula, suggesting that the feature is being imprinted between the blue cut-off of the F115W filter at 1.013 m and the blue cut-off of J-band filters at m.
One obvious candidate for emission and possible absorption in that wavelength range is the singly-excited He I () triplet at 10830Å or 1.083 m. Helium is common in H II regions and the 1.083 m line is seen in extensive emission in the Orion Nebula (e.g., Takami et al. 2002). Equally, helium absorption towards Orion has been known for a long time, first detected in the 3888Å line by Wilson (1937) and Adams (1944), and later just blueward of the 1.083 m line by Boyce & Ford (1966), who who ascribed it to interstellar or “circumnebular” material. He I emission and absorption towards the bright stars in Orion has since been studied in detail (e.g., Oudmaijer et al. 1997). More generally, He I absorption is used as a key diagnostic in various astrophysical scenarios, including the study of solar chromospheric activity such as flares (e.g., Huang et al. 2020) and as a tracer of winds from young stars (e.g., Edwards et al. 2003).
At first sight then, self-absorption of He I emission at 1.083 m might fit the bill well as a way of explaining why the various dark features discussed above are seen only in the F115W filter, although the actual physical arrangements of the various emitting and absorbing helium layers may vary from object to object and in the case of the dark outflows, perhaps velocity shifts come into play: substantial self-absorption would only be seen if the velocity in the flow matched that of the background emitting region, i.e., if the flow was predominantly in the plane of the sky.
Another possibility however may be Si I, which also has a series of strong absorption lines in the relevant region, as seen in supernovae, for example (e.g., Graham 1986). There is plenty of silicon in young star-forming regions, H II regions, PDR’s, and jets and outflows, whether in atomic and ionic form (e.g., Abel et al. 2005), molecular (e.g., SiO, Zapata et al. 2006), or in dust as silicates (e.g., Whittet 2022), but the question is whether it can be found in the right form to serve as a line absorber and whether the lines can absorb enough background flux. A rough estimate based on the number of Si I lines in the F115W filter, their likely widths and depths suggests not, if the background is continuum emission, but if the bulk of the emission comes from a few lines at close enough wavelengths, then it may be possible. For example, one of the stronger Si I lines in this wavelength region lies at 1.0827 m, within km s-1 of the He I line. Absorption of He I emission from the H II region by silicon-rich material in an outflow could perhaps then work, albeit would probably not work for the more ‘static’ features.
For the outflows at least, an intriguing thought arises if He I is responsible for both the background illumination and the absorption. Namely, that this may offer the possibility of determining the mass in the outflows directly. Other observations of jets and outflows rely on detecting emission from excited, ionised, or dissociated atoms and molecules, and the fraction of the total amount of material that may currently be shocked excited or swept up, Therefore they likely only trace an uncertain fraction of the total mass in a flow. On the other hand, absorption by He I may be a much less biased tracer of mass and mass-loss rate in outflows. Combined with radial velocities and proper motions, a full 3D map of the motions, masses, mass-loss rate, and feedback impact on the environment may be possible.
13 Shells around Ori C
The B5V star Ori C (aka HD37062, Brun 760, 2085), is the most easterly of the
three massive stars below the Bright Bar.
The HST Orion Treasury Survey visible-wavelength images of the star show some some extended
nebulosity around it (Robberto et al. 2013), while subsequent HST near-infrared images
hint at some structure (Robberto et al. 2020)101010See also the colour composite made by Judy Schmidt from the HST infrared data:
https://www.flickr.com/photos/geckzilla/49325834001
,
and earlier near-infrared imaging polarimetry had showed this to be a
reflection nebula (Tamura et al. 2006).
However, as seen in Figure 17, the higher spatial resolution and sensitivity of the JWST images show that in addition to a diffuse, blue nebulosity around the star, there is at least one and perhaps multiple shells of red emission within a arcsec or au radius around the star. There is also extended structure to the E of the star seen most clearly in the LW composite with a green-ish tint, thus perhaps a mix of dust and PAH emission.
It is possible that these shells are linked to episodic ejection of material from Ori C. The star is known to have a close spectroscopic companion with a period of days (Corporon & Lagrange 1999), while a wider companion at a projected separation of au was discovered through infrared interferometry (GRAVITY Collaboration et al. 2018). The JWST data reveal another component at au to the NNE. A proper motion study of the shells may reveal their expansion velocity and potentially a link to one of the orbital timescales in the system.
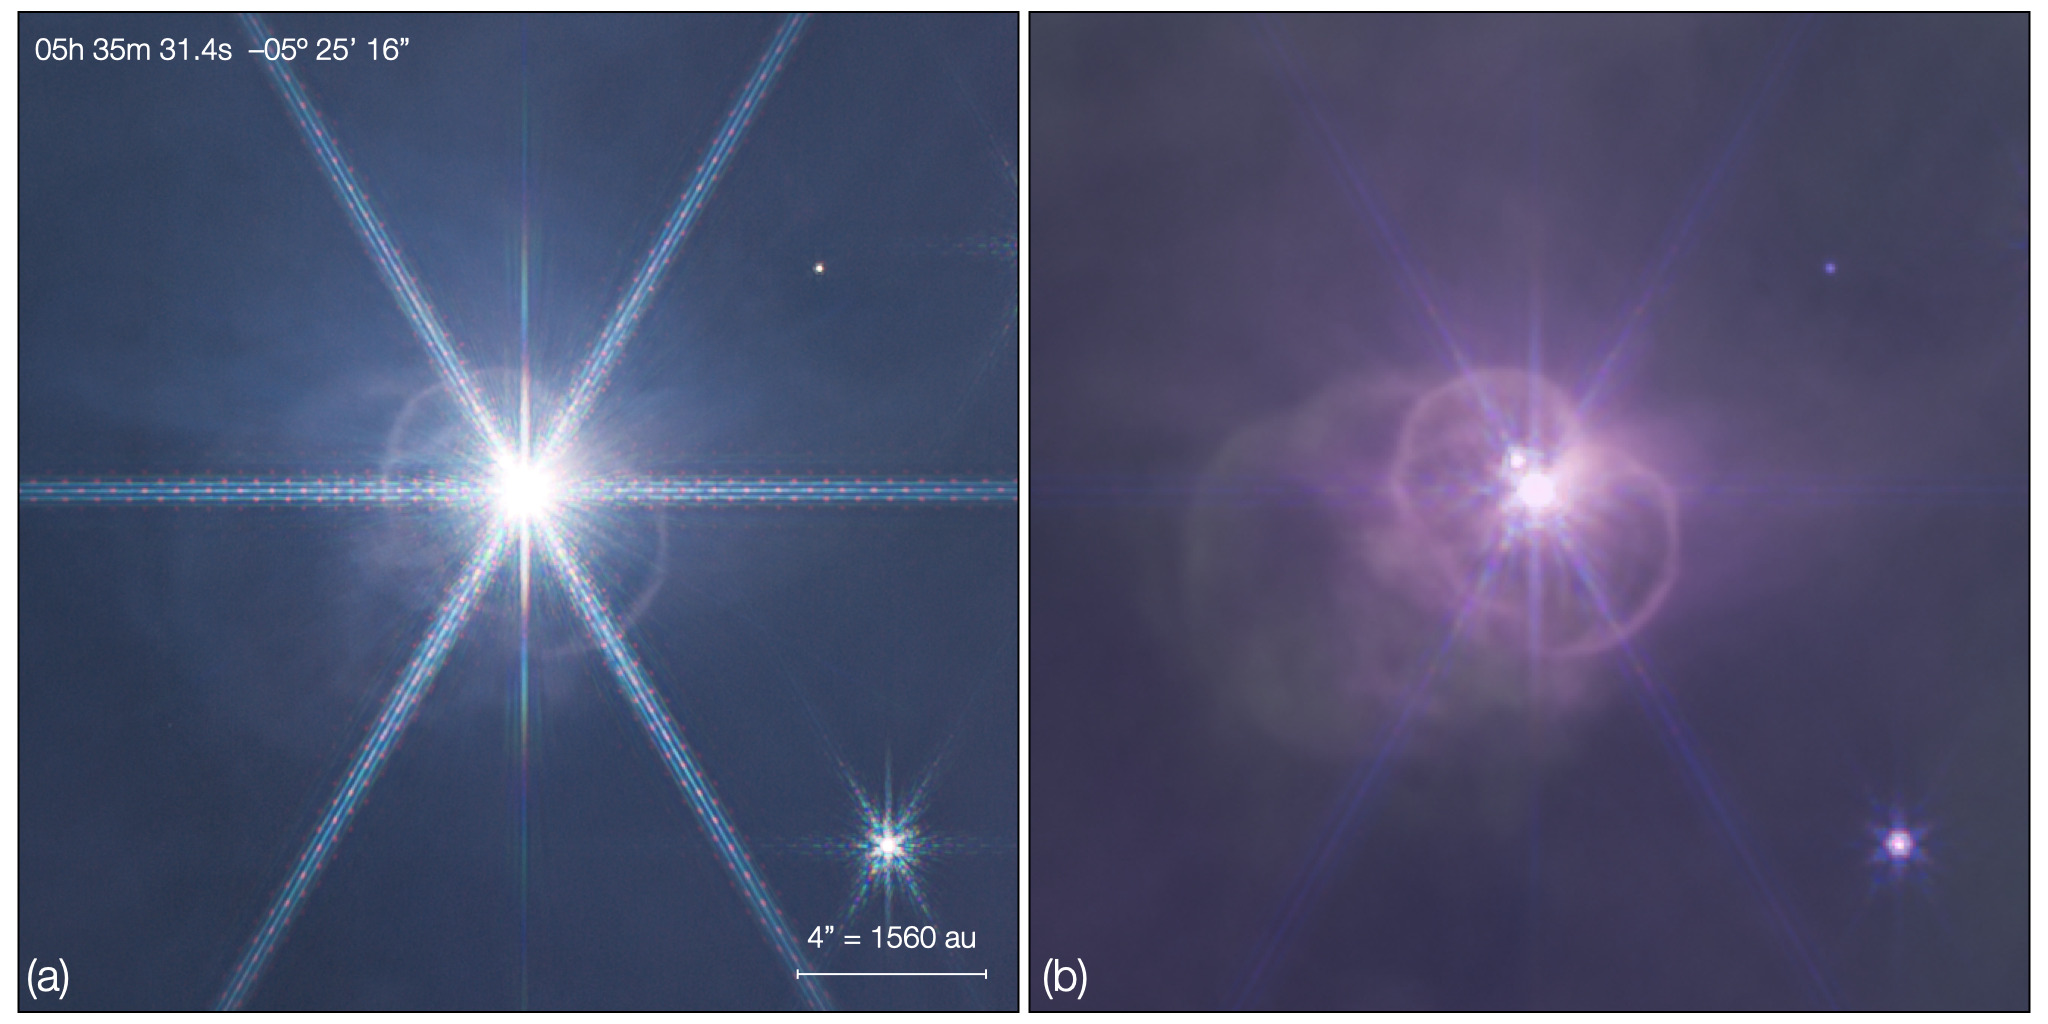
14 Galaxies
Finally, although the Orion Nebula is associated with a significant extinction thanks to the OMC-1 molecular cloud behind it, it is not optically thick at infrared wavelengths across the whole area of our survey. As the nebula is fairly far out of the galactic plane at , there is not a substantial population of background field stars, reducing contamination of our cluster sample as described in Section 7. On the other hand, towards the W edge and the NE corner, the extinction drops to low enough levels that a significant number of background galaxies can be seen through and beyond the nebulosity as shown in Figure 18.
Many are directly identifiable as large spirals and ellipticals, and through careful examination of the images and by searching for obviously extended sources in our aperture photometry, we have identified around 200 candidate galaxies in total in the survey. That includes a candidate gravitational lens system in the NE corner of the survey, although confirming that would need deeper imaging and spectroscopy.
From a philosophical angle, these distant background galaxies give additional meaning to our images, placing the nearest region of massive star formation in our Milky Way galaxy in the wider context of star formation across the Universe and cosmic time. However, beyond being just an observational curiosity, it may be possible to use the colours of the galaxies to make a first order estimate of the extinction along various lines of sight through the outer Orion Nebula, and the galaxies could also be used as fixed points in an astrometric reference frame aiming to detect proper motions in the Trapezium Cluster, perhaps in search of a signal of overall expansion. This would follow from previous visible wavelength proper motion studies of the ONC stellar population (e.g., Jones & Walker 1988; van Altena et al. 1988; Platais et al. 2020) and provide a complement to Gaia-linked studies (Kuhn et al. 2019).
15 Conclusions
While the description of the features and new phenomena seen in these JWST images of the inner Orion Nebula and Trapezium Cluster has been almost exclusively qualitative in this paper, it is clear that they lay the ground for important quantitative work in more dedicated papers: the first of these focusses on the statistical properties of the planetary-mass objects and Jupiter-mass binary objects or JuMBOs (Pearson & McCaughrean 2023, submitted), and others are in preparation. Equally, the data are now public in the MAST archive, so freely available for others to conduct their own studies and analyses. It is also likely that significant future JWST observational programmes in Orion will follow, targeting interesting objects with imaging at longer wavelengths and/or spectroscopy across the whole range: again, the first of these will focus on R100 NIRSpec MSA prism spectroscopy of the PMOs and JuMBOs in Cycle 2. The potential for future surveys similar to this one but extending further out, perhaps covering the arcmin field of the HST Treasury Survey or focussing more to the north along the ridge of embedded star formation between OMC-1 and OMC-2. If conducted in the broad filter set used here, thus covering a similarly wide range of scientific goals, such programmes will be expensive in observing time, but potentially very rewarding.
The discovery of the JuMBOs, the F115W “dark absorber”, and the H2 spikes ahead of the OMC-1 outflow fingers in our data were all unexpected. JWST has already begun to change the way we see the Orion Nebula and Trapezium Cluster, in much the same way that the Hubble Space Telescope did more than thirty years ago, and the invention of telescopes and photography did much earlier. More broadly, the observatory is providing us with remarkable new insights into star and planet formation on all scales, from outflows from low-mass protostars such as HH211 (Ray et al. 2023), the photochemistry of young externally irradiated disks (Berné et al. 2023), the structure of debris disks around young stars such as Fomalhaut (Gáspár et al. 2023), the properties of galactic star-forming regions such as Carina and Oph, also extending to the SMC (Jones et al. 2023), and of course also to high redshift, as the first stars and galaxies form. Given the powerful imaging and spectroscopic infrared capabilities of JWST, combined with a hopefully much longer mission lifetime than anticipated at launch, it is seems likely that there is much more to come.
Acknowledgements.
The time used to make these JWST observations come from the Guaranteed Time Observation allocation made to MJM upon selection as one of two ESA Interdisciplinary Scientists on the JWST Science Working Group (SWG) in response to NASA AO-01-OSS-05 issued in 2001. This followed MJM’s tenure as a member of the Next Generation Space Telescope (NGST) Interim Science Working Group (ISWG), the NGST Ad-hoc Science Working Group (ASWG), and the ESA NGST Science Study Team (SST), in reverse order. None of this would have happened but for the invitation by Bob Fosbury to join the ESA SST in 1998 and MJM remains eternally grateful for that. Equally, he is grateful to his PhD supervisor, Ian McLean, who offered him the opportunity to be involved in IRCAM, the very first common-user infrared camera for astronomy, and its first observations of Orion in 1986. He also thanks Peter Jakobsen and Pierre Ferruit, the ESA project scientists for NGST/JWST down the many years, and Koos Cornelisse, Peter Jensen, and Peter Rumler, the ESA project managers, along with all of their teams and the wider international family of thousands of engineers, scientists, and others across North America and Europe who conceived, designed, built, launched, and commissioned the astonishing JWST, and to those who operate it today. Fellow members of the JWST SWG are especially thanked for their friendship and dedication to this project over more than two decades of travel, meetings, telecons, and shared lows and highs: it has been the privilege of a lifetime. Specific thanks for this observing programme are due to the STScI instrument scientists and programme reviewers Elizabeth Nance, Massimo Robberto, and Mario Gennaro, and also Tony Roman for all his help with scheduling and execution. On the science side, he would also like to thank Bob O’Dell and John Bally for their collaborations on the HST imaging of the Orion Nebula almost thirty years ago, and would also like to remember John Stauffer, for his friendship and collaboration on Orion right from the start of HST and more widely. Hans Zinnecker is thanked for his scientific and personal friendship down the years, as well as insights contributing to this work. Tom Haworth and John Bally are thanked for their insightful thoughts and key contributions to the discussion of the F115W “dark absorber”; Isabelle Baraffe is thanked for providing the latest evolutionary models for young planetary mass objects to sub-1 masses; and Matthew Bate is thanked for his insights on the PMOs and JuMBOs. SGP acknowledges support through the ESA research fellowship programme at ESA’s ESTEC, and would like to thank Victor See for helpful discussions and Katja Fahrion for valuable insights on the JWST calibration pipeline. The data presented in this paper were obtained with the Near Infrared Camera (NIRCam) on the NASA/ESA/CSA James Webb Space Telescope, as part of Cycle 1 GTO programme 1256, They are available on the Barbara A. Mikulski Archive for Space Telescopes (MAST): http://dx.doi.org/10.17909/vjys-x251. This work has made use of data from the European Space Agency (ESA) mission Gaia (https://www.cosmos.esa.int/gaia), processed by the Gaia Data Processing and Analysis Consortium (DPAC, https://www.cosmos.esa.int/web/gaia/dpac/consortium). Funding for the DPAC has been provided by national institutions, in particular the institutions participating in the Gaia Multilateral Agreement. This research has made use of the Spanish Virtual Observatory (https://svo.cab.inta-csic.es) project funded by MCIN/AEI/10.13039/501100011033/ through grant PID2020-112949GB-I00 This research made use of Photutils, an Astropy package for detection and photometry of astronomical sources (Bradley et al. 2023). For certain parts of the image processing, Community IRAF V2.17 was used (https://iraf-community.github.io) and MJM is grateful to those who keep this seminal piece of software alive and running, not least because there are still things it can do better than Astropy. And just for old time’s sake.References
- Abel et al. (2005) Abel, N. P., Ferland, G. J., Shaw, G., & van Hoof, P. A. M. 2005, ApJS, 161, 65
- Adams (1944) Adams, W. S. 1944, PASP, 56, 119
- Allen & Burton (1993) Allen, D. A. & Burton, M. G. 1993, Nature, 363, 54
- Andersen et al. (2011) Andersen, M., Meyer, M. R., Robberto, M., Bergeron, L. E., & Reid, N. 2011, A&A, 534, A10
- Astropy Collaboration et al. (2022) Astropy Collaboration, Price-Whelan, A. M., Lim, P. L., et al. 2022, ApJ, 935, 167
- Axon & Taylor (1984) Axon, D. J. & Taylor, K. 1984, MNRAS, 207, 241
- Baade & Minkowski (1937) Baade, W. & Minkowski, R. 1937, ApJ, 86, 119
- Baes et al. (2022) Baes, M., Camps, P., & Kapoor, A. U. 2022, A&A, 659, A149
- Bally (2008) Bally, J. 2008, in Handbook of Star Forming Regions, Volume I, ed. B. Reipurth (Astronomy Society of the Pacific: San Francisco), 459
- Bally et al. (2011) Bally, J., Cunningham, N. J., Moeckel, N., et al. 2011, ApJ, 727, 113
- Bally et al. (2017) Bally, J., Ginsburg, A., Arce, H., et al. 2017, ApJ, 837, 60
- Bally et al. (2015) Bally, J., Ginsburg, A., Silvia, D., & Youngblood, A. 2015, A&A, 579, A130
- Bally et al. (2006) Bally, J., Licht, D., Smith, N., & Walawender, J. 2006, AJ, 131, 473
- Bally et al. (2000) Bally, J., O’Dell, C. R., & McCaughrean, M. J. 2000, AJ, 119, 2919
- Bally & Reipurth (2001) Bally, J. & Reipurth, B. 2001, ApJ, 546, 299
- Bally & Zinnecker (2005) Bally, J. & Zinnecker, H. 2005, AJ, 129, 2281
- Baraffe et al. (2003) Baraffe, I., Chabrier, G., Barman, T. S., Allard, F., & Hauschildt, P. H. 2003, A&A, 402, 701
- Baraffe et al. (2015) Baraffe, I., Homeier, D., Allard, F., & Chabrier, G. 2015, A&A, 577, A42
- Becklin & Neugebauer (1967) Becklin, E. E. & Neugebauer, G. 1967, ApJ, 147, 799
- Beckwith et al. (1978) Beckwith, S., Persson, S. E., Neugebauer, G., & Becklin, E. E. 1978, ApJ, 223, 464
- Berné et al. (2022) Berné, O., Habart, É., Peeters, E., et al. 2022, PASP, 134, 054301
- Berné et al. (2023) Berné, O., Martin-Drumel, M.-A., Schroetter, I., et al. 2023, Nature, 621, 56
- Black & Dalgarno (1976) Black, J. H. & Dalgarno, A. 1976, ApJ, 203, 132
- Bodenheimer (1978) Bodenheimer, P. 1978, ApJ, 224, 488
- Boss (1988) Boss, A. P. 1988, ApJ, 331, 370
- Boyce & Ford (1966) Boyce, P. B. & Ford, W. K. 1966, PASP, 78, 163
- Boyd & Whitworth (2005) Boyd, D. F. A. & Whitworth, A. P. 2005, A&A, 430, 1059
- Bradley et al. (2023) Bradley, L., Sipőcz, B., Robitaille, T., et al. 2023, astropy/photutils: 1.8.0, https://doi.org/10.5281/zenodo.7946442
- Burton et al. (1991) Burton, M. G., Minchin, N. R., Hough, J. H., et al. 1991, ApJ, 375, 611
- Bushouse et al. (2023) Bushouse, H., Eisenhamer, J., Dencheva, N., et al. 2023, JWST Calibration Pipeline, https://doi.org/10.5281/zenodo.8247246
- Castelaz (1990) Castelaz, M. W. 1990, ApJ, 348, L29
- Chabrier et al. (2000) Chabrier, G., Baraffe, I., Allard, F., & Hauschildt, P. 2000, ApJ, 542, 464
- Chabrier et al. (2023) Chabrier, G., Baraffe, I., Phillips, M., & Debras, F. 2023, A&A, 671, A119
- Chen et al. (1998) Chen, H., Bally, J., O’Dell, C. R., et al. 1998, ApJ, 492, L173
- Churchwell et al. (1987) Churchwell, E., Felli, M., Wood, D. O. S., & Massi, M. 1987, ApJ, 321, 516
- Cillis et al. (2018) Cillis, A. N., Cottingham, D. A., Waczynski, A., et al. 2018, in Society of Photo-Optical Instrumentation Engineers (SPIE) Conference Series, Vol. 10698, Space Telescopes and Instrumentation 2018: Optical, Infrared, and Millimeter Wave, ed. M. Lystrup, H. A. MacEwen, G. G. Fazio, N. Batalha, N. Siegler, & E. C. Tong, 106983A
- Corporon & Lagrange (1999) Corporon, P. & Lagrange, A. M. 1999, A&AS, 136, 429
- Cunningham (2006) Cunningham, N. J. 2006, PhD thesis, University of Colorado, Boulder
- Da Rio et al. (2012) Da Rio, N., Robberto, M., Hillenbrand, L. A., Henning, T., & Stassun, K. G. 2012, ApJ, 748, 14
- Da Rio et al. (2009) Da Rio, N., Robberto, M., Soderblom, D. R., et al. 2009, ApJS, 183, 261
- Da Rio et al. (2010) Da Rio, N., Robberto, M., Soderblom, D. R., et al. 2010, ApJ, 722, 1092
- D’Antona & Mazzitelli (1994) D’Antona, F. & Mazzitelli, I. 1994, ApJS, 90, 467
- De Furio et al. (2022a) De Furio, M., Liu, C., Meyer, M. R., et al. 2022a, ApJ, 941, 161
- De Furio et al. (2022b) De Furio, M., Meyer, M. R., Reiter, M., et al. 2022b, ApJ, 925, 112
- Dempsey et al. (2020) Dempsey, R., Zakamska, N. L., & Owen, J. E. 2020, MNRAS, 495, 1172
- Doi et al. (2002) Doi, T., O’Dell, C. R., & Hartigan, P. 2002, AJ, 124, 445
- Dougados et al. (1993) Dougados, C., Lena, P., Ridgway, S. T., Christou, J. C., & Probst, R. G. 1993, ApJ, 406, 112
- Downes et al. (1981) Downes, D., Genzel, R., Becklin, E. E., & Wynn-Williams, C. G. 1981, ApJ, 244, 869
- Draper (1880) Draper, H. 1880, Nature, 22, 583
- Drass et al. (2016) Drass, H., Haas, M., Chini, R., et al. 2016, MNRAS, 461, 1734
- Duchêne et al. (2018) Duchêne, G., Lacour, S., Moraux, E., Goodwin, S., & Bouvier, J. 2018, MNRAS, 478, 1825
- Edwards et al. (2003) Edwards, S., Fischer, W., Kwan, J., Hillenbrand, L., & Dupree, A. K. 2003, ApJ, 599, L41
- Felli et al. (1993) Felli, M., Taylor, G. B., Catarzi, M., Churchwell, E., & Kurtz, S. 1993, A&AS, 101, 127
- Gaia Collaboration et al. (2016) Gaia Collaboration, Prusti, T., de Bruijne, J. H. J., et al. 2016, A&A, 595, A1
- Gaia Collaboration et al. (2023) Gaia Collaboration, Vallenari, A., Brown, A. G. A., et al. 2023, A&A, 674, A1
- Garay et al. (1987) Garay, G., Moran, J. M., & Reid, M. J. 1987, ApJ, 314, 535
- Gardner et al. (2023) Gardner, J. P., Mather, J. C., Abbott, R., et al. 2023, PASP, 135, 068001
- Gardner et al. (2006) Gardner, J. P., Mather, J. C., Clampin, M., et al. 2006, Space Sci. Rev., 123, 485
- Gáspár et al. (2023) Gáspár, A., Wolff, S. G., Rieke, G. H., et al. 2023, Nature Astronomy, 7, 790
- Gautier et al. (1976) Gautier, T. N., I., Fink, U., Treffers, R. R., & Larson, H. P. 1976, ApJ, 207, L129
- Getman et al. (2005) Getman, K. V., Flaccomio, E., Broos, P. S., et al. 2005, ApJS, 160, 319
- Gezari et al. (1998) Gezari, D. Y., Backman, D. E., & Werner, M. W. 1998, ApJ, 509, 283
- Giordano et al. (2018) Giordano, F., Racero, E., Norman, H., et al. 2018, Astronomy and Computing, 24, 97
- Goicoechea et al. (2016) Goicoechea, J. R., Pety, J., Cuadrado, S., et al. 2016, Nature, 537, 207
- Graham (1986) Graham, J. R. 1986, MNRAS, 220, 27P
- Graham et al. (2003) Graham, M. F., Meaburn, J., & Redman, M. P. 2003, Monthly Notices of the Royal Astronomical Society, 343, 419
- Grasdalen & Joyce (1976) Grasdalen, G. L. & Joyce, R. R. 1976, in Bulletin of the American Astronomical Society, Vol. 8, 349
- GRAVITY Collaboration et al. (2018) GRAVITY Collaboration, Karl, M., Pfuhl, O., et al. 2018, A&A, 620, A116
- Grellmann et al. (2013) Grellmann, R., Preibisch, T., Ratzka, T., et al. 2013, A&A, 550, A82
- Grosso et al. (2006) Grosso, N., Feigelson, E. D., Getman, K. V., et al. 2006, A&A, 448, L29
- Großschedl et al. (2019) Großschedl, J. E., Alves, João, Teixeira, Paula S., et al. 2019, A&A, 622, A149
- Haworth et al. (2023) Haworth, T. J., Reiter, M., O’Dell, C. R., et al. 2023, MNRAS[arXiv:2308.12342]
- Hayward (1994) Hayward, T. L. 1994, ApJ, 429, 726
- Hayward et al. (1994) Hayward, T. L., Houck, J. R., & Miles, J. W. 1994, ApJ, 433, 157
- Henney et al. (2007) Henney, W. J., O’Dell, C. R., Zapata, L. A., et al. 2007, AJ, 133, 2192
- Herbig & Terndrup (1986) Herbig, G. H. & Terndrup, D. M. 1986, ApJ, 307, 609
- Hillenbrand (1997) Hillenbrand, L. A. 1997, AJ, 113, 1733
- Hillenbrand & Carpenter (2000) Hillenbrand, L. A. & Carpenter, J. M. 2000, ApJ, 540, 236
- Huang et al. (2020) Huang, N., Sadykov, V. M., Xu, Y., Jing, J., & Wang, H. 2020, ApJ, 897, L6
- Huggins (1865) Huggins, W. 1865, Proceedings of the Royal Society of London Series I, 14, 39
- Hyland et al. (1984) Hyland, A. R., Allen, D. A., Barnes, P. J., & Ward, M. J. 1984, MNRAS, 206, 465
- Jerabkova et al. (2019) Jerabkova, T., Beccari, G., Boffin, H. M. J., et al. 2019, A&A, 627, A57
- Jones & Walker (1988) Jones, B. F. & Walker, M. F. 1988, AJ, 95, 1755
- Jones et al. (2023) Jones, O. C., Nally, C., Habel, N., et al. 2023, Nature Astronomy, 7, 694
- Kaifu et al. (2000) Kaifu, N., Usuda, T., Hayashi, S. S., et al. 2000, PASJ, 52, 1
- Kim et al. (2008) Kim, M. K., Hirota, T., Honma, M., et al. 2008, PASJ, 60, 991
- Kleinmann & Low (1967) Kleinmann, D. E. & Low, F. J. 1967, ApJ, 149, L1
- Koren (2022) Koren, M. 2022, The Atlantic, October 2022, https://www.theatlantic.com/science/archive/2022/10/solar-system-picture-webb-space-telescope-orion-nebula/671715/
- Kounkel et al. (2018) Kounkel, M., Covey, K., Suárez, G., et al. 2018, AJ, 156, 84
- Kounkel et al. (2016a) Kounkel, M., Hartmann, L., Tobin, J. J., et al. 2016a, ApJ, 821, 8
- Kounkel et al. (2016b) Kounkel, M., Megeath, S. T., Poteet, C. A., Fischer, W. J., & Hartmann, L. 2016b, ApJ, 821, 52
- Kuhn et al. (2019) Kuhn, M. A., Hillenbrand, L. A., Sills, A., Feigelson, E. D., & Getman, K. V. 2019, ApJ, 870, 32
- Kuiper et al. (1975) Kuiper, T. B. H., Zuckerman, B., & Kuiper, E. N. R. 1975, in Bulletin of the American Astronomical Society, Vol. 7, 466
- Kwan & Scoville (1976) Kwan, J. & Scoville, N. 1976, ApJ, 210, L39
- Lada et al. (2004) Lada, C. J., Muench, A. A., Lada, E. A., & Alves, J. F. 2004, AJ, 128, 1254
- Laques & Vidal (1979) Laques, P. & Vidal, J. L. 1979, A&A, 73, 97
- Lee & Burton (2000) Lee, J. K. & Burton, M. G. 2000, MNRAS, 315, 11
- Lonsdale et al. (1982) Lonsdale, C. J., Becklin, E. E., Lee, T. J., & Stewart, J. M. 1982, AJ, 87, 1819
- Low & Lynden-Bell (1976) Low, C. & Lynden-Bell, D. 1976, MNRAS, 176, 367
- Lucas & Roche (2000) Lucas, P. W. & Roche, P. F. 2000, MNRAS, 314, 858
- Lucas et al. (2001) Lucas, P. W., Roche, P. F., Allard, F., & Hauschildt, P. H. 2001, MNRAS, 326, 695
- Lucas et al. (2005) Lucas, P. W., Roche, P. F., & Tamura, M. 2005, MNRAS, 361, 211
- Lucas et al. (2006) Lucas, P. W., Weights, D. J., Roche, P. F., & Riddick, F. C. 2006, MNRAS, 373, L60
- Luhman et al. (2000) Luhman, K. L., Rieke, G. H., Young, E. T., et al. 2000, ApJ, 540, 1016
- Luhman et al. (2017) Luhman, K. L., Robberto, M., Tan, J. C., et al. 2017, ApJ, 838, L3
- Maíz Apellániz et al. (2022) Maíz Apellániz, J., Barbá, R. H., Fernández Aranda, R., et al. 2022, A&A, 657, A131
- Marley et al. (2007) Marley, M. S., Fortney, J. J., Hubickyj, O., Bodenheimer, P., & Lissauer, J. J. 2007, ApJ, 655, 541
- Marley et al. (2021) Marley, M. S., Saumon, D., Visscher, C., et al. 2021, ApJ, 920, 85
- McCaughrean & Gezari (1991) McCaughrean, M. & Gezari, D. 1991, in Astronomical Society of the Pacific Conference Series, Vol. 14, Astronomical Society of the Pacific Conference Series, ed. R. Elston, 301–303
- McCaughrean et al. (2002) McCaughrean, M., Zinnecker, H., Andersen, M., Meeus, G., & Lodieu, N. 2002, The Messenger, 109, 28
- McCaughrean (1988) McCaughrean, M. J. 1988, PhD thesis, University of Edinburgh
- McCaughrean (1989) McCaughrean, M. J. 1989, UKIRT Newsletter no. 19, P. Williams, ed., ISSN 0143–0599
- McCaughrean et al. (1998) McCaughrean, M. J., Chen, H., Bally, J., et al. 1998, ApJ, 492, L157
- McCaughrean & Mac Low (1997) McCaughrean, M. J. & Mac Low, M.-M. 1997, AJ, 113, 391
- McCaughrean & O’Dell (1996) McCaughrean, M. J. & O’Dell, C. R. 1996, AJ, 111, 1977
- McCaughrean & Stauffer (1994) McCaughrean, M. J. & Stauffer, J. R. 1994, AJ, 108, 1382
- Meeus & McCaughrean (2005) Meeus, G. & McCaughrean, M. J. 2005, Astronomische Nachrichten, 326, 977
- Megeath et al. (2012) Megeath, S. T., Gutermuth, R., Muzerolle, J., et al. 2012, AJ, 144, 192
- Meingast et al. (2016) Meingast, S., Alves, J., Mardones, D., et al. 2016, A&A, 587, A153
- Menten & Reid (1995) Menten, K. M. & Reid, M. J. 1995, ApJ, 445, L157
- Menten et al. (2007) Menten, K. M., Reid, M. J., Forbrich, J., & Brunthaler, A. 2007, A&A, 474, 515
- Minchin et al. (1991) Minchin, N. R., Hough, J. H., McCall, A., et al. 1991, MNRAS, 248, 715
- Muench et al. (2008) Muench, A., Getman, K., Hillenbrand, L., & Preibisch, T. 2008, in Handbook of Star Forming Regions, Volume I, ed. B. Reipurth (Astronomy Society of the Pacific: San Francisco), 483
- Muench et al. (2002) Muench, A. A., Lada, E. A., Lada, C. J., & Alves, J. 2002, ApJ, 573, 366
- Ney & Allen (1969) Ney, E. P. & Allen, D. A. 1969, ApJ, 155, L193
- O’Dell (2001a) O’Dell, C. R. 2001a, PASP, 113, 29
- O’Dell (2001b) O’Dell, C. R. 2001b, ARA&A, 39, 99
- O’Dell & Doi (2003) O’Dell, C. R. & Doi, T. 2003, AJ, 125, 277
- O’Dell & Henney (2008) O’Dell, C. R. & Henney, W. J. 2008, AJ, 136, 1566
- O’Dell et al. (2008) O’Dell, C. R., Muench, A., Smith, N., & Zapata, L. 2008, in Handbook of Star Forming Regions, Volume I, ed. B. Reipurth (Astronomy Society of the Pacific: San Francisco), 544
- O’Dell & Wen (1994) O’Dell, C. R. & Wen, Z. 1994, ApJ, 436, 194
- O’Dell et al. (1993) O’Dell, C. R., Wen, Z., & Hu, X. 1993, ApJ, 410, 696
- O’Dell & Wong (1996) O’Dell, C. R. & Wong, K. 1996, AJ, 111, 846
- Oudmaijer et al. (1997) Oudmaijer, R. D., Drew, J. E., Barlow, M. J., Crawford, I. A., & Proga, D. 1997, MNRAS, 291, 110
- Parenago (1954) Parenago, P. P. 1954, Trudy Gosudarstvennogo Astronomicheskogo Instituta, 25, 3
- Parker & Quanz (2012) Parker, R. J. & Quanz, S. P. 2012, MNRAS, 419, 2448
- Peimbert (1982) Peimbert, M. 1982, Annals of the New York Academy of Sciences, 395, 24
- Pellegrini et al. (2009) Pellegrini, E. W., Baldwin, J. A., Ferland, G. J., Shaw, G., & Heathcote, S. 2009, ApJ, 693, 285
- Perrin et al. (2014) Perrin, M. D., Sivaramakrishnan, A., Lajoie, C.-P., et al. 2014, in Society of Photo-Optical Instrumentation Engineers (SPIE) Conference Series, Vol. 9143, Space Telescopes and Instrumentation 2014: Optical, Infrared, and Millimeter Wave, ed. J. Oschmann, Jacobus M., M. Clampin, G. G. Fazio, & H. A. MacEwen, 91433X
- Petr et al. (1998) Petr, M. G., Coudé du Foresto, V., Beckwith, S. V. W., Richichi, A., & McCaughrean, M. J. 1998, ApJ, 500, 825
- Petr-Gotzens (1998) Petr-Gotzens, M. G. 1998, PhD thesis, Ruprecht-Karls University of Heidelberg, Germany
- Petr-Gotzens et al. (2008) Petr-Gotzens, M. G., Sterzik, M. F., Köhler, R., et al. 2008, in Journal of Physics Conference Series, Vol. 131, Journal of Physics Conference Series, 012026
- Phillips et al. (2020) Phillips, M. W., Tremblin, P., Baraffe, I., et al. 2020, A&A, 637, A38
- Platais et al. (2020) Platais, I., Robberto, M., Bellini, A., et al. 2020, AJ, 159, 272
- Preibisch et al. (1999) Preibisch, T., Balega, Y., Hofmann, K.-H., Weigelt, G., & Zinnecker, H. 1999, New A, 4, 531
- Prosser et al. (1994) Prosser, C. F., Stauffer, J. R., Hartmann, L., et al. 1994, ApJ, 421, 517
- Rauscher et al. (2011) Rauscher, B. J., Arendt, R. G., Fixen, D. J., et al. 2011, in Society of Photo-Optical Instrumentation Engineers (SPIE) Conference Series, Vol. 8155, Society of Photo-Optical Instrumentation Engineers (SPIE) Conference Series, 81550C
- Ray et al. (2023) Ray, T. P., McCaughrean, M. J., Caratti o Garatti, A., et al. 2023, Nature
- Rees (1976) Rees, M. J. 1976, MNRAS, 176, 483
- Reipurth et al. (2007) Reipurth, B., Guimarães, M. M., Connelley, M. S., & Bally, J. 2007, AJ, 134, 2272
- Ricci et al. (2008) Ricci, L., Robberto, M., & Soderblom, D. R. 2008, AJ, 136, 2136
- Riddick et al. (2007) Riddick, F. C., Roche, P. F., & Lucas, P. W. 2007, MNRAS, 381, 1077
- Rieke et al. (1973) Rieke, G. H., Low, F. J., & Kleinmann, D. E. 1973, ApJ, 186, L7
- Rieke et al. (2023) Rieke, M. J., Kelly, D. M., Misselt, K., et al. 2023, PASP, 135, 028001
- Rigby et al. (2023) Rigby, J., Perrin, M., McElwain, M., et al. 2023, PASP, 135, 048001
- Rivera-Ortiz et al. (2019) Rivera-Ortiz, P. R., Rodríguez-González, A., Hernández-Martínez, L., Cantó, J., & Zapata, L. A. 2019, ApJ, 885, 104
- Rivilla et al. (2013) Rivilla, V. M., Martín-Pintado, J., Sanz-Forcada, J., Jiménez-Serra, I., & Rodríguez-Franco, A. 2013, MNRAS, 434, 2313
- Robberto et al. (2005) Robberto, M., Beckwith, S. V. W., Panagia, N., et al. 2005, AJ, 129, 1534
- Robberto et al. (2020) Robberto, M., Gennaro, M., Ubeira Gabellini, M. G., et al. 2020, ApJ, 896, 79
- Robberto et al. (2008) Robberto, M., Ricci, L., Da Rio, N., & Soderblom, D. R. 2008, ApJ, 687, L83
- Robberto et al. (2013) Robberto, M., Soderblom, D. R., Bergeron, E., et al. 2013, ApJS, 207, 10
- Rodrigo & Solano (2020) Rodrigo, C. & Solano, E. 2020, in XIV.0 Scientific Meeting (virtual) of the Spanish Astronomical Society, 182
- Scally et al. (1999) Scally, A., Clarke, C., & McCaughrean, M. J. 1999, MNRAS, 306, 253
- Scally et al. (2005) Scally, A., Clarke, C., & McCaughrean, M. J. 2005, MNRAS, 358, 742
- Schaefer (1995) Schaefer, B. E. 1995, ApJ, 444, 739
- Scholz et al. (2022) Scholz, A., Muzic, K., Jayawardhana, R., Quinlan, L., & Wurster, J. 2022, PASP, 134, 104401
- Shimajiri et al. (2015) Shimajiri, Y., Kitamura, Y., Nakamura, F., et al. 2015, ApJS, 217, 7
- Shuping et al. (2014) Shuping, R. Y., Kassis, M., Bally, J., & Morris, M. R. 2014, ApJ, 781, L37
- Silk (1977) Silk, J. 1977, ApJ, 214, 152
- Sitarski et al. (2013) Sitarski, B. N., Morris, M. R., Lu, J. R., et al. 2013, ApJ, 770, 134
- Slesnick et al. (2004) Slesnick, C. L., Hillenbrand, L. A., & Carpenter, J. M. 2004, ApJ, 610, 1045
- Smith et al. (2004) Smith, N., Bally, J., Shuping, R. Y., Morris, M., & Hayward, T. L. 2004, ApJ, 610, L117
- Smith et al. (2005) Smith, N., Bally, J., Shuping, R. Y., Morris, M., & Kassis, M. 2005, AJ, 130, 1763
- Smith et al. (2008) Smith, R. M., Zavodny, M., Rahmer, G., & Bonati, M. 2008, in Society of Photo-Optical Instrumentation Engineers (SPIE) Conference Series, Vol. 7021, High Energy, Optical, and Infrared Detectors for Astronomy III, ed. D. A. Dorn & A. D. Holland, 70210J
- Stanke et al. (2002) Stanke, T., McCaughrean, M. J., & Zinnecker, H. 2002, A&A, 392, 239
- Stolovy et al. (1998) Stolovy, S. R., Burton, M. G., Erickson, E. F., et al. 1998, ApJ, 492, L151
- Stone et al. (1995) Stone, J. M., Xu, J., & Mundy, L. G. 1995, Nature, 377, 315
- Strampelli et al. (2020) Strampelli, G. M., Aguilar, J., Pueyo, L., et al. 2020, ApJ, 896, 81
- Takami et al. (2002) Takami, M., Usuda, T., Sugai, H., et al. 2002, ApJ, 566, 910
- Tamura et al. (2006) Tamura, M., Kandori, R., Kusakabe, N., et al. 2006, ApJ, 649, L29
- Tan (2004) Tan, J. C. 2004, ApJ, 607, L47
- Tauber et al. (1994) Tauber, J. A., Tielens, A. G. G. M., Meixner, M., & Goldsmith, P. F. 1994, ApJ, 422, 136
- Taylor et al. (1986) Taylor, K., Dyson, J. E., Axon, D. J., & Hughes, S. 1986, MNRAS, 221, 155
- Taylor et al. (1984) Taylor, K. N. R., Storey, J. W. V., Sandell, G., Williams, P. M., & Zealey, W. J. 1984, Nature, 311, 236
- Tedds et al. (1999) Tedds, J. A., Brand, P. W. J. L., & Burton, M. G. 1999, MNRAS, 307, 337
- Tedds et al. (1995) Tedds, J. A., Brand, P. W. J. L., Burton, M. G., Chrysostomou, A., & Fernandes, A. J. L. 1995, Ap&SS, 233, 39
- Throop et al. (2001) Throop, H. B., Bally, J., Esposito, L. W., & McCaughrean, M. J. 2001, Science, 292, 1686
- Tielens et al. (1993) Tielens, A. G. G. M., Meixner, M. M., van der Werf, P. P., et al. 1993, Science, 262, 86
- Tody (1986) Tody, D. 1986, in Society of Photo-Optical Instrumentation Engineers (SPIE) Conference Series, Vol. 627, Instrumentation in astronomy VI, ed. D. L. Crawford, 733
- Tody (1993) Tody, D. 1993, in Astronomical Society of the Pacific Conference Series, Vol. 52, Astronomical Data Analysis Software and Systems II, ed. R. J. Hanisch, R. J. V. Brissenden, & J. Barnes, 173
- Tokovinin et al. (2020) Tokovinin, A., Petr-Gotzens, M. G., & Briceño, C. 2020, AJ, 160, 268
- Trimble & Leonard (1995) Trimble, V. & Leonard, P. J. T. 1995, PASP, 107, 1
- Trumpler (1931) Trumpler, R. J. 1931, PASP, 43, 255
- van Altena et al. (1988) van Altena, W. F., Lee, J. T., Lee, J. F., Lu, P. K., & Upgren, A. R. 1988, AJ, 95, 1744
- van Elteren et al. (2019) van Elteren, A., Portegies Zwart, S., Pelupessy, I., Cai, M. X., & McMillan, S. L. W. 2019, A&A, 624, A120
- Walker & Jones (1988) Walker, M. F. & Jones, B. F. 1988, PASP, 100, 1505
- Weights et al. (2008) Weights, D. J., Lucas, P. W., Roche, P. F., Pinfield, D. J., & Riddick, F. 2008, MNRAS, 392, 817
- Werner et al. (1983) Werner, M. W., Dinerstein, H. L., & Capps, R. W. 1983, ApJ, 265, L13
- Whittet (2022) Whittet, D. C. B. 2022, Dust in the Galactic Environment (Third Edition) (Bristol: IOP)
- Whitworth et al. (2007) Whitworth, A., Bate, M. R., Nordlund, Å., Reipurth, B., & Zinnecker, H. 2007, in Protostars and Planets V, ed. B. Reipurth, D. Jewitt, & K. Keil, 459
- Whitworth (2018) Whitworth, A. P. 2018, in Handbook of Exoplanets, ed. H. J. Deeg & J. A. Belmonte (Heidelberg: Springer-Verlag GmbH), 95
- Wilson (1937) Wilson, O. C. 1937, PASP, 49, 338
- Wynn-Williams & Becklin (1974) Wynn-Williams, C. G. & Becklin, E. E. 1974, PASP, 86, 5
- Wynn-Williams et al. (1984) Wynn-Williams, C. G., Genzel, R., Becklin, E. E., & Downes, D. 1984, ApJ, 281, 172
- Young Owl et al. (2000) Young Owl, R. C., Meixner, M. M., Wolfire, M., Tielens, A. G. G. M., & Tauber, J. 2000, ApJ, 540, 886
- Youngblood et al. (2016) Youngblood, A., Ginsburg, A., & Bally, J. 2016, AJ, 151, 173
- Zapata et al. (2006) Zapata, L. A., Ho, P. T. P., Rodríguez, L. F., et al. 2006, ApJ, 653, 398
- Zapata et al. (2005) Zapata, L. A., Rodríguez, L. F., Ho, P. T. P., et al. 2005, ApJ, 630, L85
- Zapata et al. (2004) Zapata, L. A., Rodríguez, L. F., Kurtz, S. E., & O’Dell, C. R. 2004, AJ, 127, 2252
- Zapata et al. (2009) Zapata, L. A., Schmid-Burgk, J., Ho, P. T. P., Rodríguez, L. F., & Menten, K. M. 2009, ApJ, 704, L45
- Zinnecker et al. (1993) Zinnecker, H., McCaughrean, M. J., & Wilking, B. A. 1993, in Protostars and Planets III, ed. E. H. Levy & J. I. Lunine, 429