HST FUV Spectroscopy of Super Star Cluster A in the Green Pea Analog Mrk 71: Revealing the Presence of Very Massive Stars
Abstract
Mrk 71 is a low metallicity ( Z☉) starburst region in the local dwarf galaxy NGC 2366, hosting two super star clusters (SSCs A and B), and is recognized as a Green Pea (GP) analog with SSC A responsible for the GP properties. We present STIS and FOS far-ultraviolet (FUV) spectra of the embedded SSC Mrk 71-A obtained with the Hubble Space Telescope (HST). The STIS FUV spectrum shows the characteristic features of very massive stars (VMS, masses M⊙) and we derive an age of Myr by comparison with the Charlot & Bruzual suite of spectral population synthesis models with upper mass limits of 300 and 600 M⊙. We compare the STIS spectrum with all known SSC spectra exhibiting VMS signatures: NGC 5253-5, R136a, NGC 3125-A1 and the Sunburst cluster. We find that the cluster mass-loss rates and wind velocities, as characterized by the C iv P Cygni profiles and the He ii emission line strengths, are very similar over to 0.4 Z☉. This agrees with predictions that the optically thick winds of VMS will be enhanced near the Eddington limit and show little metallicity dependence. We find very strong damped Lyman- absorption with (H i) cm-2 associated with Mrk 71-A. We discuss the natal environment of this young SSC in terms of radiatively-driven winds, catastrophic cooling and recent models where the cluster is surrounded by highly pressurized clouds with large neutral columns.
1 Introduction
The distinction between young massive star clusters (YMCs) found in nearby galaxies and globular clusters (GCs) formed at high redshift has become blurred in recent years, with the realization that both populations can be formed in intense star formation episodes when gas pressures are high (Elmegreen & Efremov, 1997; Kruijssen, 2015; Elmegreen, 2018). Super star clusters (SSCs, mass M⊙, radius pc) are the most massive subset of YMCs and are only found locally in galaxy mergers, starburst dwarf galaxies and the centers of large galaxies.
Studies of these GC-like systems are critical because they form under high pressure conditions that are similar to those found in star-forming galaxies at the peak of cosmic star formation. The strongly lensed SSC in the Sunburst Arc galaxy at (Rivera-Thorsen et al., 2017b; Chisholm et al., 2019; Vanzella et al., 2020, 2022; Meštrić et al., 2023), and the cluster population of the lensed Sparkler galaxy at (Mowla et al., 2022; Claeyssens et al., 2023; Adamo et al., 2023) offer a rare insight into cluster formation at this peak epoch.
It is thus essential to study local examples of young SSCs to investigate their massive star populations via FUV spectroscopy, and compare them to stellar population synthesis models, as a means of testing low metallicity models at the youngest ages representative of high-z systems, accessible with JWST spectroscopy.
Mrk 71 is a well-studied, low metallicity, local starburst region in the dwarf galaxy NGC 2366 at a distance of 3.44 Mpc (Tolstoy et al., 1995) with (Izotov et al., 1997; Chen et al., 2023) or 0.16 Z⊙ using the solar oxygen abundance of Asplund et al. (2009).
Micheva et al. (2017) suggest that Mrk 71 is a local Green Pea (GP) analog. GPs are low metallicity, intensely star-forming galaxies with extremely strong [O iii] emission and a typical redshift of due to the selection technique, which puts the strong [O iii] emission into the green band at this redshift (Cardamone et al. 2009). Mrk 71 shares many properties with GPs including a high ionization parameter, and may be a good candidate for the escape of Lyman continuum photons (Komarova et al., 2021). The only substantial difference is that Mrk 71 is 1–2 orders of magnitude less luminous than GPs.
The starburst region of NGC 2366 contains two clusters Mrk 71-A and Mrk 71-B whose properties were first investigated in the FUV by Drissen et al. (2000) with HST using the Faint Object Spectrograph (FOS). For Mrk 71-A, they detected C iv nebular emission and no underlying stellar population. Drissen et al. (2000) concluded that Mrk 71-A is Myr old, in the massive ultracompact H ii region phase with the cluster embedded in natal molecular material, hidden from view in the FUV by dust, and is responsible for the bulk of the ionizing photons in the starburst. They found that Mrk 71-B is older at 3–5 Myr and has evacuated its surrounding region. The two clusters have a projected separation of 5 arcsec or 83 pc. Micheva et al. (2017) show that Mrk 71-A is responsible for the GP-like properties of Mrk 71. They derive a mass of M⊙ by modeling the H luminosity.
Mrk 71 is also well known for having very broad emission wings with a full width zero intensity of km s-1 (Roy et al., 1992; Gonzalez-Delgado et al., 1994; Binette et al., 2009) associated with the strong nebular lines of e.g., [O iii] and H. Komarova et al. (2021) suggest that these features centered on Mrk 71-A originate in a dense, clumpy, Lyman continuum or Lyman--driven superwind. Oey et al. (2017) present CO() observations of Mrk 71-A and detect a compact ( pc) molecular cloud with a mass of M⊙, which is similar to the mass of the SSC itself and implies a high star formation efficiency of 50%. These observations suggest that stellar winds are not effective in fully clearing the natal gas at an age of 1 Myr and may be suppressed by catastrophic cooling due to the high densities in young compact SSCs (eg. Silich et al., 2004; Silich & Tenorio-Tagle, 2017, 2018). Radiation feedback should therefore dominate at the earliest ages as shown by Komarova et al. (2021) and predicted by Silich & Tenorio-Tagle (2013). To further understand the role of suppressed winds, it is necessary to identify the massive star population of Mrk 71-A to quantify the stellar winds, ionizing spectrum and verify its young age.
The well-studied young SSC NGC 5253-5 at the starburst center of the blue compact galaxy NGC 5253 has a similar age to Mrk 71-A of 1 Myr (Calzetti et al., 2015; Smith et al., 2016). NGC 5253-5 was thought to have an age of 3–5 Myr from the presence of broad Wolf-Rayet emission lines in optical spectra (Monreal-Ibero et al., 2010) but Smith et al. (2016) showed that the stellar emission features arise from very massive stars (VMS, mass M⊙) at an age of 1–2 Myr by analyzing HST FUV spectroscopy obtained with the Space Telescope Imaging Spectrograph (STIS). NGC 5253-5 coincides with the peak of the H emission in the galaxy and Smith et al. (2016) showed that the high ionizing flux can only be explained by the presence of VMS. The presence of VMS in Mrk 71-A has been suggested by James et al. (2016) and Micheva et al. (2017) from the detection of He ii emission in narrow-band imaging with the Wide Field Camera 3 (WFC3) on HST.
In Section 2, we present STIS FUV spectroscopic observations of Mrk 71-A and show that VMS are present in the cluster in Section 3. We examine the interstellar extinction and compare the spectrum with stellar population synthesis models in Section 4. We compare the FUV spectrum of Mrk 71-A with all known examples of SSCs containing VMS, and discuss what the STIS observations reveal about the local environment of Mrk 71-A in Section 5. The summary and conclusions are presented in Section 6 .
2 Observations and Data Reduction
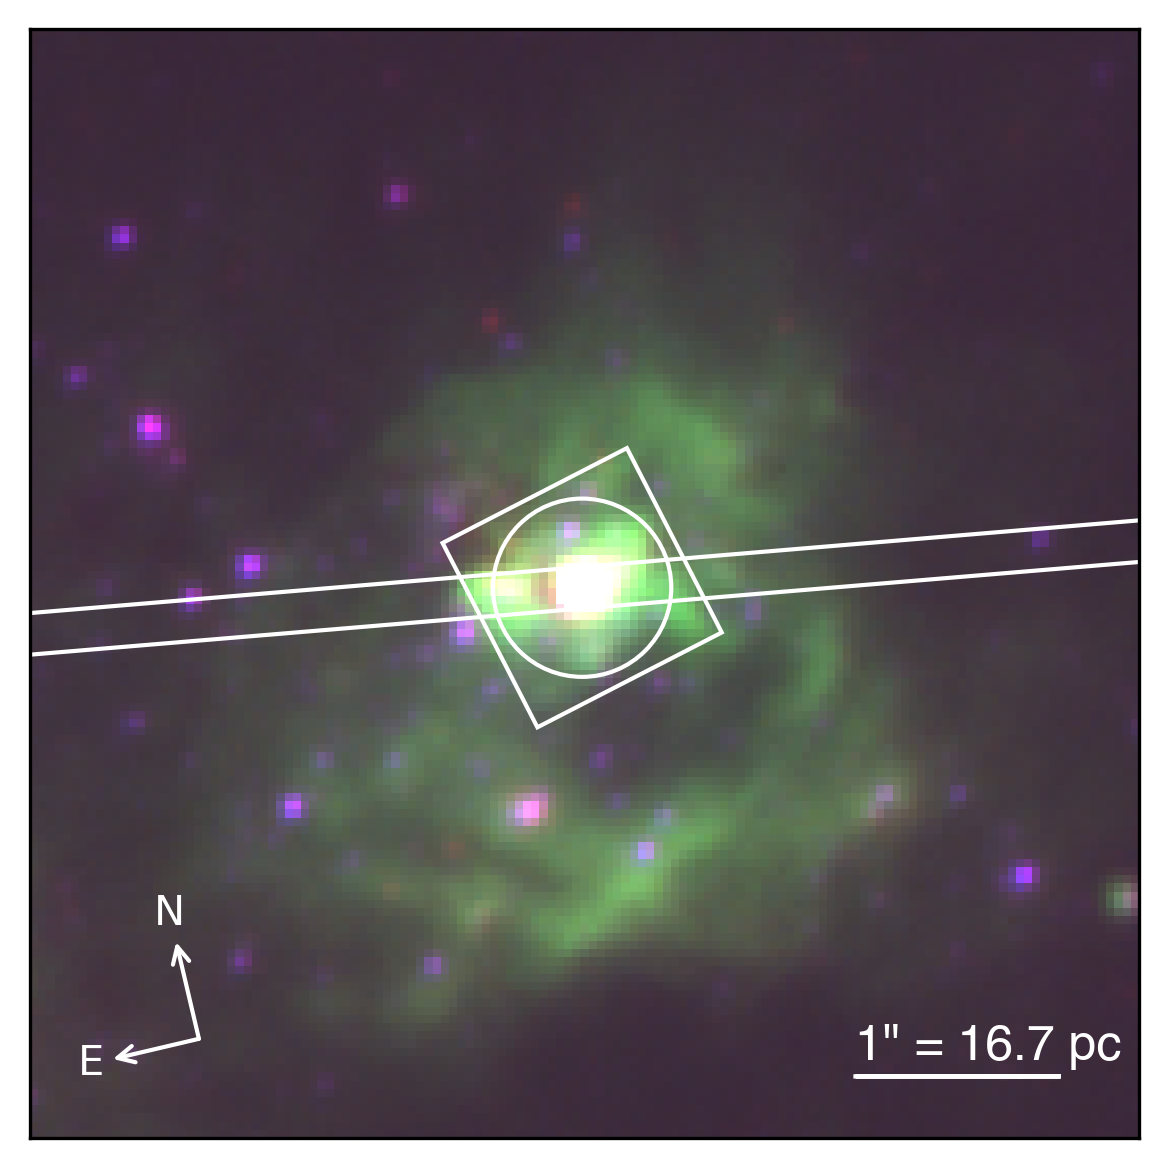
We have obtained FUV long-slit spectroscopy with STIS of Mrk 71 as part of a Cycle 28 program (ID 16261; PI Oey) aimed at investigating the low metallicity feedback and stellar populations of SSCs Mrk 71-A and -B via FUV imaging and spectroscopy. The FUV imaging results are reported in Oey et al. (2023). Here we report on the FUV spectrum of Mrk 71-A. We supplement this dataset with archival Faint Object Spectrograph (FOS) observations of Mrk 71-A (ID 6096; PI Drissen and ID 5246; PI Skillman). In Fig. 1 we show the positions of the STIS and FOS apertures superimposed on WFC3/UVIS (ID 13041; PI James) images of Mrk 71-A.
2.1 STIS Spectra
Long-slit FUV spectra of Mrk 71-A were obtained with HST/STIS in 2021 March and 2022 February. The dataset comprises 11 exposures over 4 visits (totaling 8.7 hr) taken with the G140L grating (1162–1712 Å) and the slit. The position angle was set at 81°.5 to obtain spectra of both Mrk 71-A and -B. The image scale is arcsec/pixel ( pc/pixel) and 0.58 Å/pixel. Each observation was dithered along the slit using a 3-point dither pattern and a spacing of 12 pixels.
![[Uncaptioned image]](/html/2310.03413/assets/x1.png)

The individual 2D spectra were combined as follows. The stistools (Hack et al., 2018) package sshift was used to align the flat-fielded (FLT) images for each visit after the dither offsets were verified by cross-correlating the brightest regions of the spectra. The aligned FLTs were then combined by averaging and weighting by the visit exposure times. The error arrays were combined in quadrature as variance arrays with the square of the exposure times as weights. A flux-calibrated and distortion-corrected 2D spectrum was then created from the combined FLT with the stistools package x2d. We selected a background region 340 pixels (=84) below the SSC-A spectrum and 135 pixels (=33) wide. In Fig. 1, this region is to the west of Mrk 71-A, outside of the field of view shown, and thus well away from the nebula. The background region was averaged and fit with a fifth-order polynomial and then subtracted row by row from the combined X2D image. Finally, a 1D spectrum was extracted by summing over 11 pixels (=027) in the spatial direction to optimize the signal-to-noise.
The FWHM of Mrk 71-A in the spatial direction along the STIS slit is measured to be pixels by fitting a Gaussian to the profile. From the STIS Instrument Handbook (Prichard et al., 2022), the line spread function (LSF) of a point source at 1500 Å has a FWHM of 1.5 pixels for the same observational setup and thus Mrk 71-A is resolved. Subtracting the LSF from the measured FWHM in quadrature, we derive a size of 109 mas or pc in radius. We also measured the FWHM in the spatial direction of an individual exposure to verify that the co-addition of the 11 spectra did not degrade the resolution; we find a FWHM of pixels, giving a deconvolved radius of 0.91 pc, which is within the errors.
The deconvolved FWHM of Mrk 71-A then gives a spectral resolution of 2.65 Å or 550 km s-1 at 1450 Å. We confirm this value by fitting Gaussians to unresolved features (nebular O iii] , interstellar Si ii ) and find a mean FWHM of Å. We correct for a radial velocity of km s-1 (Micheva et al., 2019) for Mrk 71 and leave the data in the original bin size of 0.58 Å.
The signal-to-noise ratio of the final spectrum reaches a maximum of 46 at 1300 Å and decreases to 20 beyond 1600 Å where the G140L sensitivity declines. We present and discuss the spectrum in the next section. As can be seen in Fig. 1, there is another object to the E of Mrk 71-A. The spectrum of this region is nebular and shows strong C iv and O iii] emission. The analysis of the nebular spectra and FUV imaging for Mrk 71-A and -B will be presented in a separate paper.
2.2 FOS Spectra
Mrk 71-A was observed with FOS in 1996 using the G130H grating (1140–1603 Å) and the 086 circular aperture with a total exposure time of 6150 s. The spectrum is presented and discussed in Drissen et al. (2000). A longer wavelength spectrum was obtained in 1993 using the G190H grating (1603–2310 Å) and the 10 square aperture with a total exposure time of 3300 s. The spectrum covering C iii] is discussed in Garnett et al. (1995) and Rigby et al. (2015). We assume that the FOS spectral resolution is 3.2 Å, as appropriate for an extended source, and use the re-calibrated spectra from the atlas of Leitherer et al. (2011). We merged the two wavelength regions by using a scaling factor of 0.90 for the G130H spectrum. This value was derived by comparing the two FOS spectra with the STIS spectrum in the overlap region.
| Ion | Wavelength | Line Type | Velocity | FWHM | EW | Flux | Instrument |
|---|---|---|---|---|---|---|---|
| Å | km s-1 | km s-1 | Å | erg s-1 cm-2 | |||
| N v | 1238.82, 1242.80 | P Cyg em. | 560 | STIS | |||
| O v | 1371.30 | Stellar abs. | STIS | ||||
| P Cygni em. | STIS | ||||||
| P Cygni abs. | STIS | ||||||
| C iv | 1548.20, 1550.78 | P Cyg em. | STIS | ||||
| P Cygni abs. | STIS | ||||||
| He ii | 1640.42 | Stellar em. | STIS | ||||
| O iii] | 1660.81 | Neb. em. | 1.1: | STIS | |||
| O iii] | 1666.15 | Neb. em. | 2.7: | STIS | |||
| Si ii | 1260.42 | IS abs. | STIS | ||||
| O i, Si ii | 1302.17, 1304.37 | IS abs. | STIS | ||||
| C ii | 1334.53, 1335.71 | IS abs. | STIS | ||||
| Si iv | 1393.75 | IS abs. | STIS | ||||
| Si iv | 1402.77 | IS abs. | STIS | ||||
| Si ii | 1526.71 | IS abs. | STIS | ||||
| Fe ii | 1608.45 | IS abs. | STIS | ||||
| Al ii | 1670.79 | IS abs. | STIS | ||||
| C iv | 1549.49 | Neb. em. | FOS | ||||
| O iii] | 1660.81,1666.15 | Neb. em. | 1 | FOS | |||
| Si iii] | 1883.00 | Neb em. | FOS | ||||
| Si iii] | 1892.03 | Neb em. | FOS | ||||
| C iii] | 1907.71 | Neb em. | FOS |
3 Description of the Spectra
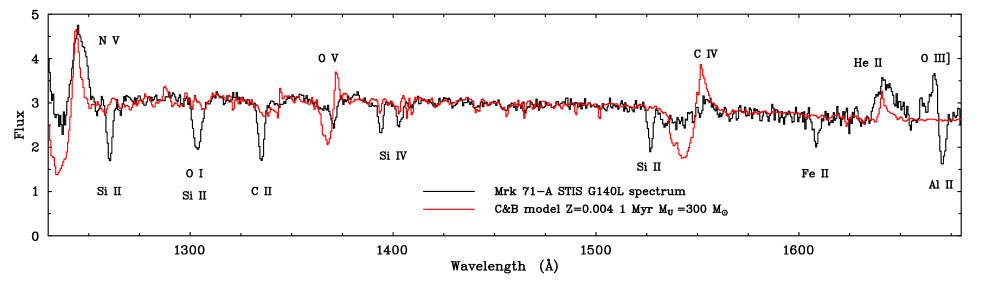
We show the STIS and FOS spectra of Mrk 71-A in Fig. 2 and label the main stellar features, nebular emission lines, and the strong interstellar (IS) absorption lines. Line measurements are provided in Table 1 where negative equivalent widths (EWs) indicate emission features.
One striking feature of the FUV spectrum is the strength of the damped Ly absorption at 1215 Å. The damping wings extend to Å and subsume the N v P Cygni absorption profile. To derive the H i column density and correct the N v profile, the STIS spectrum was first normalized using a spline fit and extrapolated to the bluest wavelength available at 1162 Å. Voigt profiles were then fitted to the spectrum using two components to represent the Milky Way (MW) and Mrk 71-A Ly absorption, following the approach of Hernandez et al. (2021). For the MW component, a value of was adopted from the H i map of HI4PI Collaboration et al. (2016). Radial velocities of (MW) and km s-1 for Mrk 71-A (Micheva et al., 2019) were assumed and the routine voigtfit (Krogager, 2018) was used to fit the observed profile.
We derive cm-2 for the Mrk 71-A line of sight. We discuss this high value in more detail in Section 4.1 but note here that the high column of neutral hydrogen is indicative of a large amount of neutral gas associated with Mrk 71-A. The resulting fit to the damped Ly profile and the corrected N v profile are shown in Fig. 2. We note that we cannot recover the absorption component of the N v P Cygni profile because it has disappeared into the Ly trough. We also note that the STIS spectral resolution at 1215 Å of 650 km s-1 is insufficient to resolve any Ly emission that may be associated with Mrk 71-A from the geo-coronal component given the low radial velocity of km s-1.
The most conspicuous stellar features in the STIS spectrum are the strong N v emission (once corrected for the damped Ly absorption) and the strong and broad (FWHM km s-1) He ii emission. O v is clearly detected and consists of blue-shifted stellar wind absorption and a possible weak, ill-defined P Cygni emission component. This feature is rarely observed in cluster spectra because it is usually produced by the hottest and most massive O stars with short lifetimes. Si iv P Cygni emission is absent, which is consistent with the other spectral features, indicative of the hottest and most massive stars where Si3+ is photoionized to Si4+ (Drew, 1989). The stellar wind column density of Si iv will also be low given the metallicity of Mrk 71 of . The resonance doublet of C iv at is seen as a P Cygni profile and its weakness again demonstrates the low metallicity of the region.
These stellar diagnostic lines (O v, N v, He ii present and Si iv absent) together with the fact that Mrk 71-A is clearly still embedded in its natal gas (Fig. 1, Drissen et al., 2000) indicate that Mrk 71-A is very young and contains very massive stars. Crowther et al. (2016) used spatially resolved STIS FUV spectra of the R136a star cluster in 30 Doradus (age of 1–2 Myr) to show that the broad He ii emission is totally dominated by VMS in the integrated cluster spectrum at this young age. Thus the presence of broad He ii emission in Mrk 71-A at a cluster age of Myr (Drissen et al., 2000) is a clear indicator of main sequence stars more massive than 100 M⊙ (VMS). Likewise, such a strong N v emission feature is only seen at the youngest ages.
An alternative possibility is that the cluster is older ( Myr) and the spectral features are due to the presence of classical WR stars. WN stars would then produce the N v and He ii emission but the standard WN N iv] emission line is absent in the STIS spectrum (Fig. 2). In addition, WC stars are needed to account for the O v feature but the weakness of C iv argues against their presence because the abundance of C is expected to be enhanced through core He-burning. We thus discount that classical WR stars are responsible for the UV spectral features of Mrk 71-A and conclude that the cluster contains VMS. In Sect. 4.2, we compare the spectrum to stellar population synthesis (SPS) models incorporating VMS.
The FOS spectra were taken with 086 and 10 arcsec apertures (as shown in Fig. 1) and are dominated by strong nebular emission lines arising from the ultracompact H ii region. Overall, the spectral features are reminiscent of low metallicity, high redshift star-forming galaxies (e.g. Senchyna et al., 2022; Schaerer et al., 2022). C iii] is very strong with an equivalent width of 20 Å (see also Rigby et al., 2015) and nebular C iv emission is present in the FOS spectrum. The stellar features of N v and O v, although weak, are seen to be present when compared to the STIS spectrum. The G190H spectrum is very noisy near the start at 1603 Å and it is not clear if He ii stellar emission is present because the potential noisy emission feature (marked “He ii ?” in Fig. 2) has a peak wavelength at 1628 Å, although the wavelength calibration near the starting wavelength may be uncertain.
The ratio of [Si iii] to Si iii] can be used as an electron density diagnostic. We use PyNeb (Luridiana et al., 2015) to derive a value of cm-3 adopting an electron temperature of K (Gonzalez-Delgado et al., 1994; Chen et al., 2023). This corresponds to a high thermal pressure of cm-3 K. Mingozzi et al. (2022) show that electron densities derived from the Si iii] lines are insensitive to electron temperature.
The derived density is much higher than the value of 800 cm-3 quoted by Pérez et al. (2001) from the [Ar iv] line ratio measured in ground-based spectra, while this refers to the larger scale H ii region rather than the inner 1 arcsec or 17 pc, as observed with FOS. Micheva et al. (2019) derive values from ground-based IFU data of K and cm-3 for Mrk 71-A from the [S ii] doublet. Likewise, Chen et al. (2023) derive a lower value of cm-3 from the [O ii] ratio for Mrk 71. The much larger obtained from [Si iii] compared to values derived from [Ar iv] and other optical diagnostics is similar to trends in measurements for local blue compact starbursts in the CLASSY sample obtained by Mingozzi et al. (2022). These authors find that UV density diagnostic line ratios are overall dex higher than their optical counterparts. We note that the thermal pressure would be much lower if the optical values of are adopted.
4 Comparison with Models
4.1 Dust Attenuation
We derive the interstellar extinction towards Mrk 71-A by comparing the observed continuum energy distribution of the combined STIS and FOS spectrum to the continuum energy distributions predicted by stellar population synthesis (SPS) models for various values of . We use the single star Binary Population and Spectral Synthesis (BPASS) version 2.2.1 models (Eldridge et al., 2017; Stanway & Eldridge, 2018) with a Kroupa (2001) initial mass function, an upper mass cutoff of 300 M⊙ and a metallicity of . Although we use Charlot & Bruzual (C&B) models to fit the stellar spectral features in Section 4.2, we note that the continuum shape is identical in both BPASS and C&B models.
We merged the G190H FOS (scaled by 0.514) and the STIS spectra to provide a long wavelength baseline for determining the extinction. The spectrum was de-reddened for the Milky Way extinction using a value of E(BV) of 0.033 mag (Schlafly & Finkbeiner, 2011) with the Cardelli et al. (1989) law, corrected for a radial velocity of 95 km s-1, and binned at 1 Å intervals to match the BPASS model spectra.
The nebular continuum arising from ionized gas makes a significant contribution to the total continuum flux of clusters with ages Myr (Reines et al., 2010) and therefore needs to be added to the model spectra. We calculated the nebular continuum by following the analytic approach of Leitherer et al. (1999), which assumes all stellar photons below 912 Å are converted into free-free, free-bound and two-photon emission at longer wavelengths. The resulting nebular continuum shape is simply scaled by the hydrogen ionizing photon rate (H i) before adding to the model stellar continua.
We derived the best fitting extinction value by reddening the model spectra for ages of 1, 2 and 3 Myr using the average SMC Bar extinction law of Gordon et al. (2003) and comparing to the STISFOS spectrum using a approach (Smith et al., 2006; Westmoquette et al., 2014). We normalized the observed and model spectra between 2100–2300 Å (no 2200 Å extinction bump is detected) to provide maximum leverage for determining the reddening from the FUV spectral slope, and determined over the relatively featureless wavelength range 1410–1515 Å. We find or mag for ages of 1–3 Myr. For comparison, James et al. (2016) find a range of from 0.13–0.23 mag for Mrk 71 as a whole using an LMC extinction law. Micheva et al. (2019) find mag for Mrk 71-A from the nebular Balmer emission lines. Chen et al. (2023) use the Balmer lines to derive mag for Mrk 71 overall. We note that these other determinations are based on nebular line ratios and can be higher than the reddening determined from stellar continua for low metallicity galaxies (Shivaei et al., 2020).

Overall, the derived extinction value is low considering the high column density of neutral hydrogen cm-2 along the line of sight (Sect. 3). The Gordon et al. (2003) SMC Bar relationship of (H i)/ cm-2 mag-1 gives a much higher or mag. If we scale this relationship to take account of the lower metallicity of Mrk 71-A, we obtain mag, which is still times higher than the derived value of 0.23 mag. This implies there is little dust in the line of sight to Mrk 71-A.
We also have a STIS spectrum of the older, nearby cluster Mrk 71-B (projected separation of 83 pc) and derive cm-2 along its line of sight by fitting the Ly absorption, taking into account a MW component, as was done for Mrk 71-A in Sect. 3. The Ly absorption profiles for the two clusters are shown in Fig. 3. The H i column density of Mrk 71-A is a factor of 20 times higher than that observed along the line of sight of Mrk 71-B. HST images of the Mrk 71 region show that Mrk 71-B has evacuated its surrounding gas and sits in a cavity (James et al., 2016). The H i column associated with Mrk 71-B therefore arises along the line of sight in the interstellar medium of the parent galaxy NGC 2366. The high H i column density measured for Mrk 71-A is clearly local to the embedded SSC and has a value of cm-2 when corrected for the likely ISM component of NGC 2366.
Turning to the strengths of the interstellar metal absorption lines in the STIS spectra of Mrk 71-A and Mrk 71-B, we also show the wavelength region covering the Si ii , O i , Si ii and C ii 1334,1335 transitions in Fig. 3 for both clusters. We note that the IS absorptions are very similar in strength despite the factor of 20 difference in the (H i) column. Micheva et al. (2017) discuss the strengths of the Si ii IS absorption lines towards Mrk 71-A using the measurements of Leitherer et al. (2011) taken from the FOS spectrum. They find a Si ii ratio of 6.0, indicating that the lines are optically thin. They indirectly derive an upper limit of cm-2 and discuss this in the context of Lyman continuum escape.
With the benefit of having a higher resolution and higher S/N STIS spectrum for Mrk 71-A, we find that the Si ii absorption lines have equivalent widths of 1.58 and 0.93 Å respectively, giving a Si ii ratio of 1.7. This intermediate ratio between optically thick and thin gas, together with the fact that the residual intensities of the absorption lines are close to 0.6 (Fig. 3), suggests that the Si ii IS lines are optically thick but with a low gas covering fraction (Rivera-Thorsen et al., 2017a; Östlin et al., 2021).
The overall similarity in the metal interstellar features along the lines of sight to Mrk 71-A and Mrk 71-B, as shown in Fig. 3, indicates that they are probably formed along the line of sight within the galaxy and are not local to the clusters, as expected for a low-ionization species. It is puzzling that no distinct metal IS absorption features are associated with the high column of H i gas in front of Mrk 71-A. Higher resolution FUV spectra that separate out the MW and NGC 2366/Mrk 71 components are necessary to investigate this in more detail.
![[Uncaptioned image]](/html/2310.03413/assets/x4.png)
4.2 Age and modeling of VMS features
A common technique to determine ages of young massive clusters is to model the UV spectral features using stellar population synthesis models (e.g. Sirressi et al., 2022). It is well known, however, that SPS models with upper mass cutoffs of 100 M⊙ cannot reproduce stellar He ii emission at ages of Myr because of the absence of VMS in the models (e.g. Wofford et al., 2014; Smith et al., 2016; Senchyna et al., 2017; Leitherer et al., 2018). To overcome this deficiency, SPS models are required to incorporate VMS model atmospheres and evolutionary tracks that adopt realistic mass-loss rates for the optically thick winds of VMS.
Recently, Martins & Palacios (2022) have produced the first SPS models including VMS that are tailored to LMC metallicity or 0.4 Z⊙. They adopt empirical mass-loss rates for VMS in R136a (Bestenlehner et al., 2014) for optically thick stellar winds, and the standard mass-loss rates for optically thin O star winds derived by Vink et al. (2001). Martins & Palacios (2022) compare their FUV synthetic spectra at ages of 1 and 2 Myr with the integrated R136a spectrum (Crowther et al., 2016) and NGC 3125-A1 (Wofford et al., 2014) and find reasonable agreement.
Overall, the work of Martins & Palacios (2022) shows that it is possible to match the strengths of the UV spectral features, particularly the He ii emission at LMC metallicity when the correct mass-loss rates are used to account for the optically thick winds of VMS.
We compare the FUV spectrum of Mrk 71-A with the updated SPS models from Bruzual & Charlot (2003), which we refer to as Charlot and Bruzual or C&B models for single stars. These models have the advantage that they cover metallicities down to and thus are more suitable than the Martins & Palacios (2022) models, which are tailored for LMC metallicity.
The revisions to the Bruzual & Charlot (2003) models are described in Plat et al. (2019) and Sánchez et al. (2022). They include updated stellar evolutionary tracks from Chen et al. (2015) for masses up to 600 M⊙, which adopt the mass-loss formalism of Vink et al. (2011), where mass-loss rates are enhanced as the stellar luminosity approaches the Eddington limit, and the metallicity dependence decreases. This scheme allows for relatively higher mass-loss rates for VMS at low metallicity. The C&B models utilize theoretical spectral libraries from Leitherer et al. (2010) and Chen et al. (2015) for O stars computed with wm-basic (Pauldrach et al., 2001) and the powr library for WR stars (Hamann & Gräfener, 2004).
Recently, Wofford et al. (2023) have used the C&B models to fit the HST/COS FUV spectrum of the SSC NGC 3125-A1, which has strong He ii emission and O v absorption present, suggestive of VMS (Wofford et al., 2014). They find an excellent fit to the spectrum for and an age of 2.2 Myr using an upper mass limit of 300 M⊙. Previous attempts at modeling the FUV spectrum with Starburst99 (Leitherer et al., 1999) could not reproduce the strength of He ii without invoking a flat IMF exponent at an age of 3 Myr with an upper mass limit of 100 M⊙ (Wofford et al., 2014).
Senchyna et al. (2021) compare the C&B models with HST/COS FUV spectroscopy of 7 nearby star-forming regions at 0.2–0.4 Z⊙ that exhibit broad (1500–2000 km s-1) He ii emission. They find that the models for continuous SF cannot simultaneously match the UV stellar wind lines and the optical nebular diagnostic lines. The model fits underestimate the strength of the He ii emission and C iv P Cygni absorption and emission, indicating a higher stellar metallicity is required, which is not supported by the nebular lines. To explain this mismatch, Senchyna et al. (2021) suggest that very massive stars formed through binary mass transfer and mergers unaccounted for in the models could explain the under-fitting of the stellar wind lines.
To compare the spectral features present in the STIS FUV spectrum of Mrk 71-A we use the C&B suite of SPS models for and 0.004 with upper mass limits of 300 and 600 M⊙ and a Chabrier (2003) initial mass function. The nebular continuum, scaled by (H i), is added to the model spectrum, and this is reddened by mag using the Gordon et al. (2003) extinction law. The model spectra are then binned to 0.584 Å to replicate the STIS spectrum, which is corrected for foreground MW reddening, Ly absorption, and radial velocity. The models are normalized to the STIS spectrum over the wavelength range 1420–1500 Å.

Comparison of the C&B models with the observed Mrk 71-A spectrum shows that O v wind absorption is only predicted to be present for ages Myr (Wofford et al., 2023) and thus we do not consider models with older ages. The He ii emission strength is under-predicted in all the models we consider. The strongest He ii emission occurs for ages between 0.9–1.1 Myr and we show the model fit for 1 Myr in Fig. 4 for upper limits of 300 and 600 M⊙. There is very little difference between the predicted spectra for the two mass upper limits or the age range 0.9–1.1 Myr.
The C iv P Cygni emission component is well-fitted but the predicted absorption component is too deep and the wind velocity is too low. We have considered whether the weakness of the C iv P Cygni absorption in the data could be due to dilution by a larger nebular continuum contribution, given the high surface brightness of the high density nebular gas (Section 3). We increased the nebular continuum flux in the model by a factor of 2 at 1500 Å (representing 75% of the stellar flux) and find that the depth of the residual absorption decreases from 0.79 to 0.84 of the continuum level, compared to the observed value of 0.92 for the C iv absorption in the Mrk 71-A spectrum. Increasing the nebular contribution by this amount does dilute the C iv P Cygni absorption but not by the required amount. A larger nebular continuum contribution will also affect the UV continuum shape by increasing the continuum flux beyond 1500 Å relative to shorter wavelengths. This effect is not seen in the observed spectra.
The O v wind absorption is well-matched in strength but there is a velocity offset and the emission component is too strong. Finally, N v is too weak and narrow although the large damped Ly correction renders this feature uncertain in the observations. The narrow widths of the C iv absorption and He ii emission indicate that the wind outflow velocities at in the models are underestimated.
We also compare the Mrk 71-A STIS spectrum with C&B models for in the lower panel of Fig. 4. The He ii emission is under-predicted again, as expected, and the C iv P Cygni emission and absorption are too strong, presumably because of the higher metallicity. In summary, the best fitting SPS model is for and Myr. Models at these ages produce the strongest predicted He ii although the strength and width are not well-matched. The derived age is in excellent agreement with the value of Myr estimated by Drissen et al. (2000).
In summary, the C&B models are not able to reproduce most of the stellar wind features in the Mrk 71-A FUV spectrum. In particular, the He ii flux and line width are both under-predicted. This is in contrast to the excellent fit to the spectrum of NGC 3125-A1 at LMC metallicity by Wofford et al. (2023) using the C&B models. We note that the C&B models are incomplete because they do not include tailored atmosphere models for VMS with optically thick winds. Instead they rely on the wm-basic O star atmosphere models to represent VMS at young ages and these have optically-thin winds. As shown by Crowther et al. (2016), He ii emission is exclusively produced by VMS at ages of 1–2 Myr, and this feature will be too weak and too narrow in SPS models that do not include optically thick winds for VMS. For NGC 3125-A1, Wofford et al. (2023) determine an age of 2.2 Myr and find that WR stars with masses M⊙ start to appear at this early age in the models with an upper mass limit of 300 M⊙ and . Thus, the C&B models switch to using optically thick wind models to account for these late WN (WNL) stars, and this will enhance the He ii emission line strength sufficiently to agree with the observations. WR stars are lacking at all ages in the Z=0.002 C&B models.
5 Discussion
5.1 Comparison with other SSC VMS Spectra
In Fig. 5 we compare the FUV spectrum of Mrk 71-A with all known examples of VMS in SSCs. The spectra are ordered by increasing age and from top to bottom. The STIS spectra of NGC 5253-5 (Smith et al., 2016), R136a (Crowther et al., 2016) and NGC 3125-A1 (Wofford et al., 2014) are shown together with the VLT MUSE and X-Shooter spectrum of the Sunburst cluster (source 5.1) (Meštrić et al., 2023). The STIS spectra have been corrected for damped Ly absorption, continuum-normalized to aid comparison, and aligned in wavelength using the He ii emission feature.
The blue compact dwarf galaxy NGC 5253 hosts a central young starburst containing 3 SSCs (Smith et al., 2020). The cluster NGC 5253-5 coincides with the peak of the H emission in the galaxy and is visible at FUV wavelengths. R136a is the resolved, central ionizing cluster of the 30 Doradus H ii region in the LMC and the STIS spectrum from Crowther et al. (2016) represents the integrated light of R136a. The cluster A1 in the blue compact dwarf galaxy NGC 3125 is well known for having very strong He ii emission (Chandar et al., 2004) that could not be modeled with SPS models assuming a Wolf-Rayet origin (Wofford et al., 2014). As described in the previous section, Wofford et al. (2023) have successfully fitted the FUV spectrum with C&B models including VMS. The final object shown in Fig. 5 is the cluster (source 5.1) in the lensed Sunburst Arc galaxy at from Meštrić et al. (2023) who identify VMS spectral features and fit the spectrum using the Martins & Palacios (2022) SPS models including VMS. A metallicity of was derived by Chisholm et al. (2019) and by Pascale et al. (2023).
We now compare the VMS spectral features shown in Fig. 5 with the aim of providing insights on the cluster winds at young ages and as a function of metallicity. It is clear that Mrk 71-A has the lowest metallicity because the C iv P Cygni absorption feature is very weak compared to the other clusters, which all have LMC-like metallicities. Chisholm et al. (2019) show that the C iv absorption strength is a good metallicity indicator using Starburst99 SPS models (Leitherer et al., 1999). This dependence is also shown in Fig. 4 for the C&B models.
The blue edge of the C iv absorption profile is one of the main observational diagnostics of stellar wind velocities in O stars. The scaling of the wind terminal velocity with is not well constrained from observations because of the difficulty of measuring stellar wind velocities at low where the C iv absorption is weak and unsaturated. For SPS modeling as a function of , the relationship of Leitherer et al. (1992) derived from radiatively-driven wind theory is usually adopted with .
We can examine the dependence by comparing wind velocities in Fig. 5. The dashed vertical line at km s-1 represents the measured maximum wind velocity for Mrk 71-A. It can be seen that the local clusters at LMC-like metallicity have very similar wind velocities and thus there appears to be little if any scaling of wind velocity with . The Sunburst Cluster at does, however, appear to have a lower maximum wind velocity of km s-1.
Empirical measurements of wind velocities in the literature for individual O stars as a function of show contrasting results. The large HST program Ultraviolet Legacy Library of Young Stars as Essential Standards (ULLYSES)111https://ullyses.stsci.edu/index.html (Roman-Duval et al., 2020) is set to improve our understanding of OB stars as a function of by the analysis of the UV spectra for a significant number of OB stars in Local Group galaxies. Hawcroft et al. (2023) used 149 OB stars in the LMC and SMC from the ULLYSES dataset to measure the dependence of the wind terminal velocity on . They find that , which is steeper than the theoretical prediction of (Leitherer et al., 1992). The earlier study of Garcia et al. (2014) determined wind velocities for 8 OB stars in IC 1613 (Z) and found no clear differences between IC 1613, SMC or LMC OB stars. ULLYSES should improve on this small sample by increasing the dataset to OB stars in Local Group galaxies below SMC metallicity.
From the above, and given that C iv absorption originates in O stars, we would expect to see a lower maximum wind velocity for Mrk 71-A for its lower but this is not seen and is instead similar to LMC cluster values. Garcia et al. (2014) suggest that the similar wind velocities they find for IC 1613 OB stars compared to similar stars in the LMC and SMC could be due to an enhanced Fe abundance in this galaxy. Drissen et al. (2001) discuss the Fe abundance in the Luminous Blue Variable star V1 in Mrk 71 and find that it is SMC-like from modeling the strengths of the Fe ii absorption lines. We note, however, that Fe is the main driver of mass loss in the inner wind while C, N and O are responsible for the wind acceleration to terminal velocity in the supersonic regime (Vink, 2022).
We now discuss the strength and width of the He ii emission line, which is found exclusively in VMS (Crowther et al., 2016) at very young ages ( Myr) and are good indicators of wind density and velocity for the He ii formation region.
The He ii emission line profiles for Mrk 71-A, R136a and the Sunburst Cluster are remarkably similar in strength and width with EWs of (Mrk 71-A; Table 1), (R136a; Crowther et al., 2016) and Å (Sunburst Cluster; Meštrić et al., 2023). Likewise, the FWHMs are 1770, 1970 and 1610 km s-1. These similarities suggest that despite the difference in metallicity and redshift, the SSC winds in the VMS phase have comparable mass loss rates and velocities or feedback efficiencies. This is in contrast to the weak C iv P Cygni absorption feature in Mrk 71-A, which is dominated by O stars, suggesting a mass loss rate much lower than LMC metallicity although the C iv wind velocities are similar. The other two SSCs NGC 5253-5 and NGC 3125-A1 have stronger and narrower He ii emission features. In Section 4.2, we noted that the C&B models at 2.2 Myr for NGC 3125-A1 contain VMS and WNL stars with the presence of WNL stars probably enhancing the He ii emission line strength. We thus speculate that the stronger and narrower He ii emission feature shared by these two SSCs may be due to both VMS and WNL stars whereas the He ii emission line profiles for Mrk 71-A, R136a and the Sunburst Cluster are produced by VMS only. We note that Wofford et al. (2023) rule out a nebular contribution to He ii in NGC 3125-A1.
The auroral O iii] emission lines are present in the spectra of Mrk 71-A, NGC 5253-5 and the Sunburst Cluster (Fig. 5). Both Mrk 71-A and NGC 5253-5 are immersed in ultracompact H ii regions whereas R136a and NGC 3125-A1, which do not show O iii], have been cleared of natal gas. This suggests that the Sunburst Cluster may be in the ultracompact H ii region phase.
The strongest emission feature in the FUV spectra of the local SSCs in Fig. 5 is N v ; the strength of this feature is only apparent when the damped Lyman- absorption feature has been removed. We note that the two oldest clusters NGC 3125-A1 and the Sunburst show N iv] emission in agreement with the VMS SPS model predictions of Martins & Palacios (2022). These models predict a strong nitrogen enrichment after 1.5 Myr that boosts the strength of N iv] . O v is present in the local SSCs and appears as a blue-shifted absorption component with little to no emission, in contrast to SPS models that predict strong emission (Fig. 4). O v is absent in the Sunburst cluster and Meštrić et al. (2023) argue that this is due to the older age of the cluster.
Overall, the similar emission line strengths and wind velocities for the SSC spectra shown in Fig. 4 argue for a weak dependency on metallicity. We find that the wind velocity scaling with is close to constant as predicted by Leitherer et al. (1992). The wind mass-loss rates also show little if any scaling with as evidenced by the similar He ii emission line profiles at and . This can be explained by the fact that VMS are expected to be close to their Eddington limits and their mass-loss rates will be strongly enhanced and the metallicity dependence for mass loss will decrease (Vink et al., 2011; Chen et al., 2015). For comparison, the mass-loss rates of optically thin O star winds are predicted to scale as (Leitherer et al., 1992; Vink et al., 2001). The lack of scaling of the cluster wind parameters suggests that the VMS feedback efficiency is largely independent of metallicity over the range investigated for clusters at ages Myr.
5.2 The local environment of Mrk 71-A
We now consider the local environment of Mrk 71-A to provide an overall view of a young SSC embedded in its natal gas at low . At the center is the 1 Myr old SSC A (Sect. 4.2) with a radius of 0.9 pc (Sect. 2.1) and a mass of M⊙ (Micheva et al., 2017). Mrk 71-A is ionizing a giant H ii region with a density up to cm-3 in the immediate vicinity of the SSC and has a thermal pressure of cm-3 K, derived from the UV [Si iii] lines (Sect. 3).
Neutral hydrogen is detected along the line of sight and shown to be associated with Mrk 71-A with a high column density of (H i) cm-2 but little dust (Sect. 4.1). Oey et al. (2017) detect a compact CO cloud with a size of 7 pc and mass of M⊙ coincident with Mrk 71-A. The presence of high density neutral and molecular gas co-located with the SSC is consistent with the findings of Oey et al. (2023) who use FUV nebular C iv imaging of Mrk 71-A to study the mechanical feedback. They show that the observed diffuse C iv surface brightness and its spatial distribution for the SSC A environment are both consistent with model predictions that it is undergoing strong radiative cooling, and driving a momentum-conserving shell due to catastrophic cooling.
Feedback is thus dominated by radiation from the SSC, including from our newly identified VMS. This supports the scenario obtained by Komarova et al. (2021): The giant molecular cloud represents the remnant gas out of which the young SSC formed. It is being fragmented by radiative feedback from the cluster, forming the radiation-driven superwind. The nature of the Lyman-continuum driven wind implies that there must be optically thin channels through which the Lyman continuum photons can escape, and the covering factor of the high column density clouds will then be less than unity.
Pascale et al. (2023) model the Sunburst cluster, its escaping Lyman continuum photons (Rivera-Thorsen et al., 2019) and ionized nebula. They find that the cluster is surrounded by highly pressurized, dense clouds (cm-3), which should have large neutral columns ((H i) cm-2) to survive rapid ejection by radiation pressure. The parameters we find for Mrk 71-A bear similarities to this model, particularly our measured high H i column density of (H i) cm-2 and cm-3.
6 Summary and Conclusions
We have presented STIS and FOS FUV spectra of the local, low metallicity GP analog Mrk 71-A with the aims of identifying the massive star population, verifying the young age, investigating the properties of stellar winds at low and studying the embedded natal gas associated with this SSC.
The FOS spectrum (Drissen et al., 2000) shows that Mrk 71-A is a rare example of a high excitation, local starburst region with nebular C iv and strong C iii] emission (EW Å; Table 1). We are able to uncover the stellar spectral features with our deep and higher resolution STIS spectrum and show that the presence of O v and broad He ii emission with the absence of Si iv P Cygni emission indicates that VMS are present in this very young cluster.
We compare the STIS spectrum of Mrk 71-A with the Charlot & Bruzual suite of SPS models for upper limits of 300 and 600 M⊙ and and 0.004. For , we find that the He ii emission line strength is under-predicted in all the models and is strongest for ages of 0.9–1.1 Myr. There is very little difference in the fits for upper mass limits of 300 or 600 M⊙ (Fig. 4). Overall, the He ii emission in the models is too weak and narrow because wm-basic O star atmosphere models are adopted to represent VMS and these have optically-thin winds. The C iv P Cygni absorption is too deep and the wind velocity is too low for whereas the models provide a poorer fit to the C iv P Cygni feature because the metallicity is too high. We derive an age based on the C&B models of Myr, which is in excellent agreement with that estimated by Drissen et al. (2000).
We compare the low metallicity STIS spectrum of Mrk 71-A with all known examples of SSCs containing VMS: NGC 5253-5 (Smith et al., 2016), R136a (Crowther et al., 2016), NGC 3125-A1 (Wofford et al., 2014) and the Sunburst cluster (Meštrić et al., 2023). The comparison spectra have LMC-like metallicity and it is clear that Mrk 71-A has the lowest because the C iv P Cygni absorption is weak in comparison. We examine the dependence of the cluster wind velocity and find that there appears to be little, if any, scaling with , despite theoretical predictions (Leitherer et al., 1992) and recent measurements (Hawcroft et al., 2023).
The stellar He ii emission line profiles in Mrk 71-A, R136a and the Sunburst cluster are very similar in terms of strength and width and indicate similar wind densities and velocities irrespective of . We conclude that the VMS winds over – have comparable mass-loss rates and velocities or feedback efficiencies. This agrees with the predictions of Vink et al. (2011) that the mass-loss rates of the optically thick VMS winds will be enhanced close to the Eddington limit and the metallicity dependence will decrease.
Although some SPS models now extend to upper mass limits of 300 M⊙ or higher, they lack tailored model atmospheres for VMS with their high mass loss rates and decreased metallicity dependence. The only example to date is the LMC metallicity models of Martins & Palacios (2022). More VMS models are clearly needed to realistically model JWST spectra of low metallicity star-forming galaxies at high redshift when VMS, if present, will dominate the stellar wind and ionizing feedback in young globular clusters.
The STIS spectrum of Mrk 71-A shows an unusually strong damped Lyman- absorption feature with (H i) cm-2 that is associated with the SSC natal gas. We suggest that the covering factor of the H i must be less than one to allow the Lyman continuum photons to escape. The adiabatic cluster wind is expected to be suppressed due to catastrophic cooling because of the high densities and instead the presence of a Lyman continuum-driven wind is observed (Oey et al., 2017; Komarova et al., 2021).
The model of the ionized nebula associated with the Sunburst cluster put forward by Pascale et al. (2023) in which the cluster is surrounded by highly pressurized clouds with large neutral columns has many similarities to the properties we can measure for Mrk 71-A.
We thank the referee for their astute and constructive comments on the manuscript.
We thank Uros Meštrić and Eros Vanzella for kindly providing us with their Sunburst cluster spectrum.
We thank Fabrice Martins for sharing his VMS models and Calum Hawcroft for useful discussions on O stars winds.
BLJ is thankful for support from the European Space Agency (ESA).
M.H. is a Fellow of the Knut & Alice Wallenberg Foundation.
This work made use of v2.2.1 of the Binary Population and Spectral Synthesis (BPASS) models as described in Eldridge et al. (2017) and Stanway & Eldridge (2018).
Based on observations made with the NASA/ESA Hubble Space Telescope, at the Space Telescope Science Institute, which is operated by the Association of Universities for Research in Astronomy, Inc., under NASA contract NAS5-26555. These observations are associated with program #16261. Support for program #16261 was provided by NASA through a grant from the Space Telescope Science Institute, which is operated by the Association of Universities for Research in Astronomy, Inc., under NASA contract NAS 5-26555.
The data presented in this paper can be obtained from the Mikulski Archive for Space Telescopes (MAST) at the Space Telescope Science Institute. The specific observations analyzed can be accessed via https://doi.org/DOI (catalog 10.17909/ye2e-af62).
HST (STIS, FOS)
References
- Adamo et al. (2023) Adamo, A., Usher, C., Pfeffer, J., & Claeyssens, A. 2023, MNRAS, 525, L6, doi: 10.1093/mnrasl/slad084
- Asplund et al. (2009) Asplund, M., Grevesse, N., Sauval, A. J., & Scott, P. 2009, ARA&A, 47, 481, doi: 10.1146/annurev.astro.46.060407.145222
- Bestenlehner et al. (2014) Bestenlehner, J. M., Gräfener, G., Vink, J. S., et al. 2014, A&A, 570, A38, doi: 10.1051/0004-6361/201423643
- Binette et al. (2009) Binette, L., Drissen, L., Ubeda, L., et al. 2009, A&A, 500, 817, doi: 10.1051/0004-6361/200811132
- Bruzual & Charlot (2003) Bruzual, G., & Charlot, S. 2003, MNRAS, 344, 1000, doi: 10.1046/j.1365-8711.2003.06897.x
- Calzetti et al. (2015) Calzetti, D., Johnson, K. E., Adamo, A., et al. 2015, ApJ, 811, 75, doi: 10.1088/0004-637X/811/2/75
- Cardelli et al. (1989) Cardelli, J. A., Clayton, G. C., & Mathis, J. S. 1989, ApJ, 345, 245, doi: 10.1086/167900
- Chabrier (2003) Chabrier, G. 2003, PASP, 115, 763, doi: 10.1086/376392
- Chandar et al. (2004) Chandar, R., Leitherer, C., & Tremonti, C. A. 2004, ApJ, 604, 153
- Chen et al. (2015) Chen, Y., Bressan, A., Girardi, L., et al. 2015, MNRAS, 452, 1068, doi: 10.1093/mnras/stv1281
- Chen et al. (2023) Chen, Y., Jones, T., Sanders, R., et al. 2023, Nature Astronomy, doi: 10.1038/s41550-023-01953-7
- Chisholm et al. (2019) Chisholm, J., Rigby, J. R., Bayliss, M., et al. 2019, ApJ, 882, 182, doi: 10.3847/1538-4357/ab3104
- Claeyssens et al. (2023) Claeyssens, A., Adamo, A., Richard, J., et al. 2023, MNRAS, 520, 2180, doi: 10.1093/mnras/stac3791
- Crowther et al. (2016) Crowther, P. A., Caballero-Nieves, S. M., Bostroem, K. A., et al. 2016, MNRAS, 458, 624, doi: 10.1093/mnras/stw273
- Drew (1989) Drew, J. E. 1989, ApJS, 71, 267, doi: 10.1086/191374
- Drissen et al. (2001) Drissen, L., Crowther, P. A., Smith, L. J., et al. 2001, ApJ, 546, 484, doi: 10.1086/318264
- Drissen et al. (2000) Drissen, L., Roy, J.-R., Robert, C., Devost, D., & Doyon, R. 2000, AJ, 119, 688, doi: 10.1086/301204
- Eldridge et al. (2017) Eldridge, J. J., Stanway, E. R., Xiao, L., et al. 2017, PASA, 34, e058, doi: 10.1017/pasa.2017.51
- Elmegreen (2018) Elmegreen, B. G. 2018, ApJ, 869, 119, doi: 10.3847/1538-4357/aaed45
- Elmegreen & Efremov (1997) Elmegreen, B. G., & Efremov, Y. N. 1997, ApJ, 480, 235, doi: 10.1086/303966
- Garcia et al. (2014) Garcia, M., Herrero, A., Najarro, F., Lennon, D. J., & Alejandro Urbaneja, M. 2014, ApJ, 788, 64, doi: 10.1088/0004-637X/788/1/64
- Garnett et al. (1995) Garnett, D. R., Skillman, E. D., Dufour, R. J., et al. 1995, ApJ, 443, 64, doi: 10.1086/175503
- Gonzalez-Delgado et al. (1994) Gonzalez-Delgado, R. M., Perez, E., Tenorio-Tagle, G., et al. 1994, ApJ, 437, 239, doi: 10.1086/174992
- Gordon et al. (2003) Gordon, K. D., Clayton, G. C., Misselt, K. A., Landolt, A. U., & Wolff, M. J. 2003, ApJ, 594, 279, doi: 10.1086/376774
- Hack et al. (2018) Hack, W., Dencheva, N., Sontag, C., Sosey, M., & Droettboom, M. 2018, in STIS Python User Tools
- Hamann & Gräfener (2004) Hamann, W. R., & Gräfener, G. 2004, A&A, 427, 697, doi: 10.1051/0004-6361:20040506
- Hawcroft et al. (2023) Hawcroft, C., Sana, H., Mahy, L., et al. 2023, arXiv e-prints, arXiv:2303.12165, doi: 10.48550/arXiv.2303.12165
- Hernandez et al. (2021) Hernandez, S., Aloisi, A., James, B. L., et al. 2021, ApJ, 908, 226, doi: 10.3847/1538-4357/abd6c4
- HI4PI Collaboration et al. (2016) HI4PI Collaboration, Ben Bekhti, N., Flöer, L., et al. 2016, A&A, 594, A116, doi: 10.1051/0004-6361/201629178
- Izotov et al. (1997) Izotov, Y. I., Thuan, T. X., & Lipovetsky, V. A. 1997, ApJS, 108, 1, doi: 10.1086/312956
- James et al. (2016) James, B. L., Auger, M., Aloisi, A., Calzetti, D., & Kewley, L. 2016, ApJ, 816, 40, doi: 10.3847/0004-637X/816/1/40
- Komarova et al. (2021) Komarova, L., Oey, M. S., Krumholz, M. R., et al. 2021, ApJ, 920, L46, doi: 10.3847/2041-8213/ac2c09
- Krogager (2018) Krogager, J.-K. 2018, VoigtFit: Absorption line fitting for Voigt profiles, Astrophysics Source Code Library, record ascl:1811.016. http://ascl.net/1811.016
- Kroupa (2001) Kroupa, P. 2001, MNRAS, 322, 231
- Kruijssen (2015) Kruijssen, J. M. D. 2015, MNRAS, 454, 1658, doi: 10.1093/mnras/stv2026
- Leitherer et al. (2018) Leitherer, C., Byler, N., Lee, J. C., & Levesque, E. M. 2018, ApJ, 865, 55, doi: 10.3847/1538-4357/aada84
- Leitherer et al. (2010) Leitherer, C., Ortiz Otálvaro, P. A., Bresolin, F., et al. 2010, ApJS, 189, 309, doi: 10.1088/0067-0049/189/2/309
- Leitherer et al. (1992) Leitherer, C., Robert, C., & Drissen, L. 1992, ApJ, 401, 596, doi: 10.1086/172089
- Leitherer et al. (2011) Leitherer, C., Tremonti, C. A., Heckman, T. M., & Calzetti, D. 2011, AJ, 141, 37, doi: 10.1088/0004-6256/141/2/37
- Leitherer et al. (1999) Leitherer, C., Schaerer, D., Goldader, J. D., et al. 1999, ApJS, 123, 3
- Luridiana et al. (2015) Luridiana, V., Morisset, C., & Shaw, R. A. 2015, A&A, 573, A42, doi: 10.1051/0004-6361/201323152
- Martins & Palacios (2022) Martins, F., & Palacios, A. 2022, A&A, 659, A163, doi: 10.1051/0004-6361/202243048
- Meštrić et al. (2023) Meštrić, U., Vanzella, E., Upadhyaya, A., et al. 2023, A&A, 673, A50, doi: 10.1051/0004-6361/202345895
- Micheva et al. (2019) Micheva, G., Christian Herenz, E., Roth, M. M., Östlin, G., & Girichidis, P. 2019, A&A, 623, A145, doi: 10.1051/0004-6361/201834838
- Micheva et al. (2017) Micheva, G., Oey, M. S., Jaskot, A. E., & James, B. L. 2017, ApJ, 845, 165, doi: 10.3847/1538-4357/aa830b
- Mingozzi et al. (2022) Mingozzi, M., James, B. L., Arellano-Córdova, K. Z., et al. 2022, ApJ, 939, 110, doi: 10.3847/1538-4357/ac952c
- Monreal-Ibero et al. (2010) Monreal-Ibero, A., Vílchez, J. M., Walsh, J. R., & Muñoz-Tuñón, C. 2010, A&A, 517, A27, doi: 10.1051/0004-6361/201014154
- Mowla et al. (2022) Mowla, L., Iyer, K. G., Desprez, G., et al. 2022, ApJ, 937, L35, doi: 10.3847/2041-8213/ac90ca
- Oey et al. (2023) Oey, M., Sawant, A., Danehkar, A., et al. 2023, ApJ, in preparation
- Oey et al. (2017) Oey, M. S., Herrera, C. N., Silich, S., et al. 2017, ApJ, 849, L1, doi: 10.3847/2041-8213/aa9215
- Östlin et al. (2021) Östlin, G., Rivera-Thorsen, T. E., Menacho, V., et al. 2021, ApJ, 912, 155, doi: 10.3847/1538-4357/abf1e8
- Pascale et al. (2023) Pascale, M., Dai, L., McKee, C. F., & Tsang, B. T. H. 2023, arXiv e-prints, arXiv:2301.10790, doi: 10.48550/arXiv.2301.10790
- Pauldrach et al. (2001) Pauldrach, A. W. A., Hoffmann, T. L., & Lennon, M. 2001, A&A, 375, 161, doi: 10.1051/0004-6361:20010805
- Pérez et al. (2001) Pérez, E., González Delgado, R., & Vílchez, J. M. 2001, Astrophysics and Space Science Supplement, 277, 83, doi: 10.1023/A:1012735812409
- Plat et al. (2019) Plat, A., Charlot, S., Bruzual, G., et al. 2019, MNRAS, 490, 978, doi: 10.1093/mnras/stz2616
- Prichard et al. (2022) Prichard, L., Welty, D., & Jones, A. 2022, in STIS Instrument Handbook for Cycle 30 v. 21
- Reines et al. (2010) Reines, A. E., Nidever, D. L., Whelan, D. G., & Johnson, K. E. 2010, ApJ, 708, 26, doi: 10.1088/0004-637X/708/1/26
- Rigby et al. (2015) Rigby, J. R., Bayliss, M. B., Gladders, M. D., et al. 2015, ApJ, 814, L6, doi: 10.1088/2041-8205/814/1/L6
- Rivera-Thorsen et al. (2017a) Rivera-Thorsen, T. E., Östlin, G., Hayes, M., & Puschnig, J. 2017a, ApJ, 837, 29, doi: 10.3847/1538-4357/aa5d0a
- Rivera-Thorsen et al. (2017b) Rivera-Thorsen, T. E., Dahle, H., Gronke, M., et al. 2017b, A&A, 608, L4, doi: 10.1051/0004-6361/201732173
- Rivera-Thorsen et al. (2019) Rivera-Thorsen, T. E., Dahle, H., Chisholm, J., et al. 2019, Science, 366, 738, doi: 10.1126/science.aaw0978
- Roman-Duval et al. (2020) Roman-Duval, J., Proffitt, C. R., Taylor, J. M., et al. 2020, Research Notes of the AAS, 4, 205, doi: 10.3847/2515-5172/abca2f
- Roy et al. (1992) Roy, J.-R., Aube, M., McCall, M. L., & Dufour, R. J. 1992, ApJ, 386, 498, doi: 10.1086/171035
- Sánchez et al. (2022) Sánchez, S. F., Barrera-Ballesteros, J. K., Lacerda, E., et al. 2022, ApJS, 262, 36, doi: 10.3847/1538-4365/ac7b8f
- Schaerer et al. (2022) Schaerer, D., Izotov, Y. I., Worseck, G., et al. 2022, A&A, 658, L11, doi: 10.1051/0004-6361/202243149
- Schlafly & Finkbeiner (2011) Schlafly, E. F., & Finkbeiner, D. P. 2011, ApJ, 737, 103, doi: 10.1088/0004-637X/737/2/103
- Senchyna et al. (2021) Senchyna, P., Stark, D. P., Charlot, S., et al. 2021, MNRAS, 503, 6112, doi: 10.1093/mnras/stab884
- Senchyna et al. (2017) Senchyna, P., Stark, D. P., Vidal-García, A., et al. 2017, MNRAS, 472, 2608, doi: 10.1093/mnras/stx2059
- Senchyna et al. (2022) Senchyna, P., Stark, D. P., Charlot, S., et al. 2022, ApJ, 930, 105, doi: 10.3847/1538-4357/ac5d38
- Shivaei et al. (2020) Shivaei, I., Reddy, N., Rieke, G., et al. 2020, ApJ, 899, 117, doi: 10.3847/1538-4357/aba35e
- Silich & Tenorio-Tagle (2013) Silich, S., & Tenorio-Tagle, G. 2013, ApJ, 765, 43, doi: 10.1088/0004-637X/765/1/43
- Silich & Tenorio-Tagle (2017) —. 2017, MNRAS, 465, 1375, doi: 10.1093/mnras/stw2879
- Silich & Tenorio-Tagle (2018) —. 2018, MNRAS, 478, 5112, doi: 10.1093/mnras/sty1383
- Silich et al. (2004) Silich, S., Tenorio-Tagle, G., & Rodríguez-González, A. 2004, ApJ, 610, 226, doi: 10.1086/421702
- Sirressi et al. (2022) Sirressi, M., Adamo, A., Hayes, M., et al. 2022, AJ, 164, 208, doi: 10.3847/1538-3881/ac9311
- Smith et al. (2020) Smith, L. J., Bajaj, V., Ryon, J., & Sabbi, E. 2020, ApJ, 896, 84, doi: 10.3847/1538-4357/ab8f94
- Smith et al. (2016) Smith, L. J., Crowther, P. A., Calzetti, D., & Sidoli, F. 2016, ApJ, 823, 38, doi: 10.3847/0004-637X/823/1/38
- Smith et al. (2006) Smith, L. J., Westmoquette, M. S., Gallagher, J. S., et al. 2006, MNRAS, 370, 513, doi: 10.1111/j.1365-2966.2006.10507.x
- Stanway & Eldridge (2018) Stanway, E. R., & Eldridge, J. J. 2018, MNRAS, 479, 75, doi: 10.1093/mnras/sty1353
- Tolstoy et al. (1995) Tolstoy, E., Saha, A., Hoessel, J. G., & McQuade, K. 1995, AJ, 110, 1640, doi: 10.1086/117637
- Vanzella et al. (2020) Vanzella, E., Caminha, G. B., Calura, F., et al. 2020, MNRAS, 491, 1093, doi: 10.1093/mnras/stz2286
- Vanzella et al. (2022) Vanzella, E., Castellano, M., Bergamini, P., et al. 2022, A&A, 659, A2, doi: 10.1051/0004-6361/202141590
- Vink (2022) Vink, J. S. 2022, ARA&A, 60, 203, doi: 10.1146/annurev-astro-052920-094949
- Vink et al. (2001) Vink, J. S., de Koter, A., & Lamers, H. J. G. L. M. 2001, A&A, 369, 574, doi: 10.1051/0004-6361:20010127
- Vink et al. (2011) Vink, J. S., Muijres, L. E., Anthonisse, B., et al. 2011, A&A, 531, A132, doi: 10.1051/0004-6361/201116614
- Westmoquette et al. (2014) Westmoquette, M. S., Bastian, N., Smith, L. J., et al. 2014, ApJ, 789, 94, doi: 10.1088/0004-637X/789/2/94
- Wofford et al. (2014) Wofford, A., Leitherer, C., Chandar, R., & Bouret, J.-C. 2014, ApJ, 781, 122, doi: 10.1088/0004-637X/781/2/122
- Wofford et al. (2023) Wofford, A., Sixtos, A., Charlot, S., et al. 2023, MNRAS, 523, 3949, doi: 10.1093/mnras/stad1622