Effects of feedback-free starburst galaxies on the 21-cm signal and reionization history
Abstract
Different star-formation models at Cosmic Dawn produce detectable signatures in the observables of upcoming 21-cm experiments. In this work, we consider the physical scenario of feedback-free starbursts (FFB), according to which the star-formation efficiency (SFE) is enhanced in sufficiently massive halos at early enough times, thus explaining the indication from the James Webb Space Telescope for an excess of bright galaxies at . We model the contribution of FFBs to popII SFE and compute the impact these have on the 21-cm global signal and power spectrum. We show that FFBs affect the evolution of the brightness temperature and the 21-cm power spectrum, but they only have a limited effect on the neutral hydrogen fraction. We investigate how the observables are affected by changes in the underlying star formation model and by contribution from popIII stars. Finally, we forecast the capability of next-generation Hydrogen Epoch of Reionization Array (HERA) to detect the existence of FFB galaxies via power spectrum measurements. Our results show the possibility of a significant detection, provided that popII stars are the main drivers of lowering the spin temperature. Efficient popIII star formation will make the detection more challenging.
I Introduction
Between recombination and reionization, the Universe was permeated with neutral hydrogen. The absorption of CMB photons, collisions between particles and radiation from the first stars excited some of the hydrogen atoms from the singlet to the triplet state. These processes, together with hyperfine transitions that brought the atoms back to the singlet state, sourced the cosmological 21-cm signal (see e.g., Refs. Furlanetto:2006jb ; Pritchard:2011xb for review). Its redshift evolution can be used to probe the conditions of the gas in the intergalactic medium (IGM) across cosmic time.
While at very high redshift, in the so called Dark Ages, the 21-cm signal provides direct access to fluctuations in the matter density field, at Cosmic Dawn below it becomes particularly sensitive to astrophysical processes related to the formation of the first stars and galaxies. The way neutral HI gas heats and ionizes in this phase depends on the efficiency of star formation and it develops inhomogeneously Mesinger:2010ne ; Munoz:2021psm . Different star formation scenarios may lead to very different reionization histories, which can potentially be probed by next generation 21-cm experiments targeting the global signal (e.g., EDGES Bowman:2018yin and SARAS Patra:2014qta ]) or interferometers measuring the power spectrum, such as HERA DeBoer:2016tnn , MeerKAT Wang:2020lkn and SKA Ghara:2016dva .
This perspective is particularly timely, as recent JWST observations seem to suggest an anomalous large number of bright galaxies at high Naidu_2022 ; Donnan_2023 ; Labbe_2023 ; Bouwens:2022gqg ; Mason:2022tiy . Possible explanations point either to inconsistencies in the cosmological CDM model Lovell:2022bhx ; Sabti:2023xwo ; Hirano:2023auh ; Padmanabhan:2023esp or to the presence of uncertainties in the astrophysical model. Solutions that have been suggested within the CDM paradigm usually contain ad-hoc prescriptions to match the observations, e.g., providing enhanced star-formation efficiency Haslbauer:2022vnq , large luminosity-to-mass ratio due to top heavy intial mass functions steinhardt2023templates ; Zackrisson:2011ct ; Inayoshi_2022 or high UV radiation yajima2022 , low dust attenuation Fiore_2023 , or stochasticity in the star-formation history Pallottini:2023yqg .
At the center of our work, we consider instead the scenario of feedback-free starbursts (FFB), which was proposed by the authors of Ref. Dekel:2023ddd . Under the conditions of high density and low metallicity expected at high redshifts in massive dark-matter (DM) halos, star formation is predicted to be enhanced by an increased efficiency in converting the accreted gas into stars. At other epochs and DM halo masses, stellar feedback —namely supernovae, stellar winds, radiative pressure and photo-heating— lead to lower efficiency. FFBs naturally emerge when the free-fall timescale for star formation is , i.e., shorter than the time required for a starburst to generate effective stellar feedback.
While giving rise to a high abundance of bright galaxies at , the FFB scenario may also leave imprints on the 21-cm signal and reionization process. The synergy with 21-cm surveys, therefore, can be the key to provide observable tests for the FFB scenario.
The goal of this work is to investigate the effect of FFB galaxies in this context. In section II we summarize the modelling required: we introduce the observables (II.1), and how they depend on star formation (II.2) in the standard and FFB scenarios. Section III describes the HERA survey characteristics and the setup of our analysis. In section IV we investigate how FFBs affect the 21-cm observables, namely the global signal and power spectrum. We account for contributions from population III stars in section V. Finally, we discuss how this analysis translates to constraints on the detectability of the FFB scenario, which we forecast for HERA 21-cm power spectrum, in section VI. We draw conclusions in section VII.
II Model
To perform our analysis, we need first of all to introduce the 21-cm observables and to characterize how they depend on the underlying cosmological and astrophysical models. Crucial in this sense are the role of star formation and its efficiency; therefore, we summarize the main features of its model in the standard and FFB scenarios.
II.1 21-cm observables
The main observables used to analyze 21-cm surveys are the brightness temperature Barkana:2000fd
| (1) |
and its fluctuations . In the previous equation, is the CMB temperature and
| (2) |
is the 21-cm optical depth, which depends on the matter fluctuations , the fraction of neutral hydrogen and the comoving gradient of the baryon peculiar velocity along the line-of-sight . The dependence on the cosmological model is collected into the Hubble parameter and the normalization factor
| (3) |
Cosmological parameters are set at the Planck 2018 Planck:2018nkj fiducial values throughout this work.
The last ingredient in Eq. (1) is the spin temperature , that quantifies the ratio between the number density of hydrogen atoms in the triplet and singlet states. At thermal equilibrium, the spin temperature is set by
| (4) |
where is the gas kinetic temperature and Field:1959 is the color temperature of the Ly photons emitted by the surrounding stars. The coefficient couples the spin temperature to the CMB, while couple it to the gas temperature. Following Ref. Mesinger:2010ne , depends on particle collisions and it can be estimated as a function of the number densities of neutral hydrogen, free electrons and free protons; its effect is relevant in the IGM only at Loeb:2003ya . On the other hand, is set through the Wouthuysen-Field process Wouthuysen:1952 ; Field:1958 ; Hirata:2005mz to be proportional to , namely to the Ly background flux due to the integrated star formation rate. The value of depends on HI excitation due to X-rays Pritchard:2006sq and to resonant scatterings in the Ly series Barkana:2004vb . Near the sources, the HI optical depth and the contribution of high energy photons redshifted into the Ly band make this coupling highly efficient. On the other hand, X-rays heat the gas faster; their luminosity is parametrized through a power-law, with a low-energy cut-off below which photons are absorbed before reaching the IGM Fragos:2013bfa .
The Ly (UV) radiation produced by astrophysical processes also leads to HI ionization. Initially, the process is balanced by the recombination rate Sobacchi:2014rua ; Park:2018ljd , which stalls the growth of the ionized regions. Once the number of ionizing photons becomes high enough to saturate the Ly coupling and make the interstellar medium transparent to other ionizing photons, these escape into the IGM Verhamme_2015 and the fraction of neutral hydrogen in Eq. (1) decreases, leading to a decay in the 21-cm signal.
All these processes arise inhomogeneously in the IGM: the amplitude and size of local fluctuations determine the 21-cm power spectrum, which is defined as
| (5) |
During the epoch of star formation, Ly photons initially couple the spin temperature to the adiabatically-decreasing kinetic temperature. Only after this coupling saturates, Ly photons can heat the gas: this happens earlier in small DM halos, therefore small scales in the power spectrum have larger amplitude in this stage. Large-scale power rises later, but it quickly overcomes the small scales due to X-ray heating, whose efficiency is larger close to individual sources, which are apart one from another. Once X-ray radiation reaches the IGM, fluctuations in the power spectrum are determined by the DM density field and, as time passes, by the morphology of HI ionized regions. Since ionization initially occurs due to UV radiation inside small DM halos Wood:1999hx , small scale power decreases faster. Once that reionization is complete, the 21-cm signal finally disappears.
II.2 Star Formation
Star formation modelling is the key to understanding the 21-cm signal evolution at . Following Ref. Munoz:2021psm (MUN21), we consider a standard scenario in which reionization is driven by atomic cooling galaxies (ACGs) hosting population II (popII) stars, in agreement with faint galaxy observations and the UV luminosity function Park:2018ljd ; Behroozi:2014tna ; Yung:2021met ; Fialkov:2012su . We then summarize the feedback-free starburst scenario Dekel:2023ddd (DEK23) and describe how it alters the star formation rate (SFR) and efficiency (SFE).
In both scenarios, we adopt the formalism from Refs. Dekel:2013uaa ; Dekel:2023ddd , that characterizes the SFR per halo as
| (6) |
where is the mean baryonic accretion rate, is the star formation efficiency, and includes a turnover mass to suppress the SFR on the small mass end. We approximate using the analytical prescription in DEK23,
| (7) |
The SFR in Eq. (6) differs from the approximated SFR model used in MUN21 and relies on more informed galaxy formation studies (e.g., Refs. Dekel:2013uaa ; Dekel:2023ddd ; Mason:2015cna ; Tacchella:2018qny ; Mirocha:2020slz ); in Appendix A, we discuss in detail the difference between the two formalisms and their impact on 21-cm observables.
In the following analysis, we weight the SFR by the halo mass function111We adopt the -dependent halo mass function from Ref. Watson:2012mt . , and we marginalize over to get the star formation rate density
| (8) |
The SFRD is the main quantity that enters the computation of the the Ly background and X-ray heating in the 21-cm signal; the shape of the halo mass function implies that the contribution of the more massive halos is suppressed compared to the small mass ones.
Moreover, the SFRD enters the computation of the number of ionizing photons. As Ref. Park:2018ljd describes in detail, to compute it we need to introduce the parameter
| (9) |
that describes the fraction of Ly ionizing photons capable of leaving the galaxies and ionizing the intergalactic medium; we use , . The value of in the Epoch of Reionization is still uncertain; recent results from CEERS Mascia:2023 seem to point to a mismatch between data and theoretical prescriptions.
It is interesting at this point to note that, while the ionizing fraction depends on , the heating is unaffected by its value Park:2018ljd . This is due to the longer mean free path that both soft-UV and X-ray photons that heat the gas have with respect to UV photons that drive reionization Mesinger:2012ys ; McQuinn:2012bq . In fact, the cross section for the absorption of ionizing photons with energy eV is very high: whenever the HI column density is large, they get trapped inside galaxies and are not capable of reaching the IGM. The recombination of HI atoms inside the galaxies then produces a Ly cascade Santos:2003pc that adds to the bulk of soft-UV photons. Because of their lower energy, these can be absorbed only if the energy matches one of the lines in the Lyman series; the cross section of this process is smaller and results in a longer mean free path, that allows them to reach the IGM. Photons with energy eV are later on redshifted into the Ly line, and interact with HI and diffuse in the IGM as a result of scattering due to their absorption and re-emission Santos:2003pc .
The main consequence of the different mean free paths of ionizing- and heating- photons is their dependence on the distribution of HI column density regions Das:2017fys . While the former is described by Eq. (9), which leads to a suppression of the ionization in the more massive halos, the latter depends on the formation efficiency of the sources that mainly produce the radiation field. In our analysis, we consider three main drivers: popII stars, formed in atomic cooling galaxies; FFBs; popIII stars formed in molecular cooling galaxies. We characterize popII and FFB efficiency in the next subsections, while popIII stars are investigated in Sec. V.
II.2.1 Atomic Cooling Galaxies
In the ACG scenario where popII stars are formed, we use the prescription in MUN21 to characterize the SFE in the standard case , in which
| (10) |
where sets the SFE in halos with pivot mass .222We label as the factor that MUN21 calls , leaving the dependence on the mass scale implicit. The power law index is modelled as in Ref. Wyithe:2012bq to account for star-formation quenching in small DM halos.
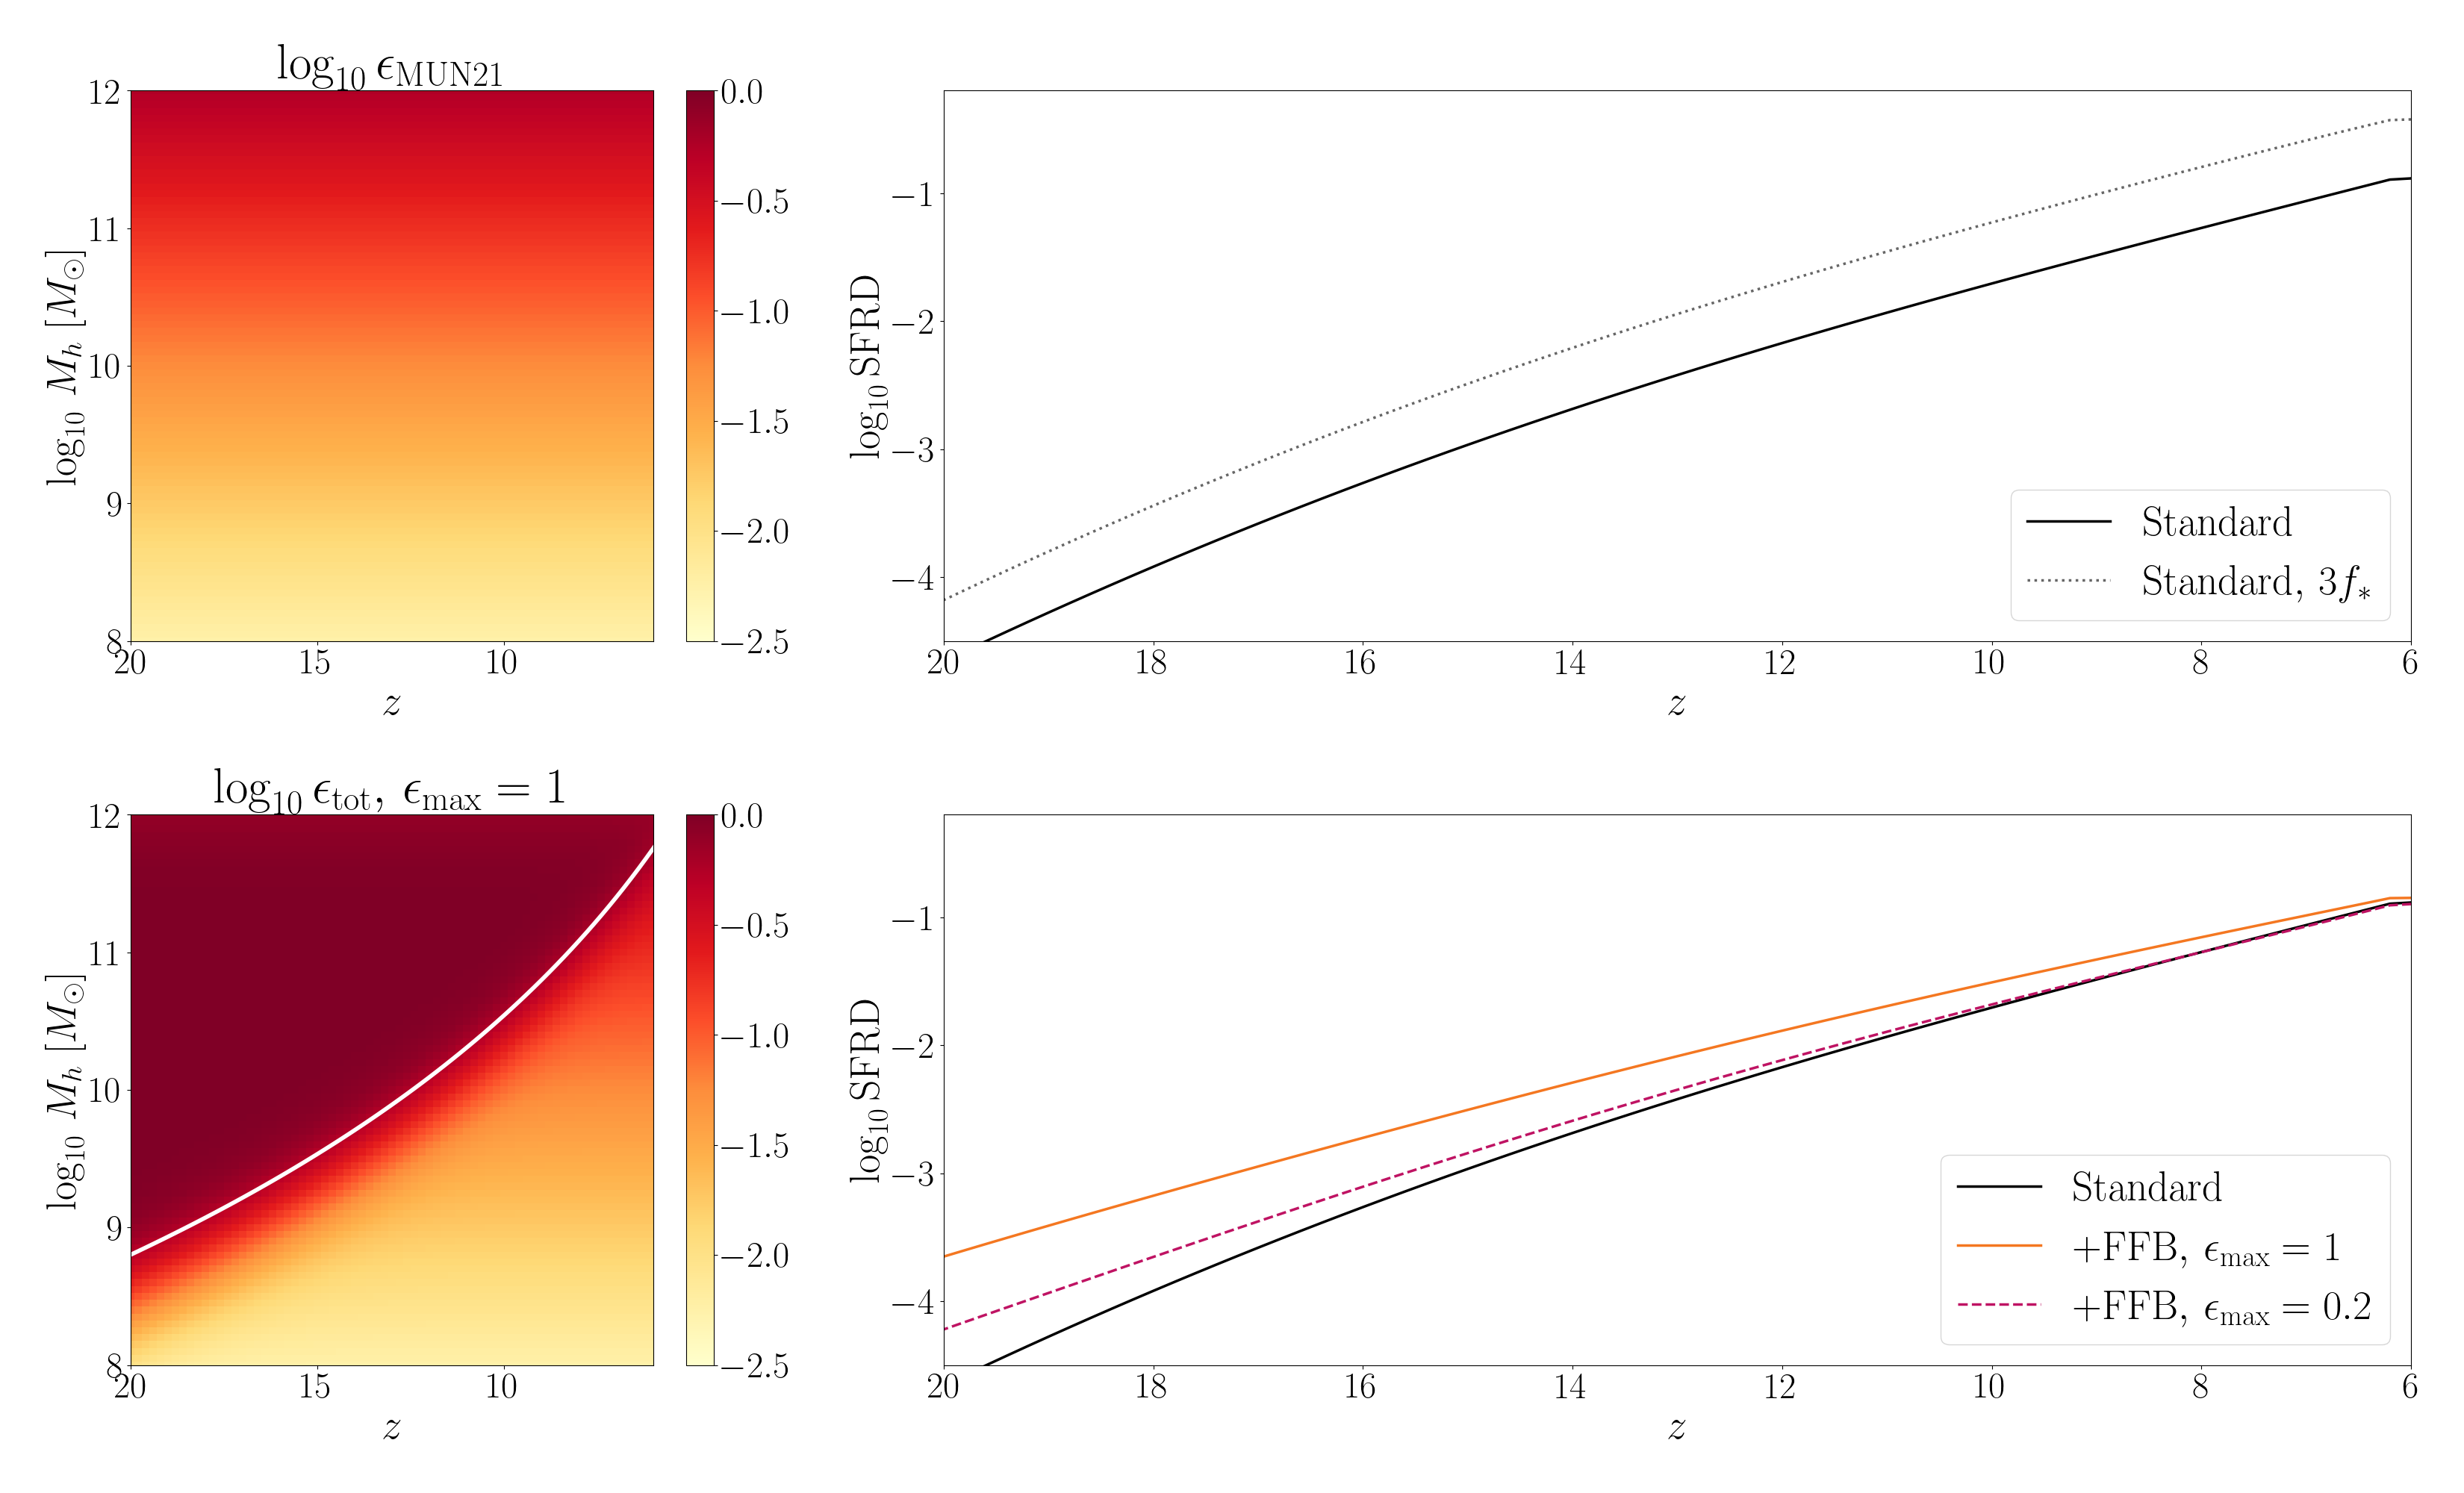
With respect to the SFRD in Eq. (8), we define , where is the minimum mass required to form stars via atomic cooling Oh:2001ex , while characterizes the critical halo mass below which star formation is inefficient because of photo-heating Thoul:1996by ; Noh:2014gra ; Sobacchi:2014rua . Fig. 1 shows the ACG SFE and SFRD we adopt in our analysis.
II.2.2 Feedback-Free Starburst Galaxies
When modelling star formation, the role played by stellar feedbacks, such as winds or supernova explosions, is crucial. The star formation efficiency at low is believed to be small due to feedback Rodriguez_2017 ; Moster_2018 ; Behroozi:2012iw ; Behroozi:2019kql , while the FFB scenario introduced by DEK23 shows that the SFE is higher in massive galaxies at , in agreement with the excess of bright galaxies in JWST observations.
For FFB to happen, the free-fall collapse time of the star-forming cloud (SFC) have to be shorter than the time required by the stellar feedbacks to become effective. The former is estimated as , where is the gas number density, while the latter is . Moreover, the timescale has to be larger than the time the gas requires to cool and form stars, Krumholz:2012wi . Finally, a large enough surface density is required to prevent unbounding of the SFC gas through stellar radiative pressure and photo-ionization, being its mass and radius Fall:2009nf ; Grudic_2018 ; Grudic_2020 . In order for these processes to realize efficiently, not only do SFCs have to be free of their own feedbacks, but they also need to be shielded against UV radiation and winds from older-generation stars.
The former is guaranteed, since is larger than the ionizing length inside which the UV photon flux overcomes the recombination rate. As for shielding against stellar winds (see e.g., Ref. Menon_2023 ), the time a shock wave takes to cross the SFCs, namely the cloud crushing time Klein:1994pd , has to be longer than the timescales , previously introduced. Gas inside SFCs where FFB take place is almost completely consumed, so they reach near-zero column density Menon_2023 .
All these conditions are satisfied only by short starbursts in DM halos continuously supplied by gas, all of which fragment into SFCs. As DEK23 shows, the criteria for the onset of FFB can be translated in terms of the properties of the host DM halo mass at given . Star formation in the halo is driven by FFB, thus its efficiency is enhanced with respect to the standard scenario when
| (11) |
This threshold has been computed in DEK23 and it is shown in Fig. 1
Eq. (11) highlights the fact that halos of mass at can host FFBs; the threshold decreases at higher redshift, where their presence significantly affects star formation. At low , instead, the threshold mass gets larger, but at the same time the onset of AGN feedback and the presence of hot circumgalactic medium quench star formation in halos . Thus, in the local Universe, FFBs are unlikely.
The way FFBs contribute to the total star formation rate per halo , can be modelled as
| (12) |
where , and the parameter describes the maximum SFE that FFB galaxies can reach. The dependence, which we left implicit for brevity, is encoded in
| (13) | ||||
where is the fraction of galaxies that form in halos with and host FFBs, while is a sigmoid function varying smoothly from 0 to 1. The first sigmoid characterizes the quenching for , while the second sets the star formation rate to its value in the standard model for halos below the threshold , while it gains a contribution in halos that host FFBs.
The relation in Eq. (12) can be translated to a relation between the SFE in the standard case (, from Eq. (10)) and the SFE in galaxies where star formation is driven by FFBs. We consider333Eq. (6) is converted into Eq. (12) by using Eq. (6) and assuming that .
| (14) |
where we kept the normalization for consistency. We set as fiducial values, meaning that all the galaxies formed in halos with have SFE up to . In the analysis, we keep fixed, but we test the more conservative case , where FFB galaxies reach smaller efficiency.
III Analysis Setup
The enhanced star formation efficiency from Eq. (14) naturally has a non-negligible impact on the 21-cm signal.
To estimate the effect of FFBs on 21-cm obervables, we customized the public code 21cmFAST 444https://github.com/21cmfast, version 3.3.1, June 2023. Mesinger:2010ne ; Munoz:2021psm ; Murray:2020trn . The code simulates the reionization history by modelling the radiation fields we described in Sec. II.1 and their effects on the thermal evolution and neutral hydrogen fraction inside cells of the simulation box. The evolution of cosmological fluctuations can be consistently accounted for via the initial conditions in 21cmFirstCLASS flitterI ; flitterII . We modified the ACG SFE by introducing the redshift-dependent from Eq. (14). Since the duration of the FFB phase in each galaxy is shorter than the redshift integration step in the code, we changed at each only for halos close to and above the mass threshold in Eq. (11), according to Eq. (13). Halos that exit the FFB condition behave as in the standard scenario, with no consequences due to their previous state. Throughout the analysis, we used a (256 Mpc)3 simulation box, inside which 384 cells are defined on each axis for the high resolution computation, related with initial condition and displacement field, and 128 for the low resolution one, for temperature and ionization fluctuations Mesinger:2007pd . We used initial adiabatic fluctuations described by the approximation in Ref. Munoz:2023kkg , the CLASS configuration for the matter power spectrum, the -dependent mass function from Ref. Watson:2012mt , and we included the effects of redshift space distortions and relative velocities between dark matter and baryons. The code smooths the density perturbations over neighbouring cells; finally, Ly heating is also included Sarkar:2022dvl (CMB heating is not).
We estimate the global signal and neutral hydrogen fraction based on lightcones produced by 21cmFAST , and compute the 21-cm power spectrum with powerbox555https://github.com/steven-murray/powerbox Murray_2018 .
III.1 Noise model
We compute the 21-cm power spectrum noise when observed with HERA, the Hydrogen Epoch of Reionization Array.666http://reionization.org/ HERA is a next-generation radio interferometer, a low-frequency precursor of SKA in South Africa. Its final configuration will comprise of 350 parabolic dishes, 14m diameter size each, arranged in a hexagonal configuration. It will observe frequencies between 50 to 250 MHz to probe the redshifted 21-cm emission from DeBoer:2016tnn . Currently, Phase I HERA data have been released using antennas and 18 hours of observations to probe the power spectrum at redshifts and and scales and HERA:2021bsv ; HERA:2022wmy ; Lazare:2023jkg .
Forecasted HERA sensitivity depends on the detector configuration and on the goodness of foreground removal. Following Refs. Parsons:2011ew ; Pober:2012zz ; Pober:2013jna , the baseline length between each pair of detectors sets the transverse modes that can be observed, while the bandwidth sets along the line-of-sight. These are contaminated by spectral-smooth foregrounds, which determine a wedge shape in the plane. The values of associated with small are mostly foreground-free. Ref. Pober:2013jna defines different foreground removal models depending on the shape of the wedge edge: in this work, we will adopt the “moderate” and “optimistic” foreground removal scenarios. The former extends the edge to beyond the horizon
| (15) |
where is the baseline length, the speed of light and is the conversion factor between bandwidth and line-of-sight distance, while is the rest frame frequency associated with the 21-cm line. The optimistic model, instead, improves the constraining power on both the small and large scales by extending to the FWHM of the primary beam, computed as . Both models assume to add coherently different baselines, namely the integration times are summed when the same pixel is sampled more than once by redundant baselines. More detail on the noise computation is given in Refs. Pober:2012zz ; Pober:2013jna .
To estimate the HERA sensitivity, we rely on the public code 21cmSense 777https://github.com/steven-murray/21cmSense.app Pober:2012zz ; Pober:2013jna , which combines the contribution from the thermal noise power spectrum
| (16) |
and the sample variance. Here, converts the observed angles into transverse measurements, is the system temperature, the duration of the observational run and the solid angle associated with the primary beam. The sample variance instead is estimated as the 21-cm power spectrum in Eq. (5) and summed with the thermal noise to get the noise variance .
In our analysis, we consider a hexagonal configuration with 11 dishes per side (i.e., 331 antennas in total), each having 14m diameter. In Eq. (16), the observational time is set to 6 hours per day over 540 days, while , where the sky temperature is and the receiver temperature is . We consider a minimum observed frequency of 50 MHz, a maximum frequency of 225 MHz and 8 MHz bandwidths probed by 82 channels each. This sets the observed redshift bins to
| (17) |
The 19 bins obtained are equally spaced in frequency but not in redshift, providing a finer sampling at low .
IV FFB signatures on 21-cm observables
The analysis presented in this work has been realized using the public codes: 21cmFAST , version 3.3.1 updated in June 2023; powerbox; 21cmSense . We modified 21cmFAST to include FFB galaxies and to account for the SFR formalism defined in Eq. (6). As we discuss in detail in Appendix A, this SFR model differs from the approximation used in 21cmFAST public release: in the standard scenario, it provides a slightly larger SFR, thus anticipating reionization with respect to, e.g., results in MUN21.
We checked that, in the range of scales probed by HERA, using a single realization of the power spectrum or averaging over 5, 10 or 15 21cmFAST simulations provides variations smaller than the error bars. Therefore, to reduce the computational cost, plots and forecasts are realized using the same random seed.
IV.1 Global signal
First of all, we investigate how FFBs affect the 21-cm global signal. This observable, in fact, can help us understanding in a more straightforward way the peculiarities the FFB scenario has compared with other cases.
Fig. 2 shows how the presence of FFBs impacts the brightness temperature and reionization once different values of are considered. The value of in Eq. (1) is estimated for our FFB prescription in Eq. (14) and compared with the standard 21cmFAST configuration from Eq. (10). For comparison, we also consider an artificial toy model in which is increased over all the halo masses and the entire redshift range, by simply rescaling the value of by ; the SFRD for the same model is also shown in Fig. 1. This value was chosen to match the star formation efficiency required by JWST observations at without FFBs (see e.g., Refs. Labbe_2023 ; Boylan-Kolchin:2022kae ), but has no particular physical meaning.
When star formation efficiency is increased at high redshift, a larger amount of Ly and X-ray radiation is produced, speeding up the coupling of the spin temperature to the gas temperature and anticipating the moment in which this heats up. Therefore, in the top panel of Fig. 2, both the 3 and FFB cases induce a larger global signal and move its peak towards large , when the gas is colder (i.e., the global signal peak reaches lower values). However, as more time passes, only the more massive halos keep satisfying the conditions that allow the presence of FFB, while SFR in halos with masses between and becomes less and less efficient.
While one might expect the high efficiency of the FFBs to result in a more efficient reionization, we find that it is not necessarily the case. As described in Sec. II.1, the reionization rate is determined by the escape fraction of the ionizing photons. In the model underlying our assumption, the negative value of , motivated by Lyman- forest and CMB data Qin:2021gkn , penalizes the contribution of large halos. Since these are indeed the one that host FFBs, the effect of FFBs on is limited. In contrast, if we were using positive values of we would increase the ionizing power of massive halos and thereby improve the relevance of FFBs on reionization.
As a side comment, note that we adopted the same expression for the escape fraction in Eq. (9) for both non-FFB and FFB galaxies. This quantity is determined by the neutral hydrogen column density inside a galaxy, which describes the abundance of atoms capable of absorbing the ionizing radiation, preventing it to reach the IGM. In principle, the presence of FFBs may increase , since they consume all the gas in the star-forming clouds, and they remove dust via steady wind Li:2023 . As the escape fraction in the Epoch of Reionization is anyway very uncertain, we leave further investigation on how it gets affected by FFBs to future work.
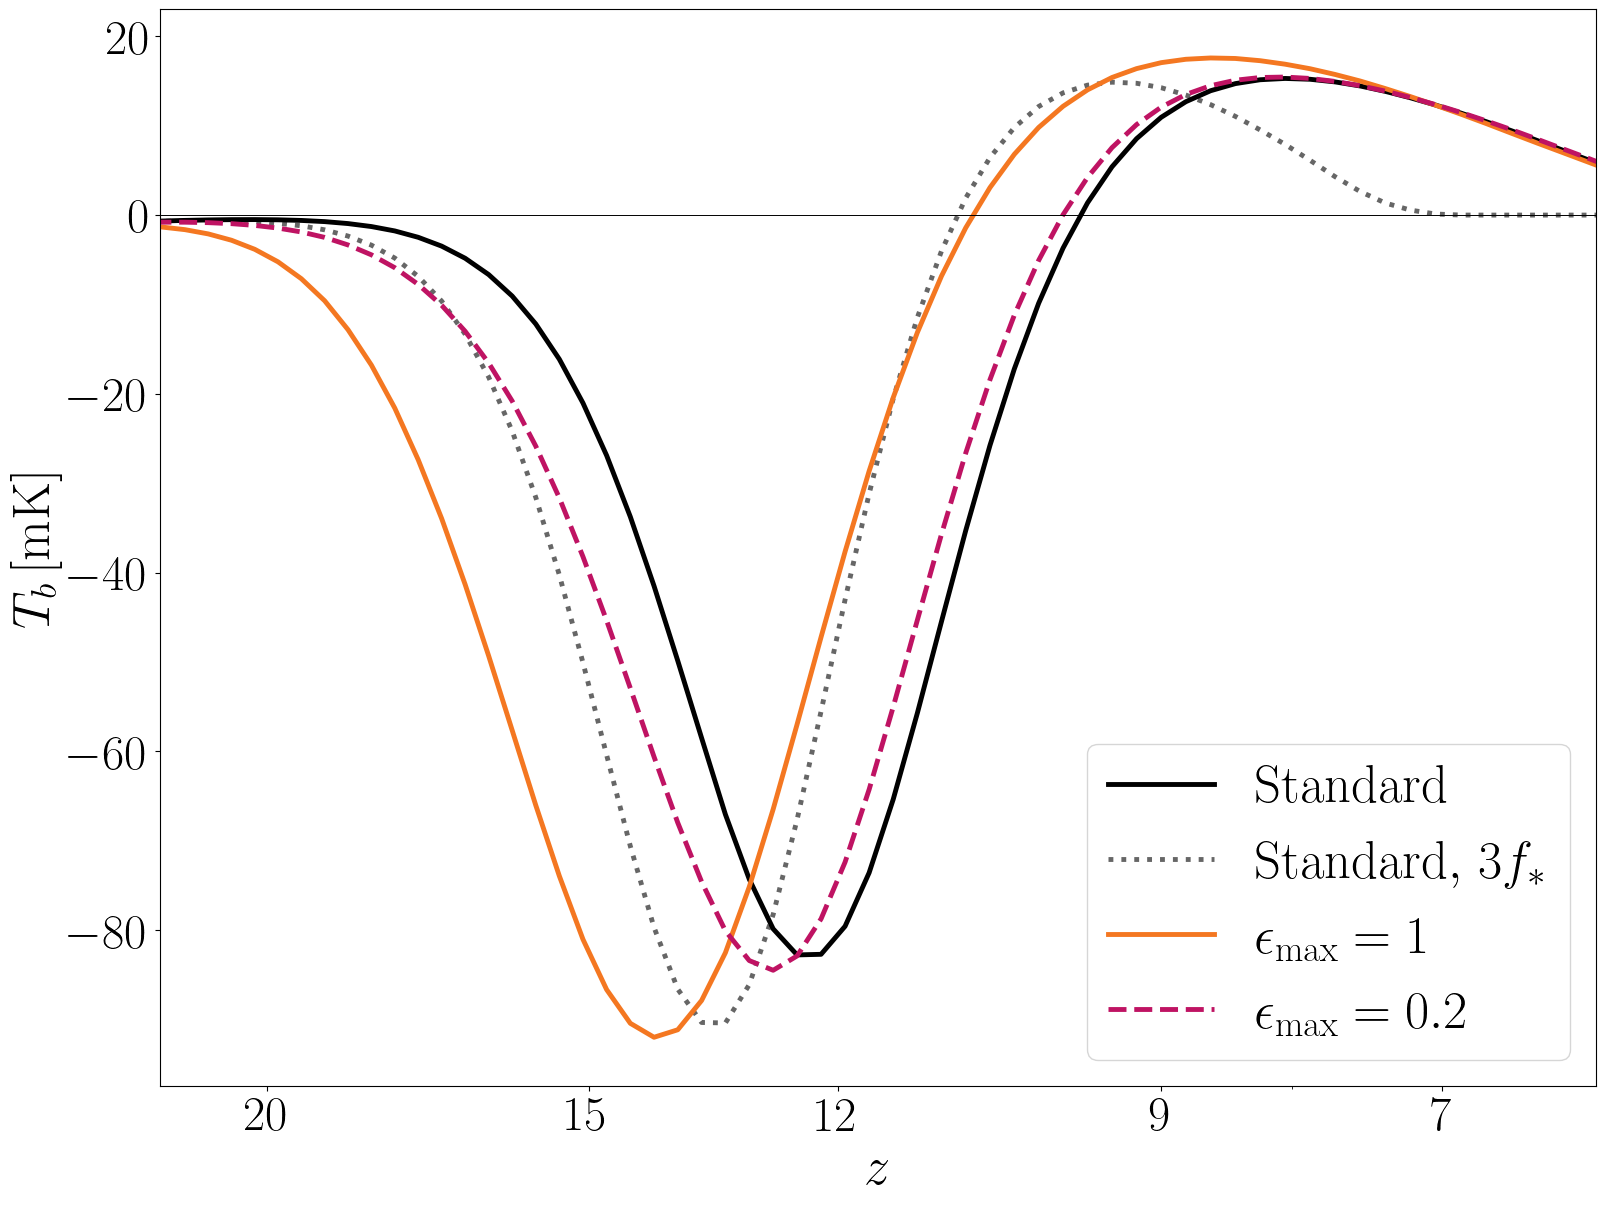
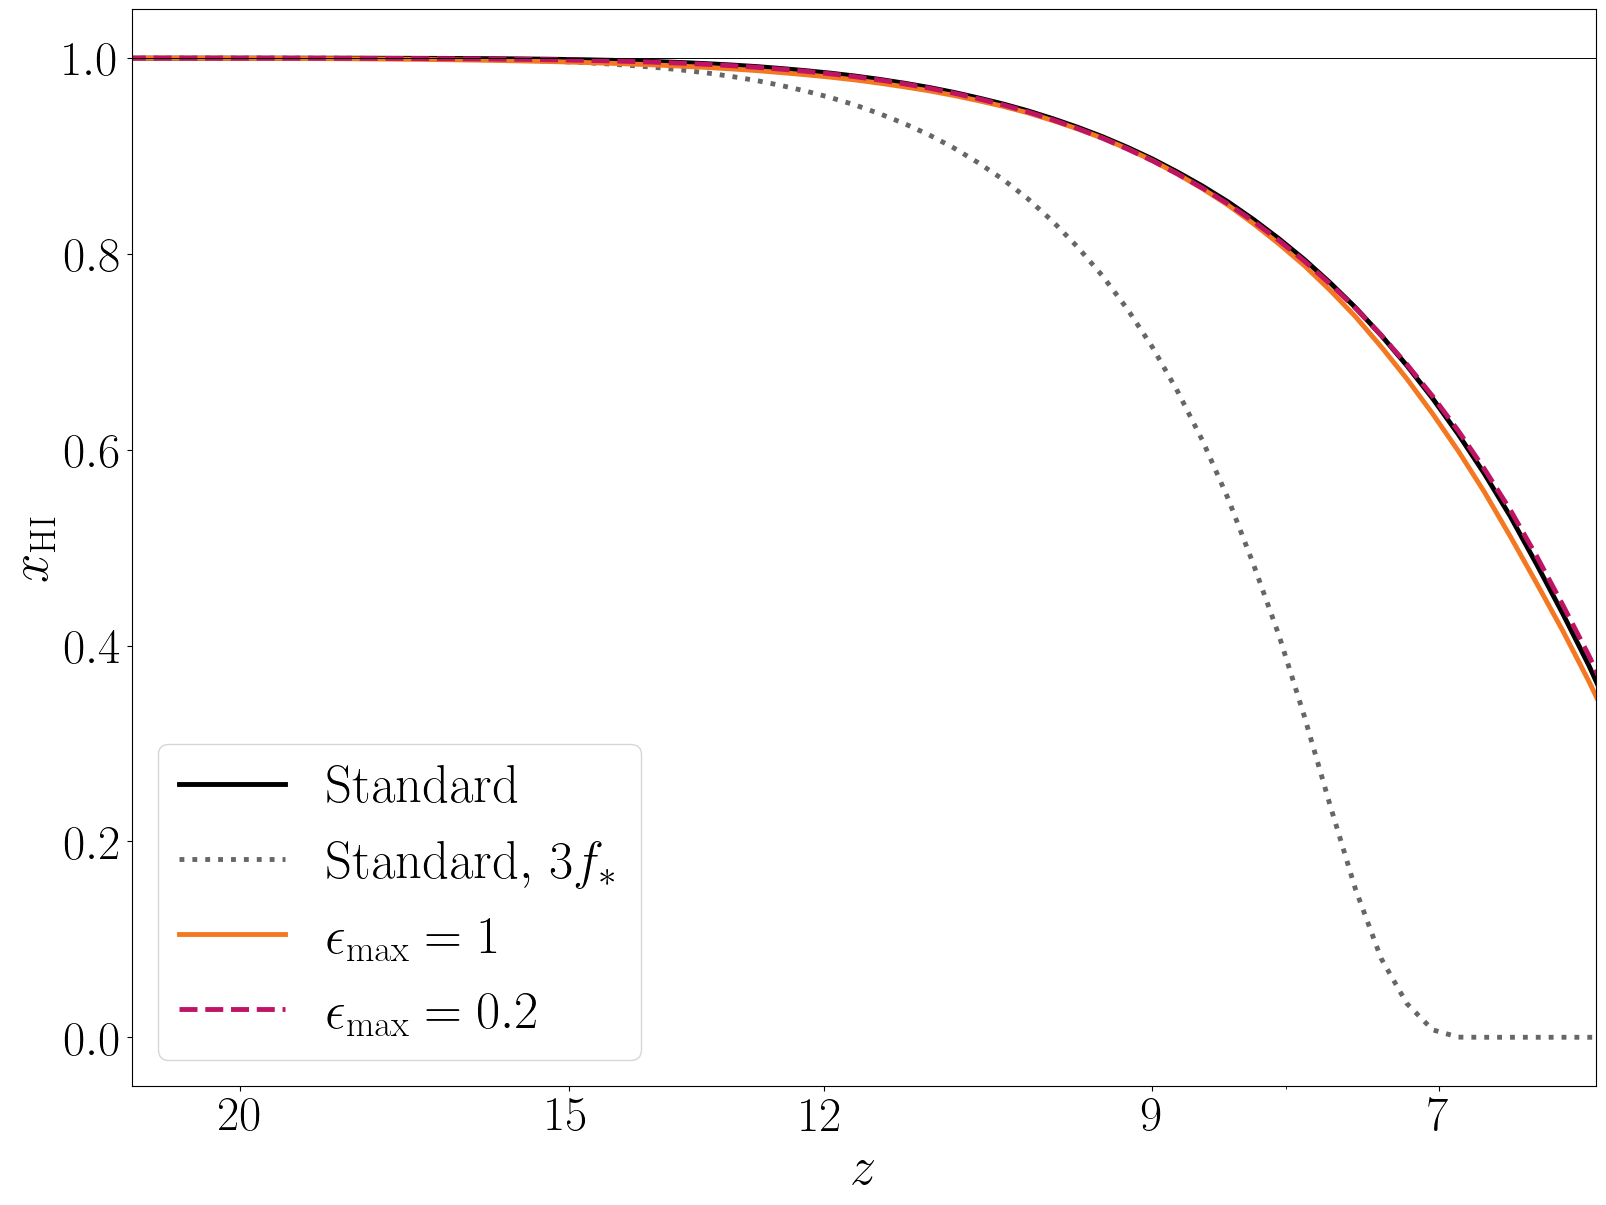
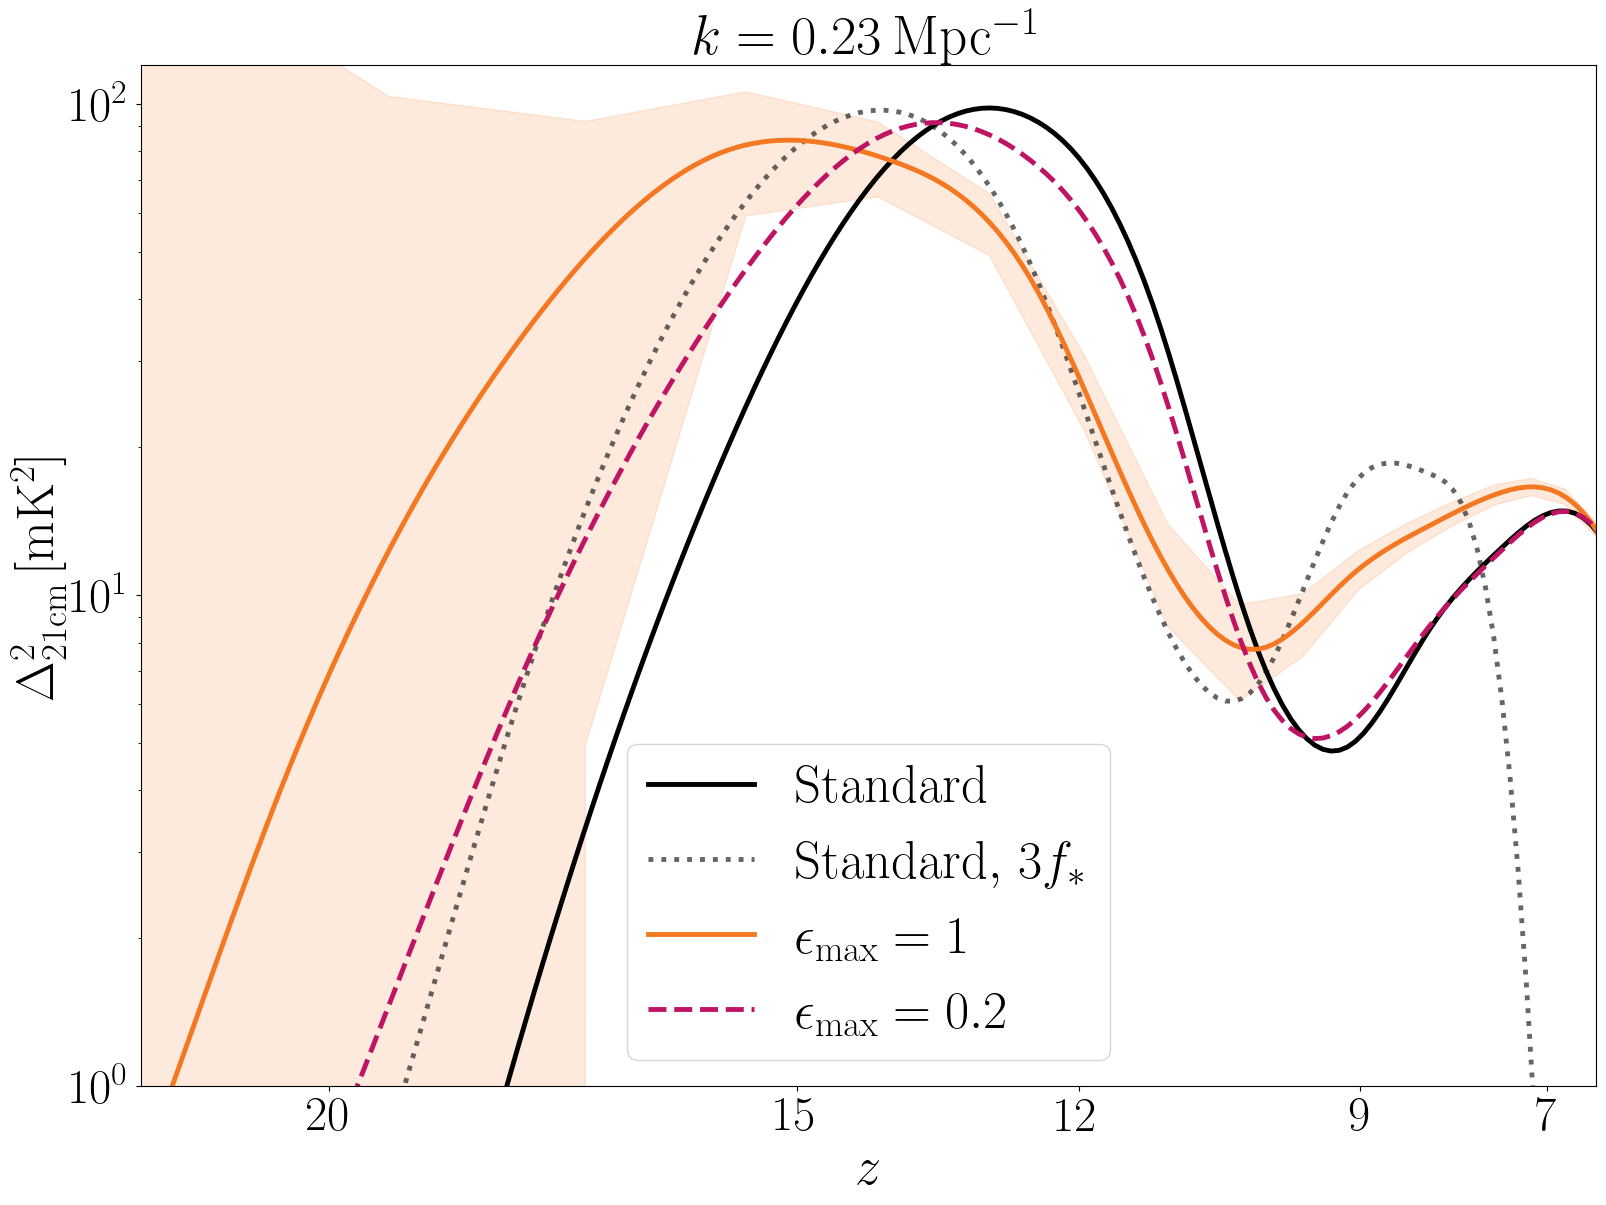
To sum up, when FFBs are taken into account, the peak in the 21-cm global signal starts at higher , reaches a lower value and then ends slightly before the standard scenario; smaller values of or make the effect less significant in an almost-degenerate way. This is different from what we would expect for an overall increased SFR, as we model with 3. Here, the peak shifts at higher but, thanks to the large efficiency in small mass halos, reionization is faster and the signal reaches earlier.
IV.2 Power spectrum
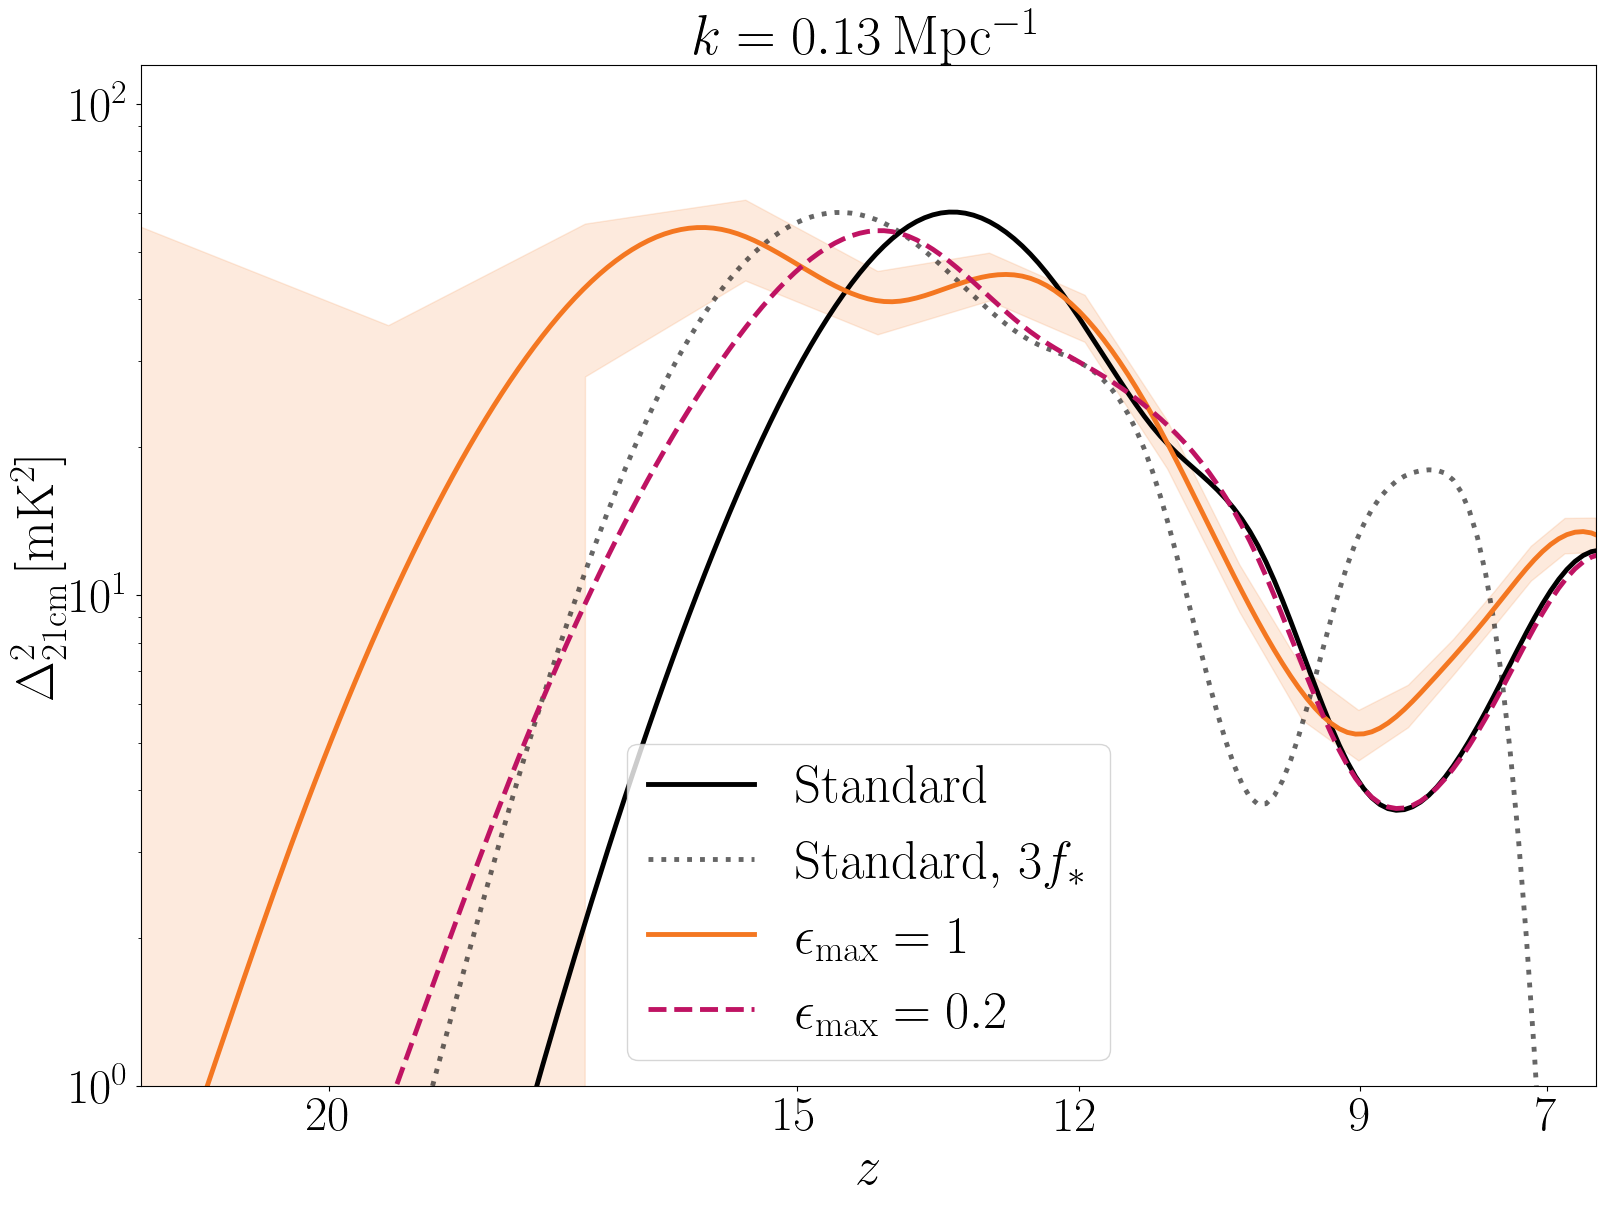
FFBs also affect the 21-cm power spectrum. Fig. 3 shows its redshift evolution: consistently with the global signal, the ionization bump rises earlier, at , for the 3 model, while for FFBs it matches the standard scenario at . The presence of massive FFB-hosting halos increases at high ; their lack of ionization power would keep the signal amplitude large even at low , but the contribution of small halos brings back to the standard case. The errorbas in the figure are estimated for HERA with moderate foreground, assuming the FFB scenario as fiducial, as in Sec. III.1; qualitatively, FFB signatures on the 21-cm power spectrum seems to be distinguishable in certain ranges.
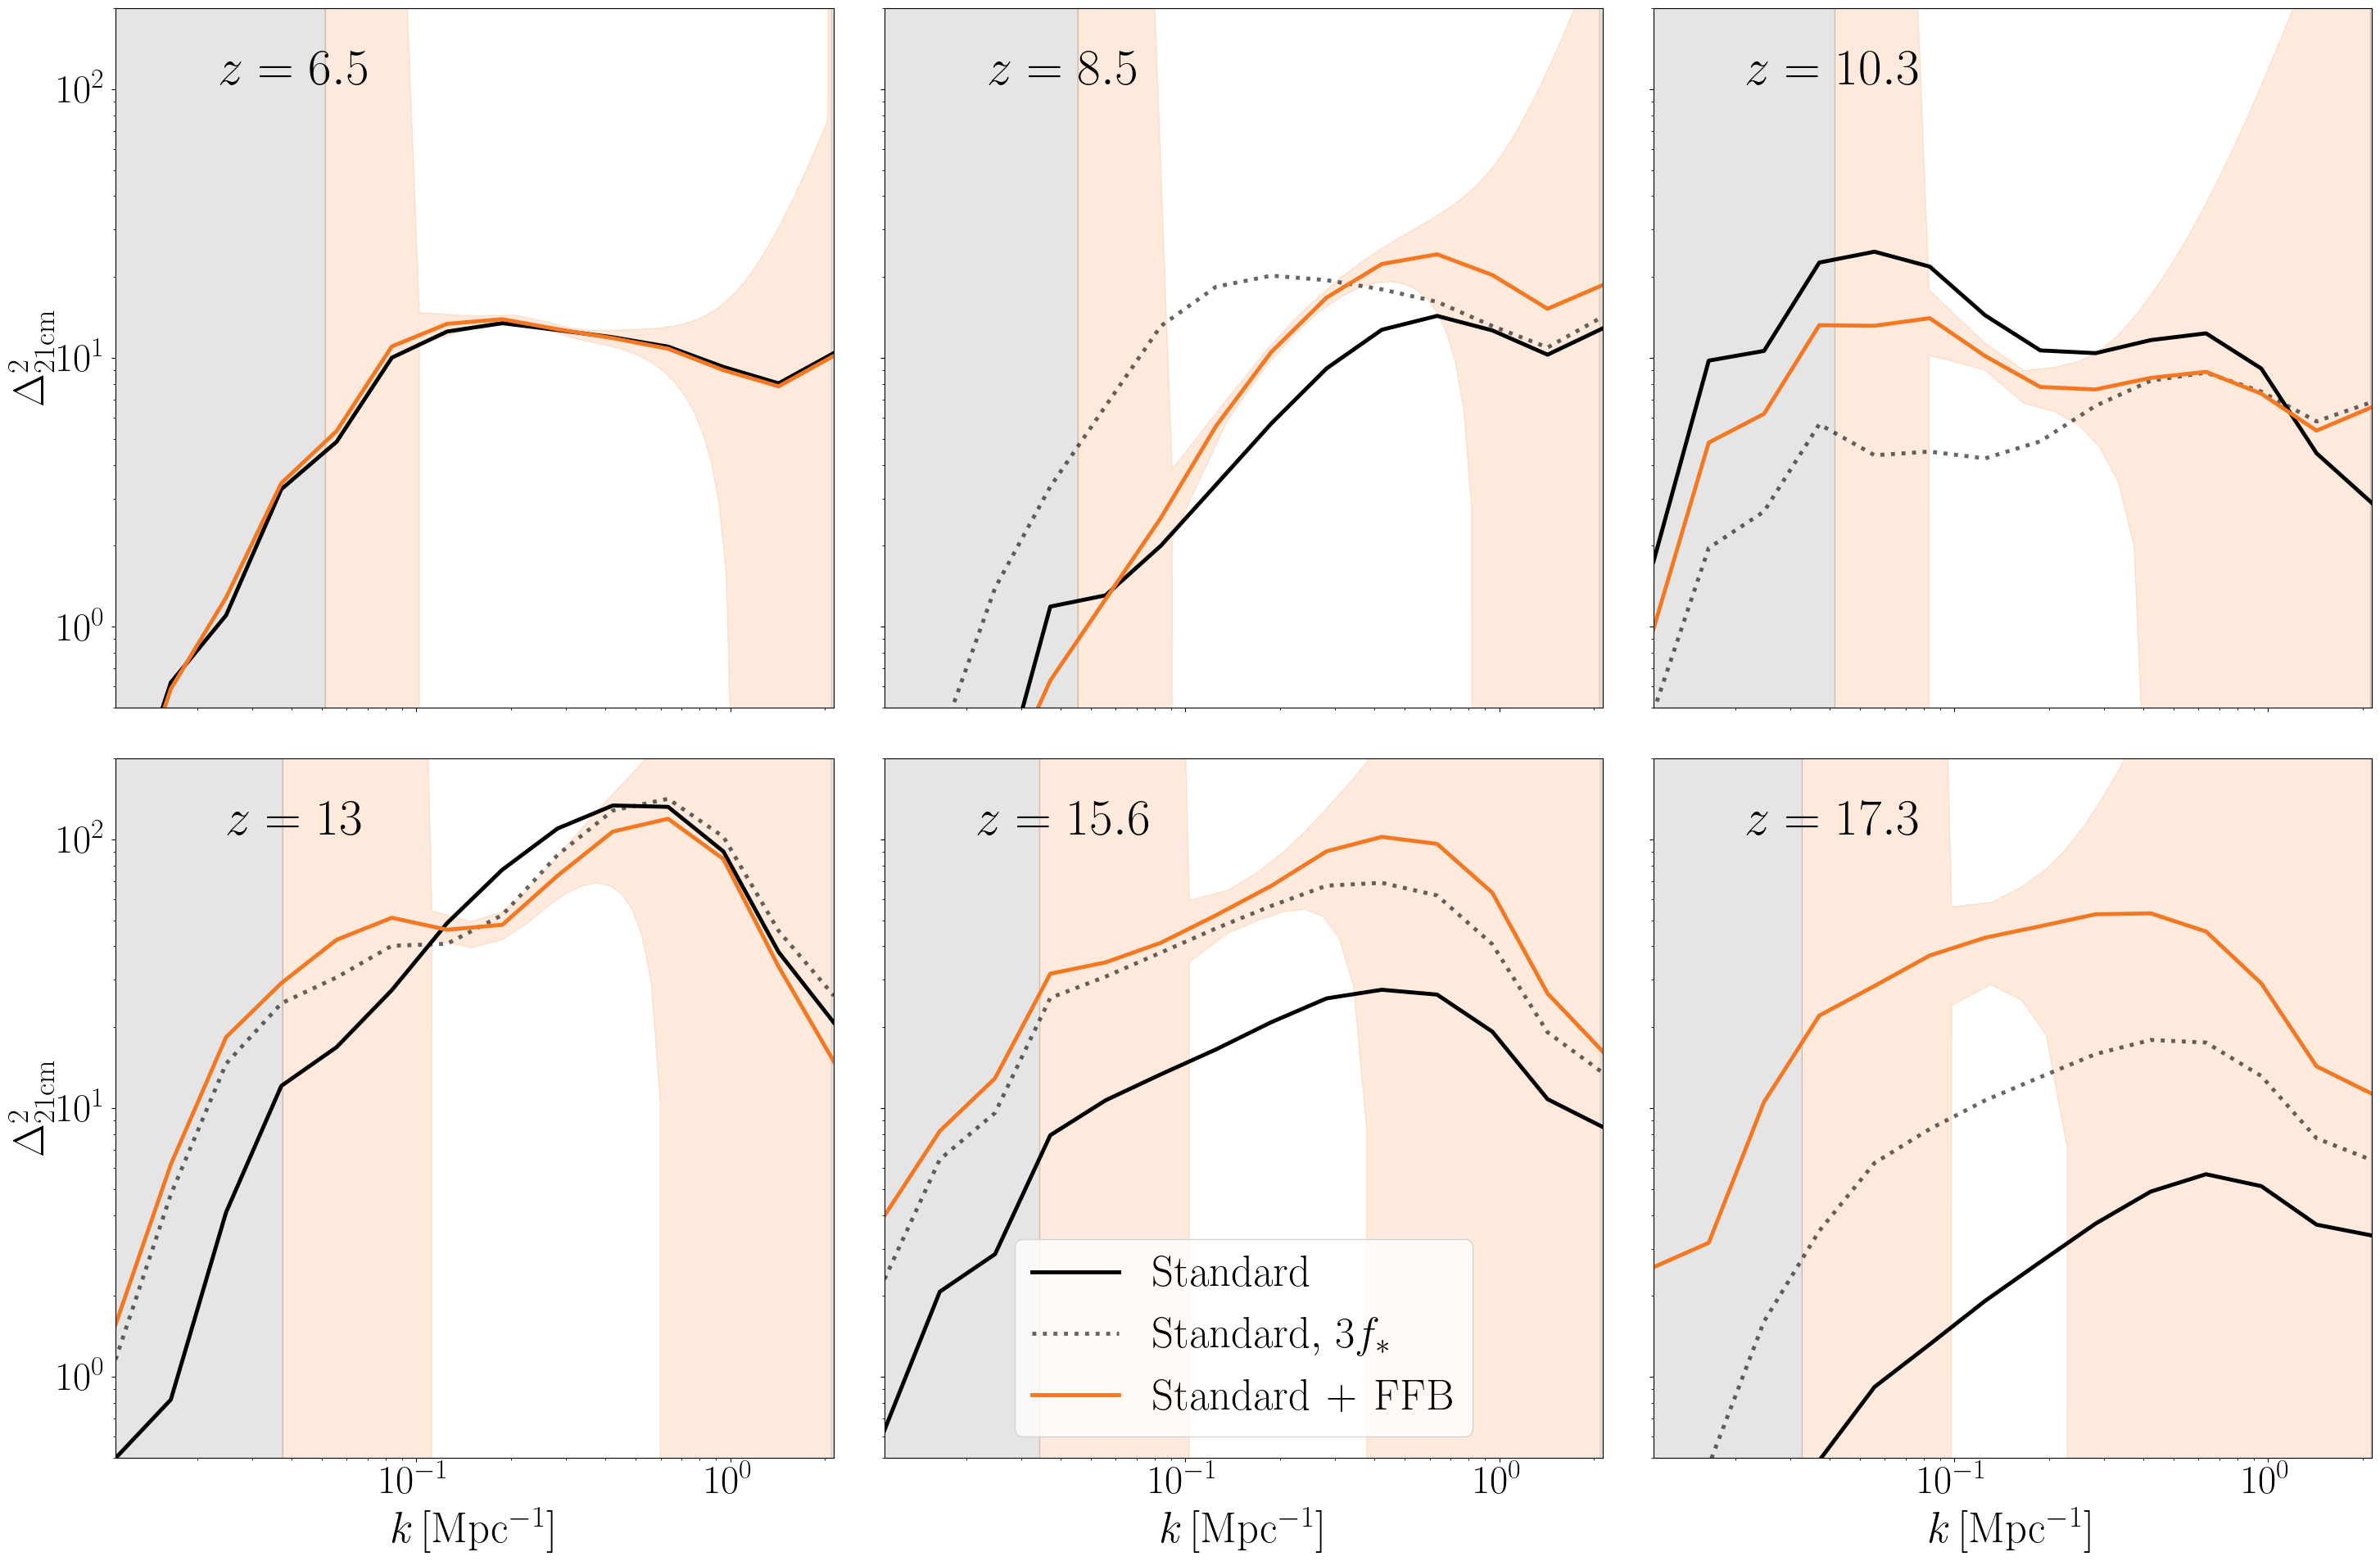
Finally, in Fig. 4 we compare the redshift evolution of the scale-dependent power spectrum with and without FFBs. These plots were obtained using a 700 Mpc simulation box to access larger scales. At very high redshift, the power spectrum in the FFB scenario has larger power; this can be understood comparing the amplitude of the global signal at the same epoch. At , FFBs experience a boost initially on the large, then on the small scales: only the rare, most massive halos can still host FFBs at this redshift, thus increasing correlation on large scales; since these halos are the most densely clustered, they lead to an increase in the small scale power as well. Lower redshifts, instead, are dominated by the contribution of small halos; as already discussed, this brings the shape of the power spectrum back to the standard case.
V Including Molecular Cooling Galaxies
A further contribution to the SFR and 21-cm signal could come from population III (popIII) stars Bromm:2003vv ; Bromm:2005gs . Usually, popIII stars are associated with a pristine, metal-poor environment, and their formation is driven by H2 molecular cooling (see e.g., Haiman:1995jy ; Haiman:1996rc ; Abel:2001pr ). As in MUN21, we consider their formation as associated with molecular cooling galaxies (MCG) inside mini-halos, whose typical mass is . Their contribution to the reionization process is still uncertain, see e.g. Refs. Qin:2020xyh ; Wise:2010zi ; Xu:2016 , and not yet completely accepted. For example, recent results from HERA Phase I do not account for MCGs in their modelling; including them, depending on their efficiency, can lead to variations in the parameter constraints Lazare:2023jkg .
In this section, we model popIII contribution to SFE and we study how this affects the 21-cm observables, accounting for uncertainties. We assume MCGs cannot host FFBs, since the modelling in DEK23 refers to atomic cooling SFCs and the threshold mass in Eq. (11) largely penalizes mini-halos, its value being up to . Thus, in our formalism, FFBs only enhance SFR for popII stars. Further analysis on the presence of popIII stars in massive halos and how they could be affected by FFBs are beyond the scope of this work.
V.1 Model
Following MUN21, we approximate SFR in MCGs as888See further discussion on this SFR approximation in Appendix A.
| (18) |
where is a fudge parameter and is the Hubble time. The SFE is estimated as
| (19) |
where we set and we normalize with respect to the SFE in halos with , namely .999The parameter we indicate as is called in MUN21.
We choose as nominal value ; to account for uncertainties in the MCG efficiency, in our analysis we also test . We use
| (20) | ||||
to suppress star formation on the large halo mass end, where MCG star formation transits into the ACG scenario. The value of accounts for quenching of star formation on the small mass end. In mini-halos, this is caused by the relative velocity between DM and baryons Tseliakhovich:2010bj ; Naoz:2011if ; Dalal:2010yt ; Tseliakhovich:2010yw and by Lyman-Werner feedbacks Machacek:2000us ; Kulkarni:2020ovu ; Schauer:2020gvx due to photons with energy between 11.2 and 13.6 eV, that photo-dissociate molecular hydrogen and prevent the cooling of the gas clouds. We fix the relative velocity contribution to
| (21) |
where , , the rms velocity is and we set the average velocity to . As for LW feedbacks, we use Visbal:2014fta
| (22) |
where , and is the LW intensity in units of .
The escape fraction from mini-halos is modelled analogously to Eq. (9), with and using as the normalizing mass scale instead of .
V.2 Effect on the 21-cm observables
The presence of MCGs inside mini-halos changes the 21-cm observables, mainly because of the larger radiation produced at high redshift. As Fig. 5 shows in the left panel, in the standard 21cmFAST case with MCGs, the global signal peak broadens and is preponed, leading also to an earlier reionization (although ACGs remain the main driver). Since popIII stars contribute also to the X-ray emission, their presence heats the gas faster, thus the peak becomes not as deep as in the only-ACG case. Analogously, the power spectrum shown in the right panel of Fig. 5 has larger power at high , while it dies faster because of the earlier reionization.
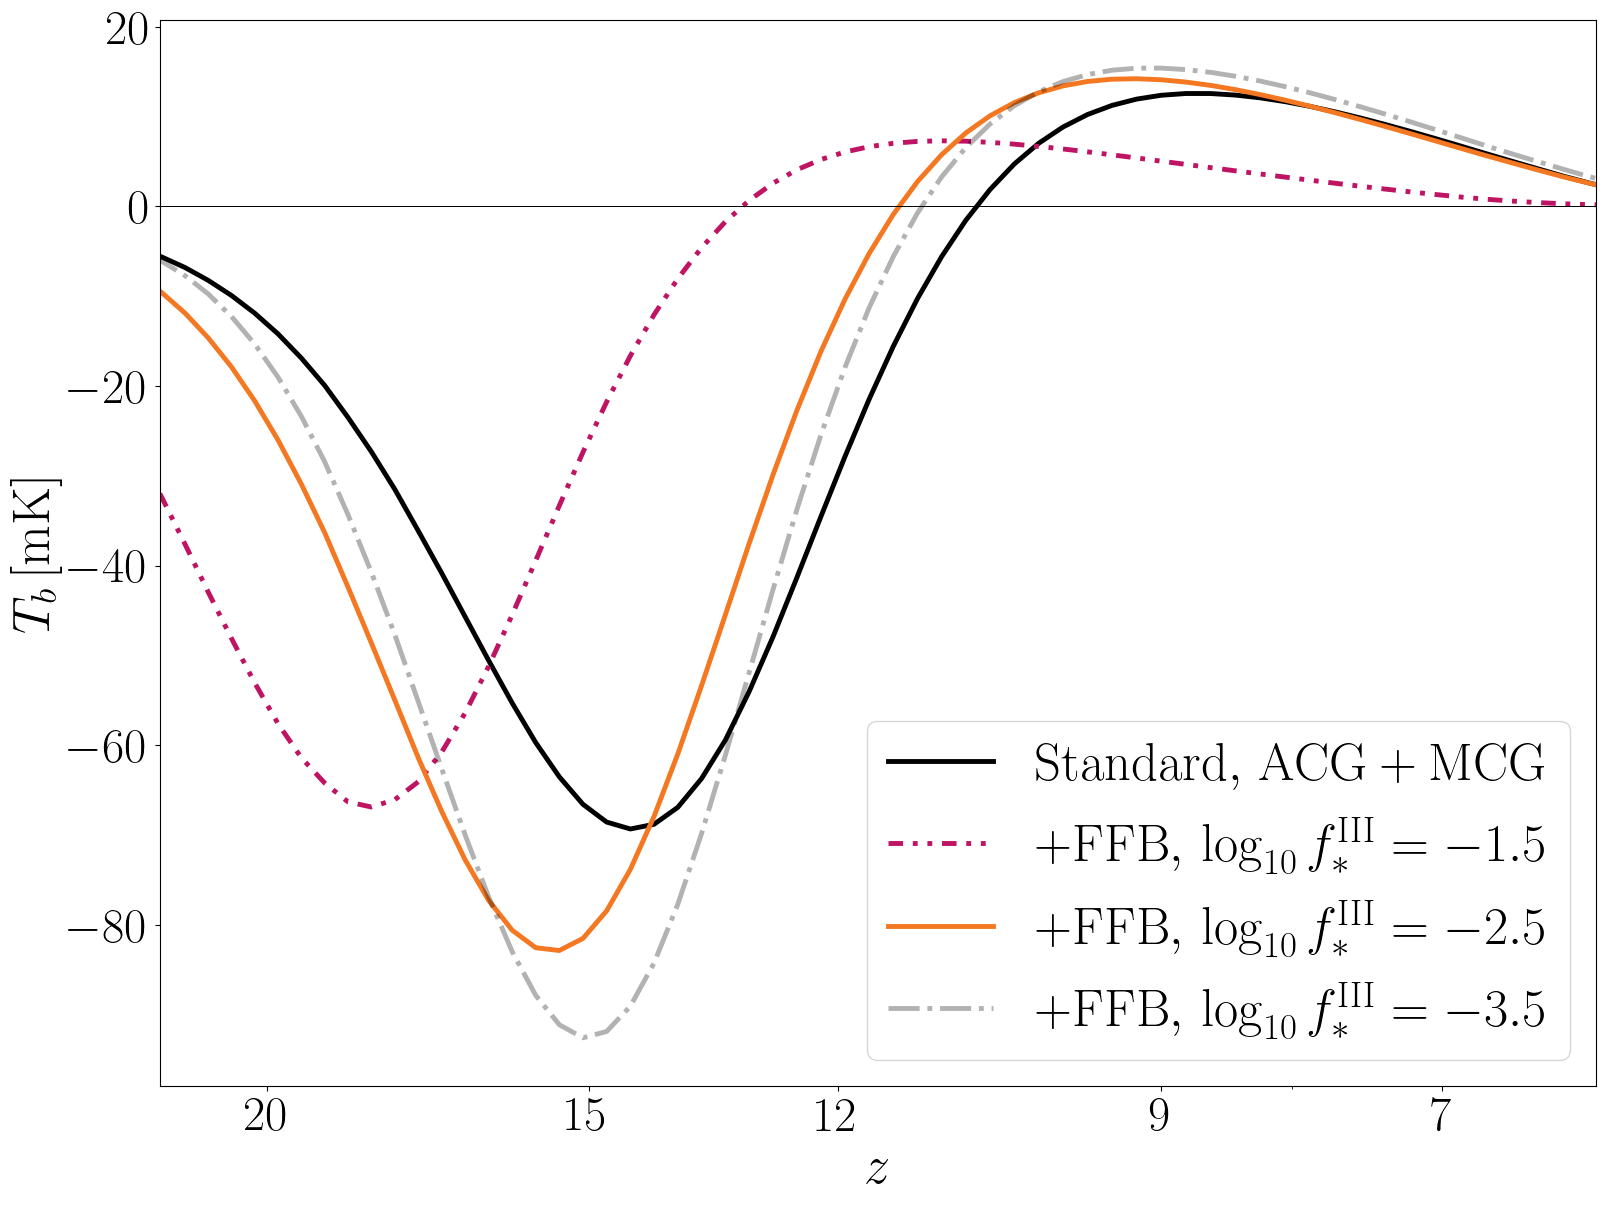
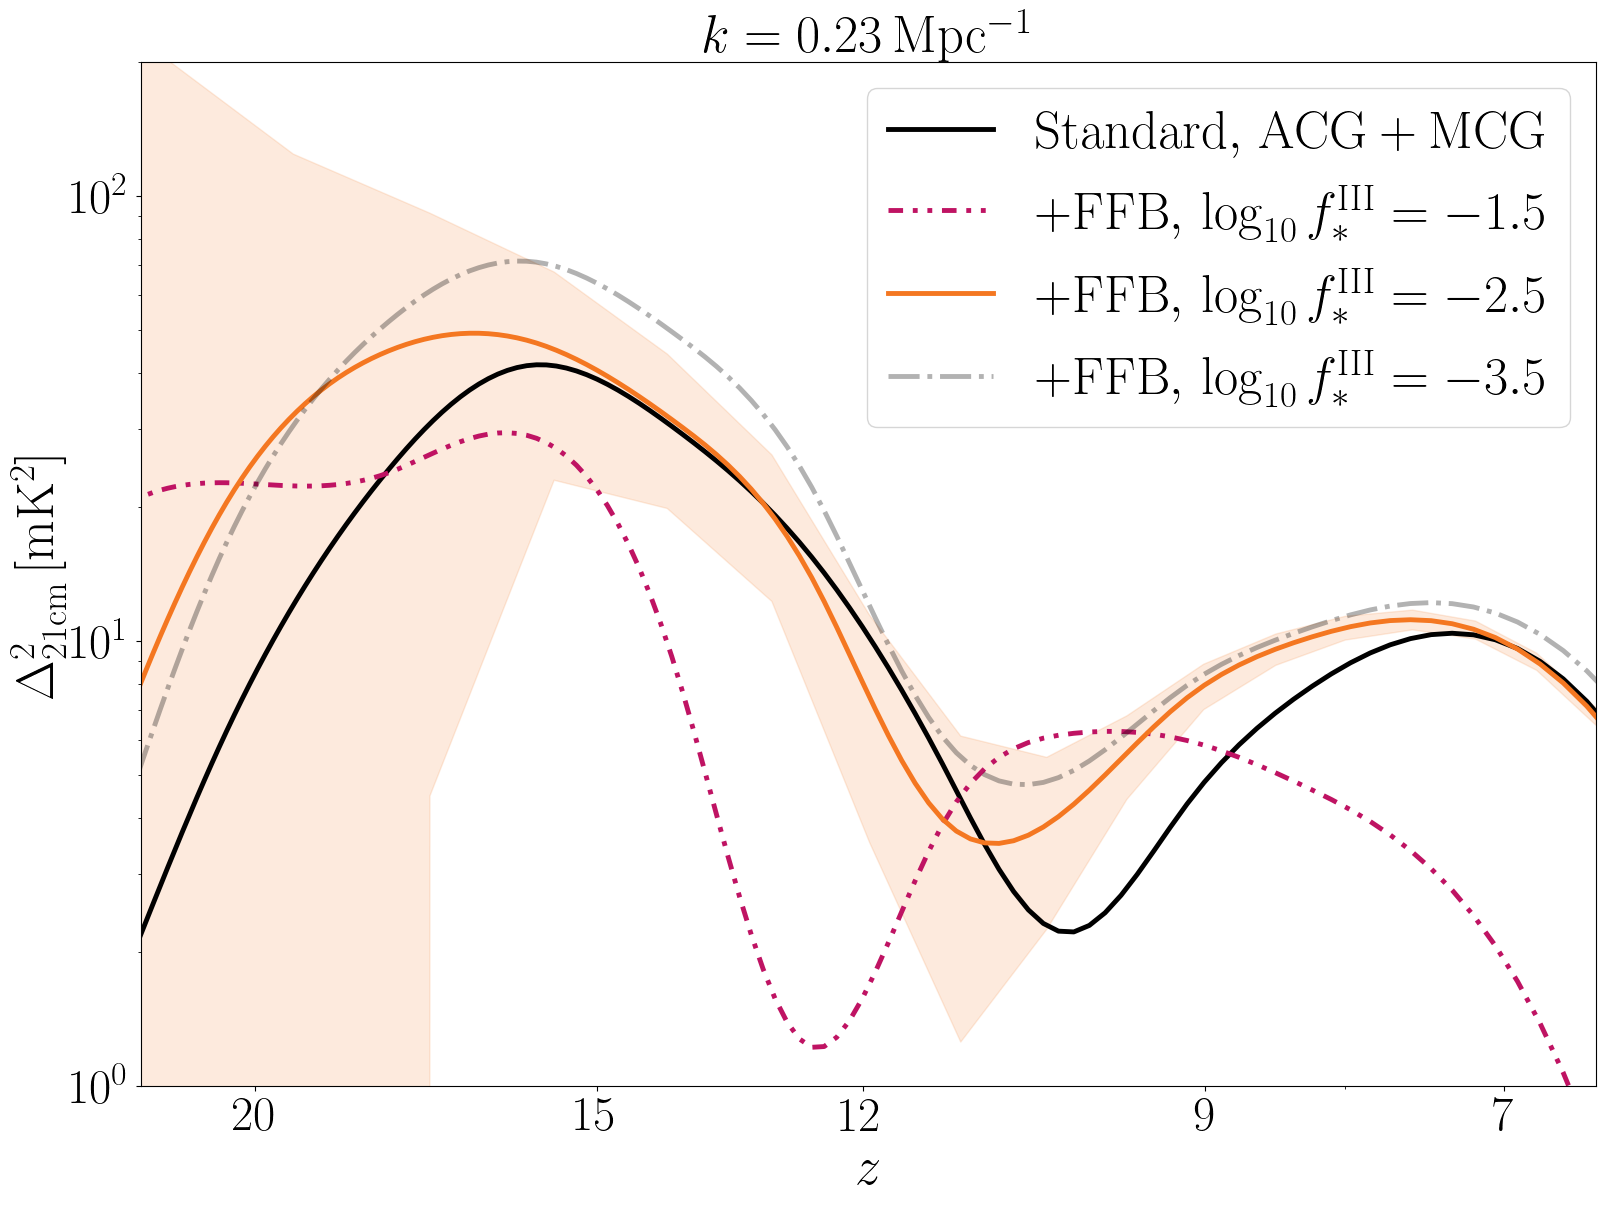
The relevance of all these effects depends on the MCG star formation efficiency, encapsulated in the parameters and in Eq. (19). In particular, following MUN21, we adopt : this choice renders the popIII star formation efficiency independent from the mass of the mini-halos up to the turnover mass. If, instead, we had chosen , star formation in smaller halos would have been accelerated. On the other hand, effects due to large values of partially cover the high- contribution of FFB galaxies in both the observables. It is clear then that accounting for MCGs makes more challenging to detect the signatures of the FFB scenario.
VI Fisher forecasts
In the previous sections, we estimated the effect of the existence of FFB galaxies on the 21-cm global signal and power spectrum. We now want to understand if HERA DeBoer:2016tnn will be able to detect the signatures of this scenario, provided the uncertainties on the MCGs contribution described in Sec. V. For simplicity, we begin this analysis by ignoring the contribution of popIII stars; later, we relax this assumption in Sec. VI.2. Uncertainties related with the SFR model are discussed in Appendix A.
To derive forecasts on the FFB detectability, we compute the Fisher matrix:
| (23) |
where derivatives are performed with respect to
| (24) |
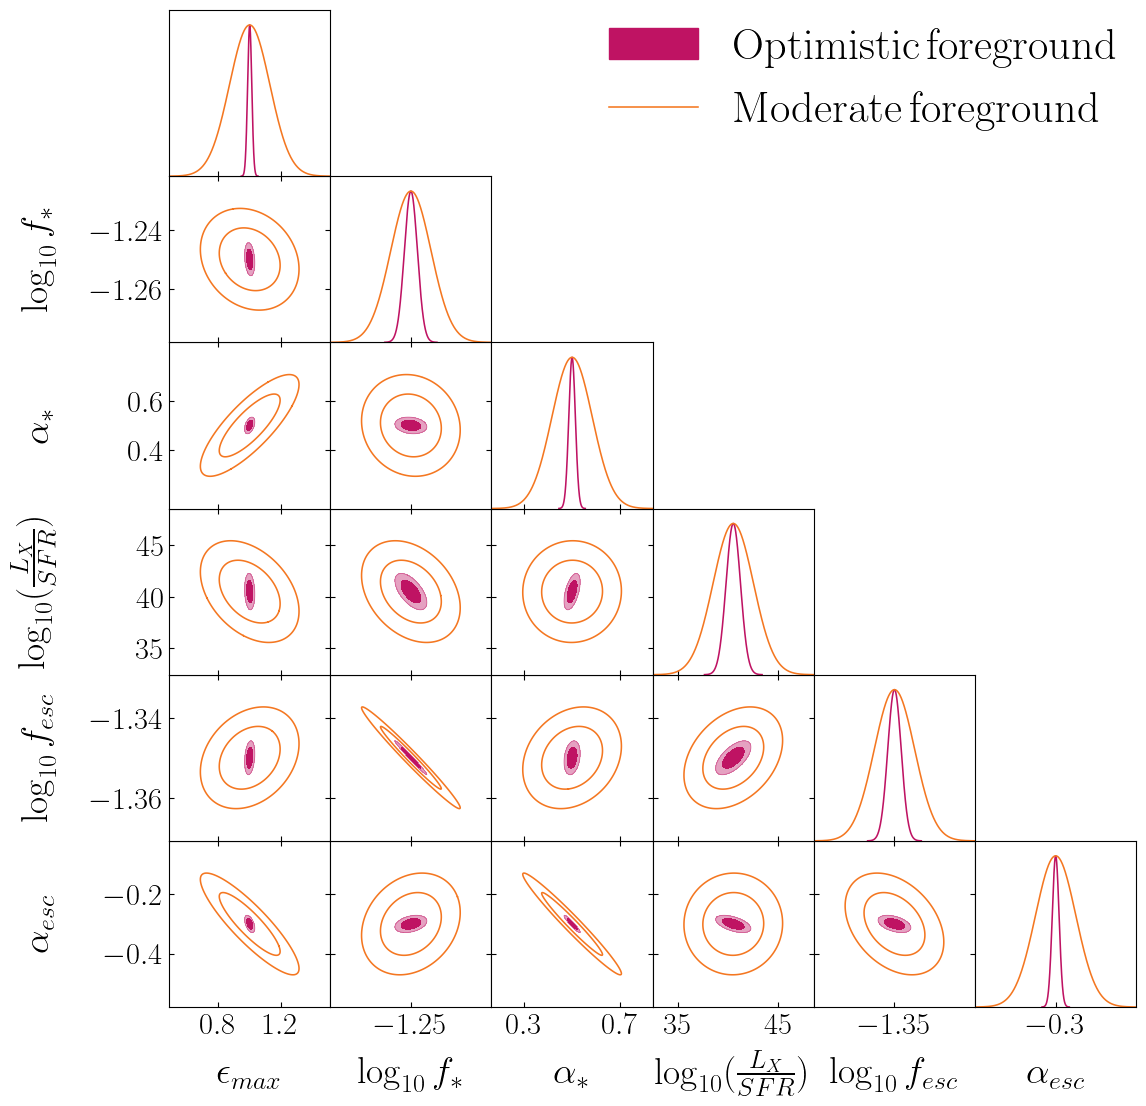
In the parameter set, describes the properties of the FFB scenario, characterize the ACG star-formation efficiency, the escape fraction and the X-ray luminosity. Degeneracies between the parameters are accounted via the process of marginalization; more details on their role in determining the 21-cm signal can be found in Sec. II.1 and MUN21. Fiducial values are summarized in Tab. 1; we use uninformative priors on all the parameters. Variances are computed through 21cmSense for the FFB scenario and including thermal noise and sample variance. The sum is performed over the bins computed by 21cmSense and the 19 -bins defined by the HERA bandwidth.
VI.1 FFB detectability
First of all, we consider only the contribution of ACGs and FFBs, as described in Sec. II. We estimate that, in the case of moderate foreground, the relative marginalized error on is ; optimistic foreground improves the result to . Provided that the relative difference between SFRD in the standard-ACG and FFB scenarios is , our analysis shows that the existence of FFBs can be detected with high significance both considering moderate and optimistic foreground removal. This was expected from the qualitative description in Sec. III: FFBs have a relevant impact on the 21-cm power spectrum and unique features with respect to a simple enhancement of SFR. Thus, degeneracies between parameters entering the Fisher computation are tiny; we check that degeneracies are small between FFBs and other ACG-related astrophysical parameters through the contour plot in Fig. 6.
Smaller values of lead to closer SFRD in the two scenarios and to a weaker constraining power in the 21-cm analysis. For example, yields with moderate foreground and with optimistic foreground, against a relative difference . We note that decreasing the fraction of FFB galaxies in the massive halos via the parameter in Eq. (12) would lead to similar considerations, since its value is degenerate with .
VI.2 Effect due to MCG contributions
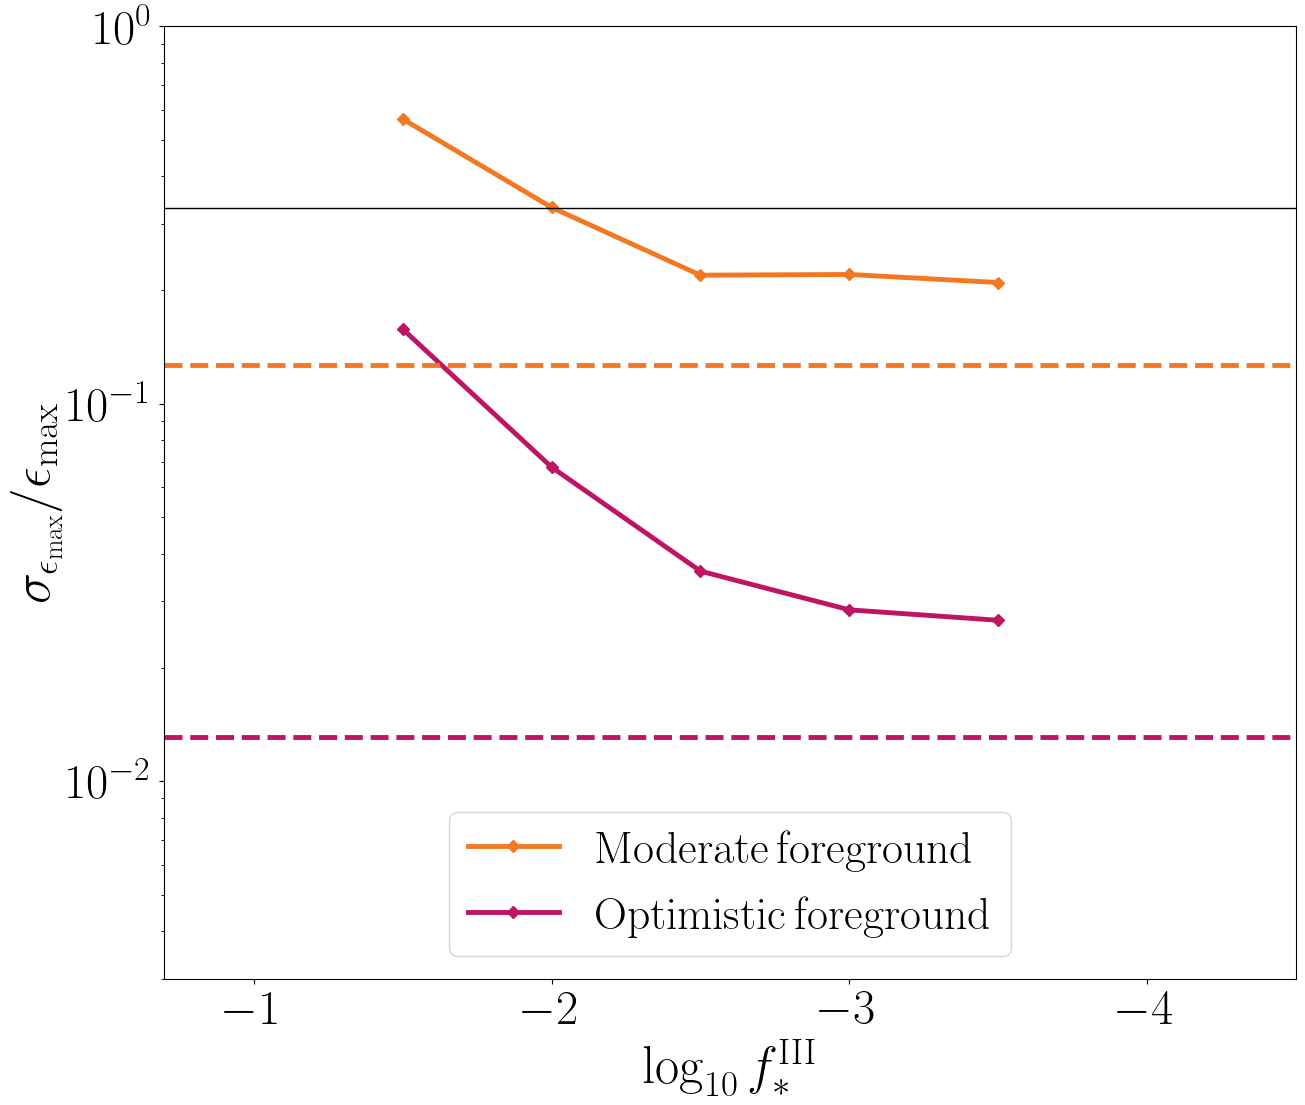
We now account for contributions from popIII stars hosted by MCGs. To do so, we compute the Fisher matrix including in the parameter set also ; other popIII-related parameters in 21cmFAST , namely , are fixed to their fiducial values throughout the analysis. While for the slope we consider as fiducial , for the efficiency we test , to account for the large uncertainties on this parameter. The “nominal” case assumes ; “high efficiency MCGs” adopt ; and finally “low efficiency MCGs” consider . We discuss for conciseness; smaller values lead to less stringent constraints, consistently with results in Sec. VI.1.
Fig. 7 collects our results on , i.e., the marginalized error on once MCGs are included in the analysis. In the case of moderate foreground, the presence of MCGs lowers the significance of the FFB detection: while with “nominal” and “low efficiency MCGs” values, FFB signatures can be still partially detectable, for “high efficiency MCGs” the power spectrum becomes almost indistinguishable from the scenario without FFBs. The situation changes when optimistic foreground is considered: here, FFBs can be detected in both the “nominal” and “low efficiency MCGs” cases, while for “high efficiency MCGs” the FFB detection is still plausible, even if with smaller significance. Even if the conditions for optimistic foreground are quite hard to reach, this result sets a benchmark for HERA’s constraining power on FFBs: results of a future data-analysis will fall in the interval bracketed by the two lines in Fig. 7.
VII Conclusions
Upcoming years will provide improved measurements of the 21-cm global signal and power spectrum from the Epoch of Reionization. Combined with other probes, 21-cm experiments will shed light on the processes that regulate star formation in the first galaxies. Uncertainties still exist on the star formation modelling, particularly regarding the role of popIII stars and stellar feedbacks, for which observations in the local Universe suggest an important role in quenching star formation efficiency. An extrapolation of feedback models to high redshifts should take into account other phenomena.
The authors of Ref. Dekel:2023ddd introduced the process of feedback-free starbursts, namely star formation events with short timescales that should arise in high redshift galaxies. For these to be efficient, gas clouds in which star formation takes place have to be dense enough and with low metallicity; these conditions guarantee that star formation has enough time to be realized before stellar feedbacks become effective. Moreover, under similar conditions, star-forming clouds would be shielded against radiation and winds from older stars. Overall, it is possible to show that these processes boost star formation efficiency inside halos above a certain mass threshold, whose value increases with cosmological time. Therefore, in the late Universe, feedback-free starbursts are rare since they can only be hosted by very massive halos; moreover, once AGN feedbacks set up, star formation always gets quenched in halos . On the contrary, at high redshift the evolution of the threshold mass indicates that feedback-free starbursts can be found even in smaller halos; their presence could explain the existence of high redshift, massive galaxies observed by JWST.
In this work, we investigated the observational signatures such feedback-free starbusts would have on the 21-cm signal. We modelled their contribution to star formation efficiency in atomic cooling galaxies and implemented it into 21cmFAST to estimate their effect on the 21-cm global signal and 21-cm power spectrum.
Our main results can be summarized as follows.
-
The redshift and mass dependence of the SFE in the FFB scenario speed up the evolution of the brightness temperature and of the 21-cm power spectrum before . At lower redshift, instead, their evolution gets closer to the non-FFB scenario. These result respectively from the coupling between the spin and gas temperatures, and from the X-ray heating: the coupling is stronger at high when FFBs are accounted for, due to the low-mass halos that host FFB galaxies at those times; the heating, instead, gets effective at lower , where only massive halos can still host FFBs.
-
On the other hand, the evolution of the neutral hydrogen fraction is only weakly affected by the presence of feedback-free starbursts. This is because the low-mass halos with high escape fraction of ionized photons host FFBs only prior to , practically before the onset of reionization. At lower redshift, such halos tend to be without FFBs, and they therefore contribute to reionization similarly to the standard scenario. On the other hand, the high-mass FFB galaxies at these later times have a negligible contribution to reionization because of their lower escape fraction.
-
We forecasted the detectability of the FFB scenario in the different regimes. We showed that future interferometers, such as HERA, will be able to detect signatures of their existence in the 21-cm power spectrum, compared with the standard scenario that only includes popII stars formed in atomic cooling galaxies. We also checked how our results change when the FFB efficiency is lower.
-
We accounted for the possible contribution at high redshift of popIII stars in molecular cooling galaxies and showed that this may hide the effect of FFBs. We drew forecasts as a function of popIII efficiency: our results show that, except for cases with high efficient popIII star formation, signatures of the FFB scenario can still be detected. The significance level will depend on the foreground level.
To conclude, our work highlights the crucial role 21-cm experiments can have in testing astrophysical scenarios. Their synergy with other probes, such as JWST data, in the upcoming years will foster our research of the high redshift Universe, helping us to shed light on the puzzles related to reionization and the birth of the first galaxies.
Acknowledgements.
SL acknowledges the Azrieli Foundation for support. JF is supported by an ongoing Negev Scholarship by the Kreitman School at Ben-Gurion University. EDK acknowledges support by Grant No. 2022743 from the US-Israel Bi-national Science Foundation (BSF) and Grant No. 2307354 from the U.S. National Science Foundation (NSF). AD and ZL are supported by the Israel Science Foundation Grant ISF 861/20. ZL has received funding from the European Union’s Horizon 2020 research and innovation programme under the Marie Skłodowska-Curie grant agreement No 101109759 (“CuspCore”). The authors thank Debanjan Sarkar, Lukas J. Furtak and Brant Robertson for useful and stimulating discussions.Appendix A Changing the star formation model
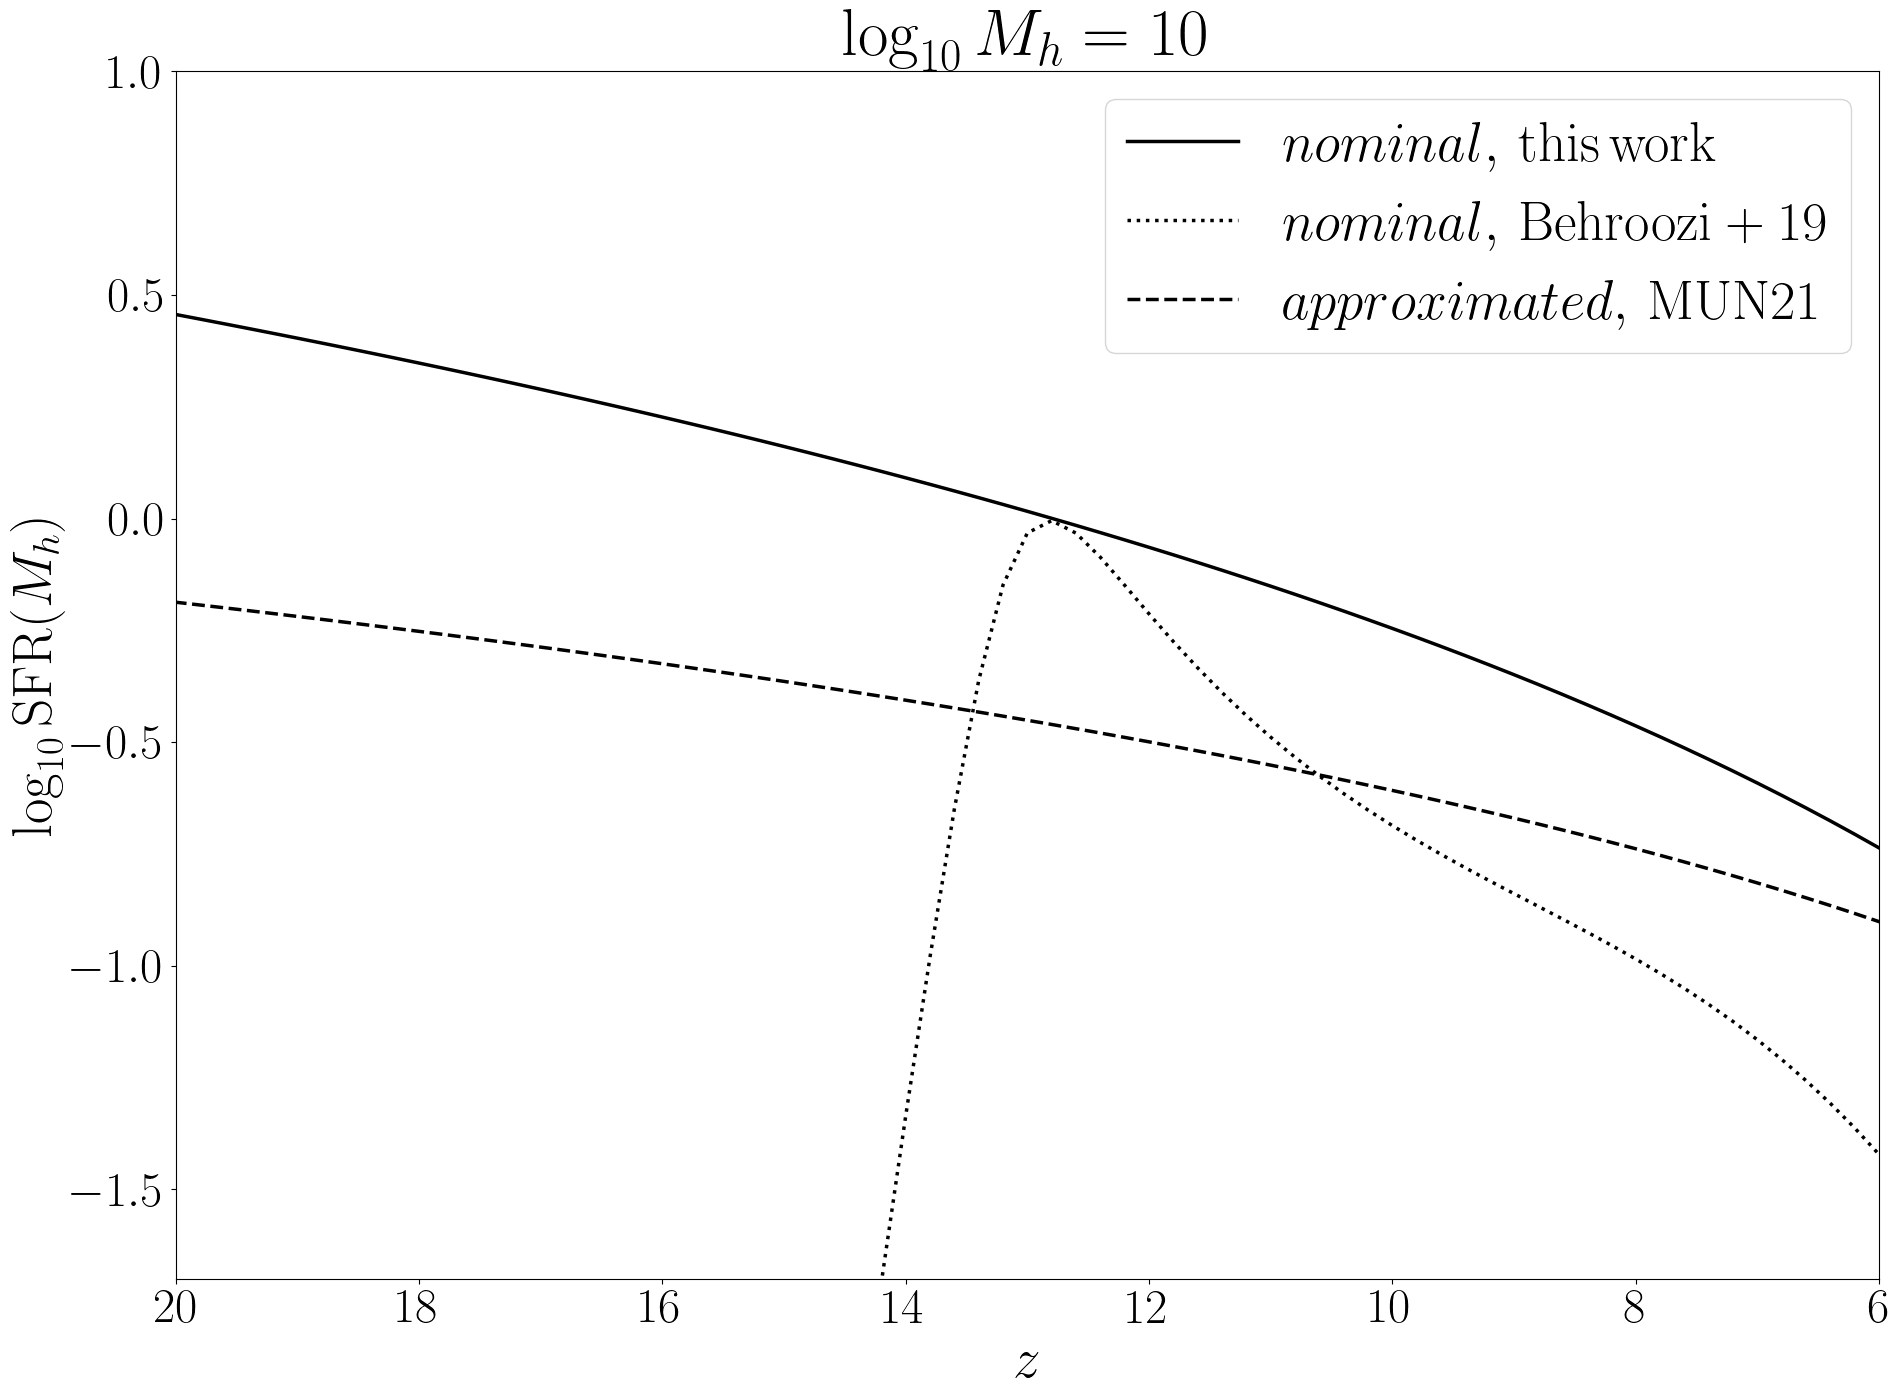
Throughout the main text, all the ACG- and FFB-related results were obtained under the assumption that the SFR is computed based on Eq. (6), which from now on we label nominal. This is different from the prescription defined in MUN21 and defined in the 21cmFAST public release: as a first order approximation, these works assume that the SFR in the ACG scenario is
| (25) |
with the stellar mass, the virial mass of the host halo, defined in Eq. (10) and . With respect to Eq. (6), this expression encodes a different redshift evolution, as it can be seen in Fig. 8. In this figure, we show the star formation rate obtained for the standard model101010Including FFBs we would get similar results. We verified that the relative difference between the standard and FFB scenarios remains consistent when moving from the nominal SFR in Eq. (6) to the approximated SFR in Eq. (25). using Eqs. (6) and (25), with from Eq. (10). We show as well the SFR obtained extrapolating at high- the results of Ref. Behroozi:2019kql ; this, however, becomes less reliable for . Since the high redshift range is crucial to model the 21-cm signal, we decided to avoid this approximation in our analysis in the main text. The plot shows that, above , the nominal SFR is larger than the approximated one; thus, we expect the nominal SFR to foresee an earlier reionization.
A.1 Effect on the 21-cm observables
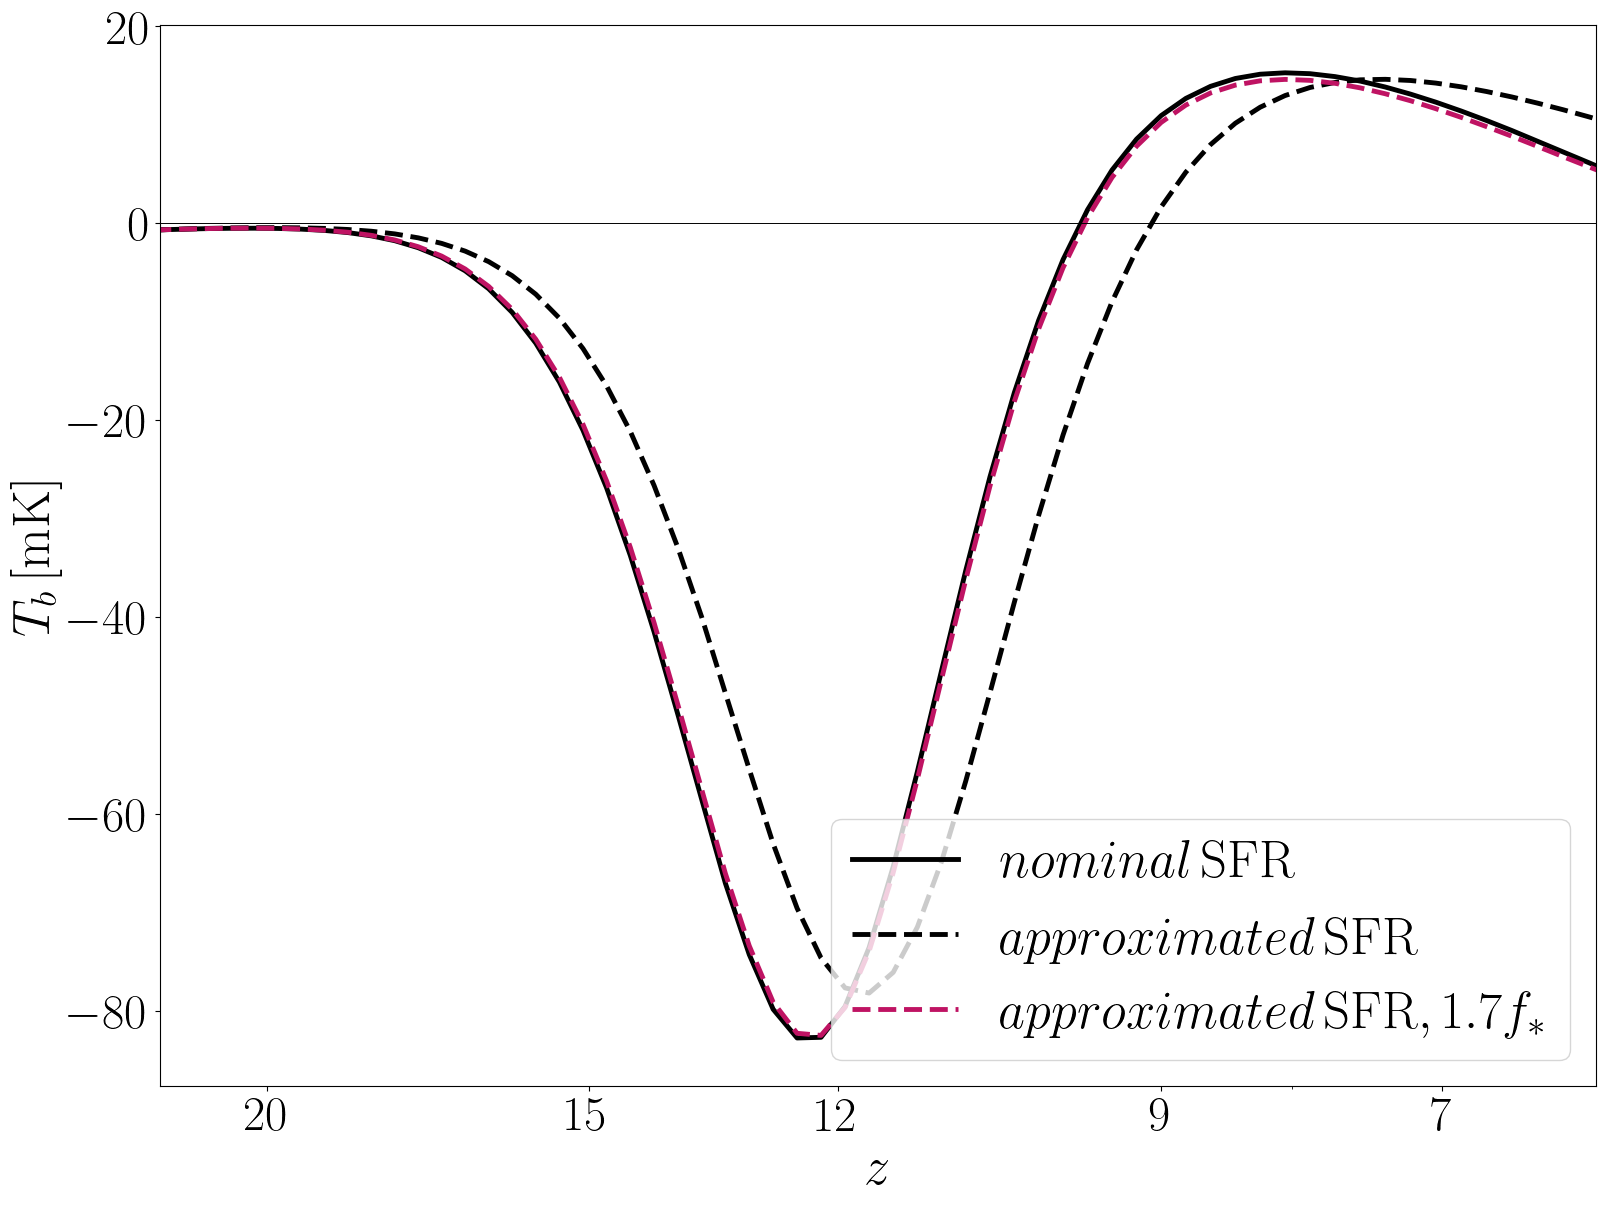
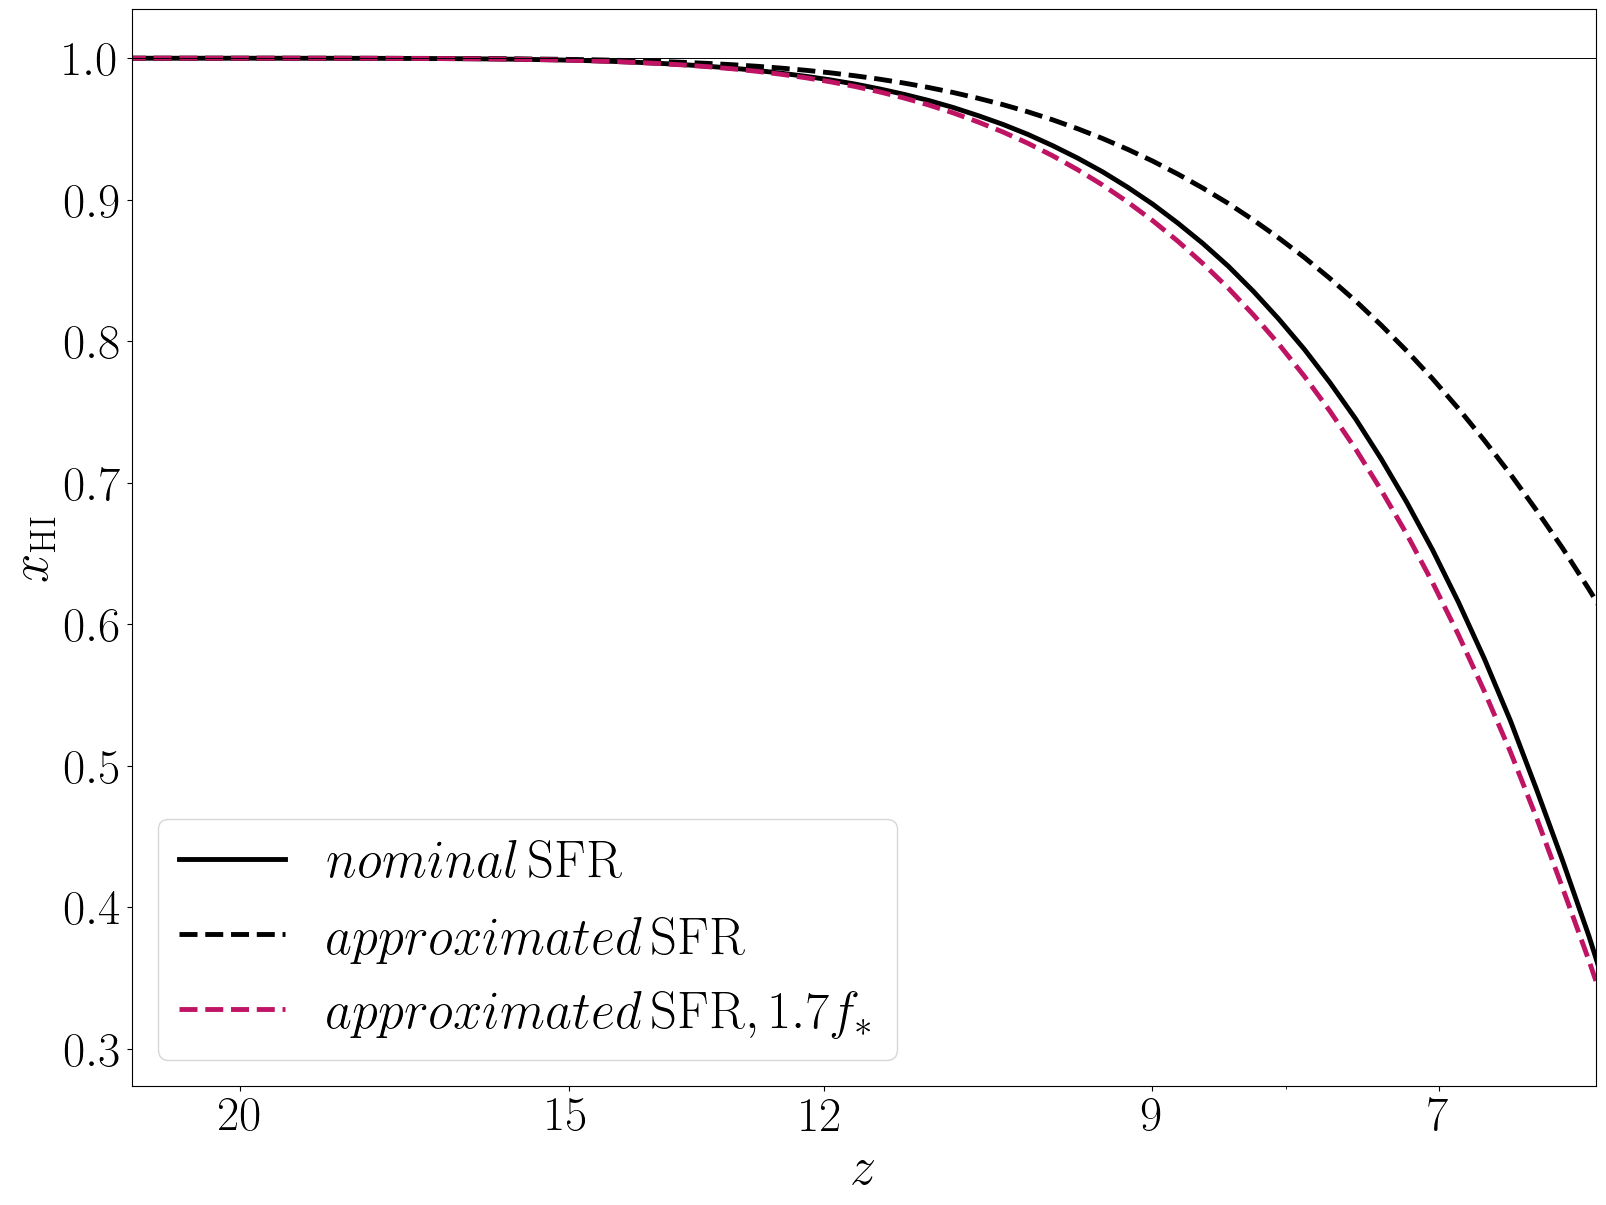
Fig. 9 shows the global signal and the neutral hydrogen fraction using the nominal and approximated SFR formalism. The larger SFR obtained in the nominal case anticipates the peak with respect to the approximated one; consistently, reionization is anticipated.
We also show how the approximated SFR behaves once is rescaled to , in the same fashion as the enhanced model in Fig. 2: in the nominal case can be well recovered by simply change the normalization of the pivot value. Therefore, we can assume that at first order the uncertainties on the SFR model are encapsulated in the uncertainties on the parameter .
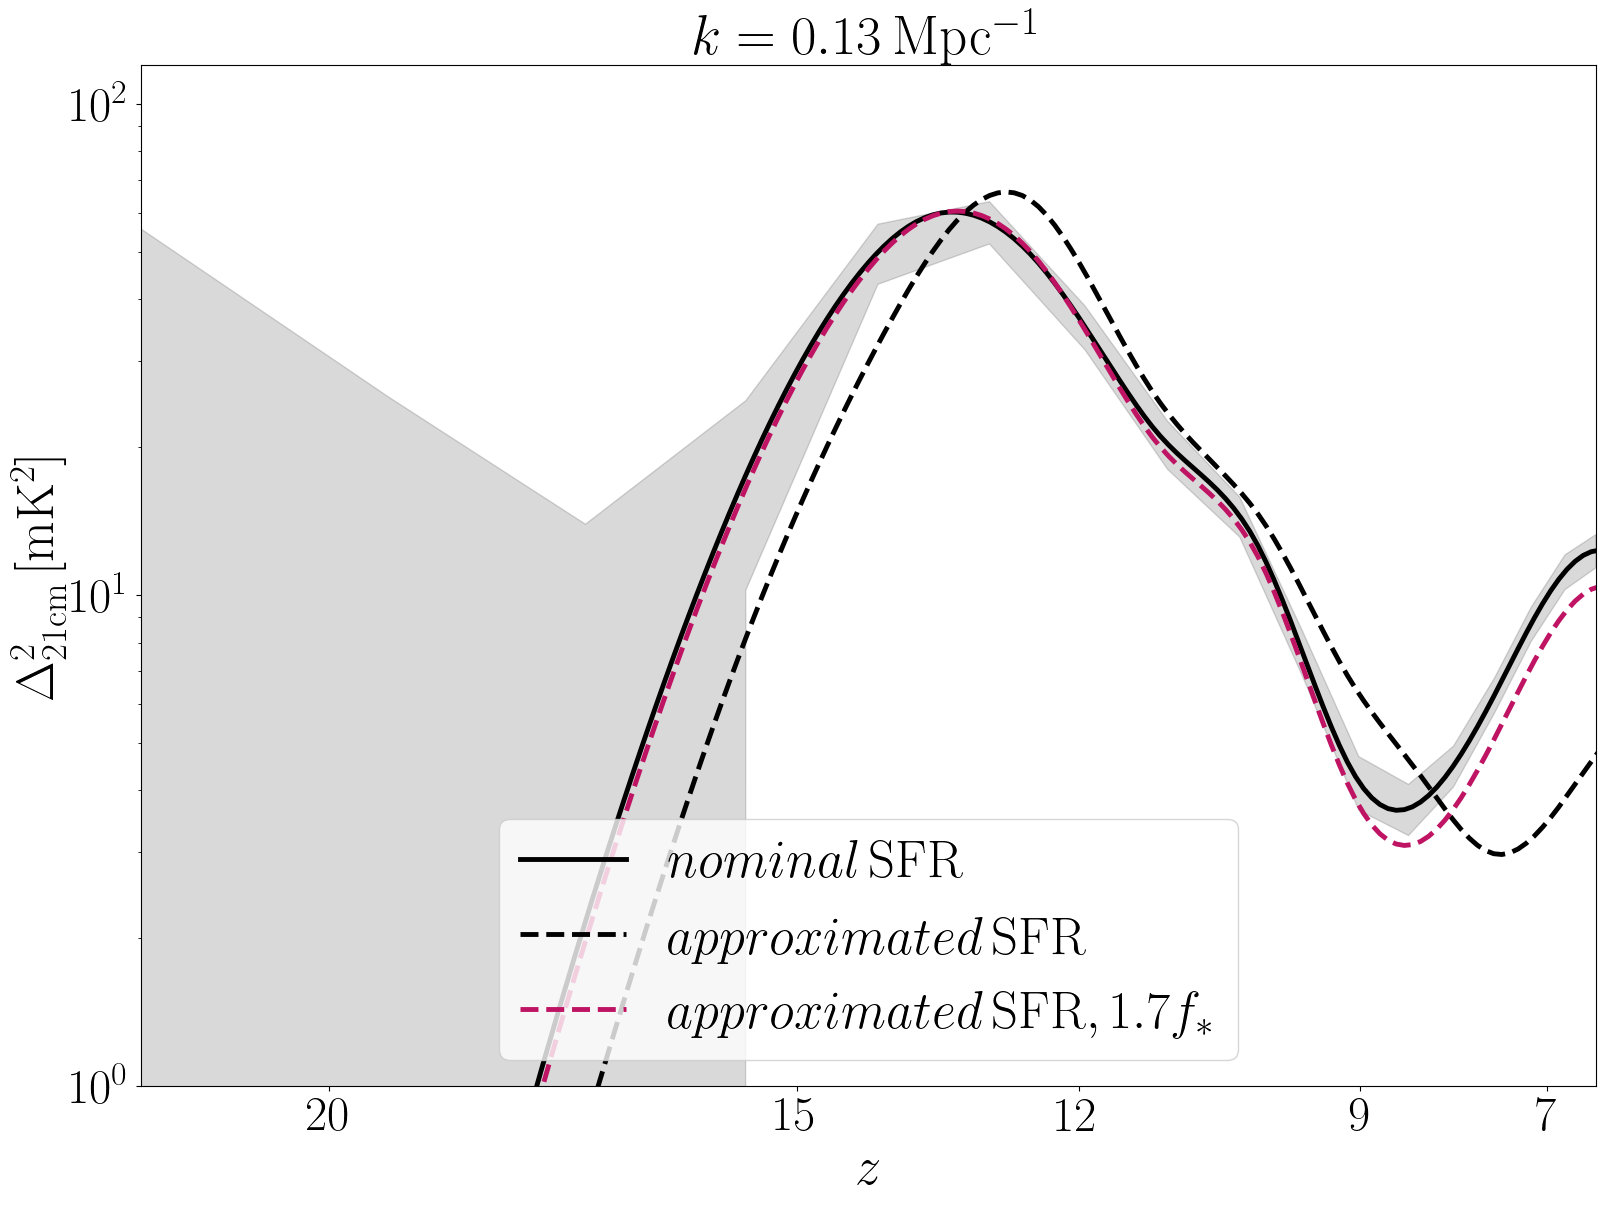
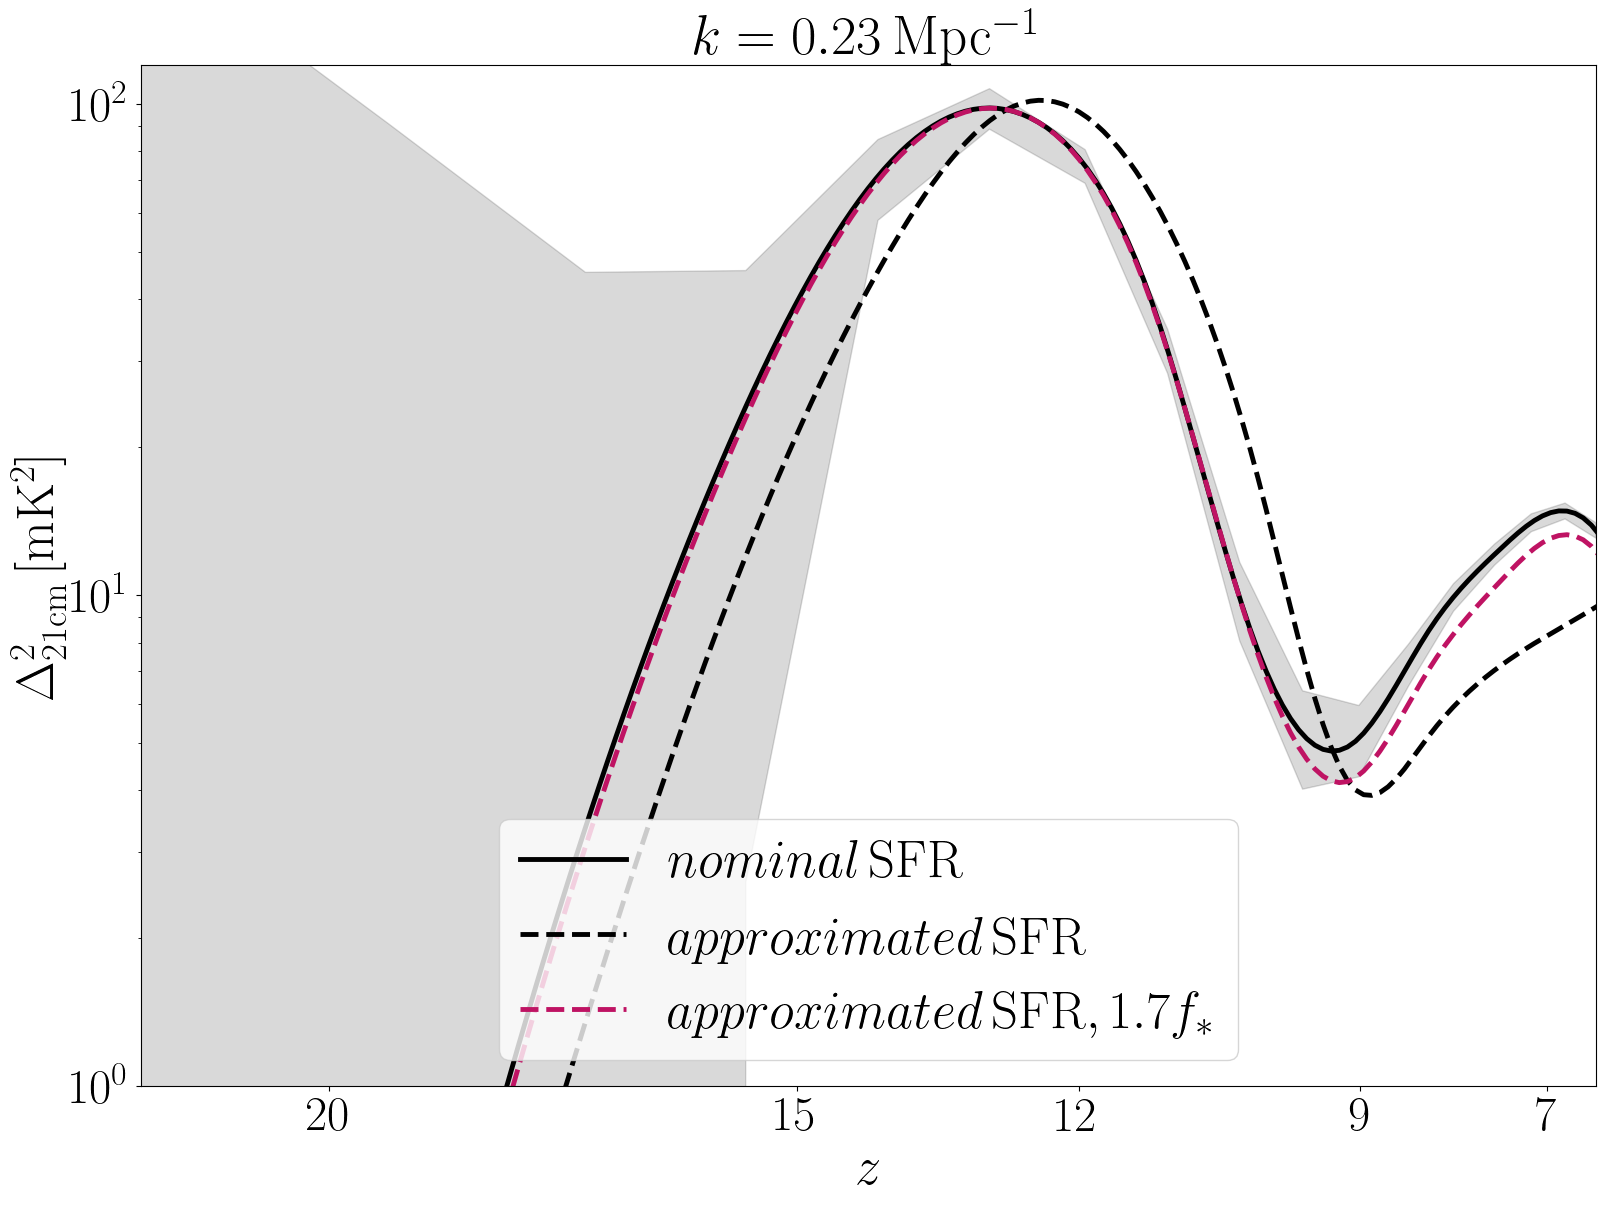
Analogous considerations can be made for the power spectrum, shown in Fig. 10. In this case, changing in the approximated model we can mimic the nominal SFR power spectrum only above . The difference between the nominal and approximated cases are outside the forecasted errorbars; this implies HERA will be able to put valuable constraints on the SFR, reducing the uncertainties currently existing in the literature.
A.2 FFB contraints
We apply the approximated SFR formalism to the study of FFB detectability. This allows a more straightforward comparison with other works in the 21-cm literature, which adopt the same prescription, e.g., MUN21. Analogously to Sec. VI.1, we run the Fisher analysis using the approximated SFR model, with the same parameter set . For conciseness, we only discuss , but a similar analysis can be performed for other values.
Since the relative difference between the standard and FFB scenarios is not changed by the change in the SFR model, results using the approximated SFR depart from Sec. VI.1 both under moderate and optimistic foreground assumptions. Constraints in the approximated model slightly improve since the power spectrum moves to lower , where HERA is more sensitive.
As Fig. 8 highlights, the difference between the nominal and approximated formalism can be reproduced in the 21-cm observables by varying the value of . Thus, the degeneracy between the SFR model choice and the FFB existence can be at first order understood in terms of the degeneracy between and . This is represented by the ellipses in Fig. 6 and marginalized in the Fisher: given our results, HERA should be able to disentangle features in the 21-cm power spectrum due to the presence of FFBs from uncertainties in the SFR model.
References
- (1) S. Furlanetto, S. P. Oh and F. Briggs, “Cosmology at Low Frequencies: The 21 cm Transition and the High-Redshift Universe,” Phys. Rept. 433, 181-301 (2006) [arXiv:astro-ph/0608032].
- (2) J. R. Pritchard and A. Loeb, “21-cm cosmology,” Rept. Prog. Phys. 75, 086901 (2012) [arXiv:1109.6012].
- (3) A. Mesinger, S. Furlanetto and R. Cen, “21cmFAST: A Fast, Semi-Numerical Simulation of the High-Redshift 21-cm Signal,” Mon. Not. Roy. Astron. Soc. 411, 955 (2011) [arXiv:1003.3878].
- (4) J. B. Muñoz, Y. Qin, A. Mesinger, S. G. Murray, B. Greig and C. Mason, “The impact of the first galaxies on cosmic dawn and reionization,” Mon. Not. Roy. Astron. Soc. 511, no.3, 3657-3681 (2022) [arXiv:2110.13919].
- (5) J. D. Bowman, A. E. E. Rogers, R. A. Monsalve, T. J. Mozdzen and N. Mahesh, “An absorption profile centred at 78 megahertz in the sky-averaged spectrum,” Nature 555, no.7694, 67-70 (2018) [arXiv:1810.05912].
- (6) N. Patra, R. Subrahmanyan, S. Sethi, N. U. Shankar and A. Raghunathan, “SARAS measurement of the Radio Background at long wavelengths,” Astrophys. J. 801, no.2, 138 (2015) [arXiv:1412.7762].
- (7) D. R. DeBoer, A. R. Parsons, J. E. Aguirre, P. Alexander, Z. S. Ali, A. P. Beardsley, G. Bernardi, J. D. Bowman, R. F. Bradley and C. L. Carilli, et al. “Hydrogen Epoch of Reionization Array (HERA),” Publ. Astron. Soc. Pac. 129, no.974, 045001 (2017) [arXiv:1606.07473].
- (8) J. Wang, M. G. Santos, P. Bull, K. Grainge, S. Cunnington, J. Fonseca, M. O. Irfan, Y. Li, A. Pourtsidou and P. S. Soares, et al. “H i intensity mapping with MeerKAT: calibration pipeline for multidish autocorrelation observations,” Mon. Not. Roy. Astron. Soc. 505, no.3, 3698-3721 (2021) [arXiv:2011.13789].
- (9) R. Ghara, T. R. Choudhury, K. K. Datta and S. Choudhuri, “Imaging the redshifted 21-cm pattern around the first sources during the cosmic dawn using the SKA,” Mon. Not. Roy. Astron. Soc. 464, no.2, 2234-2248 (2017) [arXiv:1607.02779].
- (10) R. P. Naidu, A. O. Pascal, et al. “Two Remarkably Luminous Galaxy Candidates at z 10–12 Revealed by JWST,” The Astrophysical Journal Letters. 940, no.1, L14 (2022) [arXiv:2207.09434].
- (11) C. T. Donnan, D. J. McLeod, R. J. McLure, J. S. Dunlop, A. C. Carnall, F. Cullen, D. Magee, “The abundance of z 10 galaxy candidates in the HUDF using deep JWST NIRCam medium-band imaging,” MNRAS 520, no.3, 4554–4561 (2023) [arXiv:2212.10126].
- (12) Labbé, Ivo and van Dokkum, Pieter and Nelson, Erica and Bezanson, Rachel and Suess, Katherine A. and Leja, Joel and Brammer, Gabriel and Whitaker, Katherine and Mathews, Elijah and Stefanon, Mauro and Wang, Bingjie, “A population of red candidate massive galaxies 600 Myr after the Big Bang,” Nature 616, no.7956, 266-269 (2023) [arXiv:2207.12446].
- (13) R. Bouwens, G. Illingworth, P. Oesch, M. Stefanon, R. Naidu, I. van Leeuwen and D. Magee, “UV luminosity density results at z 8 from the first JWST/NIRCam fields: limitations of early data sets and the need for spectroscopy,” Mon. Not. Roy. Astron. Soc. 523, no.1, 1009-1035 (2023) [arXiv:2212.06683].
- (14) C. A. Mason, M. Trenti and T. Treu, “The brightest galaxies at cosmic dawn,” Mon. Not. Roy. Astron. Soc. 521, no.1, 497-503 (2023) [arXiv:2207.14808].
- (15) C. C. Lovell, I. Harrison, Y. Harikane, S. Tacchella and S. M. Wilkins, “Extreme value statistics of the halo and stellar mass distributions at high redshift: are JWST results in tension with CDM?,” Mon. Not. Roy. Astron. Soc. 518, no.2, 2511-2520 (2022) [arXiv:2208.10479].
- (16) N. Sabti, J. B. Muñoz and M. Kamionkowski, “Insights from HST into Ultra-Massive Galaxies and Early-Universe Cosmology,” [arXiv:2305.07049].
- (17) S. Hirano and N. Yoshida, “Early Structure Formation from Primordial Density Fluctuations with a Blue, Tilted Power Spectrum – II. High-Redshift Galaxies,” [arXiv:2306.11993].
- (18) H. Padmanabhan and A. Loeb, “Alleviating the need for exponential evolution of JWST galaxies in 10 haloes at by a modified CDM power spectrum,” [arXiv:2306.04684].
- (19) M. Haslbauer, P. Kroupa, A. H. Zonoozi and H. Haghi, “Has JWST Already Falsified Dark-matter-driven Galaxy Formation?,” Astrophys. J. Lett. 939, no.2, L31 (2022) [arXiv:2210.14915].
- (20) Charles L. Steinhardt and Vasily Kokorev and Vadim Rusakov and Ethan Garcia and Albert Sneppen, “Templates for Fitting Photometry of Ultra-High-Redshift Galaxies,” The Astrophysical Journal Letters, 951, 2, L40 (2023) [arXiv:2208.07879].
- (21) E. Zackrisson, C. E. Rydberg, D. Schaerer, G. Ostlin and M. Tuli, “The spectral evolution of the first galaxies. I. James Webb Space Telescope detection limits and color criteria for population III galaxies,” Astrophys. J. 740, 13 (2011) [arXiv:1105.0921].
- (22) Kohei Inayoshi and Yuichi Harikane and Akio K. Inoue and Wenxiu Li and Luis C. Ho, “A Lower Bound of Star Formation Activity in Ultra-high-redshift Galaxies Detected with JWST: Implications for Stellar Populations and Radiation Sources,” The Astrophysical Journal Letters 938, no.2, L10 (2022) [arXiv:2208.06872].
- (23) H. Yajima and M. Abe and H. Fukushima and Y. Ono and Y. Harikane and M. Ouchi and T. Hashimoto and S. Khochfar, “FOREVER22: the first bright galaxies with population III stars at redshifts and comparisons with JWST data,” [arXiv:2211.12970].
- (24) F. Fiore and A. Ferrara and M. Bischetti and C. Feruglio and A. Travascio, “Dusty-wind-clear JWST Super-early Galaxies,” The Astrophysical Journal Letters 943, 2 (2023) [arXiv:2211.08937].
- (25) A. Pallottini and A. Ferrara, “Stochastic star formation in early galaxies: JWST implications,” Astron. Astrophys. 677, L4 (2023) [arXiv:2307.03219].
- (26) A. Dekel, K. S. Sarkar, Y. Birnboim, N. Mandelker and Z. Li, “Efficient Formation of Massive Galaxies at Cosmic Dawn by Feedback-Free Starbursts,” [arXiv:2303.04827].
- (27) R. Barkana and A. Loeb, “In the beginning: The First sources of light and the reionization of the Universe,” Phys. Rept. 349, 125-238 (2001) [arXiv:astro-ph/0010468].
- (28) N. Aghanim et al. [Planck], “Planck 2018 results. I. Overview and the cosmological legacy of Planck,” Astron. Astrophys. 641, A1 (2020) [arXiv:1807.06205].
- (29) G. B. Field, “The Spin Temperature of Intergalactic Neutral Hydrogen,” The Astrophysical Journal. 129, 536 (1959)
- (30) A. Loeb and M. Zaldarriaga, “Measuring the small - scale power spectrum of cosmic density fluctuations through 21 cm tomography prior to the epoch of structure formation,” Phys. Rev. Lett. 92, 211301 (2004) [arXiv:astro-ph/0312134].
- (31) S. A. Wouthuysen, “On the excitation mechanism of the 21-cm (radio-frequency) interstellar hydrogen emission line,” The Astronomical Journal. 57, 31-32 (1952)
- (32) G. B. Field, “Excitation of the Hydrogen 21-CM Line,” Proceedings of the IRE. 46, 240-250 (1958)
- (33) C. M. Hirata, “Wouthuysen-Field coupling strength and application to high-redshift 21 cm radiation,” Mon. Not. Roy. Astron. Soc. 367, 259-274 (2006) [arXiv:astro-ph/0507102].
- (34) J. R. Pritchard and S. R. Furlanetto, “21 cm fluctuations from inhomogeneous X-ray heating before reionization,” Mon. Not. Roy. Astron. Soc. 376, 1680-1694 (2007) [arXiv:astro-ph/0607234].
- (35) R. Barkana and A. Loeb, “Detecting the earliest galaxies through two new sources of 21cm fluctuations,” Astrophys. J. 626, 1-11 (2005) [arXiv:astro-ph/0410129].
- (36) T. Fragos, B. D. Lehmer, S. Naoz, A. Zezas and A. R. Basu-Zych, “Energy Feedback from X-ray Binaries in the Early Universe,” Astrophys. J. Lett. 776, L31 (2013) [arXiv:1306.1405].
- (37) E. Sobacchi and A. Mesinger, “Inhomogeneous recombinations during cosmic reionization,” Mon. Not. Roy. Astron. Soc. 440, no.2, 1662-1673 (2014) [arXiv:1402.2298].
- (38) J. Park, A. Mesinger, B. Greig and N. Gillet, “Inferring the astrophysics of reionization and cosmic dawn from galaxy luminosity functions and the 21-cm signal,” Mon. Not. Roy. Astron. Soc. 484, no.1, 933-949 (2019) [arXiv:1809.08995].
- (39) Verhamme, Anne and Orlitová, Ivana and Schaerer, Daniel and Hayes, Matthew, “Using Lyman- to detect galaxies that leak Lyman continuum,” Astronomy and Astrophysics 578, A7 (2015) [arXiv:1404.2958].
- (40) K. Wood and A. Loeb, “Escape of ionizing radiation from high-redshift galaxies,” Astrophys. J. 545, 86 (2000) [arXiv:astro-ph/9911316].
- (41) P. S. Behroozi and J. Silk, “A Simple Technique for Predicting High-Redshift Galaxy Evolution,” Astrophys. J. 799, no.1, 32 (2015) [arXiv:1404.5299].
- (42) L. Y. A. Yung, R. S. Somerville, S. L. Finkelstein, M. Hirschmann, R. Davé, G. Popping, J. P. Gardner and A. Venkatesan, “Semi-analytic forecasts for JWST – V. AGN luminosity functions and helium reionization at z = 2–7,” Mon. Not. Roy. Astron. Soc. 508, no.2, 2706-2729 (2021) [arXiv:2109.13241].
- (43) A. Fialkov, R. Barkana, E. Visbal, D. Tseliakhovich and C. M. Hirata, “The 21-cm signature of the first stars during the Lyman-Werner feedback era,” Mon. Not. Roy. Astron. Soc. 432, 2909 (2013) doi:10.1093/mnras/stt650 [arXiv:1212.0513].
- (44) A. Dekel, A. Zolotov, D. Tweed, M. Cacciato, D. Ceverino and J. R. Primack, Mon. Not. Roy. Astron. Soc. 435, 999 (2013) doi:10.1093/mnras/stt1338 [arXiv:1303.3009].
- (45) C. Mason, M. Trenti and T. Treu, “The Galaxy UV Luminosity Function Before the Epoch of Reionization,” Astrophys. J. 813, no.1, 21 (2015) [arXiv:1508.01204].
- (46) S. Tacchella, S. Bose, C. Conroy, D. J. Eisenstein and B. D. Johnson, “A Redshift-independent Efficiency Model: Star Formation and Stellar Masses in Dark Matter Halos at z 4,” Astrophys. J. 868, no.2, 92 (2018) [arXiv:1806.03299].
- (47) J. Mirocha, P. La Plante and A. Liu, “The importance of galaxy formation histories in models of reionization,” Mon. Not. Roy. Astron. Soc. 507, no.3, 3872-3887 (2021) [arXiv:2012.09189].
- (48) W. A. Watson, I. T. Iliev, A. D’Aloisio, A. Knebe, P. R. Shapiro and G. Yepes, “The halo mass function through the cosmic ages,” Mon. Not. Roy. Astron. Soc. 433, 1230 (2013) [arXiv:1212.0095].
- (49) S. Wyithe and A. Loeb, “A suppressed contribution of low mass galaxies to reionization due to supernova feedback,” Mon. Not. Roy. Astron. Soc. 428, 2741 (2013) [arXiv:1209.2215].
- (50) S. P. Oh and Z. Haiman, “Second-generation objects in the universe: radiative cooling and collapse of halos with virial temperatures above 10^4 kelvin,” Astrophys. J. 569, 558 (2002) [arXiv:astro-ph/0108071].
- (51) A. A. Thoul and D. H. Weinberg, “Hydrodynamic simulations of galaxy formation. 2. Photoionization and the formation of low mass galaxies,” Astrophys. J. 465, 608 (1996) [arXiv:astro-ph/9510154].
- (52) Y. Noh and M. McQuinn, “A physical understanding of how reionization suppresses accretion on to dwarf haloes,” Mon. Not. Roy. Astron. Soc. 444, no.1, 503-514 (2014) [arXiv:1401.0737].
- (53) Y. Noh and M. McQuinn, “New insight on the nature of cosmic reionizers from the CEERS survey,” (2023) [arXiv:2309.02219].
- (54) A. Mesinger, A. Ferrara and D. S. Spiegel, “Signatures of X-rays in the early Universe,” Mon. Not. Roy. Astron. Soc. 431, 621 (2013) [arXiv:1210.7319].
- (55) M. McQuinn, “Constraints on X-ray Emissions from the Reionization Era,” Mon. Not. Roy. Astron. Soc. 426, 1349-1360 (2012) [arXiv:1206.1335].
- (56) M. R. Santos, “Probing reionization with Lyman-alpha emission lines,” Mon. Not. Roy. Astron. Soc. 349, 1137 (2004) [arXiv:astro-ph/0308196].
- (57) A. Das, A. Mesinger, A. Pallottini, A. Ferrara and J. H. Wise, “High Mass X-ray Binaries and the Cosmic 21-cm Signal: Impact of Host Galaxy Absorption,” Mon. Not. Roy. Astron. Soc. 469, no.1, 1166-1174 (2017) [arXiv:1702.00409].
- (58) P. Behroozi, R. H. Wechsler, A. P. Hearin and C. Conroy, “UniverseMachine: The correlation between galaxy growth and dark matter halo assembly from z = 010,” Mon. Not. Roy. Astron. Soc. 488, no.3, 3143-3194 (2019) [arXiv:1806.07893].
- (59) Rodríguez-Puebla, A. and Primack, J. R. and Avila-Reese, V. and Faber, S. M. “Constraining the galaxy–halo connection over the last 13.3 Gyr: star formation histories, galaxy mergers and structural properties,” Monthly Notices of the Royal Astronomical Society 470, 1 (2017) [arXiv:1703.04542].
- (60) Benjamin P. Moster and Thorsten Naab and Simon D M. White, “emerge – an empirical model for the formation of galaxies since z 10,” Monthly Notices of the Royal Astronomical Society 477, 2, 1822-1852 (2018) [arXiv:1705.05373].
- (61) P. S. Behroozi, R. H. Wechsler and C. Conroy, “The Average Star Formation Histories of Galaxies in Dark Matter Halos from 0-8,” Astrophys. J. 770, 57 (2013) [arXiv:1207.6105].
- (62) M. R. Krumholz, “Star Formation in Atomic Gas,” Astrophys. J. 759, 9 (2012) [arXiv:1208.1504].
- (63) S. M. Fall, M. R. Krumholz and C. D. Matzner, “Stellar Feedback in Molecular Clouds and its Influence on the Mass Function of Young Star Clusters,” Astrophys. J. Lett. 710, L142 (2010) [arXiv:0910.2238].
- (64) Grudić, M. Y. and Hopkins, P. F. et al., “When feedback fails: the scaling and saturation of star formation efficiency,” Monthly Notices of the Royal Astronomical Society 475, 3 (2018)
- (65) Grudić, Michael Y and Boylan-Kolchin, Michael and Faucher-Giguère, Claude-André and Hopkins, Philip, “The universal acceleration scale from stellar feedback,” Monthly Notices of the Royal Astronomical Society: Letters 496, 1 (2020)
- (66) Shyam H. Menon and Christoph Federrath and Mark R. Krumholz, “Outflows driven by direct and reprocessed radiation pressure in massive star clusters,” Monthly Notices of the Royal Astronomical Society 521, 4 (2023)
- (67) R. I. Klein, C. F. McKee and P. Colella, “On the Hydrodynamic interaction of shock waves with interstellar clouds. 1: Nonradiative shocks in small clouds,” Astrophys. J. 420, 213-236 (1994)
- (68) S. G. Murray, B. Greig, A. Mesinger, J. B. Muñoz, Y. Qin, J. Park and C. A. Watkinson, “21cmFAST v3: A Python-integrated C code for generating 3D realizations of the cosmic 21cm signal,” J. Open Source Softw. 5, no.54, 2582 (2020) [arXiv:2010.15121].
- (69) J. Flitter, E. D. Kovetz, “21cmFirstCLASS I. Cosmological tool for CDM and beyond”, [arXiv:2309.03942]
- (70) J. Flitter, E. D. Kovetz, “21cmFirstCLASS II. Early linear fluctuations of the 21cm signal”, [arXiv:2309.03948]
- (71) A. Mesinger and S. Furlanetto, “Efficient Simulations of Early Structure Formation and Reionization,” Astrophys. J. 669, 663 (2007) [arXiv:0704.0946].
- (72) J. B. Muñoz, “An Effective Model for the Cosmic-Dawn 21-cm Signal,” Mon. Not. Roy. Astron. Soc. 523, 2587 (2023) [arXiv:2302.08506].
- (73) D. Sarkar, J. Flitter and E. D. Kovetz, “Exploring delaying and heating effects on the 21-cm signature of fuzzy dark matter,” Phys. Rev. D 105, no.10, 103529 (2022) [arXiv:2201.03355].
- (74) Steven G. Murray, “powerbox: A Python package for creating structured fields with isotropic power spectra,” Journal of Open Source Software 28, 3 (2018) [arXiv:1809.05030].
- (75) Z. Abdurashidova et al. [HERA], “First Results from HERA Phase I: Upper Limits on the Epoch of Reionization 21 cm Power Spectrum,” Astrophys. J. 925, no.2, 221 (2022) [arXiv:2108.02263].
- (76) Z. Abdurashidova et al. [HERA], “Improved Constraints on the 21 cm EoR Power Spectrum and the X-Ray Heating of the IGM with HERA Phase I Observations,” Astrophys. J. 945, no.2, 124 (2023) [arXiv:2210.04912].
- (77) H. Lazare, D. Sarkar and E. D. Kovetz, “HERA bound on X-ray luminosity weakens when accounting for Population III stars,” [arXiv:2307.15577].
- (78) A. Parsons, M. McQuinn, D. Jacobs, J. Aguirre and J. Pober, “A Sensitivity and Array-Configuration Study for Measuring the Power Spectrum of 21cm Emission from Reionization,” Astrophys. J. 753, 81 (2012) [arXiv:1103.2135].
- (79) J. C. Pober, A. R. Parsons, D. R. DeBoer, P. McDonald, M. McQuinn, J. E. Aguirre, Z. Ali, R. F. Bradley, T. C. Chang and M. F. Morales, “The Baryon Acoustic Oscillation Broadband and Broad-beam Array: Design Overview and Sensitivity Forecasts,” Astron. J. 145, 65 (2013) [arXiv:1210.2413].
- (80) J. C. Pober, A. Liu, J. S. Dillon, J. E. Aguirre, J. D. Bowman, R. F. Bradley, C. L. Carilli, D. R. DeBoer, J. N. Hewitt and D. C. Jacobs, et al. “What Next-Generation 21 cm Power Spectrum Measurements Can Teach Us About the Epoch of Reionization,” Astrophys. J. 782, 66 (2014) [arXiv:1310.7031].
- (81) M. Boylan-Kolchin, “Stress testing CDM with high-redshift galaxy candidates,” Nature Astron. 7, no.6, 731-735 (2023) [arXiv:2208.01611].
- (82) Y. Qin, A. Mesinger, S. E. I. Bosman and M. Viel, “Reionization and galaxy inference from the high-redshift Ly forest,” Mon. Not. Roy. Astron. Soc. 506, no.2, 2390-2407 (2021) [arXiv:2101.09033 [astro-ph.CO]].
- (83) Z. Li, A. Dekel, et al. “In preparation,” (2023)
- (84) V. Bromm and R. B. Larson, “The First stars,” Ann. Rev. Astron. Astrophys. 42, 79-118 (2004) [arXiv:astro-ph/0311019].
- (85) V. Bromm, “Formation of the first stars,” IAU Symp. 228, 121 (2005) [arXiv:astro-ph/0509354].
- (86) Z. Haiman, M. J. Rees and A. Loeb, “H(2) cooling of primordial gas triggered by UV irradiation,” Astrophys. J. 467, 522 (1996) [arXiv:astro-ph/9511126].
- (87) Z. Haiman, M. J. Rees and A. Loeb, “Destruction of molecular hydrogen during cosmological reionization,” Astrophys. J. 476, 458 (1997) [arXiv:astro-ph/9608130].
- (88) T. Abel, G. L. Bryan and M. L. Norman, “The formation of the first star in the Universe,” Science 295, 93 (2002) [arXiv:astro-ph/0112088].
- (89) Y. Qin, A. Mesinger, J. Park, B. Greig and J. B. Muñoz, “A tale of two sites – I. Inferring the properties of minihalo-hosted galaxies from current observations,” Mon. Not. Roy. Astron. Soc. 495, no.1, 123-140 (2020) [arXiv:2003.04442].
- (90) J. H. Wise, M. J. Turk, M. L. Norman and T. Abel, “The Birth of a Galaxy: Primordial Metal Enrichment and Stellar Populations,” Astrophys. J. 745, 50 (2012) [arXiv:1011.2632].
- (91) H. Xu, J. H. Wise, et al., “Galaxy Properties and UV Escape Fractions during the Epoch of Reionization: Results from the Renaissance Simulations,” Astrophysical Journal 833, 1 (2016) [arXiv:1604.07842].
- (92) D. Tseliakhovich and C. Hirata, “Relative velocity of dark matter and baryonic fluids and the formation of the first structures,” Phys. Rev. D 82, 083520 (2010) [arXiv:1005.2416].
- (93) S. Naoz, N. Yoshida and N. Y. Gnedin, “Simulations of Early Baryonic Structure Formation with Stream Velocity: I. Halo Abundance,” Astrophys. J. 747, 128 (2012) [arXiv:1108.5176].
- (94) N. Dalal, U. L. Pen and U. Seljak, “Large-scale BAO signatures of the smallest galaxies,” JCAP 11, 007 (2010) [arXiv:1009.4704].
- (95) D. Tseliakhovich, R. Barkana and C. Hirata, “Suppression and Spatial Variation of Early Galaxies and Minihalos,” Mon. Not. Roy. Astron. Soc. 418, 906 (2011) [arXiv:1012.2574].
- (96) M. E. Machacek, G. L. Bryan and T. Abel, “Simulations of pregalactic structure formation with radiative feedback,” Astrophys. J. 548, 509 (2001) [arXiv:astro-ph/0007198].
- (97) M. Kulkarni, E. Visbal and G. L. Bryan, “The Critical Dark Matter Halo Mass for Population III Star Formation: Dependence on Lyman–Werner Radiation, Baryon-dark Matter Streaming Velocity, and Redshift,” Astrophys. J. 917, no.1, 40 (2021) [arXiv:2010.04169].
- (98) A. T. P. Schauer, S. C. O. Glover, R. S. Klessen and P. Clark, “The influence of streaming velocities and Lyman–Werner radiation on the formation of the first stars,” Mon. Not. Roy. Astron. Soc. 507, no.2, 1775-1787 (2021) [arXiv:2008.05663].
- (99) E. Visbal, Z. Haiman, B. Terrazas, G. L. Bryan and R. Barkana, “High-redshift star formation in a time-dependent Lyman–Werner background,” Mon. Not. Roy. Astron. Soc. 445, no.1, 107-114 (2014) [arXiv:1402.0882].