22email: m.mansoury@uva.nl, 22email: {finn.duijvestijn,imane.mourabet}@student.uva.nl
Potential Factors Leading to Popularity Unfairness in Recommender Systems: A User-Centered Analysis††thanks: BNAIC/BeNeLearn Joint International Scientific Conferences on AI and Machine Learning, 2023
Abstract
Popularity bias is a well-known issue in recommender systems where few popular items are over-represented in the input data, while majority of other less popular items are under-represented. This disparate representation often leads to bias in exposure given to the items in the recommendation results. Extensive research examined this bias from item perspective and attempted to mitigate it by enhancing the recommendation of less popular items. However, a recent research has revealed the impact of this bias on users. Users with different degree of tolerance toward popular items are not fairly served by the recommendation system: users interested in less popular items receive more popular items in their recommendations, while users interested in popular items are recommended what they want. This is mainly due to the popularity bias that popular items are over-recommended. In this paper, we aim at investigating the factors leading to this user-side unfairness of popularity bias in recommender systems. In particular, we investigate two factors: 1) the relationship between this unfairness and users’ interest toward items’ categories (e.g., movie genres), 2) the relationship between this unfairness and the diversity of the popularity group in users’ profile (the degree to which the user is interested in items with different degree of popularity). Experiments on a movie recommendation dataset using multiple recommendation algorithms show that these two factors are significantly correlated with the degree of popularity unfairness in the recommendation results.
Keywords:
Recommender Systems Popularity bias Unfairness.1 Introduction
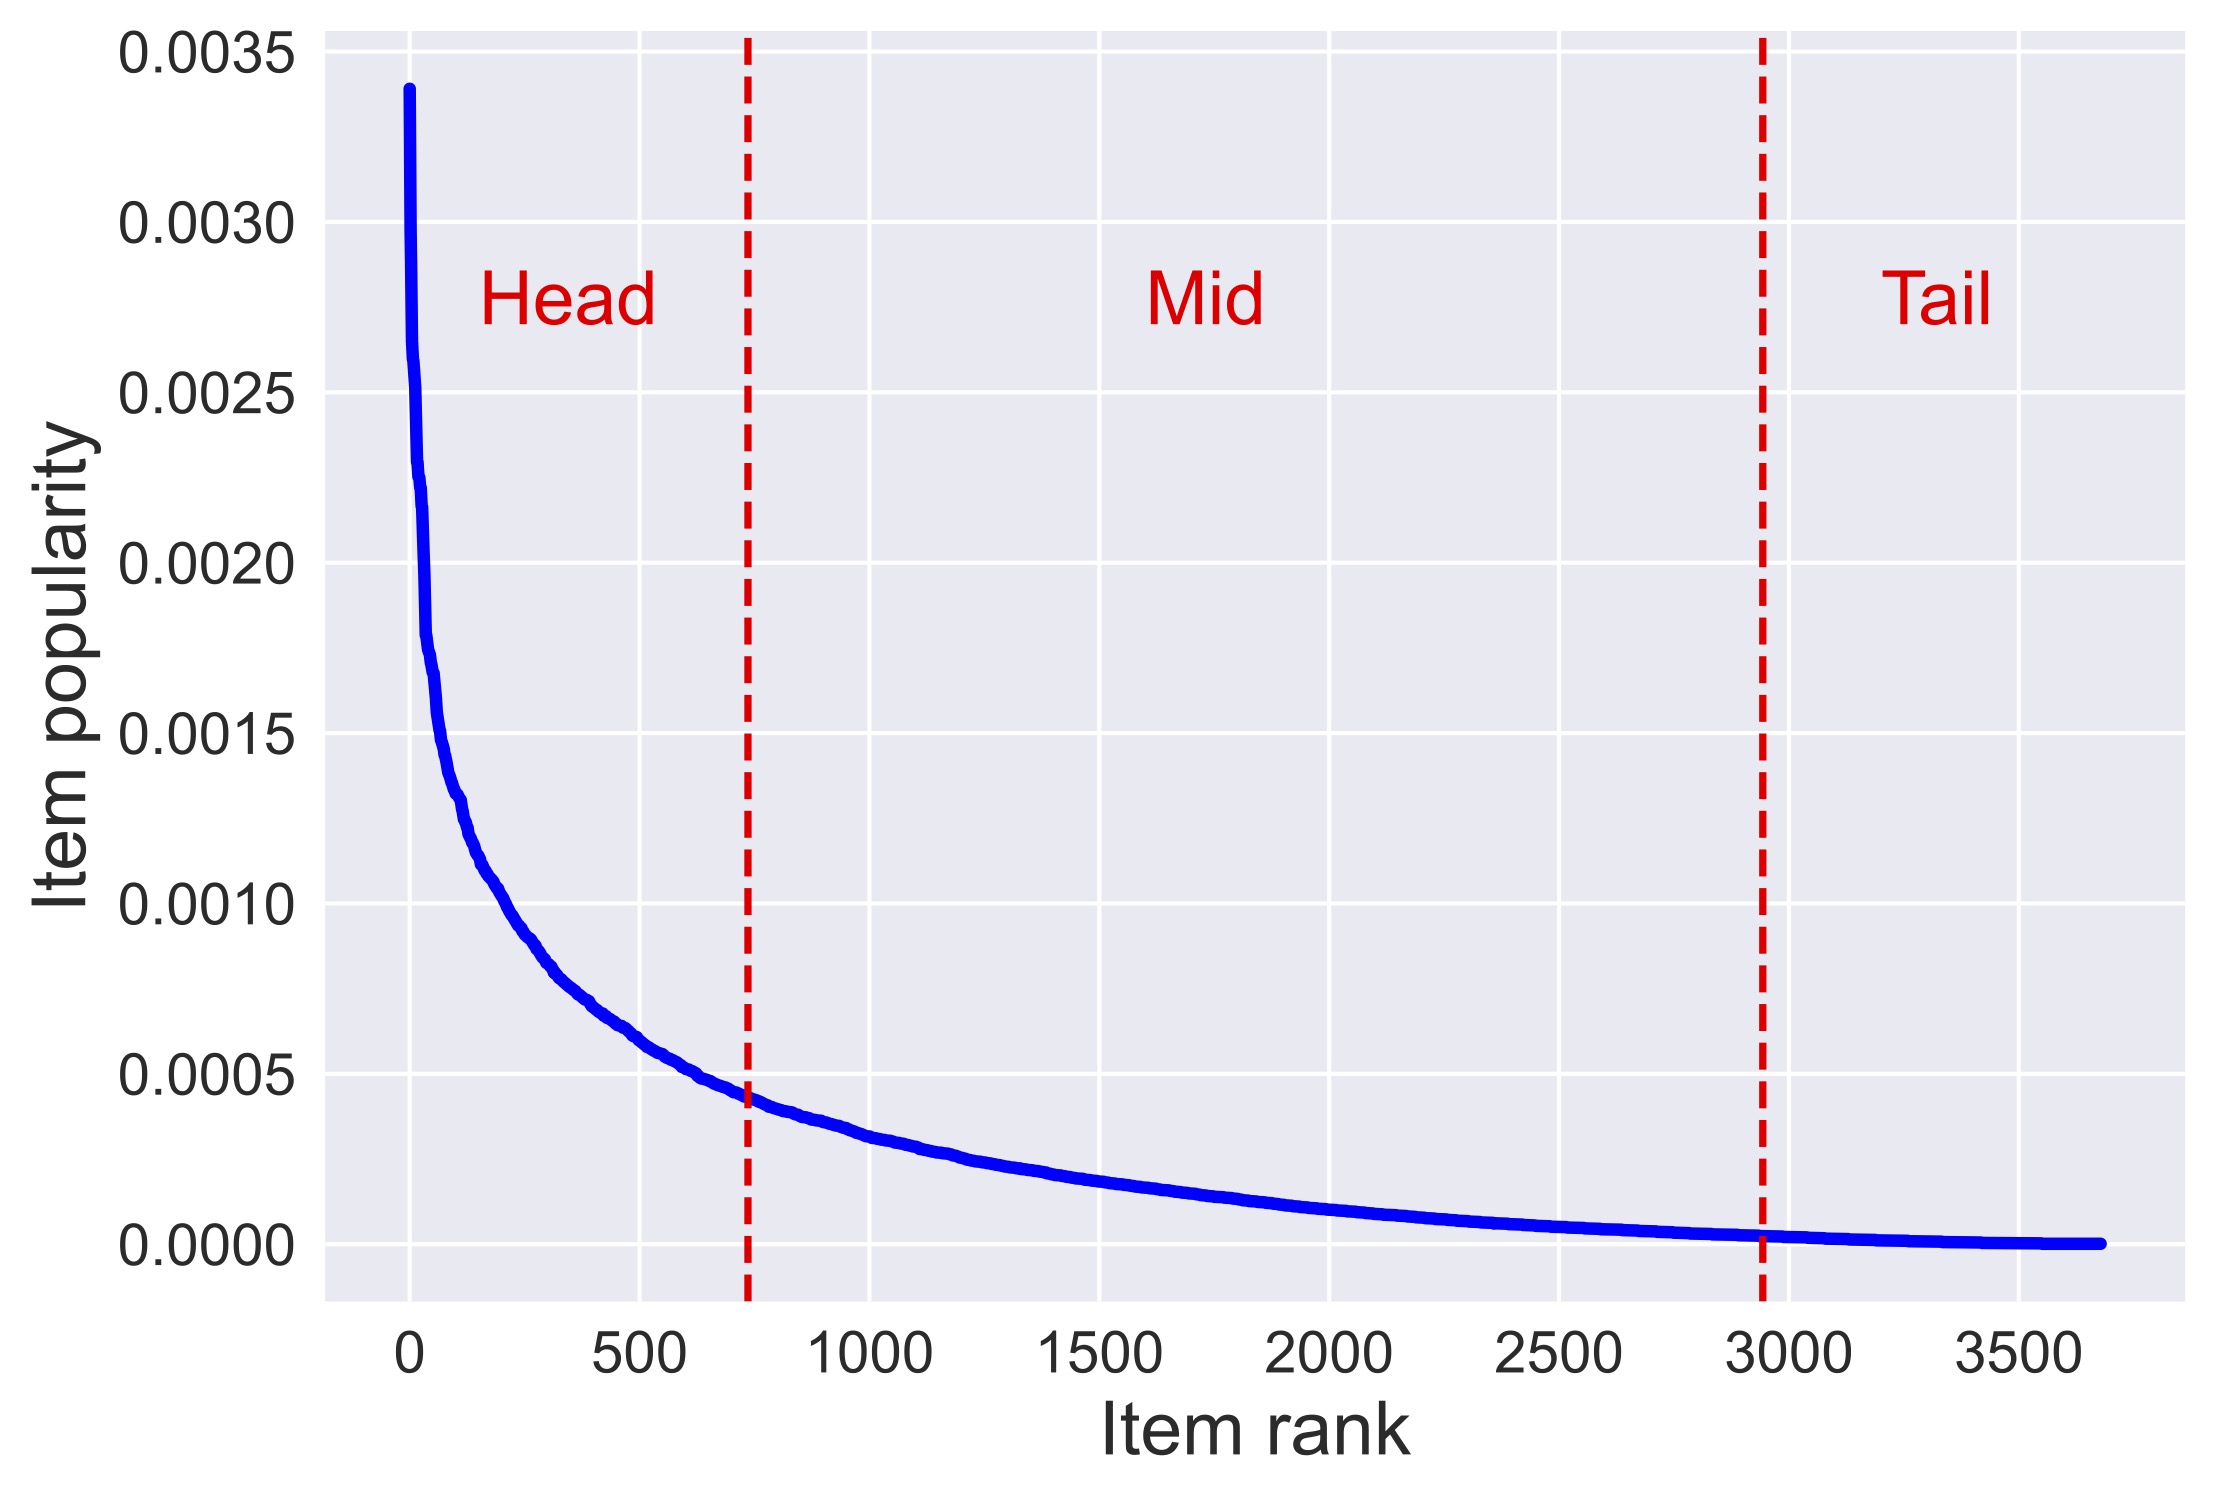
It is well-known that recommender systems suffer from popularity bias: a few popular items are over-represented in the rating data, while majority of other less items are under-represented [2, 7]. Figure 1 shows the popularity distribution of the items in MovieLens dataset. As shown, a few items with high rating frequency dominate the entire rating history. For instance, 44 most popular items (around 1%) make up more than 10% of the interactions.
This bias, if not mitigated, leads to exposure bias [13, 12] where popular items are over-recommended, while unpopular items are under-recommended in the recommendation results. This unfairness in the representation of items in the recommendation lists also leads to unfairness against suppliers who provided those items in the system [1, 25, 15]. Also, due to the feedback loop phenomena in which users profiles get updated over time via potentially biased recommendations, popularity bias can be amplified over time [14, 23, 18]. Mansoury et al. in [14] showed that in long run, as users interact with the system, amplification of popularity bias not only intensifies the unfairness, but also degrades the performance of the recommendations.
Most existing works study the popularity bias from the aforementioned item perspective [19, 27, 24]. Various algorithms are developed to mitigate this bias by promoting less popular items, known as long-tail, in the recommendation results to compensate for their under-recommendation and increase their visibility [6, 26, 28]. For example, Zhu et al. in [28] proposed the idea of popularity compensation as a post-processing approach that adjusts the predicted scores for items according to their popularity: increasing the score for less popular items to promote them in the recommendation list; Abdollahpouri et al. in [2] proposed an in-processing approach that mitigates the popularity bias by incorporating a regularization term into the objective function. While these algorithms effectively mitigate item-side popularity bias, they ignore the user-centered impact of popularity bias.
Recent research has shown that recommendation models fail to properly follow the users’ interest toward popular items [4, 5]. Abdollahpouri et al. in [4] demonstrated that popularity bias can lead to unfairness among users. They showed that users differ in their interest toward popular items: some users have high interest to popular items (blockbuster-focused), while some users have high interest to less popular items (niche-focused). Due to the popularity bias in input data and over-recommendation of these items in the recommendation results, these user groups are unfairly treated. This means that the impact of popularity bias is not equal across users belonging to different groups. Niche-focused users, while are interested in less popular items, receive popular items in their recommendation list, leading to a larger impact on these users.
The same patterns were found later by Kowald et al. [10] on the music domain where users with a lesser interest in mainstream songs were impacted more severely by the popularity bias. These findings showed that popularity bias impacts different users differently and hence it is important to take users into account when mitigating this bias. To address this issue, abdollahpouri et al. in [5] proposed the idea of popularity calibration, a post-processing approach, that generates the recommendations to be approximately matched or calibrated with the interest of users toward popularity spectrum in their profile.
In this paper, we base our analysis on findings in [4, 5] and aim at investigating the potential factors that lead to user-centered unfairness of popularity bias. We in particular investigate two factors: 1) the impact of genre popularity on this popularity unfairness, 2) the impact of popularity diversity, the diversity of users’ profile in terms of their interest to various item groups (e.g., popular and unpopular), on the degree of this user-centered popularity unfairness. Experiments on a real-world dataset show that our identified factors are highly correlated with the degree of unfairness in recommendation results, suggesting ideas for future research to alleviate this unfairness against users.
2 The unfairness of popularity bias
Throughout the paper, we use MovieLens 1M dataset [8] for our analysis. In this dataset, 6,040 users provided 1,209,000 ratings on 3,706 items (movies). Each item is associated with one or more genres and there are in total 18 different genres in the dataset. Figure 1 shows the popularity distribution of MovieLens dataset. Vertical axis shows the popularity of the items and horizontal axis shows the items sorted by their popularity value in descending order. It is evident that the distribution is long-tailed and the data heavily suffers popularity bias.
In this long-tail distribution, we define popular items, also referred to as Head items (H), as the top 20% of most popular items (items frequently interacted in the rating data). The rest of the less popular items are often referred to as long-tail items and can be further divided into: Tail items (T) as the top 20% of the least popular items (items rarely interacted in the rating data), and Mid items (M) are the ones in between that includes 60% of the rest of the items.
Following the findings in [4], popularity bias in rating data leads to discrimination against users: users interested to popular items are much better served by the recommender systems than the ones interested in less popular items. In other words, users interested in less popular items, while expected to get unpopular items in their recommendation lists, receive more popular items as the recommendation. In the following section, we briefly review this issue.
2.1 User grouping in terms of propensity to item popularity
We group users based on their interest toward popular items. Users can be mostly interested in either popular items, unpopular items, or items in the middle of popularity spectrum. Hence, we define three groups of users:
-
•
Blockbuster-focused users: Users with interest to popular items.
-
•
Diverse taste users: Users with diverse interest toward both popular and less popular items.
-
•
Niche-focused users: Users with interest to less popular items.
Given users’ profile with items they interacted with, we first derive the ratio of H, M, and T items in their profile. For example, if a user interacted with 7 items in H, 2 items in M, and 1 item in T, then the ratios for H, M, and T in her profile would be 0.7, 0.2, 0.1, respectively. Then, we follow this process for grouping the users: 1) extract 20% of the users with the highest ratio of T items in their profile to form Niche group (i.e., sort the users based on the ratio of T items in descending order and return top 20%), 2) extract 20% of the users with the highest ratio of H in their profile to form Blockbuster group (i.e., sort the users based on the ratio of H items in descending order and return top 20%), 3) and finally, extract users who are neither in niche-focused nor in blockbuster-focused groups to form Diverse group.
2.2 Evaluation metrics
For measuring the degree of popularity unfairness in the recommendation results, we use metrics introduced in [3, 4, 5].
Popularity Lift (PL): This is a measure of popularity amplification of recommendation list delivered to the user with respect to the popularity of her profile. We denote as the Average Profile Popularity of user ’s profile and as the Average Recommendation Popularity of ’s recommendations, both computed as
where returns the popularity of item as fraction of interactions on , is the items that interacted, and is the items recommended to . Thus, PL of user is computed as
| (1) |
Positive value for PL signifies that the recommendation list of a user is on average more popular than his profile, while negative value indicates that the user’s profile is on average more popular than her recommendation list. However, means no popularity amplification or degradation which is more desired. We further define the popularity lift for a group as where and .
User Popularity Deviation (UPD): This is a measure of popularity miscalibration [5] in the recommendation results. In other words, given and as the ratio of each item group in ’s profile and recommendation list, respectively, calculates the distance between and , indicative of how well is calibrated with respect to . For example, if a user’s profile represents the ratios of for , a recommendation list is considered to be perfectly calibrated (i.e., ) if it also consists of the same ratios. Given , we calculate the propensity of each user towards each item group in her profile as:
| (2) |
and the ratio of each item group in her recommendation as:
| (3) |
Thus, we define and . Now, we calculate as:
| (4) |
where is Jensen–Shannon divergence [11] between and which measures the statistical distance between two probability. Similar to , we calculate for a group (e.g., Niche) as the average of all users belonging to .
2.3 Experimental setup
For experiments, we split the users’ profile in MovieLens dataset into 80% as training set and 20% as test set. The training set is used to build the recommendation model and generating the recommendations for each user. The test set is used for evaluating the performance of the recommendations. We perform the experiments using the following recommendation algorithms: Bayesian Personalized Ranking (BPR) [20], Biased Matrix Factorization (BiasedMF) [9], User-based Neighborhood Model (UserKNN) [21], and Item-based Neighborhood Model (ItemKNN) [22]. We also use two non-personalized algorithms: most popular item recommendation (Popular) and random item recommendation (Random). We tune each algorithm by performing a grid-search over the hyperparameter space and reporting the best-performing results in terms of precision, recall, and ranking quality (nDCG) of the recommendations. In recommendation generation, a recommendation list of size 10 is generated for each user. We use Librec-Auto [17] for running our experiments.
| algorithms | |||
|---|---|---|---|
| BPR | 0.183 | 0.072 | 0.184 |
| BiasedMF | 0.108 | 0.039 | 0.111 |
| ItemKNN | 0.315 | 0.130 | 0.310 |
| UserKNN | 0.243 | 0.095 | 0.243 |
| Popular | 0.186 | 0.068 | 0.185 |
| Random | 0.009 | 0.003 | 0.007 |
2.4 Experimental results
Table 1 presents the performance of the recommendation models based on accuracy metrics. These results suggest that the models are accurate (reliable) enough to be used for the rest of analysis in this paper.
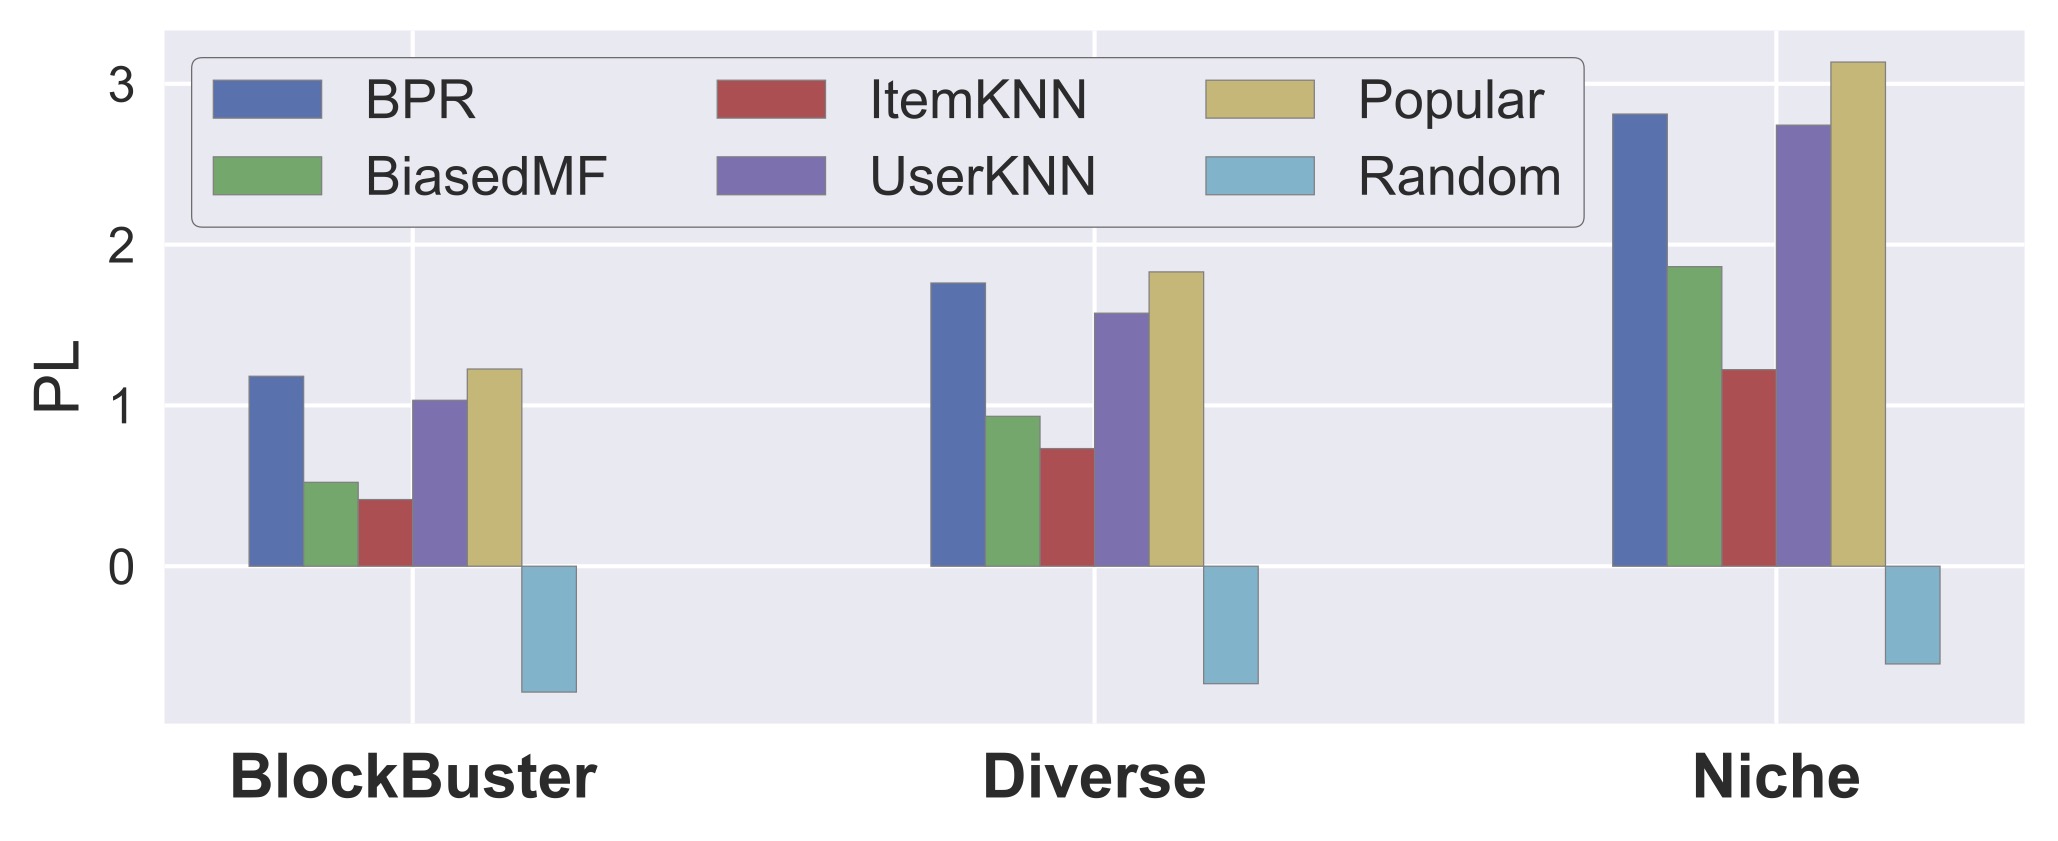
Figure 2 shows the PL of the recommendation models for each group of users. Note that the goal here is not to compare the recommendation models, but instead to compare the performance of each recommendation model across different groups of users. As shown, all recommendation models (except Random) consistently reveal this pattern: . This indicates that users in Niche-focused group are getting worst recommendation in terms of their interest toward popular items, and users in Blockbuster-focused group are served the best (lowest ).
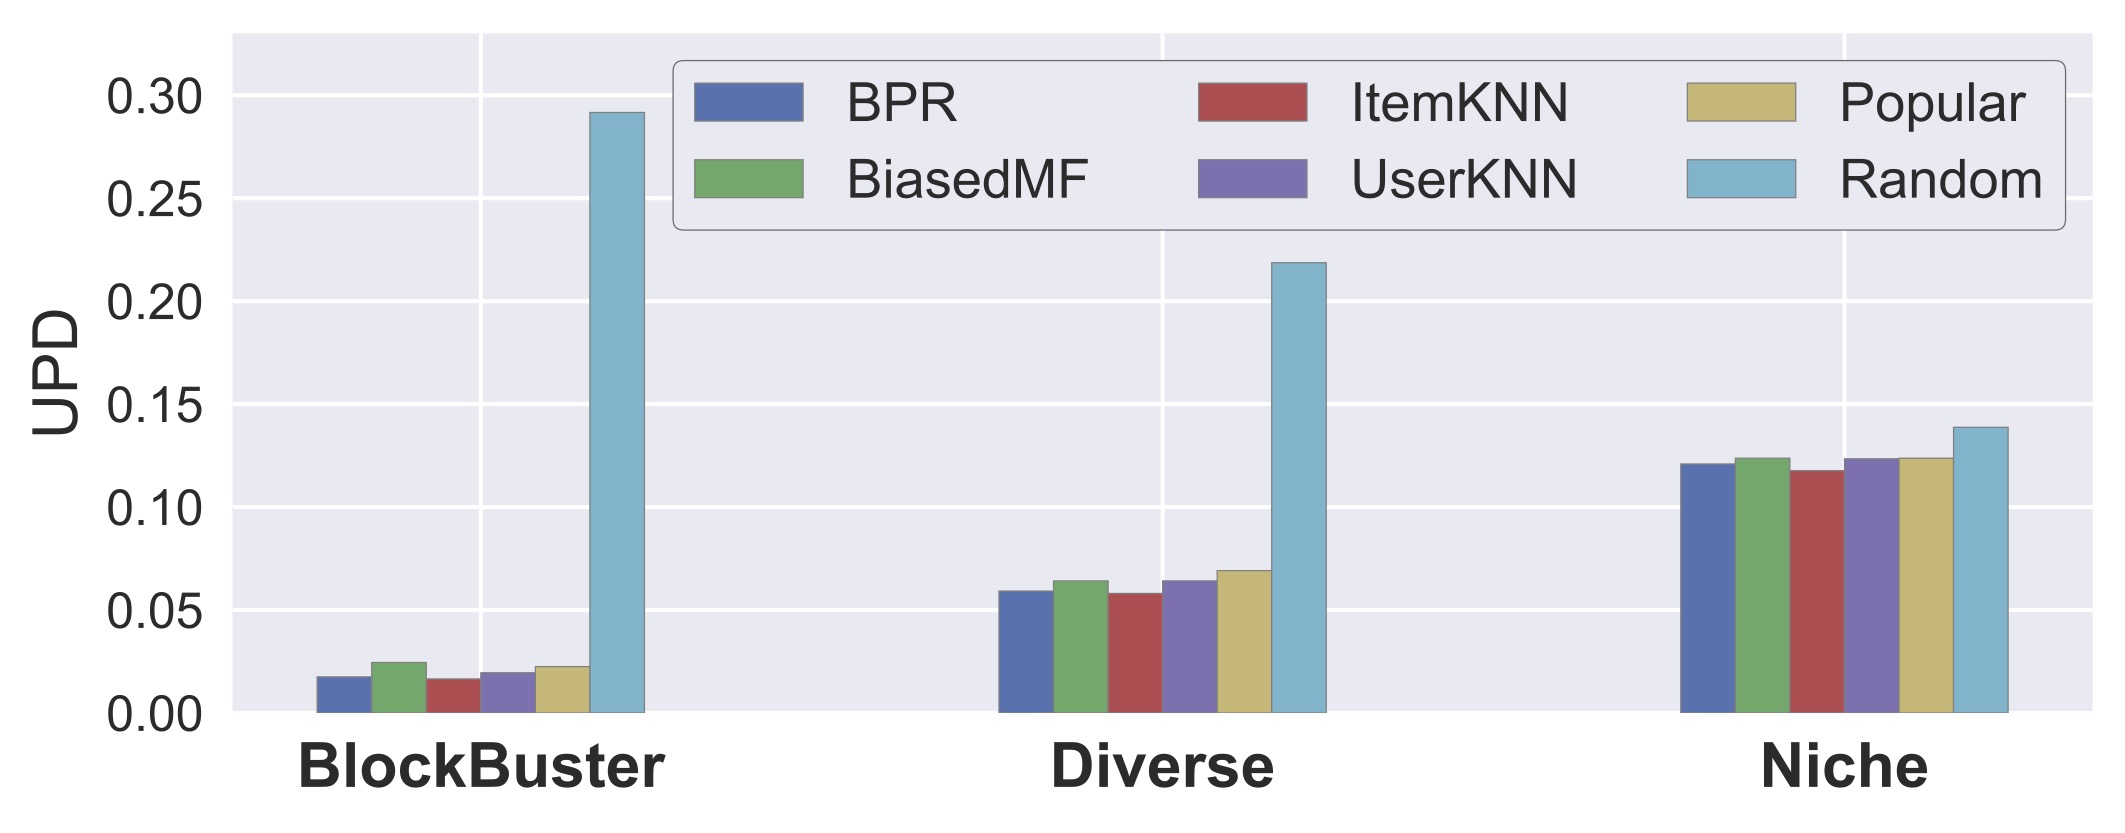
Figure 3 shows the performance of recommendation models in terms of across different groups of users. Similarly, of Niche-focused group is the highest, while it is the lowest for Blockbuster-focused group (except for Popular). This shows that the recommendation models do not consistently follow the popularity interest of different users, indicative of the user-side unfairness.
3 Profile Inconsistency: propensity for genre popularity vs. item popularity
3.1 Genre popularity
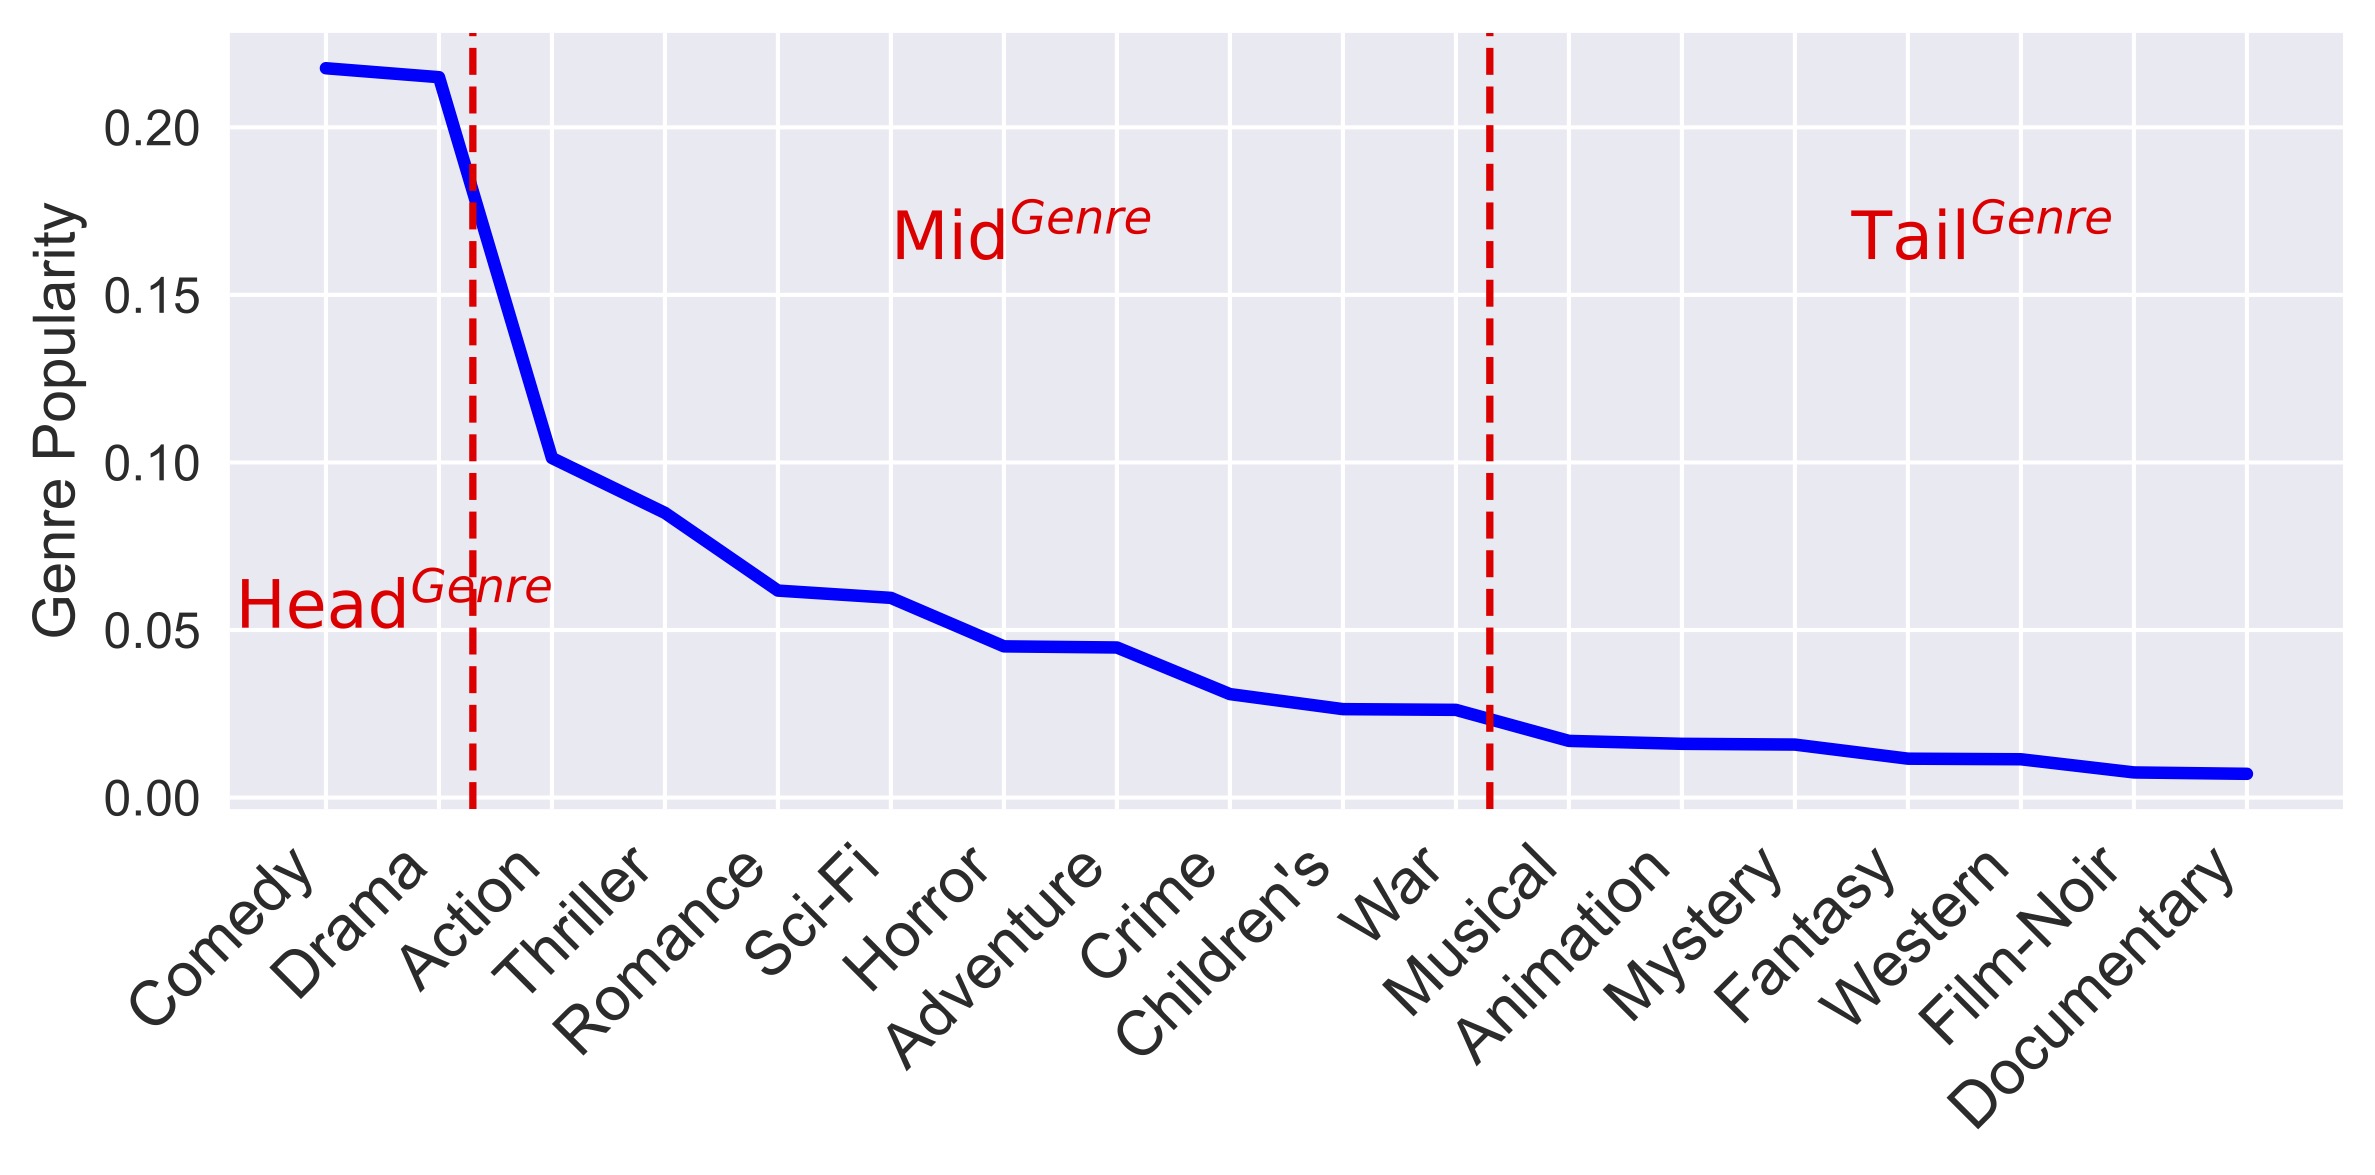
Figure 4 shows the distribution of genre popularity in MovieLens dataset. Since movies are assigned multiple genres, we equally distribute the interaction on a movie to its genres. For example, if a movie is assigned Action and Drama genres, for computing the genre popularity, we count the interaction on this movie for its genres as 0.5 for Action and 0.5 for Drama. Analogous to the distribution of item popularity, the distribution of genre popularity is long-tailed, meaning that a few genres (Comedy and Drama) make up more than 40% of the interactions in the rating data.
We perform the same process described in section 2 for grouping the genres and the users in terms of genre popularity. For grouping the genres, we define the most popular genres as , the least popular genres as , and the rest of the genres as . These genre groups are shown in Figure 4. For grouping the users, we follow the process described in section 2.1. We first extract 20% of users with the highest interest to genres in to form . Then, among the rest of the users, we extract 20% of them with highest interest to to create . Finally, we form group with the rest of the users. To distinguish item and genre grouping in this section, we refer to item grouping as , , and . We also refer to item-based user groups (section 2.1) as , , and .
3.2 The relationship between the propensity to item popularity and genre popularity
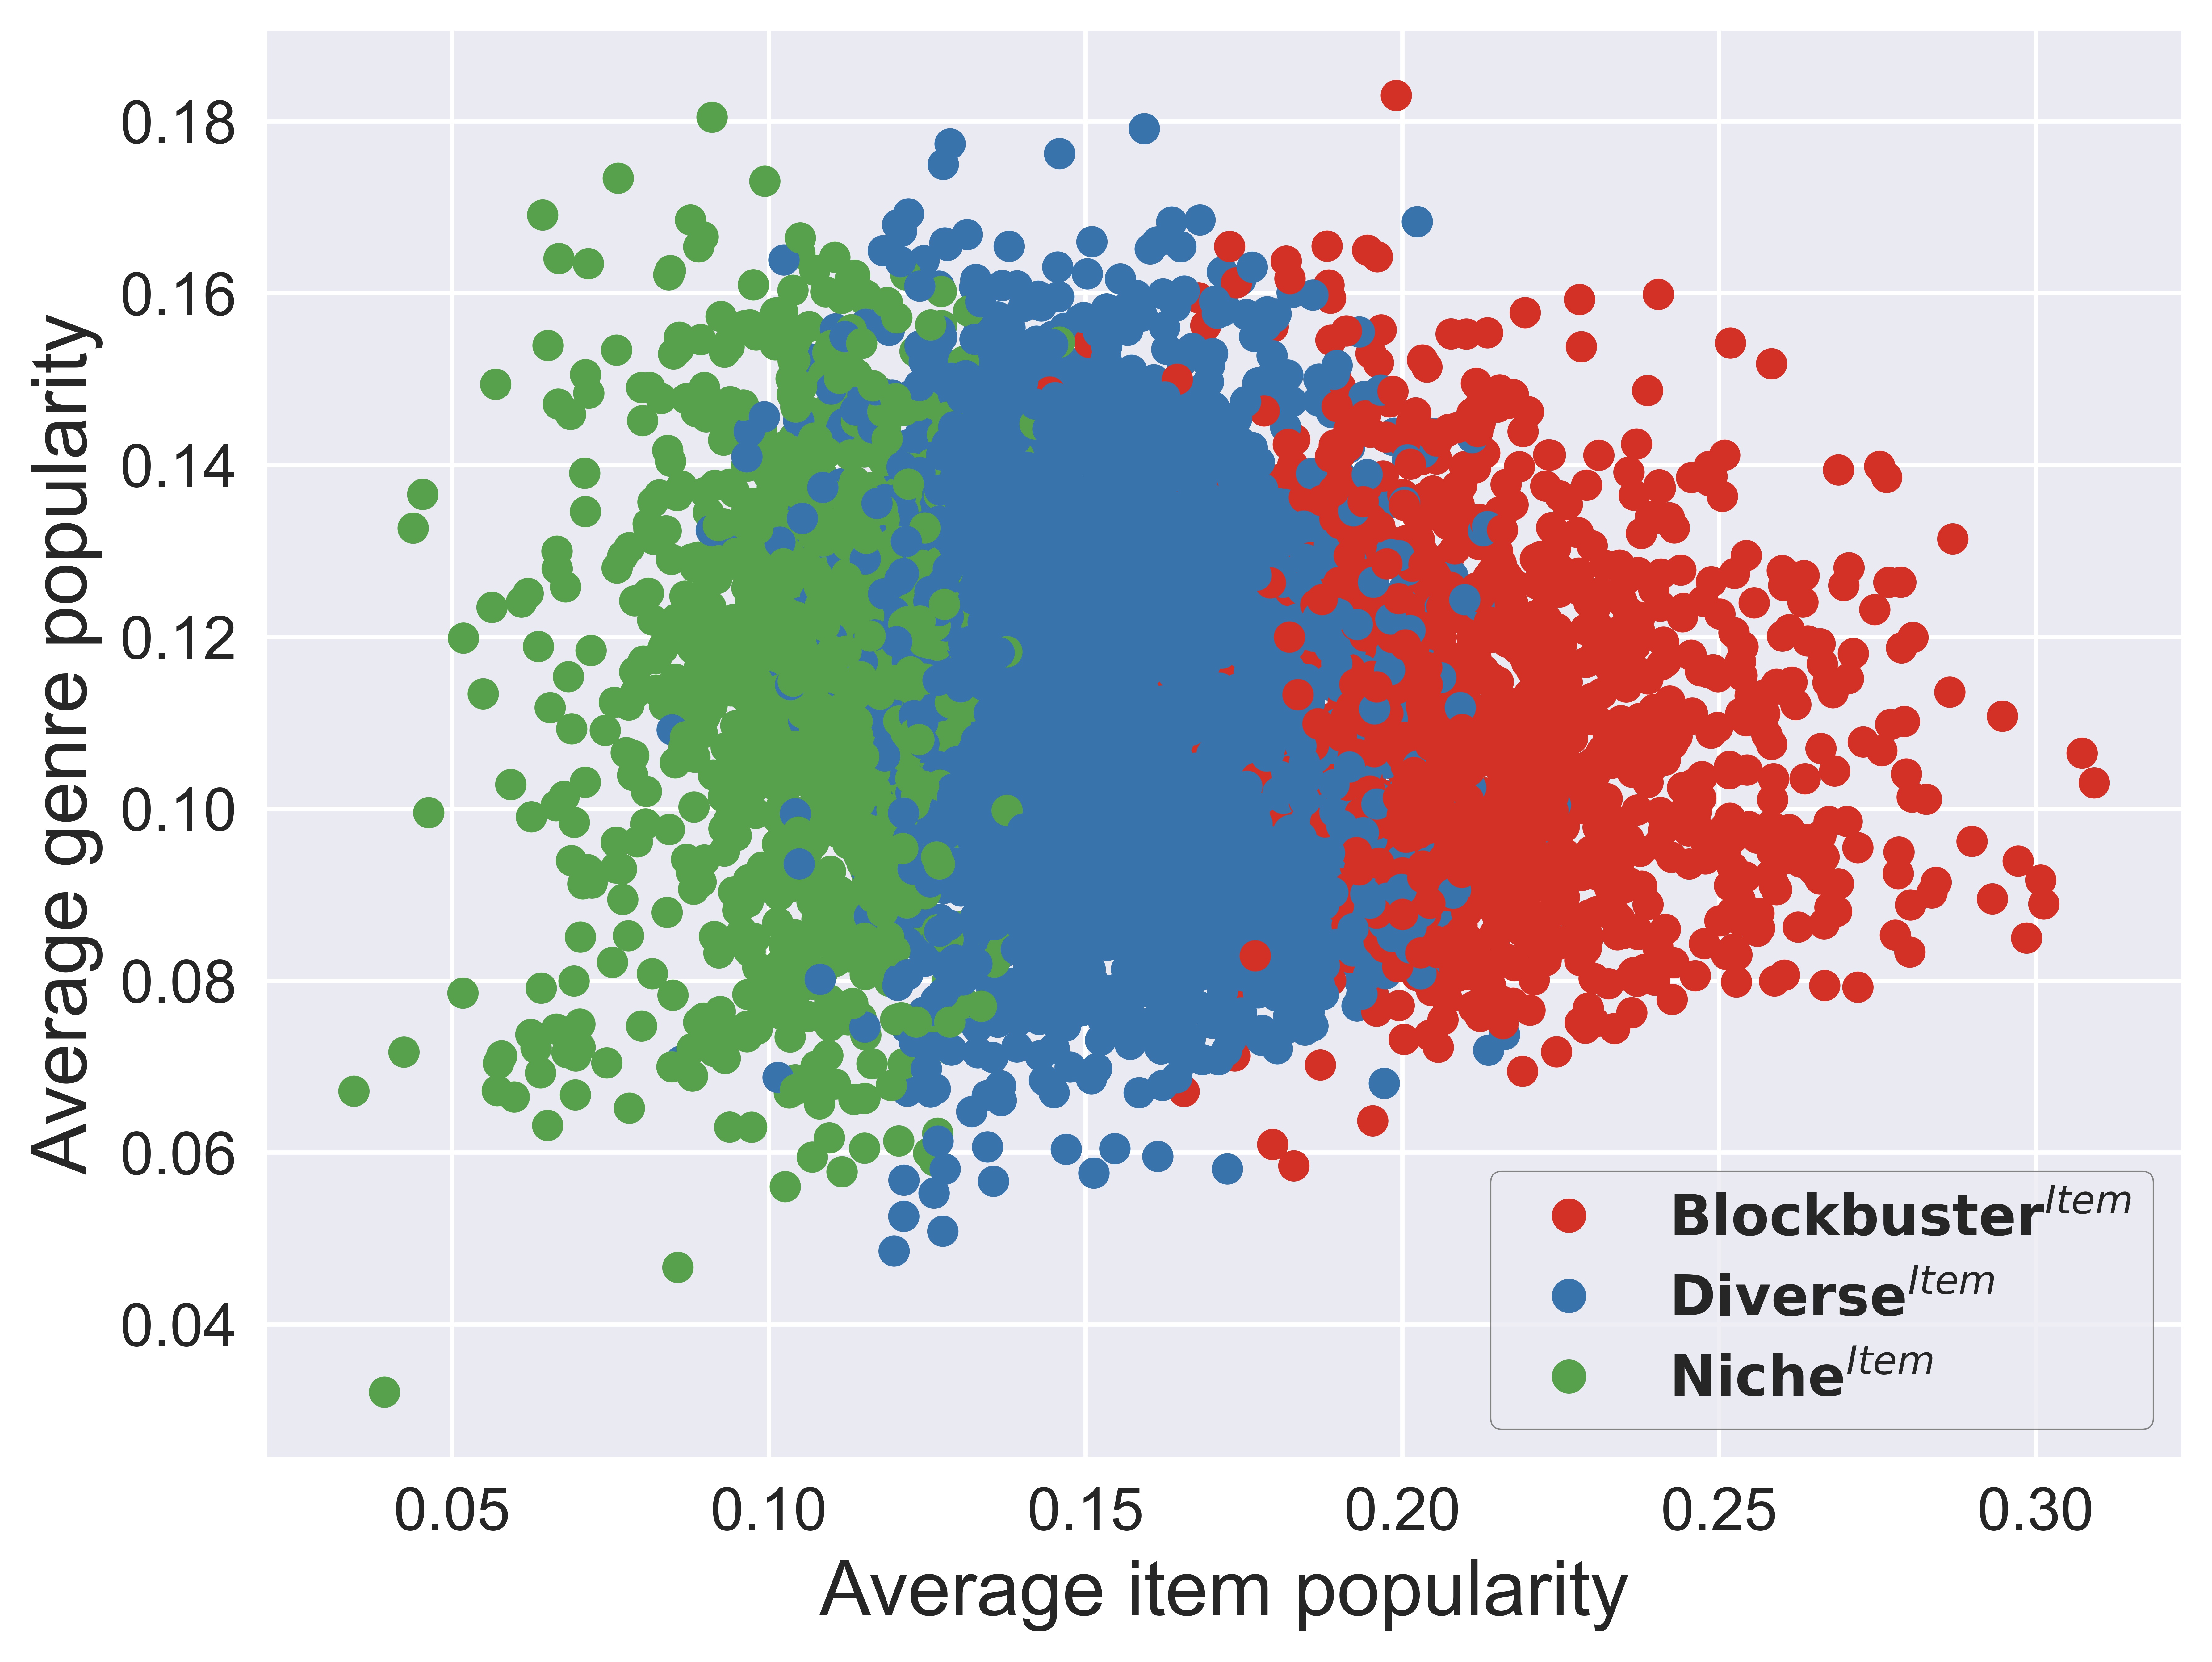
Figure 5 shows the relationship between the average item popularity and average genre popularity of each user’s profile. Each point in the plot represents a user, x-axis represents its average item popularity, and y-axis represents its average genre popularity. As shown, there is no correlation between users’ interest toward item popularity and genre popularity. This indicates that in terms of item popularity, a user might be interested in popular items, while in terms of genre popularity, she might be interested in unpopular genres. Therefore, this finding gives us clue for further investigation on utilizing genre information to alleviate the unfairness against Niche-focused users.
3.3 The impact of genre popularity on disparate treatment
Given , , and as user groups based on users interest toward genre popularity (described in section 3.1), the goal in this section is to reproduce the results in section 2.4 for these user groups. Figure 6 shows the of recommendation models for the genre-based users’ groups. Again, the aim is not to compare the performance of recommendation models, but instead to compare the behavior of a recommendation model across different groups of users.
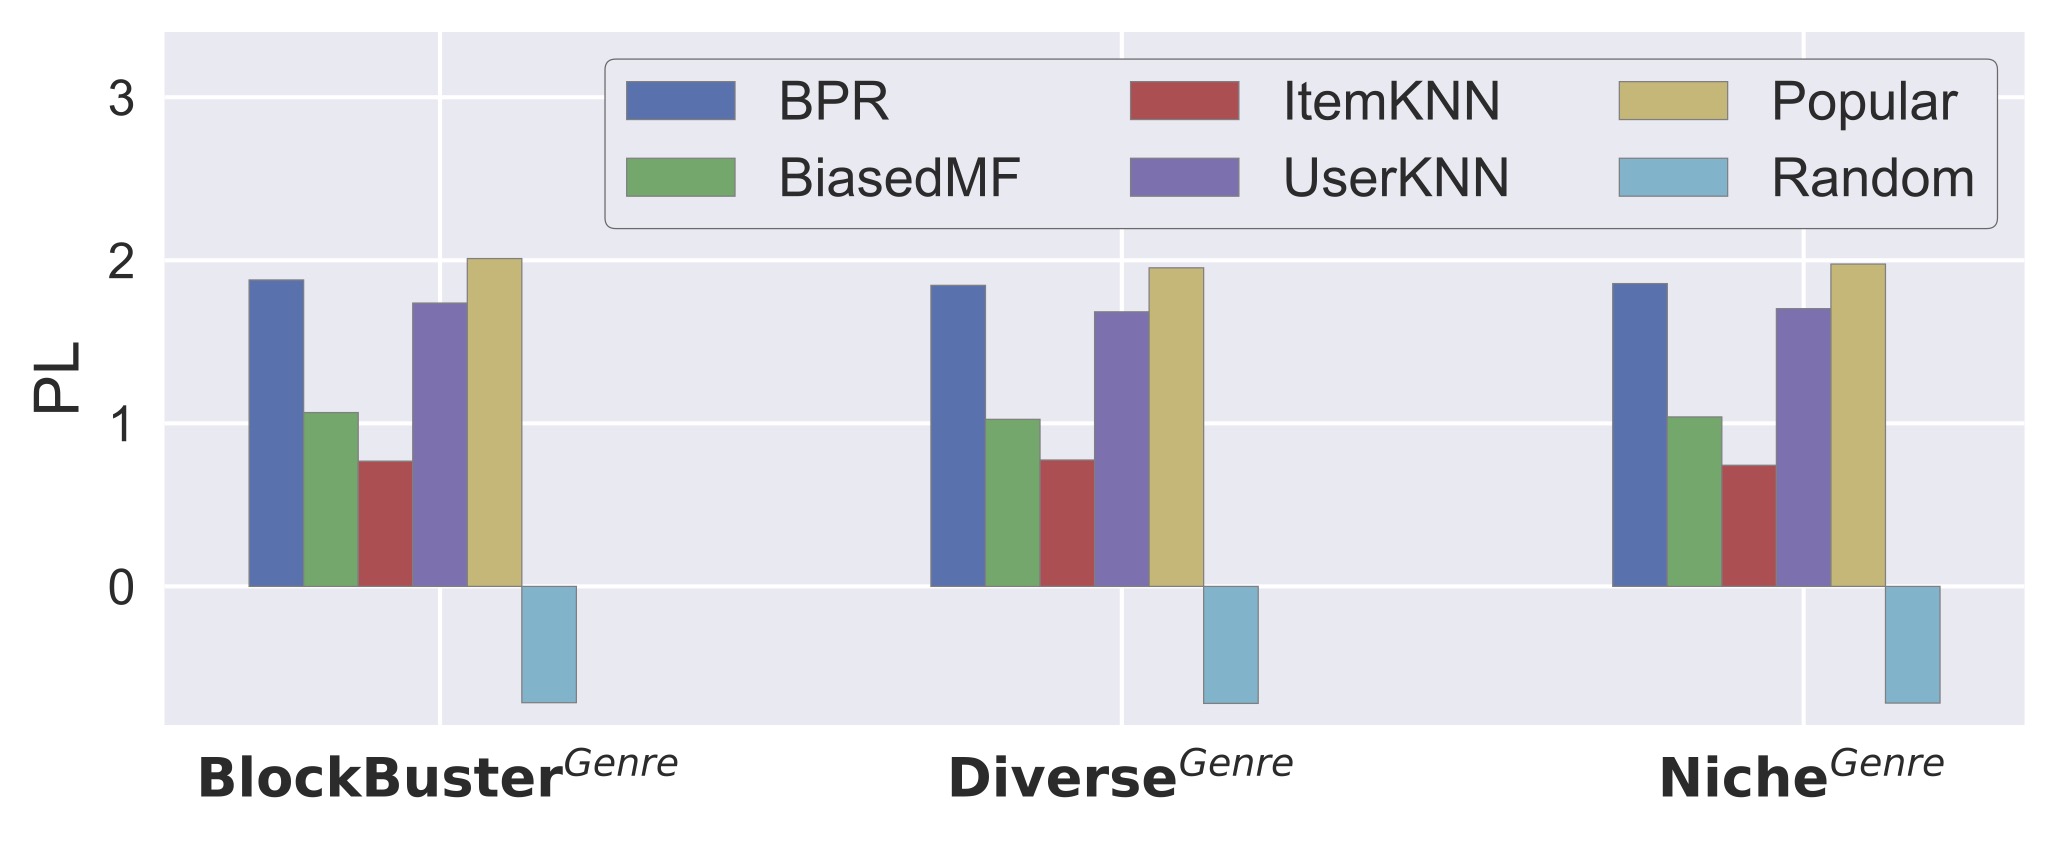
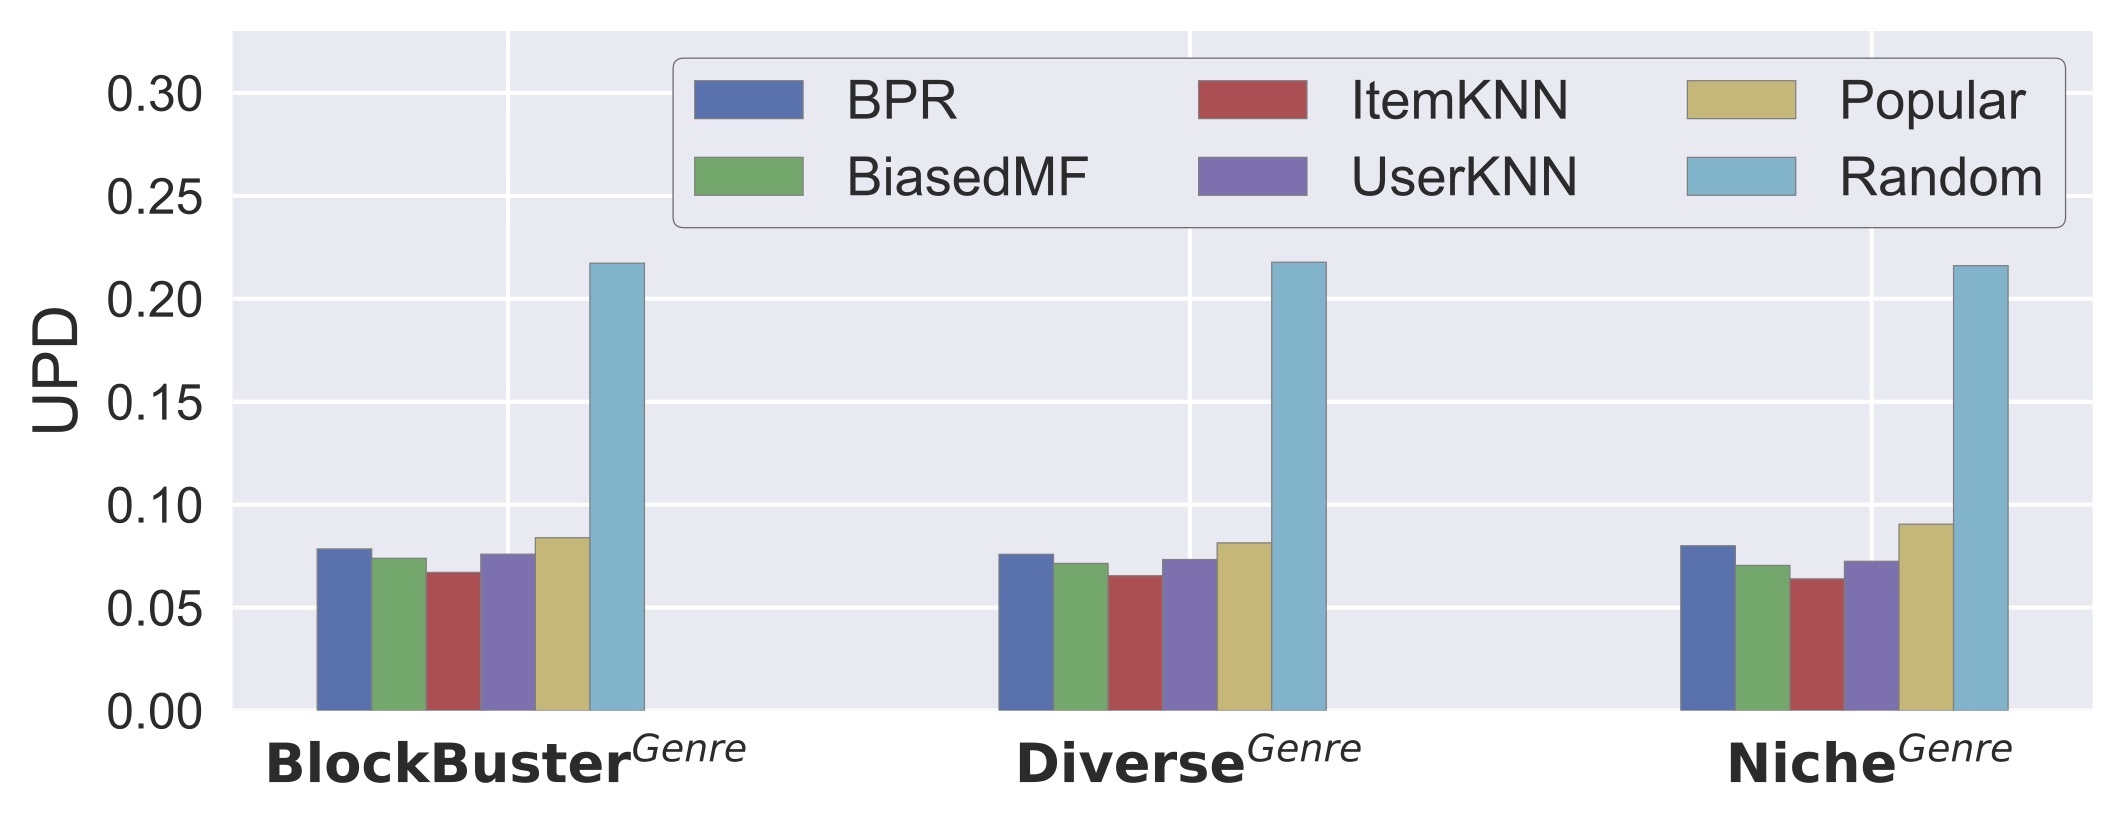
Unlike the results obtained for item-based user groups in Figure 2, Figure 6 shows no unfairness among different groups of users. This means that niche-focused users are equally served as blockbuster-focused users by different recommendation models. The same pattern can also be observed in terms of in Figure 7.
3.4 Profile inconsistency
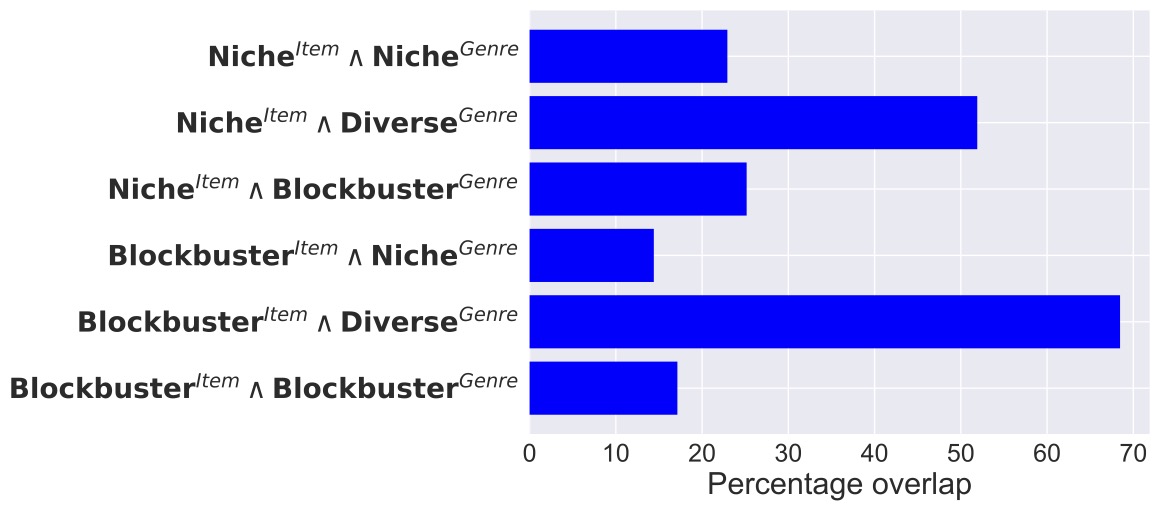
Given the finding in section 3.3, we are interested in investigating how much the user groups created based on item popularity (section 2.1) match those based on genre popularity (section 3.1). We define the percentage of overlap between group and as where is the intersection of and .
Figure 8 shows the percentage of overlap between item-based and genre-based user groups. First, it shows that the main overlap happens with group which can be expected as it is the group close to both Niche and Blockbuster. Comparing with genre-based users’ groups, only around 23% of users in are also in , but surprisingly around 25% of users in are in . Similarly, comparing with genre-based user groups, it shows that around 17% and 14% of users in are in and , respectively.
With observations from Figure 8, we define profile inconsistency as the degree to which the item popularity of a user’s profile does not match its genre popularity. Thus, we first define a binary function that returns 1 if ’s group is inconsistent with its genres’ groups. For example, for in , we say is consistent () if it only belongs to , otherwise we say is inconsistent (). Now, we define the profile inconsistency () of each user as follows:
| (5) |
computes the ratio of the inconsistent items that user interacted with. Lower implies that a user’s interest toward popularity spectrum (either popular or less popular) is stronger, meaning that the items interacted with and their genres are in the same popularity group. On the other hand, higher indicates that assigned group to is not sufficiently reliable and might also have certain degree of interest toward other groups.
Now, the question is: do the recommendation models behave fairer for consistent users? To answer this question, among users in , we look at the degree of unfairness for those users who their is lower than a threshold. Given a threshold , we extract users who their is less than and then we report their average and . The reason we only look at is that this group is the protected group in our analysis and the group experiencing the highest disparity in the recommendation results.
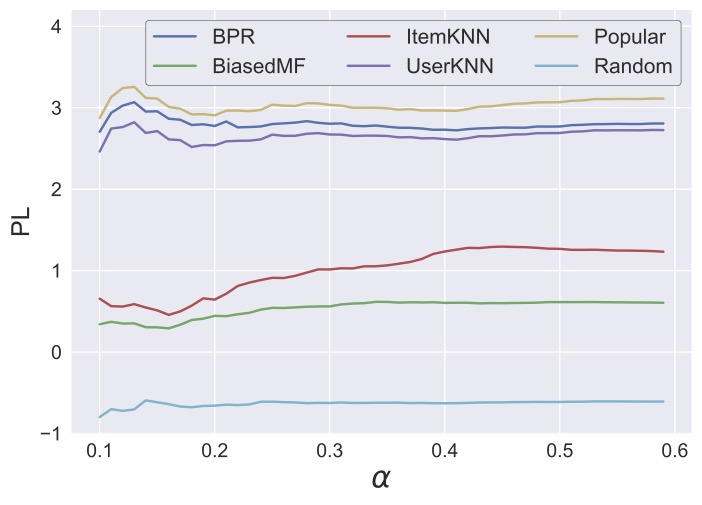
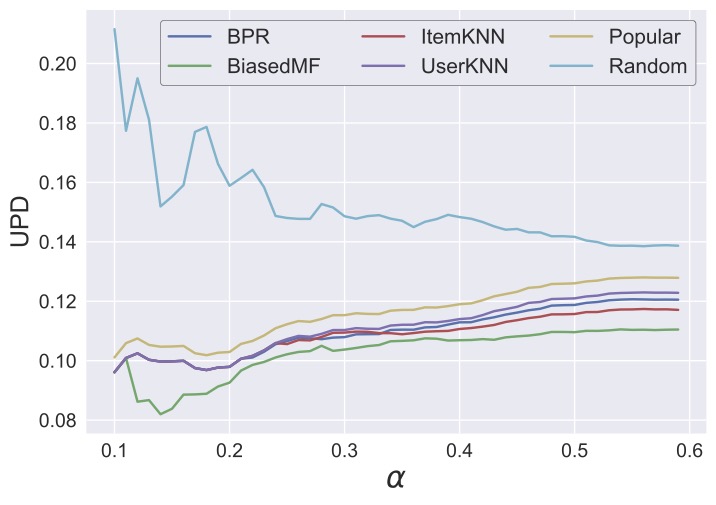
Figure 9 shows the of the recommendation models for a subset of users in with for . The results show that of factorization models (BPR and BiasedMF) slightly improve for more consistent users and as increases (more inconsistent users are included), also increases (higher disparity). This pattern cannot be observed for neighborhood models (UserKNN and ItemKNN). However, this pattern is stronger for across all algorithms as shown in Figure 10. In all recommendation models (except Random), with increasing (more inconsistent users), also increases. These results suggest ideas for improving the fairness of the recommendations using genre information: incorporating the genre information when generating recommendations, particularly for users with high profile inconsistency.
4 Popularity Diversity of users profile
The second factor that we investigate is the popularity diversity of the users’ profile and we aim at showing how correlated this factor is with the ability of the recommendation model to follow the users’ interest toward popularity spectrum. Popularity diversity refers to the fact that how interacted items in a user’s profile are from diverse item groups. For example, a profile with items from is considered to be more diverse than a profile with items from as it covers more diverse sets of item groups. Therefore, if a user’s profile has lower popularity diversity, it can be interpreted as more focused the user is in interacting with the items. For example, when a user only interacted with items, it means that he/she has high concentration on popular items and his/her profile would result in low popularity diversity.
For computing the popularity diversity of a user’s profile, we first extract the item groups corresponding to the interacted items and then, we compute entropy on the vector of extracted item groups. This way, a profile where every interacted item belongs to one item group would result in the lowest entropy and consequently the lowest popularity diversity. And vice versa, a profile where interacted items belong to various item groups would represent higher popularity diversity.
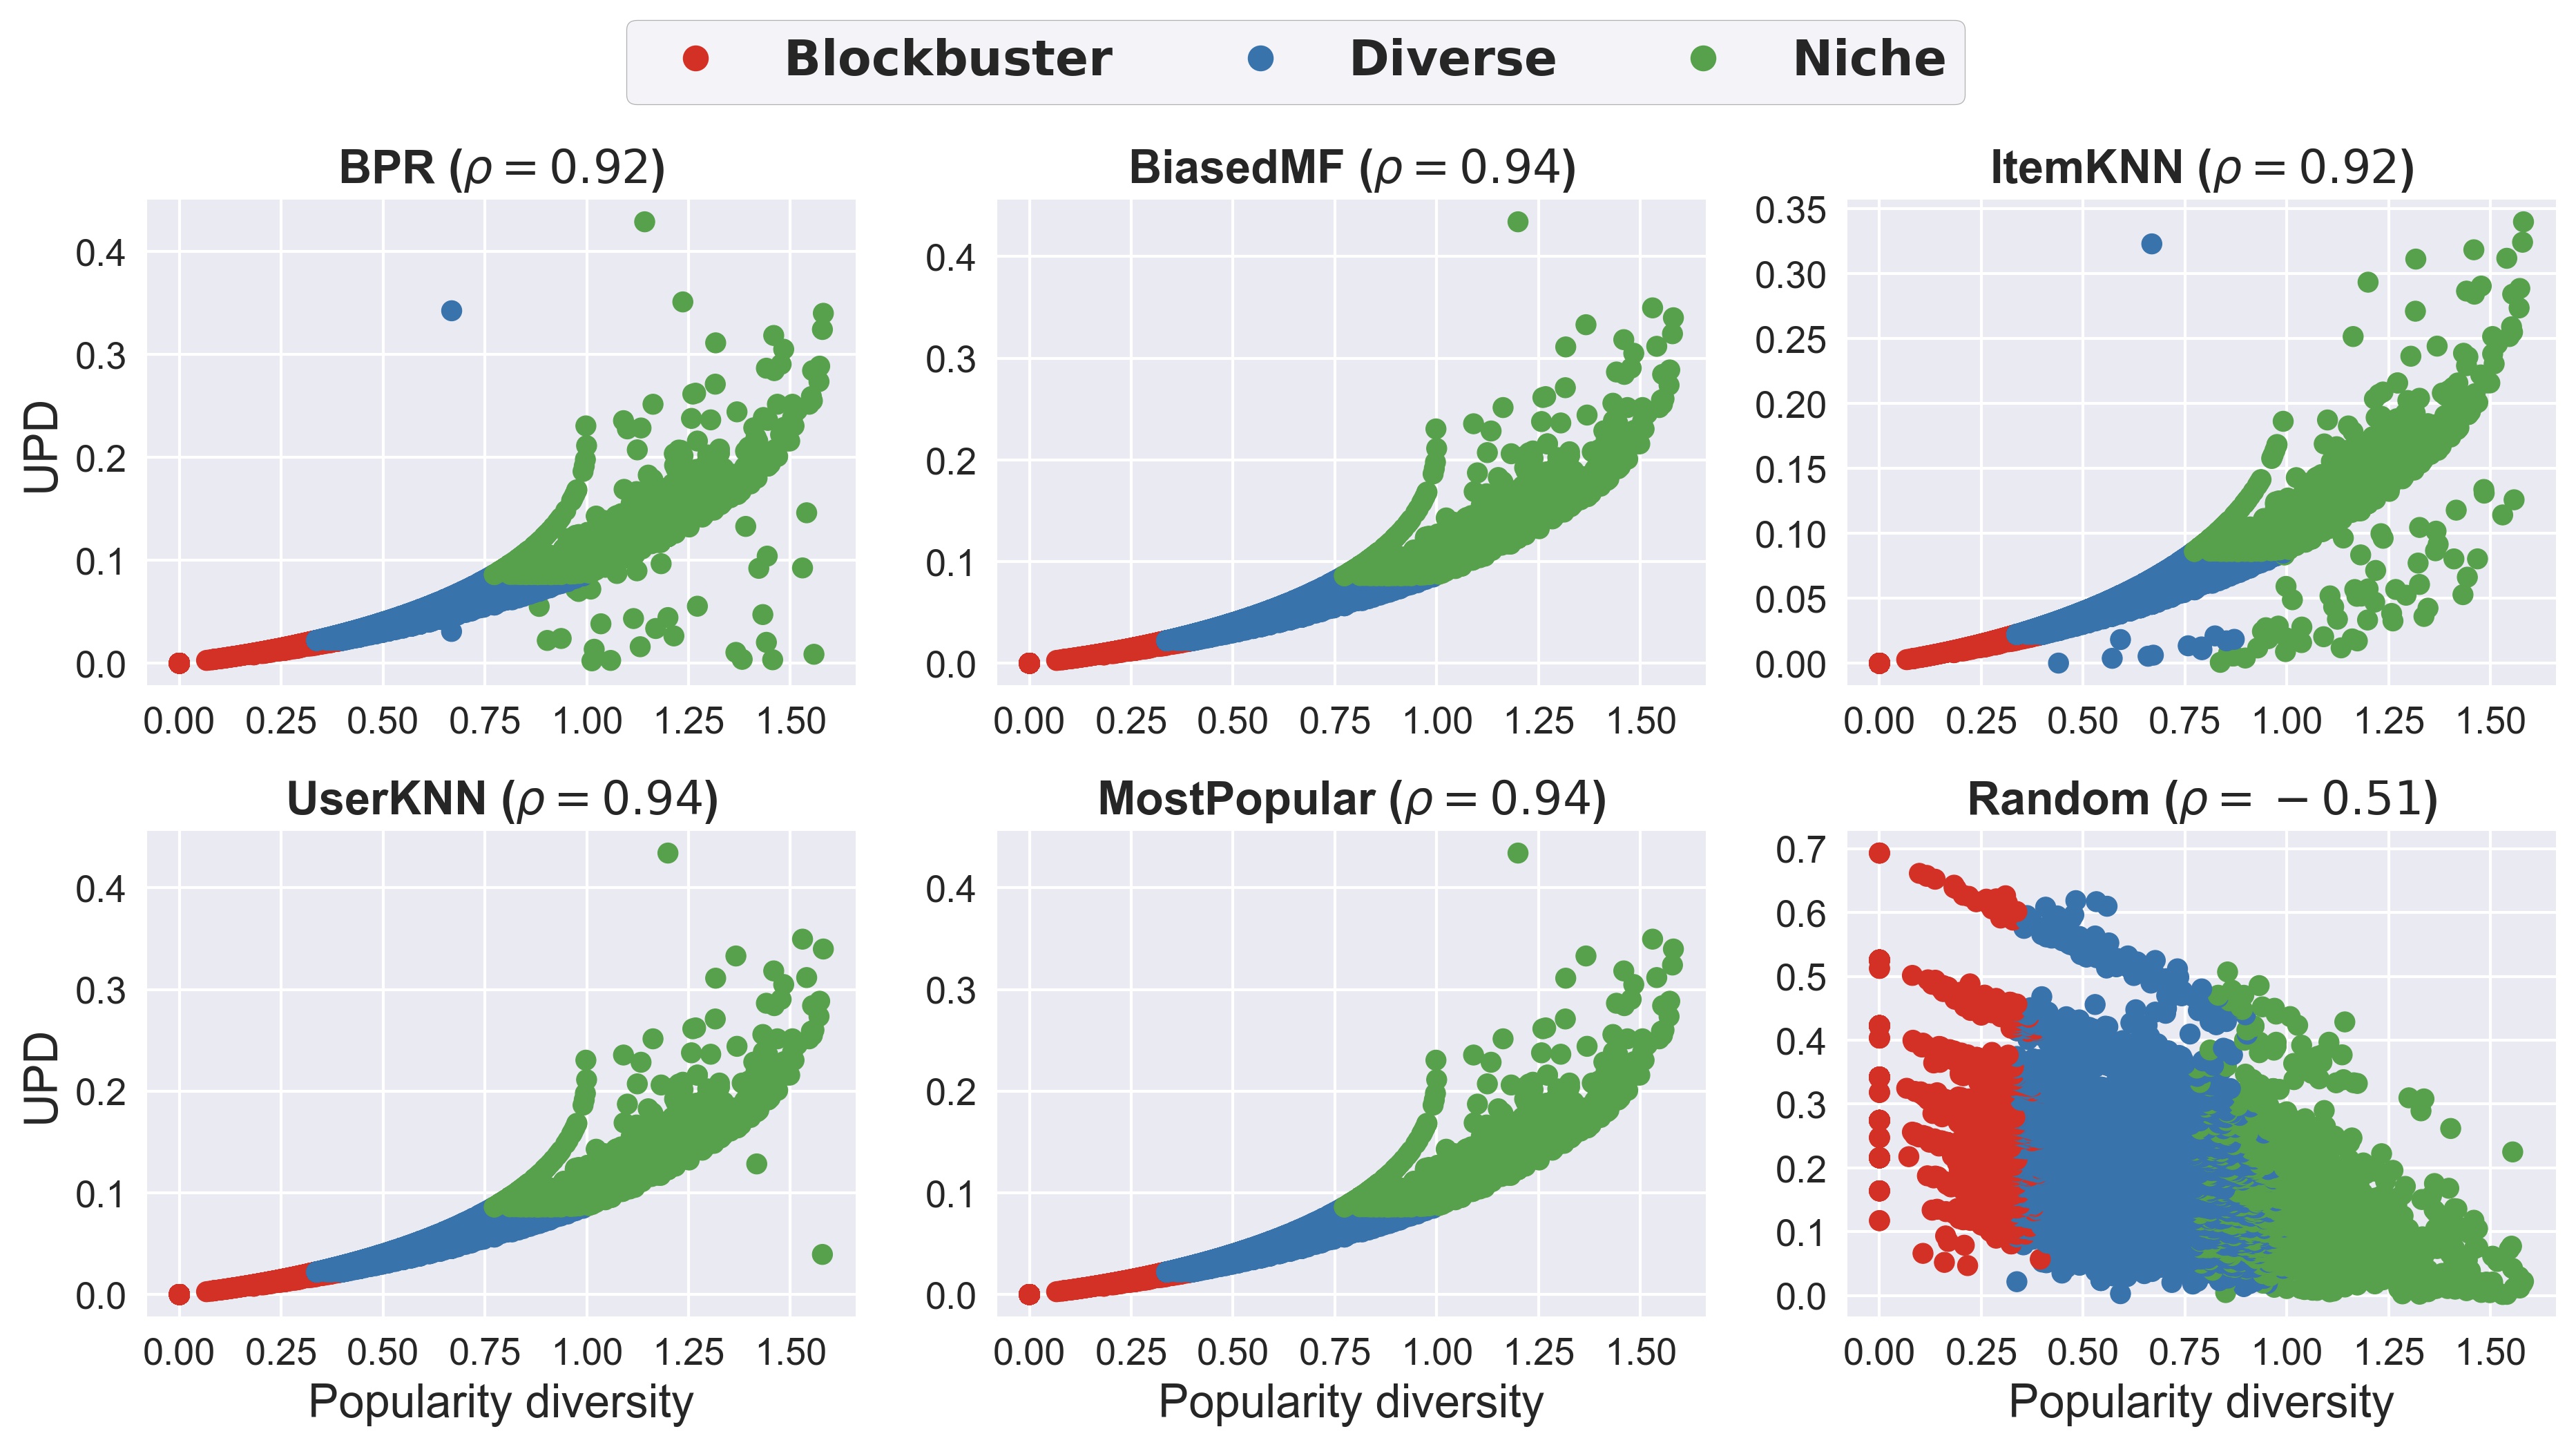
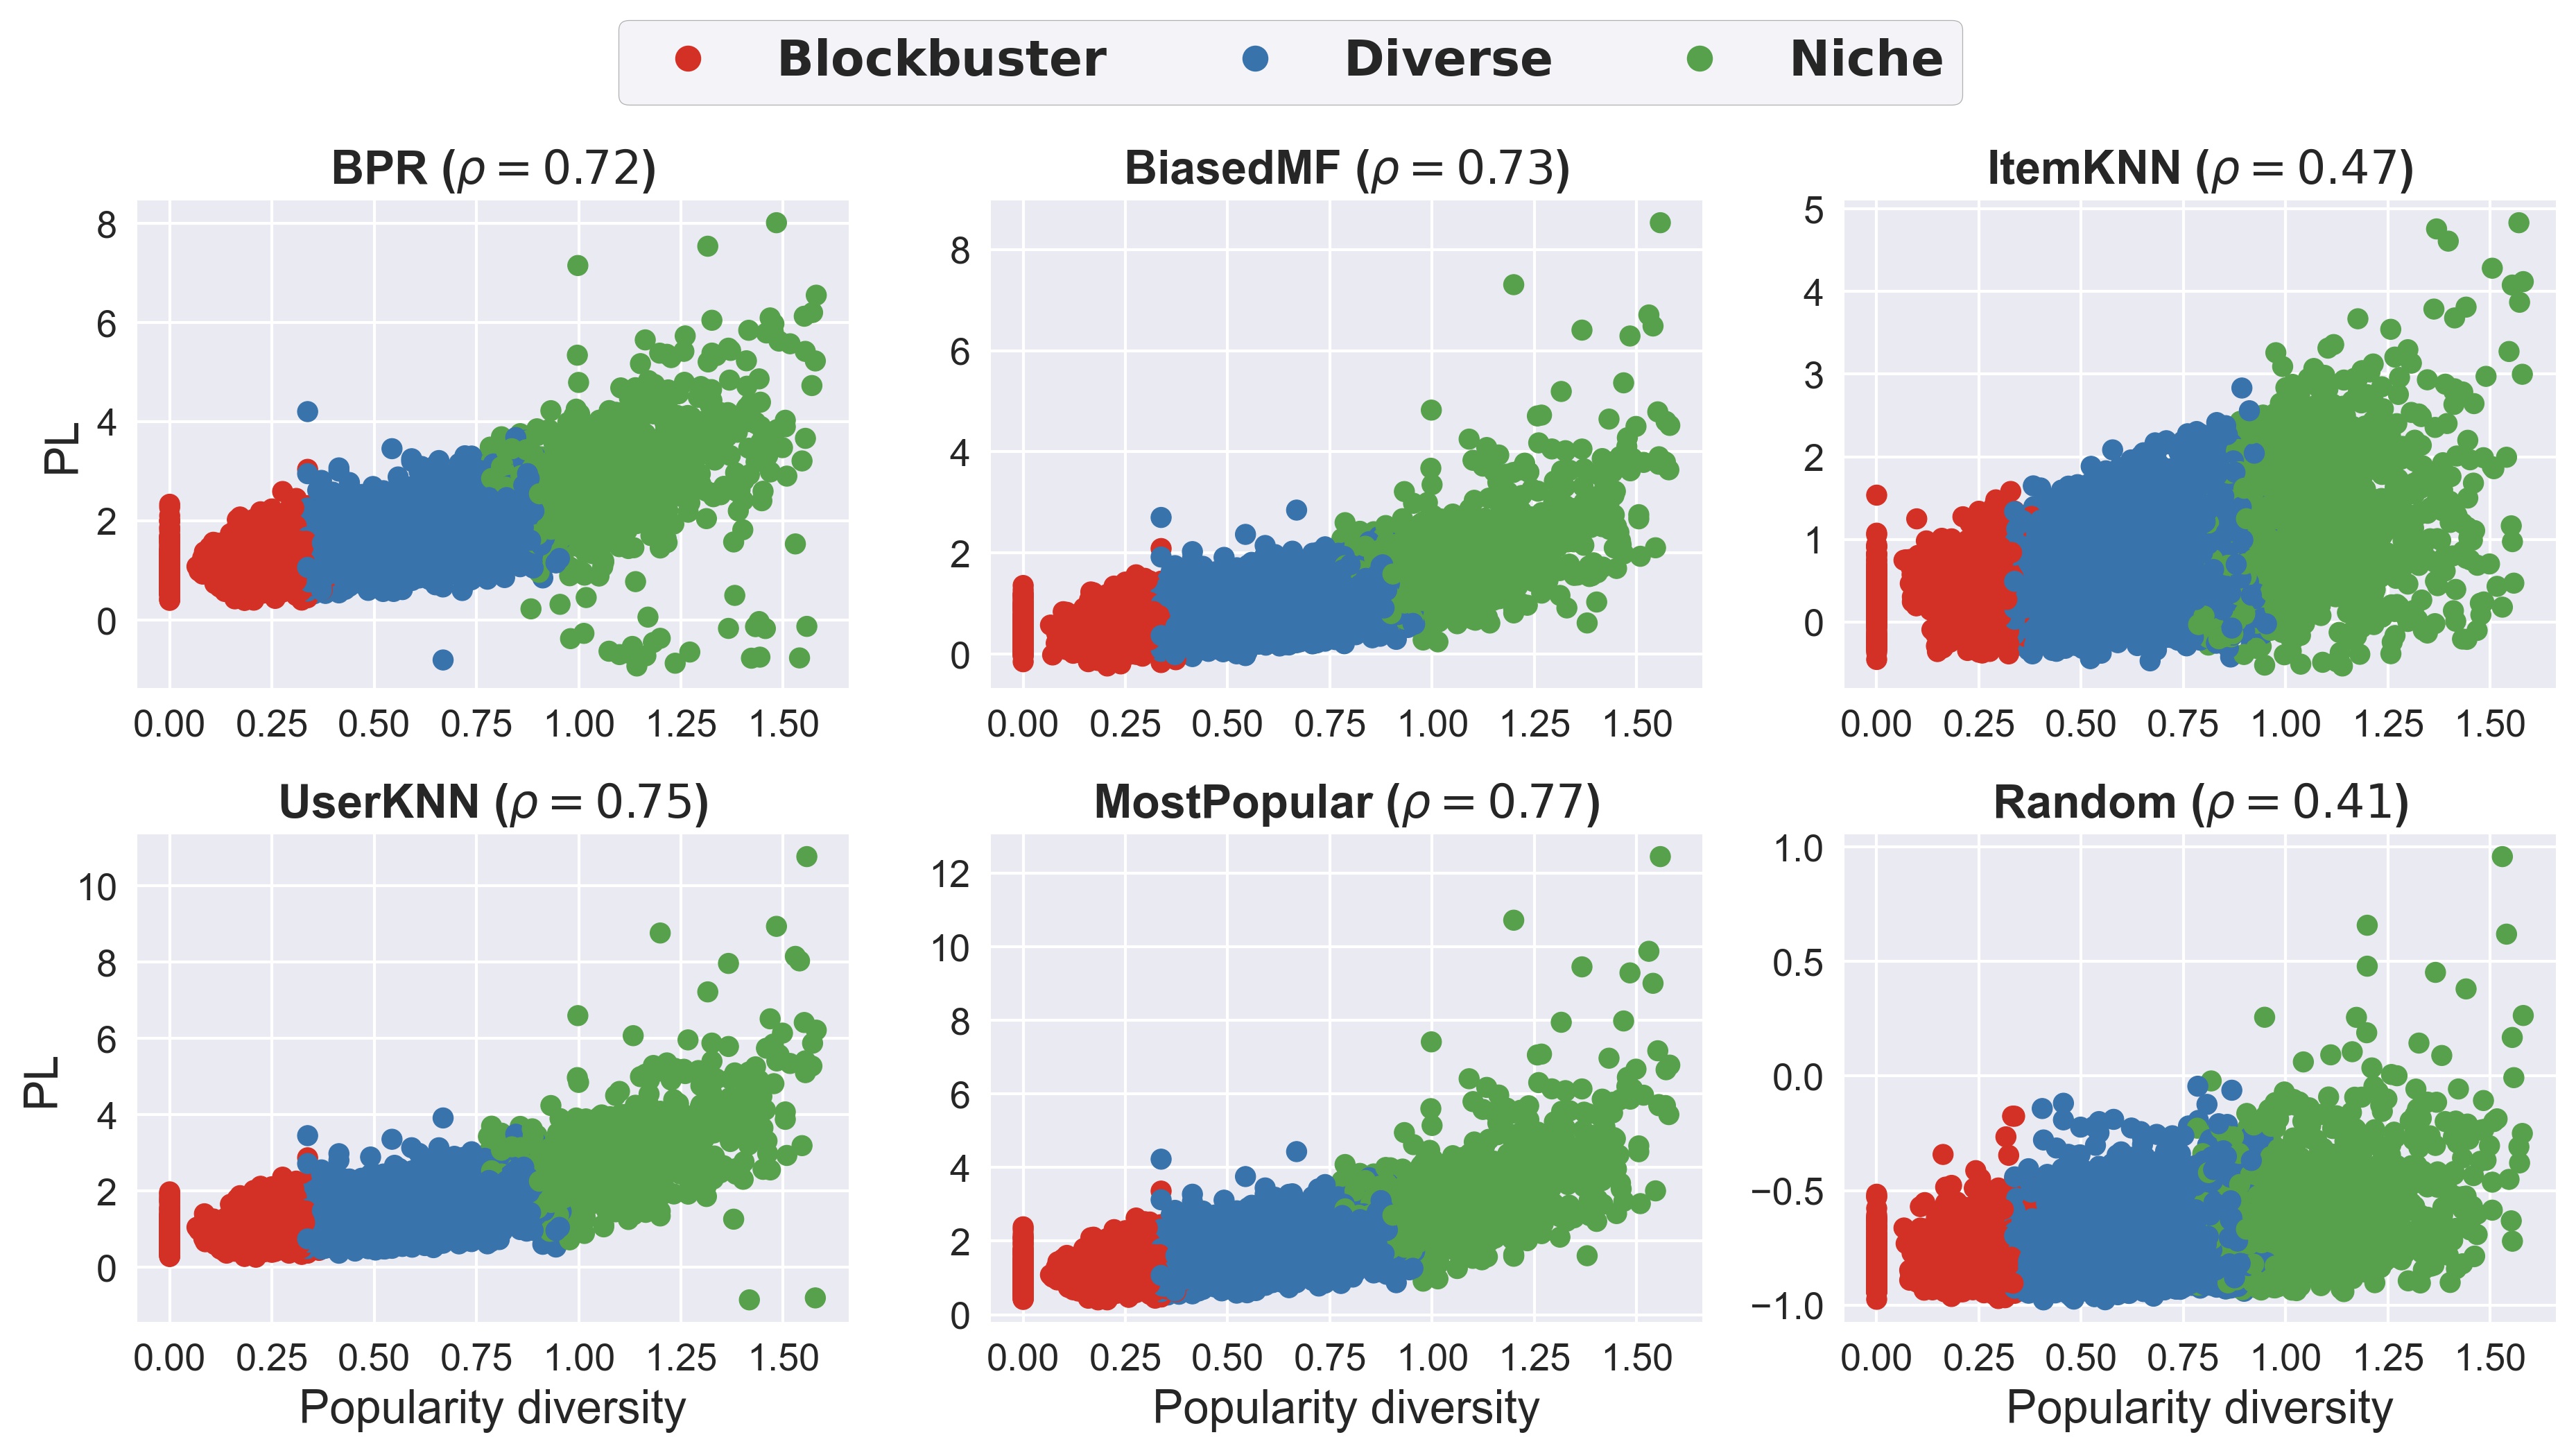
Figure 11 shows the relationship between the popularity diversity and of users’ profile on each recommendation model. The horizontal axis is popularity diversity and vertical axis is . On each plot, the value shows the correlation between two variables. As shown, there is a positive correlation between popularity diversity and of the users’ profile. This correlation is higher on BPR, BiasedMF, UserKNN, and Popular. Analogously, Figure 12 shows the relationship between the popularity diversity and of the users’ profile on recommendation models. The same pattern can also be observed here, but the correlation is even higher (except for Random).
While Figures 11 and 12 confirm that and are correlated with popularity diversity of the users’ profile, another pattern in these results is the popularity diversity across different user groups. It shows that blockbuster-focused group has the lowest popularity diversity, while niche-focused group has the highest popularity diversity. Possible explanation for this result is that blockbuster-focused users mainly interact with popular items, while niche-focused users interact with a combination of popular and unpopular items.
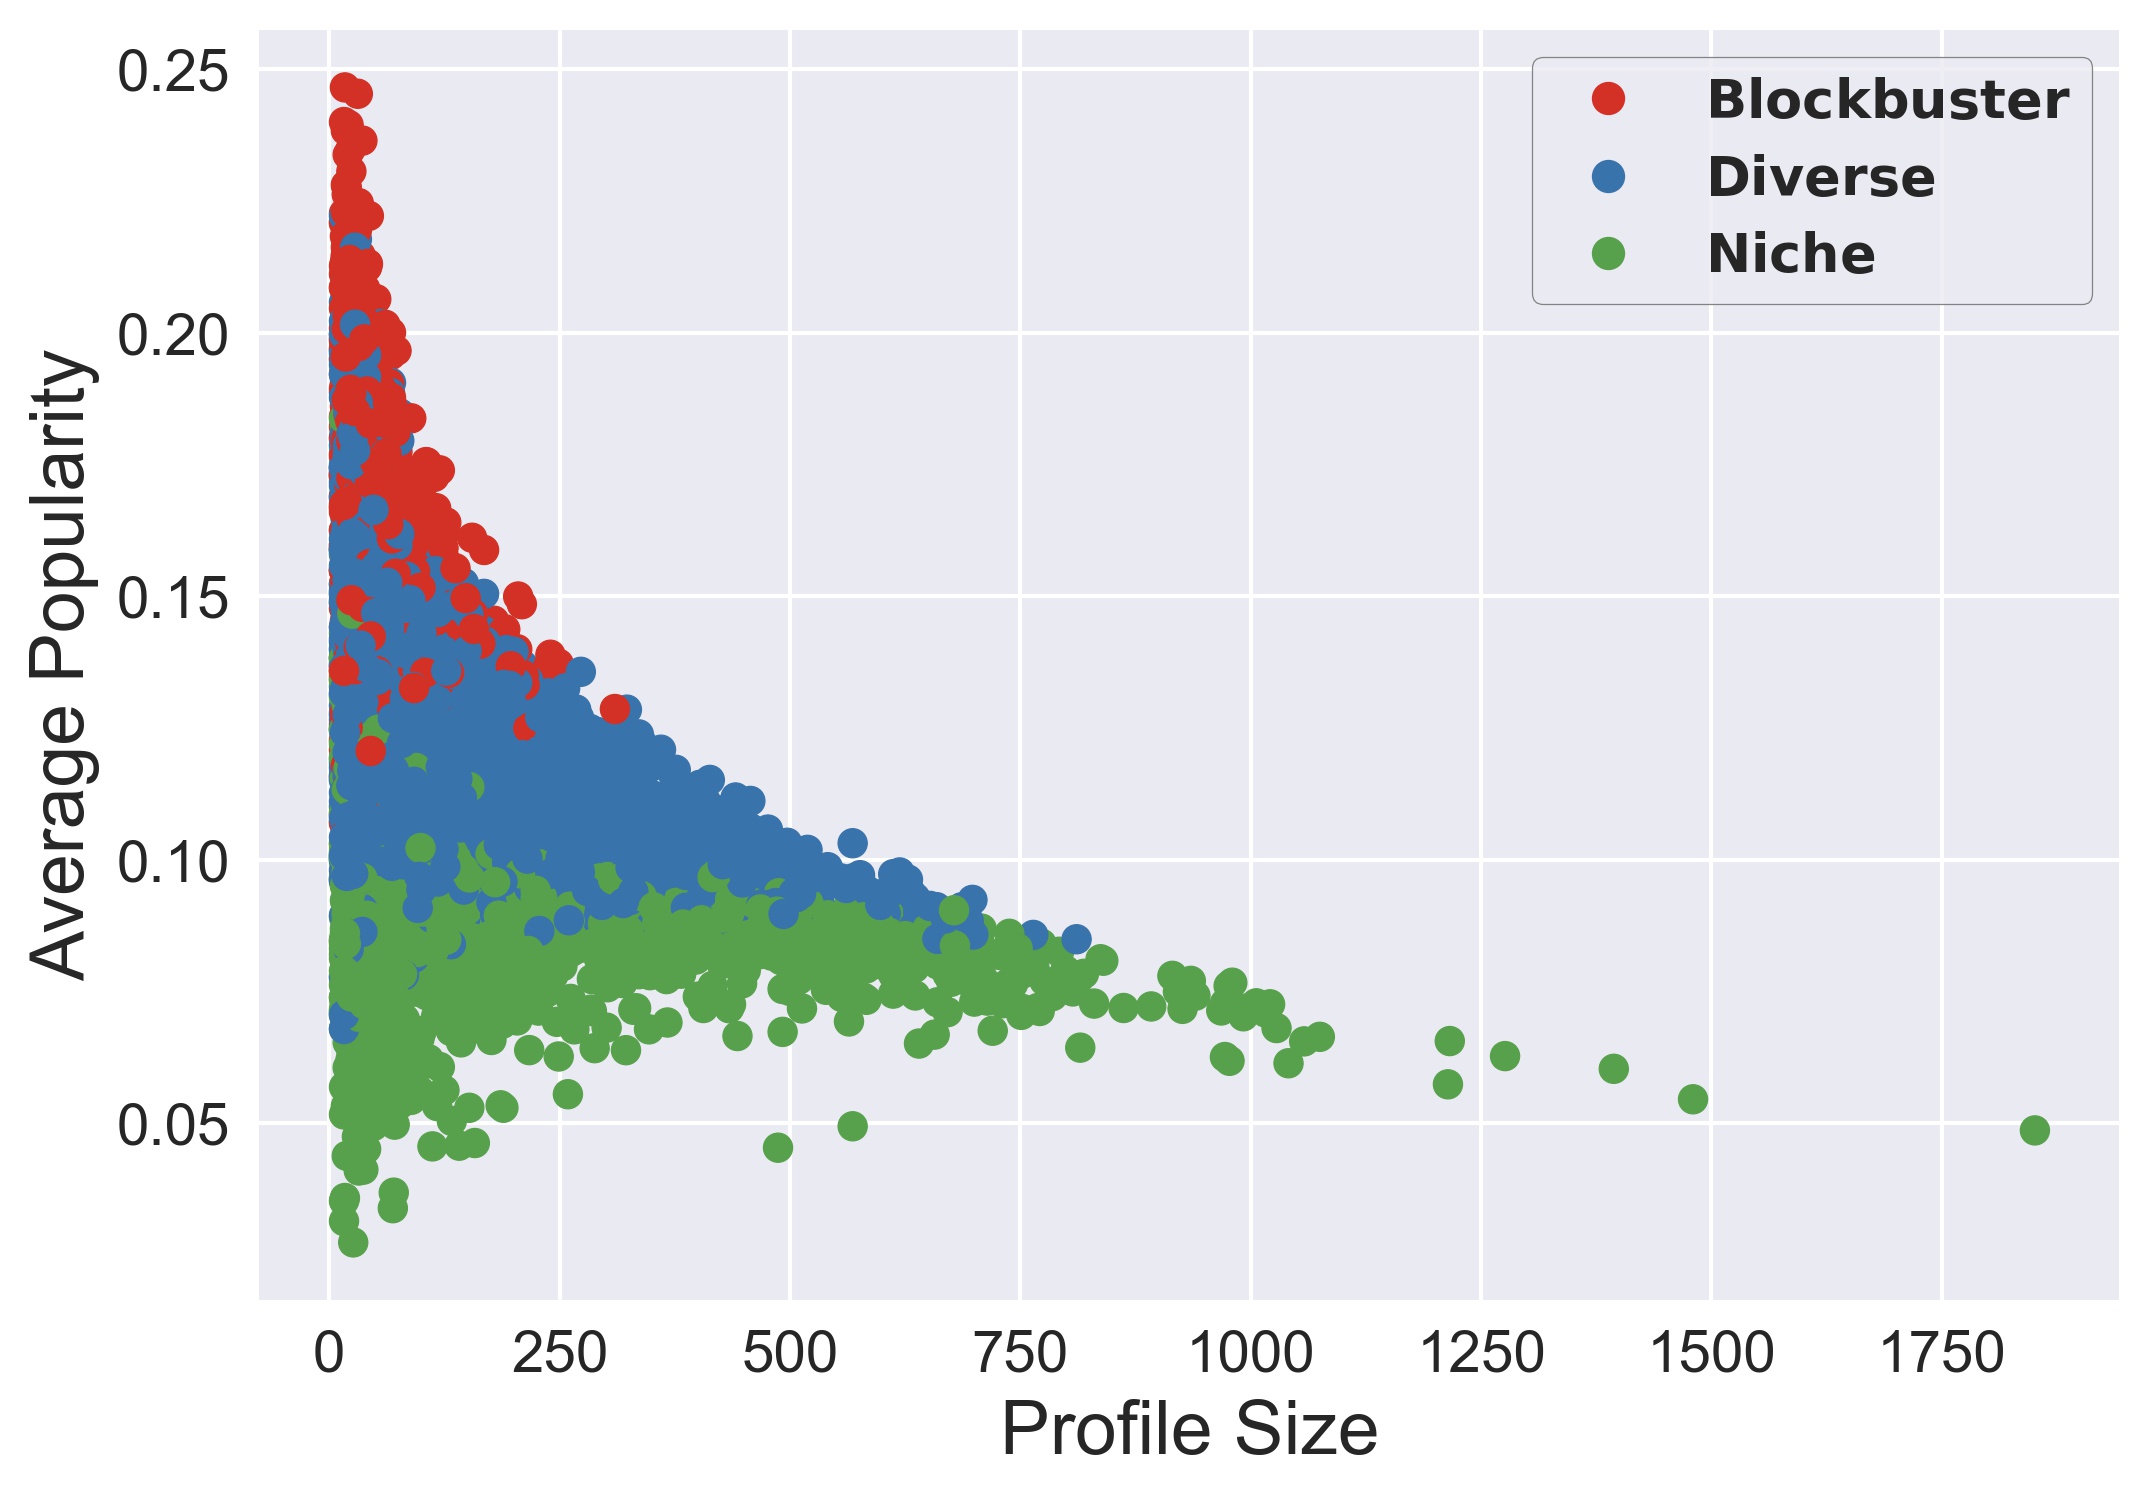
Our last analysis reveals the relationship between the users’ profile size and users’ interest toward popular items. This analysis ensures that the correlation between our identified factors and the degree of unfairness is not due to some other hidden influential factors. The size of users’ profile is an important factor that has been shown to affect the performance of recommendations (larger profile size leads to more accurate recommendation) [16].
Figure 13 shows the relationship between average popularity and size of the users’ profile for different groups of users. It is evident that Blockbuster users have smaller profile (less interacted items), while Niche users have larger profile size (more interacted items). With profile size being a factor affecting the quality of the recommendation for a user, the expectation is that the recommendations delivered to Niche users better match their interest. However, our experimental results do not show this pattern. This confirms that our identified factors are not affected by users’ profile size.
5 Conclusion
In this paper, we studied the user-centered unfairness of popularity bias in recommender systems. In particular, we investigated two factors leading to this unfairness. One factor was profile inconsistency which refers to the degree of inconsistency of a user’s profile in terms of her interest to item popularity and genre popularity (e.g., the inconsistency is high when a user is interested in popular items, but also interested in less popular genres). Another factor was popularity diversity of users’ profile which refers to how diverse a user’s profile is in terms of interacted item groups. Experiments on a movie recommendation dataset using six different recommendation algorithms showed that the introduced factors are highly correlated with the degree of unfairness in recommendation results. An interesting future direction is to investigate possible ways of utilizing the identified factors in this paper to improve the fairness of the recommendation models.
References
- [1] Abdollahpouri, H., Burke, R., Mansoury, M.: Unfair exposure of artists in music recommendation. arXiv preprint arXiv:2003.11634 (2020)
- [2] Abdollahpouri, H., Burke, R., Mobasher, B.: Controlling popularity bias in learning-to-rank recommendation. In: Proceedings of the eleventh ACM conference on recommender systems. pp. 42–46 (2017)
- [3] Abdollahpouri, H., Mansoury, M.: Multi-sided exposure bias in recommendation. ACM KDD Workshop on Industrial Recommendation Systems 2020 (2020)
- [4] Abdollahpouri, H., Mansoury, M., Burke, R., Mobasher, B.: The unfairness of popularity bias in recommendation. RecSys Workshop on Recommendation in Multistakeholder Environments (RMSE) (2019)
- [5] Abdollahpouri, H., Mansoury, M., Burke, R., Mobasher, B., Malthouse, E.: User-centered evaluation of popularity bias in recommender systems. In: Proceedings of the 29th ACM Conference on User Modeling, Adaptation and Personalization. pp. 119–129 (2021)
- [6] Beutel, A., Chen, J., Doshi, T., Qian, H., Wei, L., Wu, Y., Heldt, L., Zhao, Z., Hong, L., Chi, E.H., et al.: Fairness in recommendation ranking through pairwise comparisons. In: Proceedings of the 25th ACM SIGKDD international conference on knowledge discovery & data mining. pp. 2212–2220 (2019)
- [7] Ciampaglia, G.L., Nematzadeh, A., Menczer, F., Flammini, A.: How algorithmic popularity bias hinders or promotes quality. Scientific reports 8(1), 15951 (2018)
- [8] Harper, F.M., Konstan, J.A.: The movielens datasets: History and context. ACM Transactions on interactive intelligent systems (tiis) 5(4), 1–19 (2015)
- [9] Koren, Y., Bell, R., Volinsky, C.: Matrix factorization techniques for recommender systems. Computer 42(8), 30–37 (2009)
- [10] Kowald, D., Schedl, M., Lex, E.: The unfairness of popularity bias in music recommendation: A reproducibility study. In: Advances in Information Retrieval: 42nd European Conference on IR Research, ECIR 2020, Lisbon, Portugal, April 14–17, 2020, Proceedings, Part II 42. pp. 35–42. Springer (2020)
- [11] Lin, J.: Divergence measures based on the shannon entropy. IEEE Transactions on Information theory 37(1), 145–151 (1991)
- [12] Mansoury, M.: Fairness-aware recommendation in multi-sided platforms. In: Proceedings of the 14th ACM International Conference on Web Search and Data Mining. pp. 1117–1118 (2021)
- [13] Mansoury, M.: Understanding and mitigating multi-sided exposure bias in recommender systems. PhD Dissertation, (Eindhoven University of Technology) (2021)
- [14] Mansoury, M., Abdollahpouri, H., Pechenizkiy, M., Mobasher, B., Burke, R.: Feedback loop and bias amplification in recommender systems. In: Proceedings of the 29th ACM international conference on information & knowledge management. pp. 2145–2148 (2020)
- [15] Mansoury, M., Abdollahpouri, H., Pechenizkiy, M., Mobasher, B., Burke, R.: A graph-based approach for mitigating multi-sided exposure bias in recommender systems. ACM Transactions on Information Systems (TOIS) 40(2), 1–31 (2021)
- [16] Mansoury, M., Abdollahpouri, H., Smith, J., Dehpanah, A., Pechenizkiy, M., Mobasher, B.: Investigating potential factors associated with gender discrimination in collaborative recommender systems. The 33nd International FLAIRS Conference in Cooperation with AAAI (2020)
- [17] Mansoury, M., Burke, R.: Algorithm selection with librec-auto. In: AMIR@ECIR. pp. 11–17 (2019)
- [18] Mansoury, M., Mobasher, B.: Fairness of exposure in dynamic recommendation. CONSEQUENCE’23 Workshop on Causality, Counterfactuals, and Sequential Decision-Making in conjunction with ACM RecSys 2023 (2023)
- [19] Rastegarpanah, B., Gummadi, K.P., Crovella, M.: Fighting fire with fire: Using antidote data to improve polarization and fairness of recommender systems. In: Proceedings of the twelfth ACM international conference on web search and data mining. pp. 231–239 (2019)
- [20] Rendle, S., Freudenthaler, C., Gantner, Z., Schmidt-Thieme, L.: Bpr: Bayesian personalized ranking from implicit feedback. In: Proceedings of the Twenty-Fifth Conference on Uncertainty in Artificial Intelligence. pp. 452–461 (2009)
- [21] Resnick, P., Iacovou, N., Suchak, M., Bergstrom, P., Riedl, J.: Grouplens: An open architecture for collaborative filtering of netnews. In: Proceedings of the 1994 ACM conference on Computer supported cooperative work. pp. 175–186 (1994)
- [22] Sarwar, B., Karypis, G., Konstan, J., Riedl, J.: Item-based collaborative filtering recommendation algorithms. In: Proceedings of the 10th international conference on World Wide Web. pp. 285–295 (2001)
- [23] Sinha, A., Gleich, D.F., Ramani, K.: Deconvolving feedback loops in recommender systems. Advances in neural information processing systems 29 (2016)
- [24] Steck, H.: Collaborative filtering via high-dimensional regression. arXiv e-prints pp. arXiv–1904 (2019)
- [25] Sürer, Ö., Burke, R., Malthouse, E.C.: Multistakeholder recommendation with provider constraints. In: Proceedings of the 12th ACM Conference on Recommender Systems. pp. 54–62 (2018)
- [26] Yao, S., Huang, B.: Beyond parity: Fairness objectives for collaborative filtering. Advances in neural information processing systems 30 (2017)
- [27] Zhu, Z., He, Y., Zhao, X., Caverlee, J.: Popularity bias in dynamic recommendation. In: Proceedings of the 27th ACM SIGKDD Conference on Knowledge Discovery & Data Mining. pp. 2439–2449 (2021)
- [28] Zhu, Z., He, Y., Zhao, X., Zhang, Y., Wang, J., Caverlee, J.: Popularity-opportunity bias in collaborative filtering. In: Proceedings of the 14th ACM International Conference on Web Search and Data Mining. pp. 85–93 (2021)