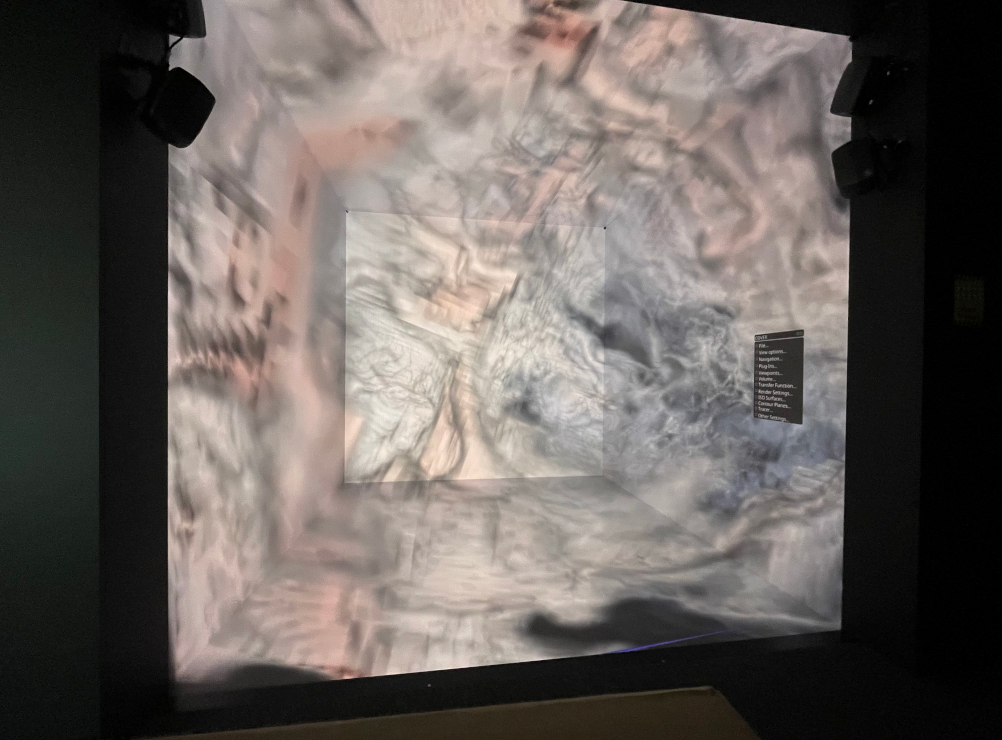
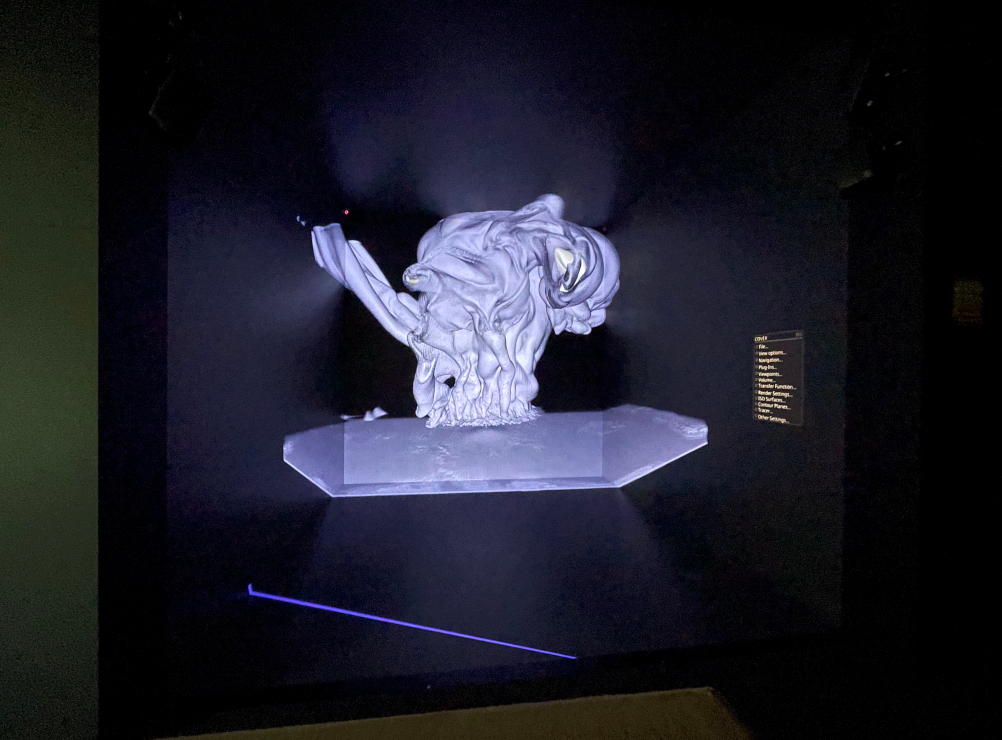
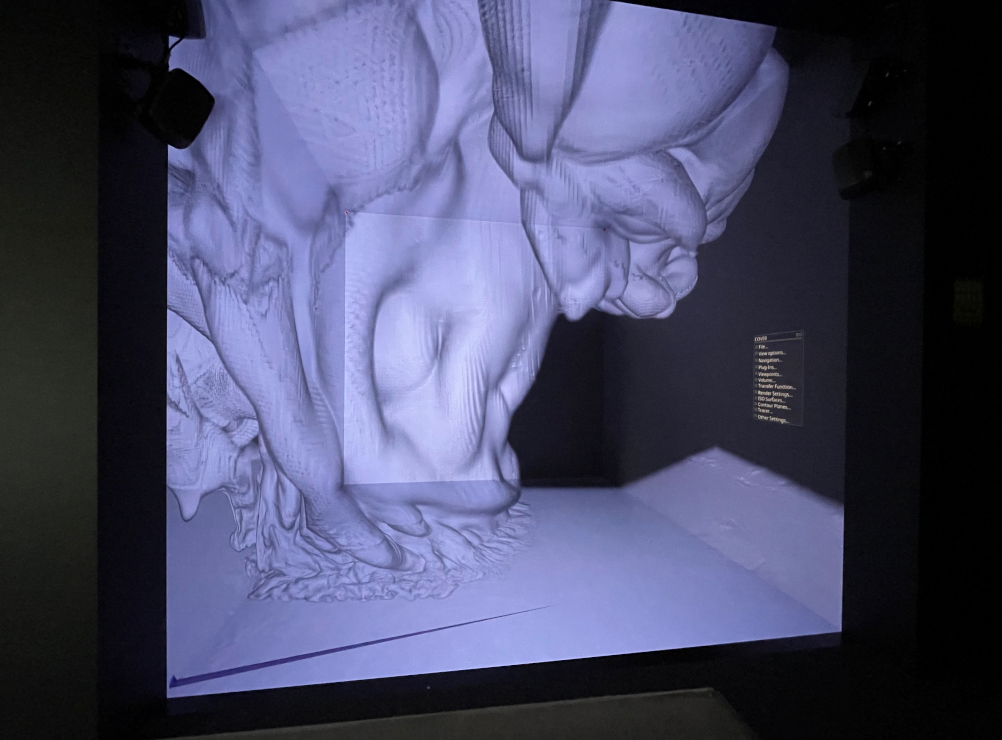
![[Uncaptioned image]](/html/2310.02881/assets/figure/Teaser_temp2.png)
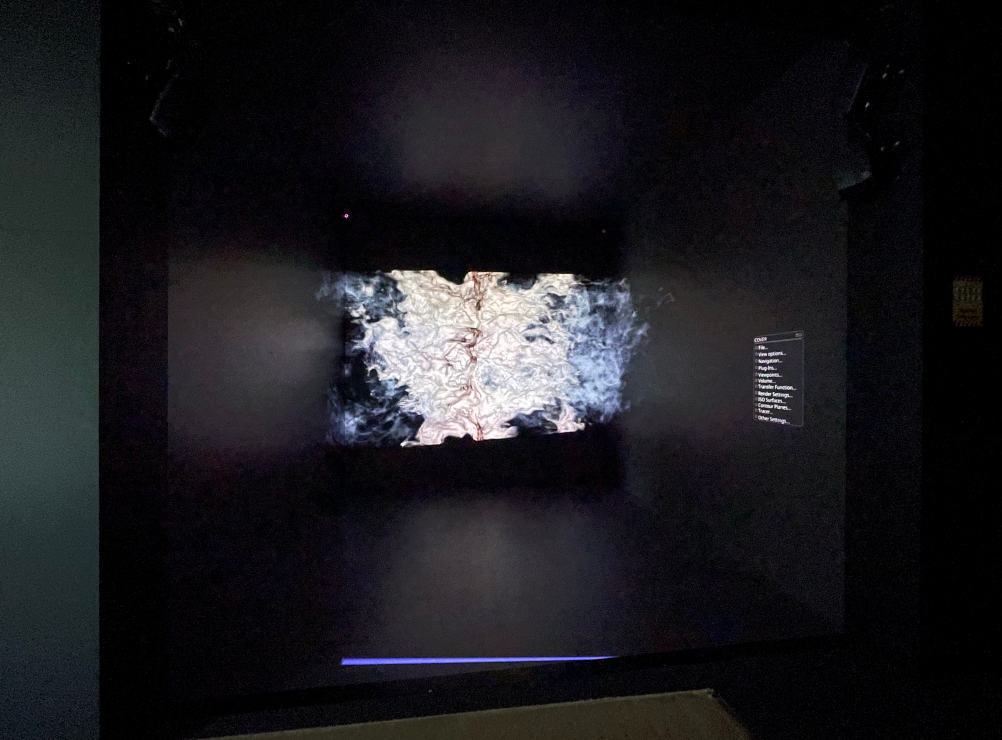
Real-time rendering of AMR data sets with our tool, in the CAVE virtual environment at the University of Cologne. Left: molecular cloud data set; Mid: Meteor impact data set (t=46,122s); Right: Meteor impact zoomed in.
Immersive ExaBrick: Visualizing Large AMR Data in the CAVE
Abstract
Rendering large adaptive mesh refinement (AMR) data in real-time in virtual reality (VR) environments is a complex challenge that demands sophisticated techniques and tools. The proposed solution harnesses the ExaBrick framework and integrates it as a plugin in COVISE, a robust visualization system equipped with the VR-centric OpenCOVER render module. This setup enables direct navigation and interaction within the rendered volume in a VR environment. The user interface incorporates rendering options and functions, ensuring a smooth and interactive experience. We show that high-quality volume rendering of AMR data in VR environments at interactive rates is possible using GPUs.
1 Introduction
In recent years, a trend can be observed for scientific simulations to generate volumetric data in the form of adaptive mesh refinement (AMR) topologies. AMR data [BO84, BC89] is characterized by its hierarchical structure, where the computational domain is divided into a series of hierarchical grids with varying levels of refinement. It offers the advantage of enhanced simulations by enabling higher resolution in critical regions while maintaining a coarser representation in less significant regions. With the help of the ExaBrick framework [WZU∗21], large AMR data can be re-arranged into the ExaBricks data structure. This restructuring of data enables scientific visualization of such data at interactive framerates. However, real-time visualization of large AMR data sets presents formidable challenges due to their intricate nature and the imperative for interactive exploration and analysis.
Real-time rendering technology assumes a pivotal role in enabling interactive exploration and analysis in virtual reality (VR) environments, allowing users to seamlessly navigate and manipulate data in a responsive manner. VR has become a powerful technology that provides an immersive and interactive experience, making it an ideal platform for visualizing complex scientific data. By harnessing the potential of VR, researchers and scientists can attain a profound comprehension of the complex structures and phenomena represented by AMR data.
To create an immersive experience that seamlessly integrates users’ natural head movements, enables exploratory interactions, and facilitates the manipulation of data sets within the VR environment, rendering frameworks are required to implement virtual stereo cameras to generate viewports from; in contrast to camera models used for non-immersive applications, VR camera models support head tracking by placing the camera position at an off-center position. These off-axis cameras allow for the camera to be positioned at an angle that does not rigidly align with the center of the scene or object. Leveraging the advanced capabilities of the CAVE system [CNSD∗92] installed at the University of Cologne and the VR renderer OpenCOVER, which is integrated within the COVISE platform, we can expand upon the ExaBrick framework. Our extensions allow us to harness the power of 3D rendering within VR environments, promising a groundbreaking leap in immersive data visualization and interaction.
Our main contributions are:
-
•
A real-time rendering solution for large AMR data sets in a VR environment;
-
•
An analysis of the lessons learned and challenges to integrate the ExaBrick framework [WZU∗21] as a plugin into COVISE;
-
•
An immersive VR application that enables users to navigate and interact with rendered data using head trackers or controllers, and access and manipulate rendering options.
2 Related Work
Techniques to visualize large-scale data become paramount, and there has been a lot of development in this area [SZD∗23]. For example, Sarton et al. [SCRL20] introduced an efficient solution for managing large 3D grid data on a GPU. This approach minimizes memory transfers between GPU and host and is designed to maintain GPU performance while reducing CPU-GPU communication. Morrical et al. [MWUP20] harnessed ray tracing hardware in NVIDIA’s RTX GPUs, achieving substantial performance enhancements in unstructured mesh point location.
Rendering AMR data has been a subject of significant interest and importance in the scientific visualization community. Berger et al. brought up with the AMR data structure [BO84, BC89], which enables simulations to focus on more interesting parts in the data. The cells the data is composed of have different refinement levels according to their relative importance. The more important the area is, the smaller are the cells in this area. AMR data comes in different forms, such as block-structured AMR [CGL∗09] or Octrees [BWG11].
Kähler et al. [KSH03, KWAH06] proposed to render AMR data on the GPU via a data structure that discards the original AMR hierarchy and builds blocks containing only same-refinement-level cells. While their works excel in supporting nearest neighbor reconstruction and vertex-centered AMR, challenges of smooth interpolation for cell-centered data resulting from T-junctions remain unaddressed. These challenges were addressed by Weber [WCM12] on the CPU by generating stitch cells in parallel using extra layers of cells around boundaries. Wald et al. [WBUK17] proposed to use tent-shaped basis function interpolation, enabling smooth interpolation including at refinement level boundaries. Wang et al. [WWW∗19] presented reconstruction filters utilizing the octants of dual AMR cells and operate directly on cell-centered AMR data.
These prior works by Wald and Wang primarily focused on CPU reconstruction. Their contributions involved filters that demanded expensive cell location calculations through KD-trees, requiring eight such look-ups per ray marching step to interpolate the samples. This process becomes exceptionally costly when executed on GPUs due to their limited caching capabilities and their high concurrency, which can lead to congestion on the memory subsystem.
To address these issues, Wald et al. [WZU∗21] later introduced a significant advancement in this field through the introduction of the ExaBrick data structure and rendering framework. The paper delves into an in-depth exploration of practical models and rendering techniques tailored for AMR data sets. A detailed description is provided in Section 3. The focal point is a software solution called ExaBrick, which will also form the basis for our work. The proposed framework extends earlier work by Kähler and others [KSH03, KWAH06] but lifts the restriction that their GPU data structure is only applicable to nearest neighbor interpolation or vertex-centric data. Another notable property is ExaBrick’s use of hardware ray tracing cores via OptiX [PBD∗10].
Zellmann et al.’s [ZSM∗22] subsequent extension adapts ExaBrick to support steady flow visualization using particle tracing. Later, Zellmann et al. [ZWS∗22a] harnessed modern workstations and APIs to visualize exa-scale time-varying AMR data sets and achieved smooth animation at interactive rates. Addressing the challenges coming with scattering events and global illumination, Zellmann et al. [ZWS∗22b] implemented volumetric path tracing for AMR data using Woodcock tracking [WMHL65], where ExaBrick serves as an acceleration data structure supplying density majorants.
Various visualization techniques have been explored in the context of VR environments, aiming to enhance user experiences and enable immersive interactions with complex data and simulations [SC03]. In seminal work from 1998, Cruz-Neira et al. [CNSD∗92] introduced the CAVE virtual reality and scientific visualization system. A descendent of such systems, yet realized with modern technology such as active stereo backprojection at high resolution, or high-precision tracking with infrared markers, was recently installed at the University of Cologne [ICC23]. CAVE systems use off-axis perspective projection techniques, which are required to implement 6-DoF stereo camera systems with arbitrarily positioned viewing centers.
Horan et al. [HSM∗18] for example introduced a versatile CAVE-like VR system. This system integrates a 6-DoF haptic interaction system and immersive 3D surround sound audio, offering a highly immersive experience. A standout feature is the INCA 6D haptic system developed by Haption GmbH [PD09], enabling users to grasp and feel objects with up to 37.5N force feedback on a gripping tool. The paper discusses the system’s pros and cons across various configurations and VR applications.
Head-mounted displays (HMDs) are an alternative to CAVE-like VR and are used widely in this field. For example, the Oculus Rift headset and Oculus Touch controllers are used in the study by Kalarat and Koomhin [KK19] with a VR application for real-time volume rendering interaction with 1D transfer functions, enabling users to visualize stereoscopic images at 60 frames per second.
Utilizing the advantages of VR techniques, scientists are able to visualize data in different domains; Koger et al. [KHYD22], e.g., investigated the potential of VR as an immersive platform for interactive medical analysis, enabling the manipulation and exploration of CT images of the cardiopulmonary system in a 3D environment, facilitating the generation of new data analysis perspectives and enhancing data interpretation for medical practices including training, education, and investigation. Recently, Nam et al. [NASN23] introduced an extension to OSPRay Studio, enabling 3D virtual environment display on tiled walls. This extension employs gesture-based interaction, utilizing Microsoft Kinect sensors to track user movements and update 3D objects based on interpreted gestures.
The COVISE visualization framework [RLL∗96], along with its COVER module [RFL∗98] (later OpenCOVER), serves as a pivotal avenue for rendering scientific data within VR environments. This integration of virtual reality with scientific visualization leverages OpenSceneGraph [WQ10] and OpenCOVER, enabling real-time 3D rendering in COVISE. COVISE’s versatility is highlighted by the incorporation of various rendering approaches, exemplified by Schulze et al.’s volume plugin [SDWWL01] and by Zellmann et al.’s Visionaray library [ZWL17], which, notably, inspired the development of our ExaBrick plugin.
3 Background: ExaBrick Data Structure and Framework
Our contribution builds considerably upon ExaBrick by Wald et al. [WZU∗21]. ExaBrick can be considered a data structure over the basis function method presented in earlier work by Wald et al. [WBUK17], as well as a framework based on NVIDIA OptiX that makes use of hardware ray tracing. The fundamental problems solved are those of smooth interpolation including at the level boundaries—this is achieved by using tent basis functions—as well as coherent traversal with viewing rays, in the spirit of the data structure proposed by Kähler et al. [KWAH06].
Other than Kähler’s data structure, the integration domains chosen by Wald do overlap (as they include one half cell’s overlap per side to accommodate the tent basis); Wald et al. address this issue by computing a domain decomposition over the regions where the basis function domains overlap, so a volume renderer performing absorption and emission integration is still presented with non-overlapping integration regions. Each domain of the domain decomposition stores pointers to a set of “bricks” (these are the same as Kähler’s, and span the actual data domain of the cells). By interactively classifying and culling empty regions, only those regions that are visible become active, hence the term active brick regions (ABR) for the axis-aligned boxes constituting the domain decomposition. The ABRs can be traversed similarly to the original bricks by Kähler, allow for coherent accesses amenable to GPUs, and serve as an adjacency data structure required for smooth level boundaries.
ExaBrick is however also an open source framework111https://github.com/owl-project/owlExaBrick organized into what can semantically considered to be a software library (depending on OptiX, and on OWL, the OptiX Wrappers Library [WML∗22]), and a viewer application (exaViewer) that uses the library. Technically, the library and viewer are statically compiled into the same executable, but C++ classes define the interface and allow for easy separation of the two components, so that the library part could, e.g., be compiled into a Unix shared object or a Windows dynamic link library. The main interface of the “library portion” is the OptiXRenderer class, which also wraps the virtual camera, consumes and populates a (CUDA device) pointer to the frame buffer, and has pointers to the data that is supplied via a proprietary (yet documented and simple) file format and config file facilities.
4 Method Overview
We propose to use ExaBrick to drive immersive rendering in the CAVE by building it as a shared library and integrating it into OpenCOVER, COVISE’s rendering component, as a viewport plugin. Viewport plugins capture the renderer’s tracking state, transform that into camera parameters that can be consumed and finally turned into rendered images using a custom rendering method, to eventually be displayed in OpenCOVER’s viewport.
The exaViewer application developed by Wald et al. forms the viewing tool and GUI of ExaBrick. For VR, however, this tool is only of limited use. It relies on an on-axis pinhole camera placed in direct alignment with the scene’s center. Consequently, it captures scenes from a viewpoint where the camera’s optical axis is congruent with the line of sight to the center of the scene. This yields a straightforward and centrally-focused perspective of the scene, but only for desktop applications with mono viewing and without headtracking interaction.
The original camera needs to be replaced with an off-axis model to support CAVE-like stereo. In ray tracing we use rays to simulate the line of sight from the eyes to the object to simulate light transport and light’s propagation to the human eye bouncing off objects. The new camera in the plugin should generate primary rays following the off-axis camera model.
5 Implementation
The main programming language used for the implementation is C++. Important code snippets will be presented here, where applicable in C++, or in an abridged form of that where clarity demands this; complete code is available on a development branch on GitHub 222https://github.com/zywang3/covise/tree/zhaoyang.
5.1 OpenCOVER Viewport Plugin Control Flow
OpenCOVER can be extended using plugins, which are dynamic libraries implementing a function interface that OpenCOVER calls at runtime. To create a plugin, we inherit from the C++ class coVRPlugin and implement its virtual methods. Some of the virtual methods, when called, guarantee that an OpenGL context is “current”, i.e., when issued from there, OpenGL calls by our implementation are executed on the main graphics thread.
The interface to obtaining tracking parameters for the user’s position as mentioned in Section 4 is supported by accessing OpenCOVER’s OpenGL state. This is realized using the C++ utility class MultiChannelDrawer; the multi-channel drawer class also allows the plugin to write RGBA and depth pixels to each channel; channels form framebuffer abstractions, e.g., for the left/right eye, per projection wall, of the CAVE environment. This workflow of accessing OpenCOVER’s camera transforms and directly writing to the frame and depth buffer allows us to realize what is called a viewport plugin—which is opposed to other plugin types that, e.g., extend the scene graph structure of the VR renderer.
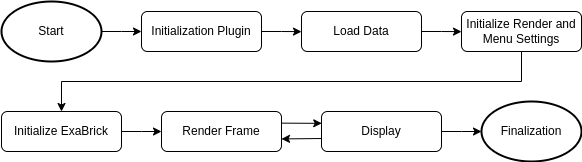
The ExaBrick plugin follows a structured workflow that includes Plugin initialization, data loading, setting up initial values and menus, and initialization of the ExaBrick library. OpenCOVER then enters the render loop, giving the plugin the chance to render frames and display them. On shutdown, the plugin executes a finalization phase to tear down any state, including that of the ExaBrick library. See Fig. 1 for an overview.
5.2 ExaBrick Application/Plugin–Library Interface
The ExaBrick plugin utilizes various functions and tools from the original ExaBrick library. We build the ExaBrick tools and exaViewer executable locally by integrating the whole C++ project as a git submodule into COVISE. We build the rendering logic into a shared library; interoperability between COVISE/OpenCOVER and ExaBrick is ensured as both software projects use CMake as the build system.
ExaBrick imports its data via a set of proprietary, yet documented, file formats. The corresponding code for loading data is encapsulated in the loadFile function using COVISE’s FileHandler class. The file handler of our plugin is defined to read text-based config files, which point to binary input files with scalar data and bricks; as described in the original publication [WZU∗21], any cartesian AMR format with compatible data can be converted to this format using tools coming with the ExaBrick framework. When the file handler gets invoked, loading these files is realized using ExaBrick functions that we promoted to API functions that can be called at the library/application interface.
During the Initialize Render and Menu Settings phase (cf. Fig. 1), a multitude of parameters for the renderer are initialized. This encompasses setting up transfer function values, configuring rendering preferences, and determining the ideal ray marching step size . A detailed description of the menu structure is found in Section 5.4. These settings are established directly after the creation of OptiXRenderer, which is the central class of the ExaBrick library.
Afterwards we create the MultiChannelDrawer, the API that allows us to realize viewport plugins and render into COVER’s viewport. The class can handle various rendering modes, update geometry, and handle the data for each view independently or collectively, depending on the selected view settings. The camera matrices are obtained from the MultiChannelDrawer (Line 2–6 in LABEL:lst:mcd) and passed to the renderer (Line 14–22 in LABEL:lst:mcd) using the function setCameraMat(). Furthermore, we obtain pointers the depth and color buffer using the depth() and rgba() member functions of the MultiChannelDrawer class (Line 26–29 in LABEL:lst:mcd) that our renderer can write to directly. After rendering a single frame (LABEL:lst:mcd, Line 32), the final phase responsible for displaying the resulting images, now resident in the depth and color buffers, is initiated by calling the MultiChannelDrawer’s swapFrame function (LABEL:lst:mcd, Line 35).
5.3 Adjustments to Existing Shader Code
The original shader code of ExaBrick creates an on-axis camera with the device function generateRay. However, since our application requires an off-axis camera, we have extended the functionality of this generateRay function to calculate rays suitable for our application’s needs.
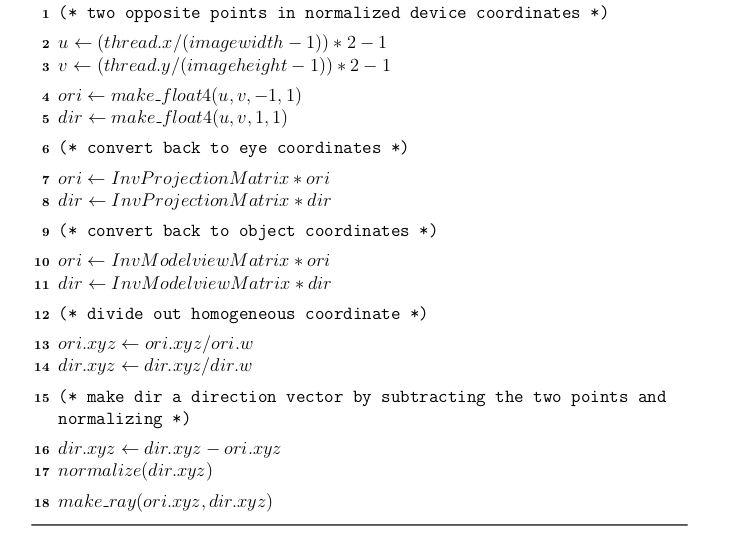
As described for example in Zellmann’s dissertation [Zel14], we generate orthogonal rays in normalized device coordinates (NDC) through each pixel, originating at and pointing in the positive direction. By applying the inverse viewing transform (projection and model-view matrices obtained via setCameraMat in LABEL:lst:mcd), these orthogonal rays are transformed to world (in our case: CAVE) space and match the camera settings chosen through OpenGL, i.e., if the chosen OpenGL camera frame exhibits an off-axis frustum, so will the convex hull of the set of camera rays. The procedure is summarized in Fig. 2 (reprinted with permission from [Zel14]).
5.4 VR User Interface
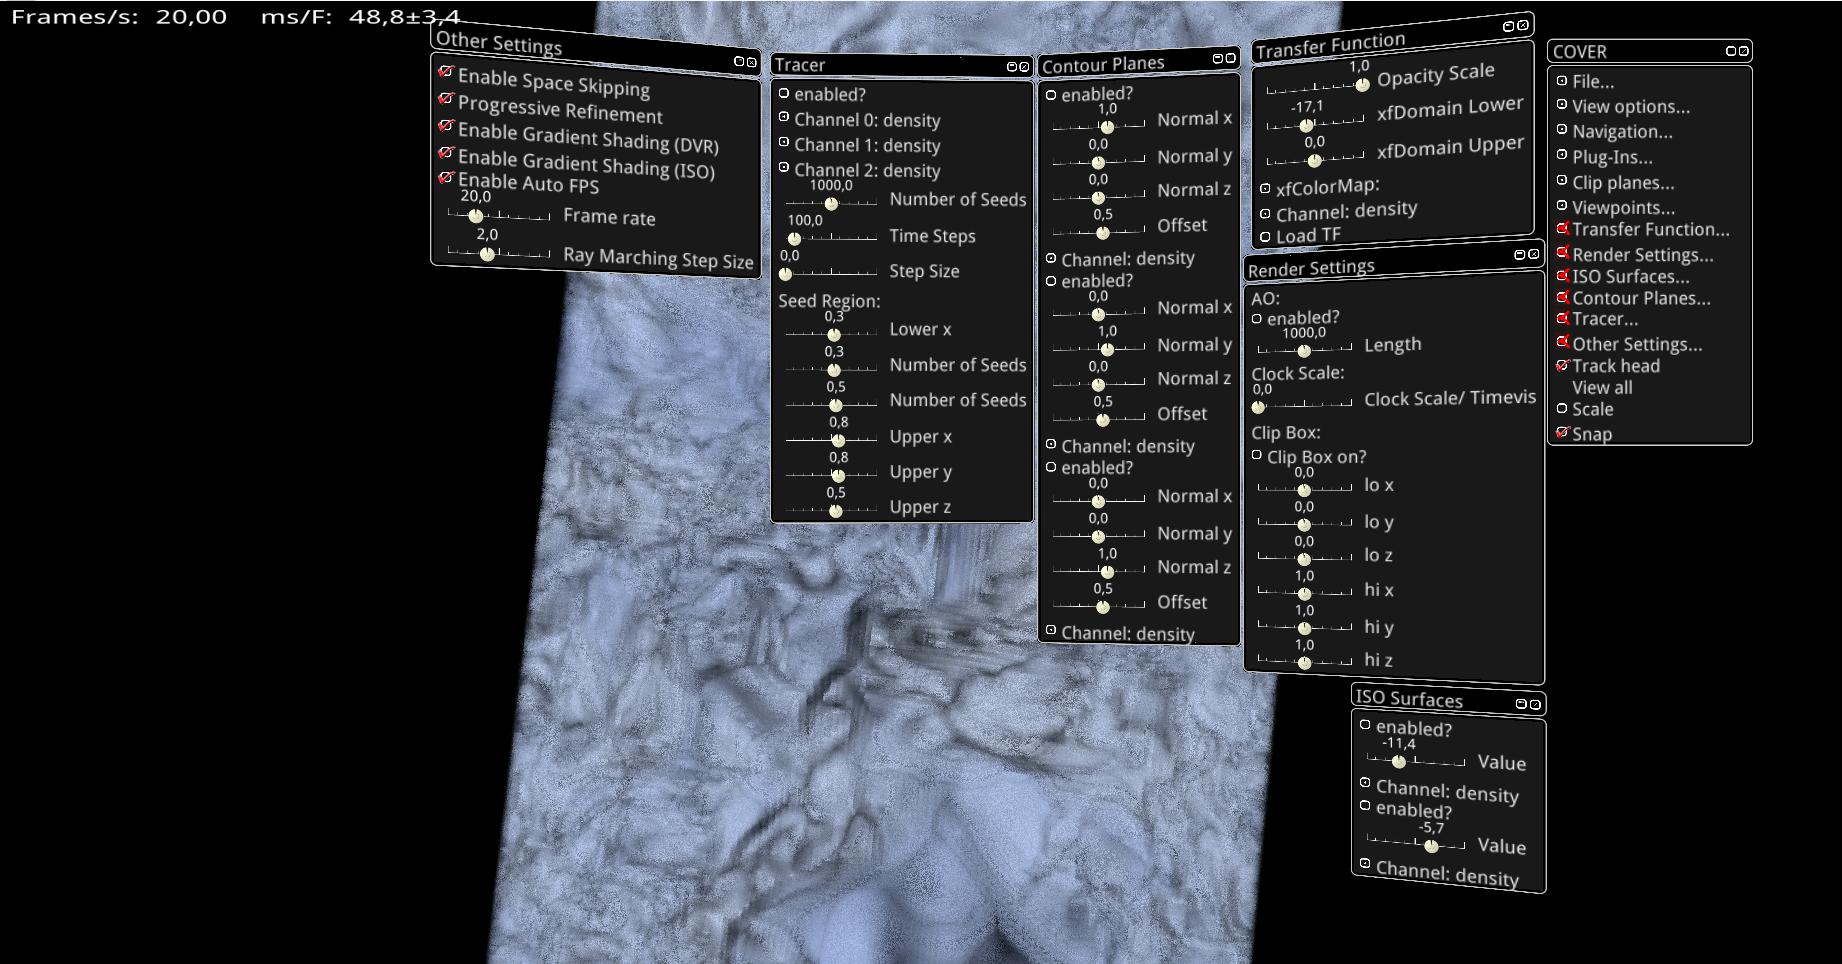
To allow for user interaction with the AMR data in the CAVE, we expanded the functionality of the VR menu within the OpenCOVER interface by incorporating comprehensive menus and submenus. These menus largely mirror the menu structure and user interface of the exaViewer program. Typical tasks exposed through the user interface include setting opacity scale, fine-tuning of iso-surface and contour plane parameters, and toggling rendering options. An overview of the menu structure is given in Fig. 3. In the CAVE environment, these menus are manipulated using the “Flystick 2” input device.
6 Results
We performed a quantitative evaluation to assess what quality settings can be achieved while still retaining interactive framerates for VR. For the evaluation we use the following hardware and software setup: five-sided CAVE, in size, using back projection active stereo (1600 1600 pixels per left and right eye, each frame is delivered by a separate GPU). An ART infrared tracker is used for the head position and pointing device (“Flystick 2”). The system is powered by ten NVIDIA Quadro RTX 6000 GPU (Turing generation) with 24 GB GDDR memory, as well as Intel Xeon Gold 6130 CPUs @ 2.10GHz, with 128 GB RAM each. The software environment used is based on Ubuntu Linux 20.04, NVIDIA driver version 525.125.06, CUDA 12.0, and NVIDIA OptiX 7.0.

We have tested the performance of the plugin on two AMR data sets: a) SILCC Molecular Cloud data set: as presented in [GWN∗16], converted to the cells and scalar format using the FLASH converter coming with ExaBrick [WZU∗21]. b) LANL Meteor Impact: Meteor impact simulation data set (at time t=46,112s) produced by Gisler et al. at Los Alamos National Laboratory (LANL) [PST∗16] using the xRage simulation code [GWC∗08].
| data set | # Cells | # Bricks | # ABRs | Size on Disc |
|---|---|---|---|---|
| SILCC | 15.8 M | 40 | 191 | 363 MB |
| Impact | 283 M | 3.1 M | 77.1 M | 6.5 GB |
Statistics for these data sets are found in Table 1. We picked two reprentative viewports (one zoomed-in view, and a zoomed-out overview where the camera is moved outside the scene bounds) depicted in Fig. 4.
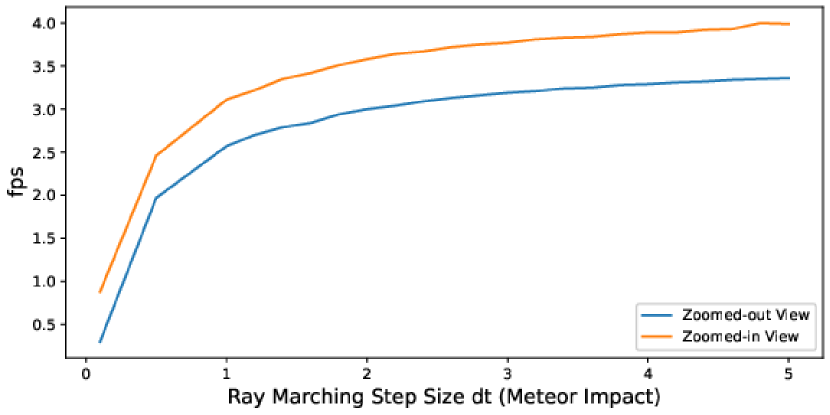
We are interested in the sampling quality—represented by the ray marching base step size —that can be achieved while retaining real-time framerates. Since ExaBrick employs adaptive sampling, serves as a scaling factor rather than an absolute step size; in cases where we sample an ABR with the finest resolution, e.g., means we are marching through that region with steps of size one; when sampling an ABR where the finest cells are from refinement level , means the step size is , etc. Also note that in the CAVE setup, the framerate will be limited by that of the slowest viewport, i.e., the framerates we report, in frames per second (fps), are that of the most costly frame in the whole setup of stereo views across the five CAVE projection planes.
For the molecular cloud data set, a total of 50 measurements were taken across the range of to . For the LANL meteor impact data set, 23 measurements were recorded spanning to . We report our results in Fig. 5.
The results suggest that the molecular cloud data set can be rendered at interactive rates (25 fps and higher) when setting base . This is encouraging, as on average, at this quality setting we will sample each cell exactly once. We also observe that the viewpoint dependency is neglible. We achieve relatively consistent framerates regardless which zoom level we choose. We observe diminishing returns on performance when choosing base , but note that the quality is impacted significantly at such low sampling rates.
For the LANL meteor impact, we observe similar scalability curves when varying base , with the same plateau at , yet we note that framerates are not interactive enough for virtual reality in the CAVE. The maximum framerate we achieve is about 3-4 fps; we only achieve higher framerates (not included in our measurements) when zooming out significantly; this points to future work on finding different trade-offs between quality and performance other than simply varying , or incorporating more sophisticated latency hiding techniques. We conclude that framerates depend largely on the size and complexity of the data set.
7 Discussion
The research presented in this paper makes several significant contributions to the field of real-time rendering of large AMR data in VR. Firstly, the developed ExaBrick plugin successfully enables the real-time visualization and exploration of complex AMR data sets, leveraging the VR visualization system of COVISE and interactive navigation techniques. The integration of ExaBrick as a COVISE plugin provides an efficient and scalable framework for rendering large-scale AMR data in VR environments. Additionally, the methods to adjust the ray marching step size guarantees a balanced trade-off between rendering speed and visual fidelity. Overall, this work offers scientists and researchers a powerful tool for exploring, analyzing and understanding complex AMR data sets.
While the implemented solution demonstrates promising results, it is important to acknowledge its limitations. One limitation is the performance impact when dealing with very large AMR data sets like the LANL Meteor data set, where further tests and optimization may be required to maintain real-time rendering performance. Our observations point to future work.
To overcome limitations with larger data sets, a sensible approach could be the use of level-of-detail techniques, so the sampling rate is not only chosen based on the local AMR level, but also on proximity to the viewing position. Other countermeasures might include latency hiding techniques that generate novel views from outdated frames while waiting for new frames to be rendered.
Future work may also involve improving the visual fidelity, though within the constraints that interactivity allows. It would, e.g., be interesting to incorporate global illumination techniques as in [ZWS∗22b]; however, as these techniques are notoriously expensive, would require even more aggressive optimization such as using Monte Carlo denoising techniques.
We finally note that both the original ExaBrick library, COVISE and OpenCOVER, as well as our plugin, are open source and published under the links provided above, allowing researchers to use our software in their own virtual environments.
8 Conclusion
In conclusion, the integration of the ExaBrick framework as a plugin within the COVISE visualization system provides a promising solution for real-time visualization of large AMR data sets in VR environments. The plugin demonstrates efficiency in rendering moderately sized data sets and offers interactive exploration experiences. While challenges with extremely large data sets remain, further optimizations and advancements in rendering techniques could enhance the plugin’s capabilities. Overall, the ExaBrick plugin stands as an important tool for immersive scientific visualization, with the potential to evolve further as technology progresses.
Acknowledgments
This work was supported by the Deutsche Forschungsgemeinschaft (DFG, German Research Foundation) under grant no. 456842964. We are grateful to the IT Center Cologne at the University of Cologne for generously granting us access to the CAVE VR environment. Our appreciation extends to the creators of the ExaBrick framework and COVISE for laying down robust foundations upon which this work was built.
References
- [BC89] Berger M. J., Colella P.: Local Adaptive Mesh Refinement for Shock Hydrodynamics. Journal of Computational Physics 82, 1 (1989), 64–84.
- [BO84] Berger M. J., Oliger J.: Adaptive Mesh Refinement for Hyperbolic Partial Differential Equations. Journal of Computational Physics 53, 3 (1984), 484–512.
- [BWG11] Burstedde C., Wilcox L. C., Ghattas O.: p4est: Scalable Algorithms for Parallel Adaptive Mesh Refinement on Forests of Octrees. SIAM Journal on Scientific Computing 33, 3 (2011), 1103–1133.
- [CGL∗09] Colella P., Graves D. T., Ligocki T., Martin D., Modiano D., Serafini D., Van Straalen B.: Chombo Software Package for AMR Applications Design Document. Available at the Chombo website: http://seesar. lbl. gov/ANAG/chombo/(September 2008) (2009).
- [CNSD∗92] Cruz-Neira C., Sandin D. J., DeFanti T. A., Kenyon R. V., Hart J. C.: The CAVE: Audio Visual Experience Automatic Virtual Environment. Commun. ACM 35, 6 (jun 1992), 64–72. URL: https://doi.org/10.1145/129888.129892, doi:10.1145/129888.129892.
- [GWC∗08] Gittings M., Weaver R., Clover M., Betlach T., Byrne N., Coker R., Dendy E., Hueckstaedt R., New K., Oakes W. R., et al.: The RAGE Radiation-Hydrodynamic Code. Computational Science & Discovery 1, 1 (2008), 015005.
- [GWN∗16] Girichidis P., Walch S., Naab T., Gatto A., Wünsch R., Glover S. C., Klessen R. S., Clark P. C., Peters T., Derigs D., et al.: The SILCC (SImulating the LifeCycle of molecular Clouds) project–II. Dynamical evolution of the supernova-driven ISM and the launching of outflows. Monthly Notices of the Royal Astronomical Society 456, 4 (2016), 3432–3455.
- [HSM∗18] Horan B., Sevedmahmoudian M., Mortimer M., Thirunavukkarasu G. S., Smilevski S., Stojcevski A.: Feeling Your Way Around a CAVE-Like Reconfigurable VR System. In 2018 11th International Conference on Human System Interaction (HSI) (2018), pp. 21–27. doi:10.1109/HSI.2018.8431365.
- [ICC23] IT Center Cologne I.: CAVE VR Environment at the University of Cologne, 2023. URL: https://rrzk.uni-koeln.de/en/hpc-projects/visualization/cave.
- [KHYD22] Koger C. R., Hassan S. S., Yuan J., Ding Y.: Virtual Reality for Interactive Medical Analysis. Frontiers in Virtual Reality 3 (2022), 782854.
- [KK19] Kalarat K., Koomhin P.: Real-time volume rendering interaction in Virtual Reality. International Journal of Technology 10, 7 (2019), 1307–1314.
- [KSH03] Kähler R., Simon M., Hege H.-C.: Interactive Volume Rendering of Large Sparse Data Sets Using Adaptive Mesh Refinement Hierarchies. IEEE Transactions on Visualization and Computer Graphics 9, 3 (2003), 341–351.
- [KWAH06] Kähler R., Wise J., Abel T., Hege H.-C.: GPU-assisted Raycasting for Cosmological Adaptive Mesh Refinement Simulations. In VG@ SIGGRAPH (2006), pp. 103–110.
- [MWUP20] Morrical N., Wald I., Usher W., Pascucci V.: Accelerating Unstructured Mesh Point Location With RT Cores. IEEE Transactions on Visualization and Computer Graphics PP (12 2020), 1–1. doi:10.1109/TVCG.2020.3042930.
- [NASN23] Nam J. W., Abram G. D., Samsel F., Navrátil P. A.: Immersive OSPRay: Enabling VR Experiences with OSPRay. In PEARC: Practice and Experience in Advanced Research Computing (PEARC 2023) (2023). preprint. URL: https://jungwhonam.github.io/images/publications/PEARC2023_Immersive-OSPRay.pdf, doi:10.1145/3569951.3597579.
- [PBD∗10] Parker S. G., Bigler J., Dietrich A., Friedrich H., Hoberock J., Luebke D., McAllister D., McGuire M., Morley K., Robison A., et al.: Optix: A General Purpose Ray Tracing Engine. Acm transactions on graphics (tog) 29, 4 (2010), 1–13.
- [PD09] Perret J., Dominjon L.: The INCA 6D: A Commercial Stringed Haptic System Suitable for Industrial Applications.
- [PST∗16] Patchett J., Samsel F., Tsai K. C., Gisler G. R., Rogers D. H., Abram G. D., Turton T. L.: Visualization and Analysis of Threats from Asteroid Ocean Impacts. Los Alamos National Laboratory (2016).
- [RFL∗98] Rantzau D., Frank K., Lang U., Rainer D., Wössner U.: COVISE in the CUBE: an Environment for Analyzing Large and Complex Simulation Data. In Proceedings of the 2nd Workshop on Immersive Projection Technology (1998), vol. 2001.
- [RLL∗96] Rantzau D., Lang U., Lang R., Nebel H., Wierse A., Ruehle R.: Collaborative and Interactive Visualization in a Distributed High Performance Software Environment. In High Performance Computing for Computer Graphics and Visualisation: Proceedings of the International Workshop on High Performance Computing for Computer Graphics and Visualisation, Swansea 3–4 July 1995 (1996), Springer, pp. 207–216.
- [SC03] Sherman W. R., Craig A. B.: Understanding Virtual Reality: Interface, Application, and Design. Wiley, 2003.
- [SCRL20] Sarton J., Courilleau N., Remion Y., Lucas L.: Interactive Visualization and On-Demand Processing of Large Volume Data: A Fully GPU-Based Out-of-Core Approach. IEEE Transactions on Visualization and Computer Graphics 26, 10 (2020), 3008–3021. doi:10.1109/TVCG.2019.2912752.
- [SDWWL01] Schulze-Döbold J., Wössner U., Walz S. P., Lang U.: Volume rendering in a virtual environment. In Immersive Projection Technology and Virtual Environments 2001: Proceedings of the Eurographics Workshop in Stuttgart, Germany, May 16–18, 2001 (2001), Springer, pp. 187–198.
- [SZD∗23] Sarton J., Zellmann S., Demirci S., Güdükbay U., Alexandre-Barff W., Lucas L., Dischler J.-M., Wesner S., Wald I.: State-of-the-art in Large-Scale Volume Visualization Beyond Structured Data.
- [WBUK17] Wald I., Brownlee C., Usher W., Knoll A.: CPU Volume Rendering of Adaptive Mesh Refinement Data. In SIGGRAPH Asia 2017 Symposium on Visualization (2017), pp. 1–8.
- [WCM12] Weber G. H., Childs H., Meredith J. S.: Efficient Parallel Extraction of Crack-Free Isosurfaces from Adaptive Mesh Refinement (AMR) Data. In IEEE Symposium on Large Data Analysis and Visualization (LDAV) (2012), IEEE, pp. 31–38.
- [WMHL65] Woodcock E., Murphy T., Hemmings P., Longworth S.: Techniques used in the GEM Code for Monte Carlo Neutronics Calculations in Reactors and Other Systems of Complex Geometry. In Proc. Conf. Applications of Computing Methods to Reactor Problems (1965), vol. 557, Argonne National Laboratory.
- [WML∗22] Wald I., Morrical N., Lacewell D., Pisha L., Amstutz J., Zellmann S.: OWL: A Node Graph "Wrapper" Library for OptiX 7, 2022.
- [WQ10] Wang R., Qian X.: OpenSceneGraph 3.0: Beginner’s Guide. Packt Publishing, 2010.
- [WWW∗19] Wang F., Wald I., Wu Q., Usher W., Johnson C. R.: CPU Isosurface Ray Tracing of Adaptive Mesh Refinement Data. IEEE Transactions on Visualization and Computer Graphics (2019).
- [WZU∗21] Wald I., Zellmann S., Usher W., Morrical N., Lang U., Pascucci V.: Ray Tracing Structured AMR Data Using ExaBricks. IEEE Transactions on Visualization and Computer Graphics 27, 2 (2021), 625–634.
- [Zel14] Zellmann S.: Interactive high-performance volume rendering. PhD thesis, University of Cologne, Aug. 2014.
- [ZSM∗22] Zellmann S., Seifried D., Morrical N., Wald I., Usher W., Law-Smith J., Walch-Gassner S., Hinkenjann A.: Point Containment Queries on Ray Tracing Cores for AMR Flow Visualization. Computing in Science Engineering (2022), 1–1. doi:10.1109/MCSE.2022.3153677.
- [ZWL17] Zellmann S., Wickeroth D., Lang U.: Visionaray: A Cross-Platform Ray Tracing Template Library. In 2017 IEEE 10th Workshop on Software Engineering and Architectures for Realtime Interactive Systems (SEARIS) (2017), pp. 1–8. URL: https://ieeexplore.ieee.org/document/9183547, doi:10.1109/SEARIS41720.2017.9183547.
- [ZWS∗22a] Zellmann S., Wald I., Sahistan A., Hellmann M., Usher W.: Design and Evaluation of a GPU Streaming Framework for Visualizing Time-varying AMR Data. In Eurographics Symposium on Parallel Graphics and Visualization (2022).
- [ZWS∗22b] Zellmann S., Wu Q., Sahistan A., Ma K.-L., Wald I.: Beyond ExaBricks: GPU Volume Path Tracing of AMR Data, 2022. arXiv:2211.09997.