A kinematic study of the disc-outflow system around a high-mass protostar G59.783+0.065 probed by methanol and water masers
Abstract
Class II CH3OH masers are used as a convenient tracer of disc-like structures in high-mass star formation. However, more than half of them show a complex distribution in Very Long Baseline Interferometry (VLBI) maps. The origin of such a complex distribution is still unknown. We conducted VLBI monitoring observations to unveil the origin of a complex class II CH3OH maser in the high-mass star-forming region G59.783+0.065. We observed the CH3OH maser at 6.7 GHz and the H2O maser at 22 GHz to probe detailed circumstellar kinematics and structures by the Japanese VLBI network and the VLBI Exploration of Radio Astrometry. We found similar bipolar distributions in both masers, specifically two clusters located 2000 au apart along the East-West direction. We detected a linear distribution of CH3OH masers in the Western cluster. A position-velocity diagram shows that the Western CH3OH masers trace a rotating disc-wind or infalling component inside an edge-on disc-like structure. In contrast to the simple bipolar expanding motions of the H2O masers, the CH3OH masers exhibited complex motions despite their spatial coincidence. Some of the Eastern CH3OH masers showed bipolar expansions similar to the H2O masers, while others displayed random or even inward motions. Such complex kinematics and their close association with the H2O maser could occur at the boundary between outflow and inflow. We suggest that the complex distribution of class II CH3OH masers, like G59.783+0.065 arises from several distinct circumstellar structures that simultaneously achieve maser excitation.
keywords:
masers - stars: massive - stars: formation - ISM: individual: G59.783+0.065 - ISM: jets and outflows - accretion, accretion discs1 Introduction
Growing evidence suggests that high-mass stars can form via mass accretion through a disc-like structure, thanks to the remarkable progress of high angular resolution observations in the last two decades (e.g., Cesaroni et al., 2007, 2017; Beltrán & de Wit, 2016).
Several important factors influence the stellar initial mass function (IMF), including the core mass function, outflow efficiency, and radiation feedback. The ultimate determination of stellar mass arises from disc fragmentation and subsequent mass accretion onto protobinary or multiples. Interferometric observations with resolutions high enough to image the circumstellar regions around distant young stellar objects are essential to study these processes and improve our knowledge of high-mass star formation (Zhao et al., 2020).
Recent observations have resolved several infalling envelopes and disc-like structures around a high-mass protostar by using the Atacama Large Millimeter/submillimeter Array (ALMA) (e.g., Ilee et al., 2018; Motogi et al., 2019; Zhang et al., 2019; Johnston et al., 2020; Tanaka et al., 2020; Sanna et al., 2021). These observations have already indicated variations in the physical properties of disc-like structures, including their size, age, gravitational stability, and more. However, the current sample size remains limited, making it challenging to ascertain whether these diversities arise from initial conditions or evolutionary processes.
Some interstellar masers are a powerful and convenient tool to investigate the three-dimensional structure and kinematics of disc-like structure and outflow in high-mass star-forming regions by using Very Long Baseline Intereferometry (VLBI). Class II CH3OH maser at 6.7 GHz (hereafter, we call it simply ‘CH3OH maser’ in this paper) is excited closer to high-mass protostars (100–1000 au) compared to, for instance, Class I CH3OH masers. Therefore, it is a tracer that can be potentially used to infer the stellar location, study the circumstellar kinematics, and its interaction with outflow gas ejected along the polar cavities. A growing number of studies reported internal proper motion measured by long-term VLBI monitoring (Sanna et al., 2010a, b; Goddi et al., 2011; Matsumoto et al., 2011; Moscadelli et al., 2011, 2013; Sawada-Satoh et al., 2013; Sugiyama et al., 2014, 2016; Bartkiewicz et al., 2020, etc.).
| Epoch (#) | 1 | 2 | 3 | 4 |
|---|---|---|---|---|
| Date (UT) | 2016 Feb. 10 | 2016 Mar. 18 | 2016 Apr. 18 | 2016 May. 24 |
| Duration (day) | 0 | 37 | 68 | 104 |
| Tracking centre | ||||
| Antennas | MIZ, IRK, OGA, ISG | |||
| Frequencya (MHz) | 22227–22243 | 22228–22244 | 22228–22244 | 22228–22244 |
| Spectral channels for the maser | 1024 | 1024 | 1024 | 1024 |
| Channel spacing (km s-1) | 0.21 | 0.21 | 0.21 | 0.21 |
| Image RMS 1 (Jy beam-1) | 0.122 | 0.264 | 0.087 | 0.308 |
| Beam size (mas2) | 1.25 × 0.75 | 1.25 × 0.75 | 1.25 × 0.73 | 1.26 × 0.74 |
| Calibrators | 3C345 (for fringe finder, bandpass), J1931+2243 (for phase) | |||
| a The frequency was changed at 2nd epoch for adjusting a Doppler correction caused by the earth orbital motion. | ||||
| Epoch (#) | 1 | 2 | 3 | 4 | 5 | 6 |
|---|---|---|---|---|---|---|
| Date (UT) | 2016 Aug. 25 | 2016 Oct. 31 | 2017 Jan. 22 | 2018 Nov. 22 | 2019 Jan. 11 | 2019 Apr. 30 |
| Duration (day) | 0 | 67 | 150 | 819 | 869 | 978 |
| Tracking centre | ||||||
| Antennas | MIZ, IRK, OGA, ISG, HIT, YMGa | |||||
| Frequency (MHz) | 6667–6669 | 6667–6669 | 6667–6669 | 6667–6671 | 6667–6671 | 6667–6671 |
| Spectral channels for the maserb | 512 | 1024 | 1024 | 4096 | 4096 | 4096 |
| Channel spacing (km s-1) | 0.176 | 0.088 | 0.088 | 0.044 | 0.044 | 0.044 |
| Image RMS 1 (Jy beam-1) | 0.02 | 0.07 | 0.15 | 0.35 | 0.71 | 0.34 |
| Beam size (mas2) | 4.76 × 3.09 | 3.94 × 2.09 | 4.96 × 3.24 | 4.99 × 3.08 | 5.00 × 3.09 | 4.66 × 2.89 |
| Calibrators | 3C454.3 (for fringe finder, bandpass), J1931+2243 (for phase) | |||||
| aNo YMG data were obtained at the sixth epoch. | ||||||
| b Spectral channels were increased by upgrades in the software correlator at the Mizusawa VLBI Observatory. | ||||||
This CH3OH maser shows several diverse distributions in VLBI maps, i.e., ‘ring (ellipse)’, ‘arc’, ‘linear’, ‘pair’ and ‘complex’ (Bartkiewicz et al., 2009). The first three distributions were historically claimed to simply trace rotating disc-like structures or part of them only (e.g., Norris et al., 1993, 1998; Phillips et al., 1998; Xu, 2001, etc.). Subsequently, more detailed observations showed complex scenarios combining either expanding and rotating motions, possibly associated with slow disc winds, or rotating and infalling motions (e.g., Sugiyama et al., 2014, 2015, 2016; Sanna et al., 2017; Bartkiewicz et al., 2018, 2020). This fact indicates that the CH3OH maser possibly traces more complex structure and kinematics near protostars than a previously considered.
However, the number fraction of these three types is only half of the CH3OH maser in statistical VLBI studies on 101 maser samples, which are compiled from the several VLBI surveys (Bartkiewicz et al., 2009, 2014, 2016; Fujisawa et al., 2014). Another half of the masers show a different distribution with respect to that expected in a disc-like structure, which can be otherwise classified as ‘pair’ and ‘complex’. Their physical origins are still unclear, and some CH3OH masers may be excited by a protostellar outflow (Minier et al., 2000, 2001; Moscadelli et al., 2011).
We have performed multi-epoch VLBI monitoring of the complex CH3OH maser sources in G59.783+0.065 (hereafter, G59). We have also observed the H2O maser at 22 GHz (hereafter, we simply call it ‘H2O maser’). We aimed to unveil the physical origin of the complex CH3OH maser, comparing the internal proper motions of two maser species. High-mass star-forming region G59 is also known as IRAS19410+2336. The trigonometric parallaxes indicate that G59 is located at a distance of 2.16 kpc from the Sun (Xu et al., 2009). The total infrared luminosity is (Martín-Hernández et al., 2008), which corresponds to a (proto)stellar mass range of 10–20 based on a stellar evolutionary model under high accretion rates (e.g., Hosokawa & Omukai, 2009; Hosokawa et al., 2010). Tanti et al. (2011) derived 10 through SED fitting.
The systemic velocity of the natal molecular clump is measured to be = 22.4 km s-1 based on CH3CN and H2CO lines from the hot core (Rodón et al., 2012). Here, indicates the line-of-sight (LoS) velocity with respect to the local standard of rest (LSR). Carral et al. (1999) detected a pair of radio continuum sources at 8 GHz by the Very Large Array (VLA). The CH3OH (Caswell et al., 1995a) and H2O (Lada et al., 1981) masers are associated with these centimetre continuum sources. Another class II CH3OH maser at 12.2 GHz is also associated (Caswell et al., 1995b).
Two dust clumps were detected by the IRAM 30m telescope, one in the North and another in the South, at 1.2 mm (Beuther et al., 2002). The brighter southern clump was found to consist of four sub-clumps identified by the Plateau de Bure Interferometer (PdBI) at 2.6 mm (Beuther et al., 2003), implying active cluster formation. Rodón et al. (2012) further resolved the clump containing the CH3OH and H2O masers using PdBI at 3 mm and 1.4 mm. The total clump mass was estimated to be 187 at 3 mm. Both masers are associated with a further sub-core referred to as ‘13-s’ at 1.4 mm, which has an estimated mass of 8 and likely represents an individual accretion envelope.
Beuther et al. (2003) detected a bipolar CO outflow around 13-s oriented in the East-West direction. Martín-Hernández et al. (2008) detected a near-infrared (NIR) ro-vibrational H2 line, which is a well-known outflow tracer, as well as NIR continuum emission scattered by the outflow cavity along the same NE-SW direction. This scattering emission was also observed at 3.6/4.5 m in IRAC data (Qiu et al., 2008). We presents a summary of the circumstellar environment in G59 region in Appendix A.
The LoS velocities () of the CH3OH masers range 14–27 km s-1. This velocity width of 13 km s-1 is among the group of sources with broader velocity widths found by Green et al. (2017, their Figure 5). The spectrum of the CH3OH maser exhibits a double-peaked profile with peaks at 19 and 27 km s-1. The CH3OH maser displayed sinusoidal-like variations before MJD 55650, where the relative amplitude varied factor of 2. On the other hand, the peak flux remained almost stable at around 20 Jy during the quiescent phase (Goedhart et al., 2004; Szymczak et al., 2018).
There are several interferometric images of class II CH3OH masers. Minier et al. (2000) imaged 12 GHz CH3OH masers using the Very Long Baseline Array (VLBA) in January 1999. The 6.7 GHz CH3OH masers were observed twice, once by the Multi-Element Radio Linked Interferometer Network (MERLIN) on December 31, 2004 (Darwish et al., 2020) and again by the European VLBI Network (EVN) on March 13, 2010 (Bartkiewicz et al., 2014). A consistent ‘pair’ of maser clusters, separated by 2000 au (900 milliarcseconds: mas) along the E-W direction, was observed in both the EVN and MERLIN data. We note that while the overall distribution is classified as a ‘pair’, each maser cluster exhibits a ‘complex’ distribution. Darwish et al. (2020) also conducted imaging observations of the H2O maser by (e-)MERLIN. However, no reports of internal proper motion have been made for either the CH3OH or H2O masers.
This paper reports new proper motion measurements for these masers, using the Japanese VLBI Nerwork (JVN) and the VLBI Exploration of Radio Astrometry (VERA). We have compared the kinematics of two maser species to study the origin of the complex CH3OH maser. We also report our interpretation in terms of a disc-outflow system.
2 Observations and data reduction
2.1 VERA observation
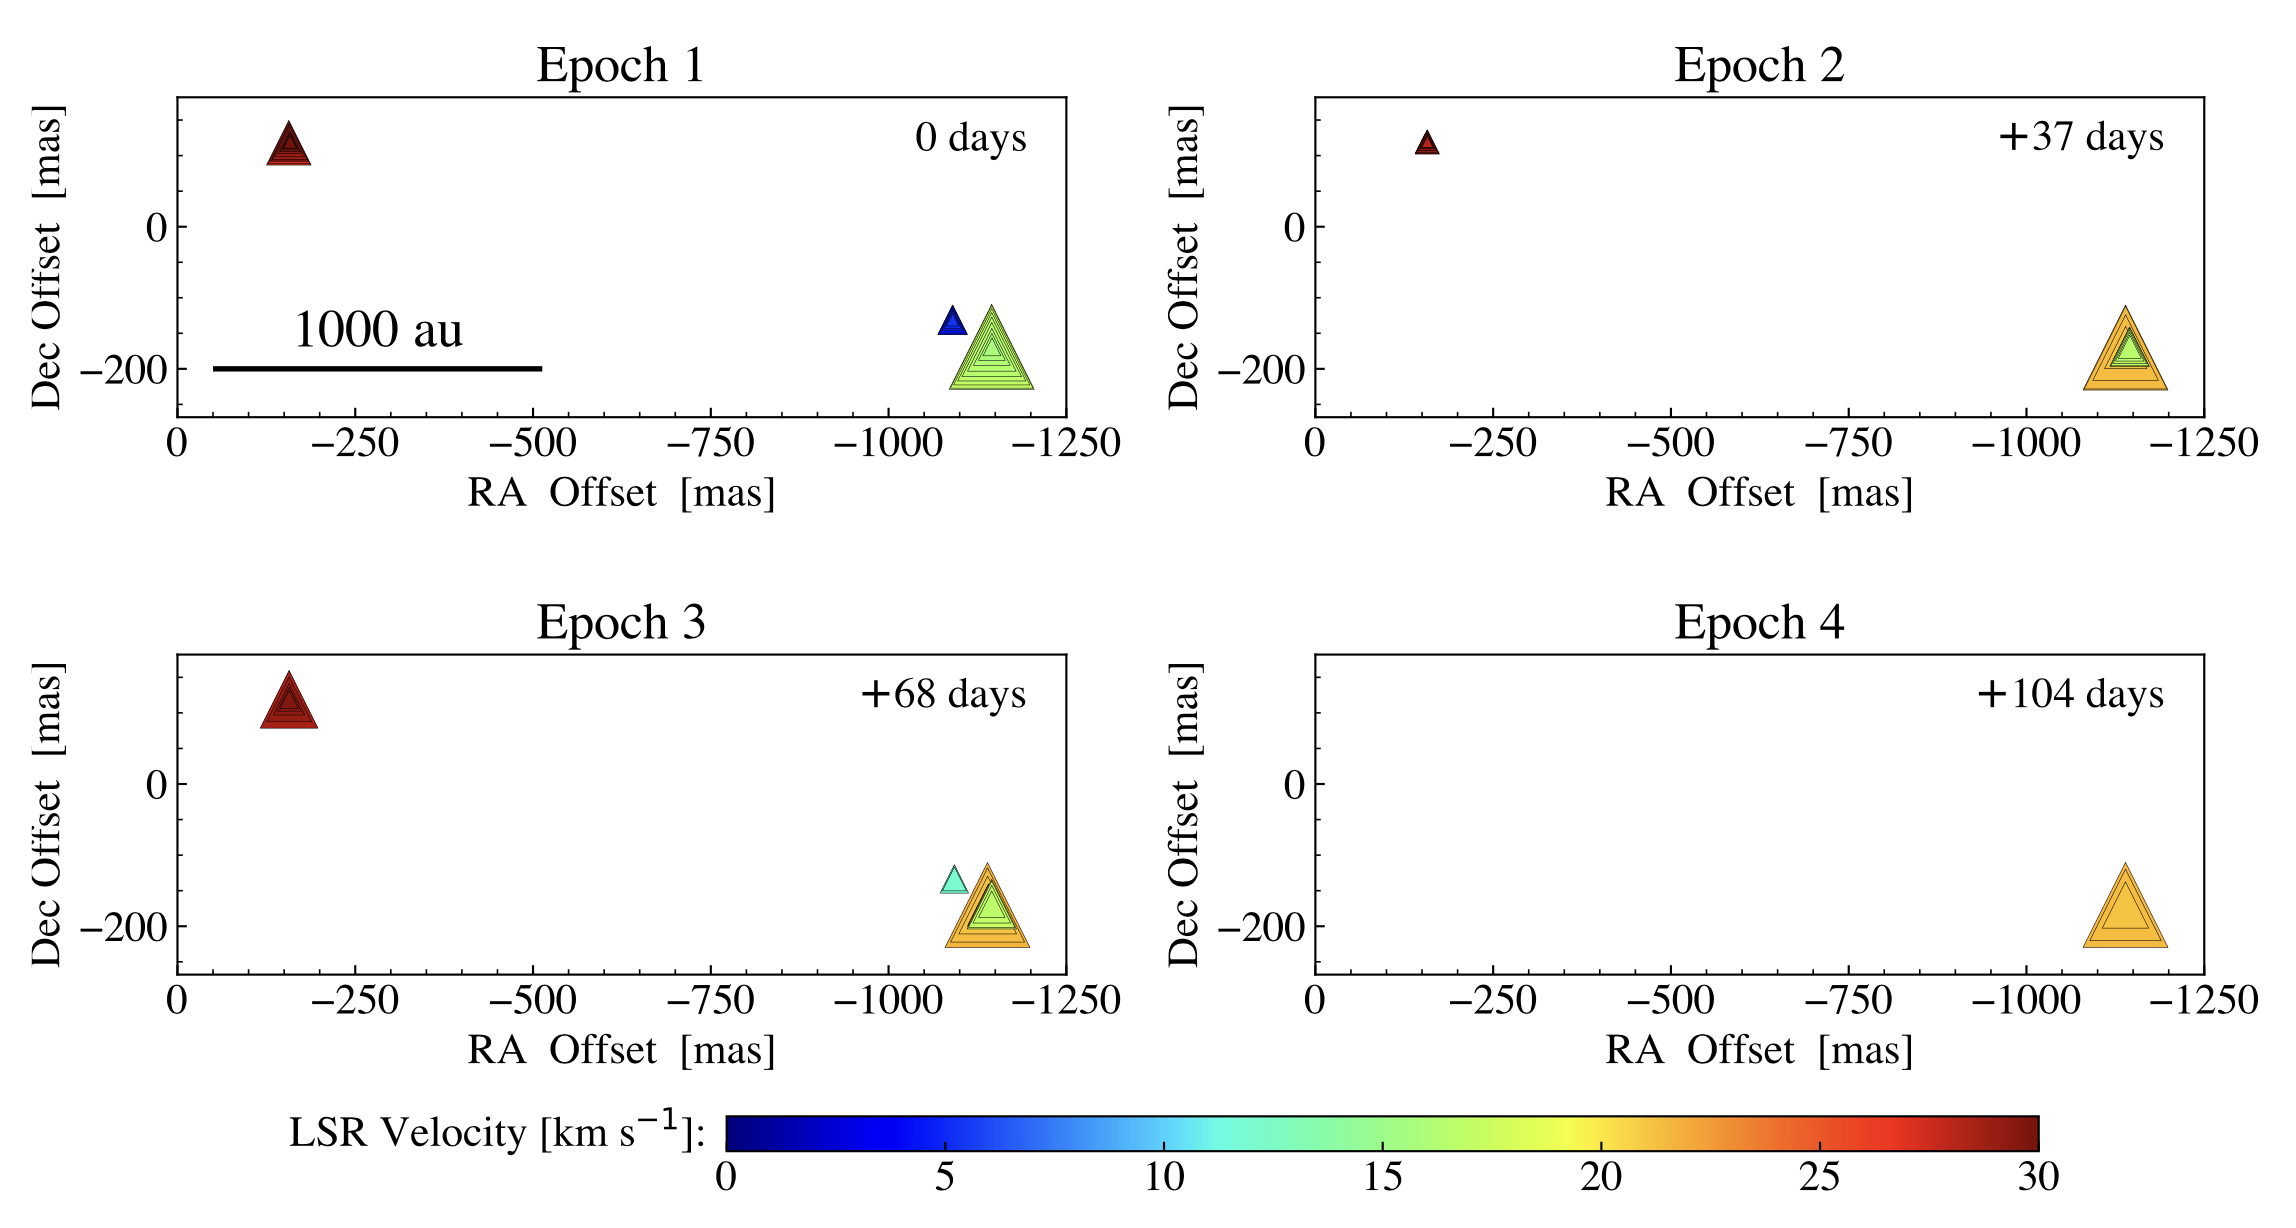
The H2O maser transition (Kc = ) at 22.23508 GHz was monitored monthly from February to May 2016 using VERA, which includes four VLBI stations: Mizsawa (MIZ), Iriki (IRK), Ogasawara (OGA), Ishigaki (ISG). Table 1 summarises our VERA observations. There were four epochs during 104 days. The baseline length ranged from 1018 km (IRK-ISG) to 2270 km (MIZ-ISG), providing a beam size of 1 mas ( 2 au at a distance of 2.16 kpc).
All of the observations were conducted in the 1-beam mode. We scanned 3C345 10 min every 1.5–2.0 hours as a fringe finder and bandpass calibrator. We performed phase-referencing VLBI in switching mode, employing J1931+2243 as a phase calibrator that was 2.89 apart from G59. The cycle time was set to 100 sec (30 sec for G59, 60 sec for J1931+2243, and 5 sec for slew time). The typical flux density of J1931+2243 was ranged from 0.3 to 0.4 Jy, providing sufficient brightness for accurate determination of interferometric delay, rate, and phase within 1-min integration. The total on-source time for G59 was about 75 min.
Left-handed circular polarised (LHCP) signals were quantised by 2-bit sampling and recorded on hard disc devices at 1 Gbps. Correlation processing was carried out using the software correlator developed at the National Astronomical Observatory of Japan (NAOJ) Mizusawa campus. We obtained a total 256-MHz wide bandwidth, which was divided into 16 IFs of 16 MHz each. One of these IFs was dedicated to the maser, while the remaining 15 IFs were used for calibrators. The single 16-MHz IF for the maser was divided into 1024 channels, providing a channel spacing of 0.21 km s-1 for all epochs.
The absolute position of the brightest H2O maser spot of 17.36 km s-1 at the first epoch was = ). Unfortunately, a phase-referenced image was obtained only at the first epoch. This is mainly due to insufficient atmospheric calibrations since the separation angle between J1931+2243 and G59 is larger compared to the usual cases of VERA astrometry in the dual beam system (Honma et al., 2008). The uncertainty in this position is better than 1 mas, taking into account errors in baseline length, thermal image noise, and atmospheric phase fluctuations (e.g., Motogi et al., 2011). We note that this uncertainty does not include the error in absolute position of the phase calibrator. This could be a potential source of systematic error.
| Clustera | Name | b | c | b | RAd | DECd | Number of maser spots in each epoch | |||||
| (km s-1) | (km s-1) | (Jy) | (mas) | (mas) | ep1 | ep2 | ep3 | ep4 | ep5 | ep6 | ||
| H2O maser features | ||||||||||||
| E | w-1 | 25.15 | 0.84 | 2.05 | -154.090 (0.017) | 116.476 (0.017) | 5 | 5 | 5 | - | ||
| E | w-2 | 27.47 | 2.11 | 7.46 | -156.833 (0.302) | 118.451 (0.487) | 11 | 7 | 4 | - | ||
| E | w-3 | 28.73 | 1.90 | 4.64 | -157.942 (0.197) | 119.277 (0.146) | 10 | 8 | 9 | - | ||
| W | w-4 | 21.99 | 1.69 | 11.01 | -1139.334 (0.037) | -170.030 (0.054) | 9 | 11 | 9 | 4 | ||
| W | w-5 | 23.89 | 1.26 | 2.31 | -1139.992 (0.071) | -170.255 (0.019) | 7 | 6 | 7 | - | ||
| W | w-6e | 17.36 | 4.21 | 27.03 | -1144.981 (0.177) | -168.987 (0.084) | 21 | 18 | 8 | - | ||
| Short-lived features not used for proper motion measurements. | ||||||||||||
| W | w-a | 4.09 | 2.53 | 3.26 | -1090.073 (0.094) | -131.007 (0.076) | 13 | - | - | - | ||
| W | w-b | 20.73 | 0.63 | 1.07 | -1138.007 (0.063) | -170.908 (0.056) | 4 | 5 | - | - | ||
| W | w-c | 21.57 | 4.42 | 9.51 | -1140.543 (0.212) | -170.140 (0.190) | 22 | - | - | - | ||
| W | w-d | 11.90 | 0.63 | 1.27 | -1092.522 (0.033) | -133.430 (0.011) | - | - | 4 | - | ||
| W | w-e | 19.28 | 1.47 | 1.65 | -1140.316 (0.022) | -170.651 (0.096) | - | - | 8 | - | ||
| W | w-f | 19.28 | 1.69 | 1.17 | -1144.630 (0.169) | -168.793 (0.079) | - | - | 9 | - | ||
| CH3OH maser features | ||||||||||||
| E | m-1e | 19.25 | 1.06 | 19.01 | -0.121 (0.640) | -0.331 (0.600) | 7 | 12 | 9 | 19 | 19 | 21 |
| E | m-2 | 17.32 | 0.36 | 1.55 | -20.445 (0.140) | -6.197 (0.189) | 3 | 3 | 3 | 8 | 6 | 7 |
| E | m-3 | 17.14 | 0.53 | 2.13 | -25.529 (0.659) | -7.844 (0.236) | 4 | 3 | 3 | 5 | 8 | 9 |
| E | m-4 | 15.56 | 0.35 | 1.79 | -165.977 (0.168) | 135.722 (0.157) | 3 | 3 | 2 | 3 | 4 | 5 |
| E | m-5 | 24.70 | 1.23 | 1.97 | -260.561 (0.290) | 80.099 (2.385) | 8 | 13 | 11 | 26 | 27 | 32 |
| E | m-6 | 27.15 | 1.05 | 17.41 | -313.786 (0.594) | 83.363 (1.220) | 7 | 10 | 9 | 18 | 18 | 18 |
| W | m-7 | 16.97 | 0.53 | 1.72 | -1003.316 (0.513) | -268.261 (0.368) | 4 | 8 | 2 | 2 | - | - |
| W | m-8 | 20.13 | 0.53 | 1.31 | -1009.536 (0.162) | -273.207 (0.053) | 4 | 5 | 3 | 4 | - | - |
| W | m-9 | 19.78 | 0.35 | 1.32 | -1018.565 (0.023) | -263.700 (0.471) | 3 | 6 | - | - | 13 | 13 |
| W | m-10 | 15.39 | 0.87 | 5.80 | -1026.592 (0.161) | -217.186 (0.288) | 6 | 12 | 8 | 13 | 14 | 14 |
| W | m-11 | 14.69 | 0.35 | 0.87 | -1029.893 (0.553) | -213.909 (0.542) | 3 | 5 | - | 13 | 12 | 16 |
| W | m-12 | 19.43 | 0.53 | 1.23 | -1114.213 (0.214) | -83.831 (0.184) | 4 | - | 3 | 5 | 6 | - |
| W | m-13 | 19.60 | 0.70 | 1.52 | -1125.450 (1.538) | -71.219 (1.108) | 5 | 5 | (1)f | 12 | 12 | 14 |
| W | m-14 | 19.95 | 0.70 | 3.12 | -1136.994 (0.595) | -64.560 (0.754) | 5 | 5 | 8 | 6 | 7 | 2 |
| Short-lived features not used for proper motion measurements. | ||||||||||||
| W | m-a | 15.39 | 0.53 | 0.69 | -1043.648 (1.006) | -222.300 (0.481) | 4 | - | - | - | - | - |
| E | m-b | 15.55 | 0.09 | 10.15 | -1013.129 (0.168) | -192.151 (0.058) | - | - | - | - | 3 | - |
| E | m-c | 20.18 | 0.13 | 2.89 | 78.740 (0.312) | 185.986 (0.186) | - | - | - | - | - | 4 |
| a E: Eastern cluster, W: Western cluster. | ||||||||||||
| b and flux density of the peak maser spot in each maser feature. | ||||||||||||
| c Total velocity ranges of spectral channels where maser spots were detected. | ||||||||||||
| d Relative coordinate of maser features (see main text). The parenthesis values indicate positional errors in mas. | ||||||||||||
| e The brightest maser features used for the phase-referencing and self-calibration. | ||||||||||||
| f Only single spot was detected for m-13 feature at the third epoch. This spot was ignored in any analysis in this paper. | ||||||||||||
| Epoch | 1 | 2 | 3 | 4 |
|---|---|---|---|---|
| Relative RA (mas) | -648.862 | -648.870 | -648.562 | - |
| Relative Dec (mas) | -24.843 | -24.734 | -24.821 | - |
| Note: Barycentre cannot be calculated in the fourth epoch (see main text). | ||||
2.2 JVN observation
The CH3OH maser transition at 6.668519 GHz ( = ) has been monitored by the six JVN stations (Hitachi: HIT, Yamaguchi: YMG, and four VERA stations) from August 2016 to April 2019. Table 2 summarises the details of our JVN observations. There were a total of six epochs of observations conducted over 978 days. The observations were carried out approximately once every 3–4 months, except for the third and fourth epochs, which had a separation of around 22 months between them. No data were obtained in the YMG station at the sixth epoch because of instrumental trouble. The baseline lengths in these observations ranged from 293 km (IRK-YMG) to 2270 km (MIZ-ISG), providing a beam size of 3 mas ( 6 au at 2.16 kpc).
The data recording and correlation procedure for the JVN observations were the same as in the VERA observations, but at a higher data rate of 2 Gbps. We used a single 512-MHz wide IF for the calibrators with coarse 1-MHz channel spacing. The detailed spectral setup for the maser varied depending on the observing epoch (see Table 2). We used another 2 or 4-MHz narrow IF for the maser. The spectral channels were ranged from 512 to 4096, resulting in channel spacing of 0.044–0.176 km s-1.
We scanned 3C454.3 for 10–15 min as a fringe finder and bandpass calibrator. We performed phase-referencing VLBI in switching mode by using the phase calibrator J1931+2243 again. The cycle time was set to 180 sec (60 sec for each source and 30 sec for slew time). The total on-source time for G59 was about 120 min.
We note that the phase-referencing for the CH3OH maser also succeeded only at the first epoch. This is also attributed to the atmospheric conditions, particularly due to insufficient ionospheric corrections. The absolute position of the brightest CH3OH maser of 19.25 km s-1 at the first epoch was determined to be = ). The positional accuracy is also estimated to be better than 1 mas, similar to the case of 22 GHz maser. The positional error of phase calibrator was not taken into account again. This CH3OH maser spot has offsets of (+1145 mas, +169 mas) relative to the phase-referenced H2O maser spot. Considering the absolute positions of the referenced spots for both H2O and CH3OH masers, we present maps of their relative positions in this paper, with the referenced CH3OH maser centred at the origin.
| Epoch | 1 | 2 | 3 | 4 | 5 | 6 |
|---|---|---|---|---|---|---|
| Relative RA (mas) | -606.431 | -606.586 | -606.514 | -607.833 | -607.770 | -608.116 |
| Relative Dec (mas) | -46.702 | -46.890 | -46.910 | -46.416 | -46.393 | -46.240 |
| Clustera | Name | |||||||||||
|---|---|---|---|---|---|---|---|---|---|---|---|---|
| (mas yr-1) | (mas yr-1) | (km s-1) | (km s-1) | (km s-1) | (km s-1) | |||||||
| H2O masers | ||||||||||||
| E | w-1 | 3.840 | 0.324 | -1.068 | 0.300 | 39.3 | 3.3 | -10.9 | 3.1 | 40.8 | 4.5 | 2.75 |
| E | w-2 | 1.092 | 0.588 | 0.372 | 1.188 | 11.2 | 6.0 | 3.8 | 12.2 | 11.8 | 13.6 | 5.07 |
| E | w-3 | 3.012 | 0.528 | -0.504 | 0.720 | 30.8 | 5.4 | -5.2 | 7.4 | 31.3 | 9.1 | 6.33 |
| W | w-4 | -0.516 | 0.204 | -0.888 | 0.360 | -5.3 | 2.1 | -9.1 | 3.7 | 10.5 | 4.2 | -0.41 |
| W | w-5 | -3.360 | 2.244 | 1.116 | 0.492 | -34.4 | 23.0 | 11.4 | 5.0 | 36.3 | 23.5 | 1.49 |
| W | w-6 | -2.040 | 0.960 | -0.108 | 0.276 | -20.9 | 9.8 | -1.1 | 2.8 | 20.9 | 10.2 | -5.04 |
| CH3OH masers | ||||||||||||
| E | m-1 | 0.554 | 0.022 | -0.238 | 0.056 | 5.671 | 0.230 | -2.442 | 0.578 | 6.174 | 0.622 | -3.15 |
| E | m-2 | 0.296 | 0.136 | 0.006 | 0.185 | 3.029 | 1.392 | 0.062 | 1.897 | 3.029 | 2.353 | -5.08 |
| E | m-3 | 0.242 | 0.099 | -0.098 | 0.084 | 2.480 | 1.017 | -1.004 | 0.863 | 2.675 | 1.333 | -5.26 |
| E | m-4 | -0.004 | 0.067 | 0.250 | 0.062 | -0.041 | 0.683 | 2.555 | 0.635 | 2.555 | 0.932 | -6.84 |
| E | m-5 | -0.030 | 0.062 | 0.141 | 0.048 | -0.306 | 0.636 | 1.439 | 0.494 | 1.471 | 0.805 | 2.30 |
| E | m-6 | -0.271 | 0.034 | 0.025 | 0.040 | -2.770 | 0.347 | 0.253 | 0.413 | 2.782 | 0.540 | 4.75 |
| W | m-7 | 0.254 | 0.277 | 0.367 | 0.117 | 2.599 | 2.835 | 3.760 | 1.197 | 4.571 | 3.077 | -5.43 |
| W | m-8 | 0.104 | 0.140 | -0.105 | 0.206 | 1.066 | 1.432 | -1.080 | 2.111 | 1.517 | 2.551 | -2.27 |
| W | m-9 | -0.321 | 0.024 | -0.091 | 0.044 | -3.283 | 0.245 | -0.930 | 0.446 | 3.412 | 0.509 | -2.62 |
| W | m-10 | -0.113 | 0.015 | 0.104 | 0.053 | -1.158 | 0.156 | 1.065 | 0.541 | 1.573 | 0.563 | -7.01 |
| W | m-11 | -0.159 | 0.106 | 0.035 | 0.080 | -1.628 | 1.083 | 0.361 | 0.824 | 1.667 | 1.360 | -7.71 |
| W | m-12 | -0.042 | 0.378 | -0.010 | 0.228 | -0.431 | 3.868 | -0.099 | 2.339 | 0.443 | 4.520 | -2.97 |
| W | m-13 | 0.523 | 0.141 | -0.646 | 0.106 | 5.356 | 1.446 | -6.613 | 1.085 | 8.510 | 1.808 | -2.80 |
| W | m-14 | -0.150 | 0.056 | -0.131 | 0.026 | -1.534 | 0.577 | -1.340 | 0.270 | 2.036 | 0.637 | -2.45 |
| a Total proper motions on the celestial plane. | ||||||||||||
| b Internal LoS velocities (). | ||||||||||||
2.3 Data Calibration by AIPS
We used the National Radio Astronomy Observatory (NRAO) Astronomical Image Processing System (AIPS: Greisen, 2003) software package for standard calibration and synthesis imaging.
The visibility amplitude was calibrated using the ‘ACCOR’ and ‘APCAL’ tasks at 22 GHz, with a measured system noise temperature () at each VERA station. At 6.7 GHz, was not available in the HIT and YMG stations. Therefore, we used the ‘ACFIT’ task for amplitude calibration in the ‘Template method’ instead of ‘APCAL’. We determined relative antenna gains by comparing the total power spectra of the maser. Then the flux was scaled, referencing at the IRK station. The fringe finders were used for calibrating clock offsets (‘FRING’) and bandpass responses (‘BPASS’). We then solved residual delay, rate, and phase using J1931+2243 by ‘FRING’ task. After applying Doppler correction using the ‘CVEL’ task, the phase-referenced image for the brightest maser spot was deconvolved using the ‘IMAGR’ task. We further calibrated the residual rate and phase using the ‘FRING’ task with the peak maser channel in each epoch to improve image quality for measuring internal proper motions. Finally, the phase and amplitude were self-calibrated using the brightest maser spots, combining the ‘IMAGR’ and ‘CALIB’ tasks. The minimum solution interval was 15 sec for the H2O maser and 30 sec for the CH3OH maser. All imaging and deconvolution (CLEAN algorithm) were done adopting natural weighting. We searched maser spots with a 7- detection limit. Parameters of detected maser spots were extracted by elliptical Gaussian fitting with the ‘JMFIT’ task.
We identified a maser ‘feature’, which is a physical gas clump emitting maser emission (e.g., Sanna et al., 2010a) based on the following criteria:
-
1.
A feature is a cluster of two or more maser spots within a few mas.
-
2.
The spots comprising the feature appear in successive spectral channels.
-
3.
The same feature was detected in at least three observing epochs.
The position of an identified maser feature was given by the error-weighted average of the constituent maser spots. Each feature was named using the following convention: We first set ‘w’ or ‘m’ depending on a maser species (w: water, m: methanol). Then we added a serial number if a maser feature satisfies all three criteria. Instead, an alphabet was given on a maser feature that does not satisfy the third criterion (i.e., it is not detected in at least three epochs). We did not use the latter ‘short-lived’ features for proper motion measurements.
In this paper, positions of H2O maser spots (and features) are presented as follows: First, we estimated the relative positions of maser spots with respect to the brightest maser spot used for self-calibration in each observing epoch. Then, we subtracted the constant offset of (+1145 mas, +169 mas) as mentioned above.
The positions of CH3OH maser spots are simply given as relative positions with respect to the brightest CH3OH maser spot in each epoch. The brightest CH3OH maser spots always belong to the identical CH3OH maser feature, including the phase-referenced spot at the first epoch. This fact means that the coordinate origins of both maser data matched at the first epoch, where the phase-referenced imaging was succeeded for both masers. Although the positions of H2O masers after the second epoch are not directly linked to the relative coordinate of CH3OH masers, it is still accurate enough to compare the overall distributions of two maser species.
3 Results
3.1 Masers distributions
We have detected 102, 60, 63, and 4 H2O maser spots in the first to fourth epoch, respectively. Figure 1 shows the spatial distributions of the detected H2O maser spots in each epoch.
| Type | CH3OH | CH3OH | CH3OH | H2O | H2O | H2O |
|---|---|---|---|---|---|---|
| Array | MERLIN | EVN | JVN | MERLIN | VERA | e-MERLIN |
| Observation date | 2004 Dec. 31 | 2010 Mar. 14 | 2016 Aug. 25 | 2005 Jan. 1 | 2016. Feb. 10 | 2019 Mar. 20 |
| Synthesised Beam (mas2) | 7045 | 6.53.8 | 4.763.09 | 2020 | 1.250.75 | 2928 |
| Channel spacing (km s-1) | 0.04 | 0.089 | 0.176 | 0.21 | 0.21 | 0.105 |
| 1 RMS (Jy beam-1) | 0.0346 | 0.006 | 0.02 | 0.0707 | 0.122 | 0.050 |
| Numbers of features (East:West)a | 20 (14:6) | 24 (10:14) | 14 (6:8) | 5 (0:5) | 6 (3:3) | 4 (0:4) |
| Referencesb | 1 | 2 | This work | 1 | This work | 1 |
| a Two parenthesis digits separated by comma show numbers of maser features in the Eastern and Western cluster, respectively. | ||||||
| b 1: (Darwish et al., 2020), 2: (Bartkiewicz et al., 2014). | ||||||
| a | RADEC (J2000.0) | ||||
| Species | Array | Year | (km s-1) | () | () |
| Brightest H2O maser features | |||||
| MERLIN | 2005 | 26.42 | |||
| VERA | 2016 | 17.36 | |||
| e-MERLIN | 2019 | 23.39 | |||
| Identical CH3OH maser features | |||||
| MERLIN | 2004 | 18.97 | |||
| EVN | 2010 | 19.13 | |||
| JVN | 2016 | 19.25 | |||
| a of the peak maser spots. | |||||
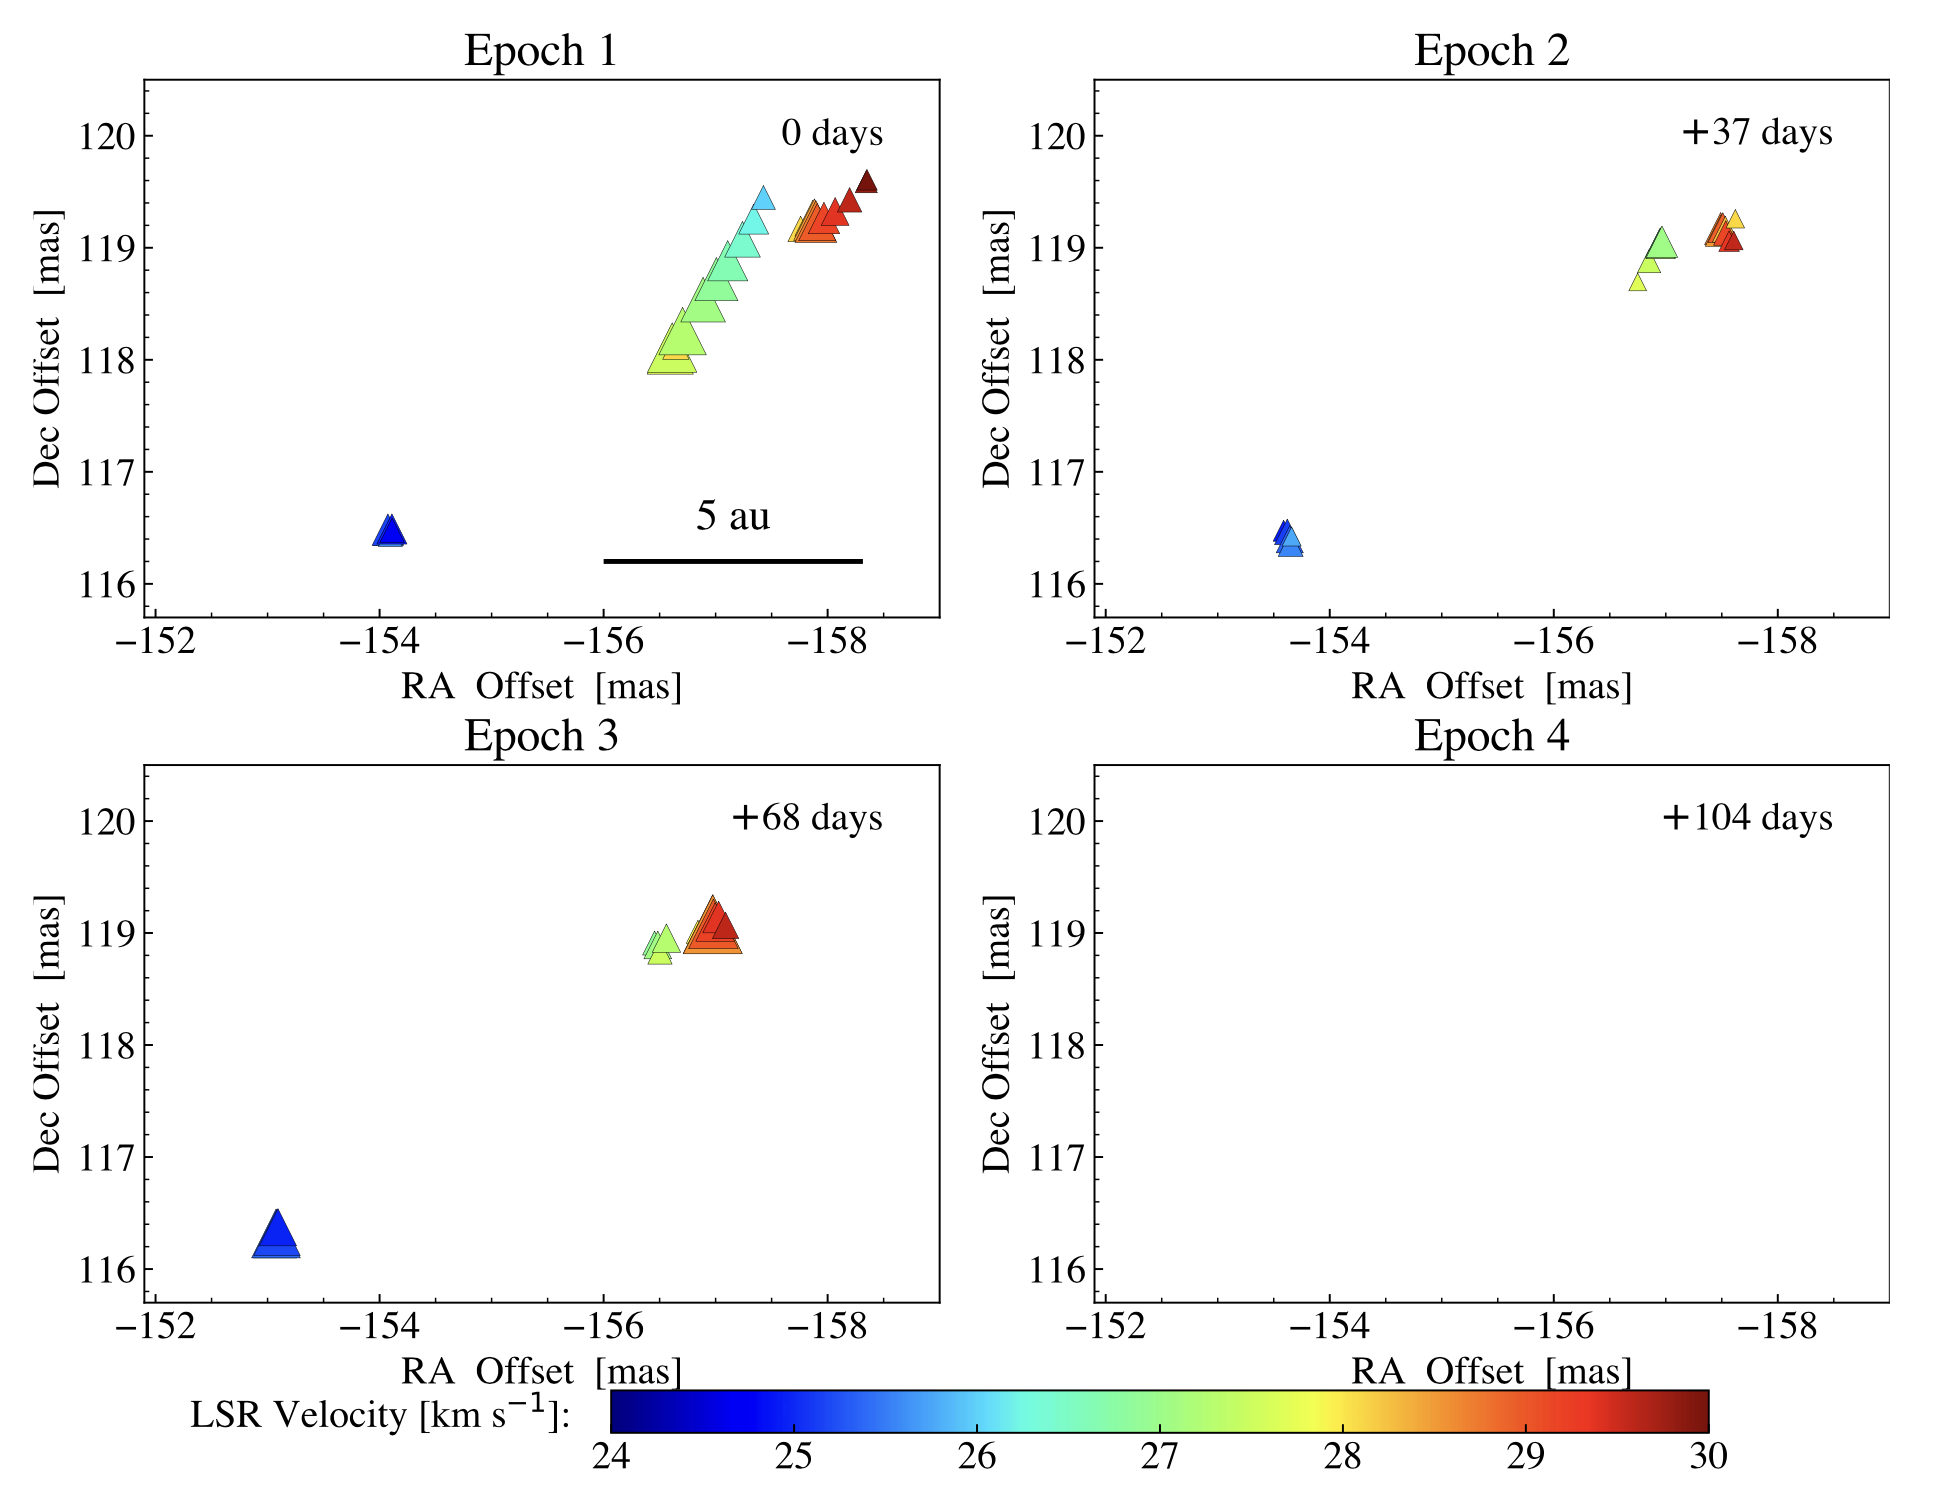
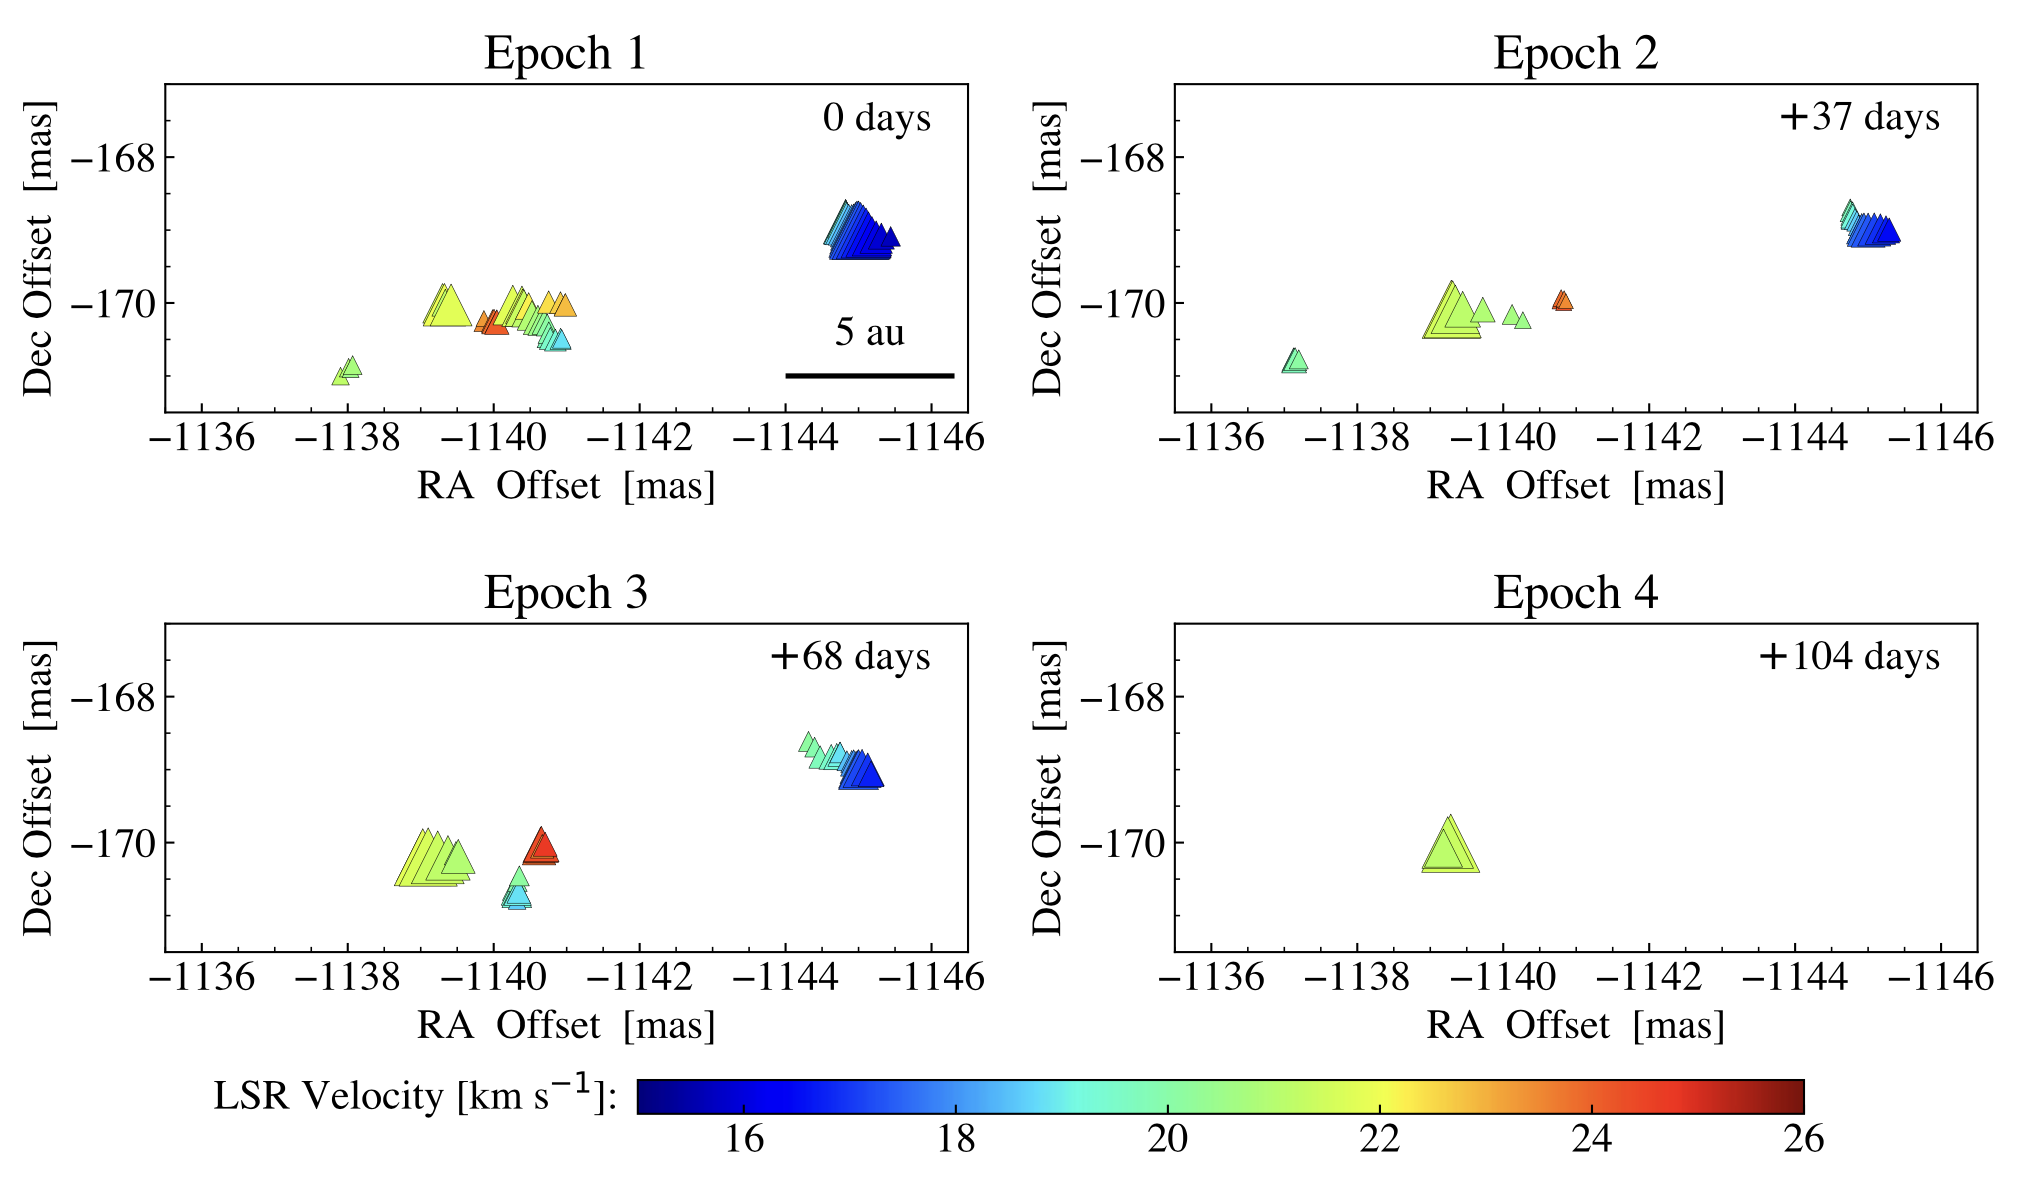
We found two maser clusters in the East and West, forming ‘pair’-like distribution in the initial three epochs. This pair-like distribution differed from the previous MERLIN data, which detected only the Western cluster (Darwish et al., 2020). In the fourth epoch, we observed a similar monopolar distribution as the Eastern cluster disappeared. We note that the Western maser spots also decreased in this epoch, leaving only a single maser feature detected. Since the phase-referenced H2O maser feature also disappeared, we estimated the relative position of the detected maser spots in the fourth epoch by extrapolating a measured proper motion (see below). Figure 2 and 3 shows a zoomed-up view of each maser cluster. Individual clusters show a mostly linear distribution along the SE-NW direction, which can be interpreted in terms of shock fronts caused by the NE-SW outflow, as seen on larger scales.
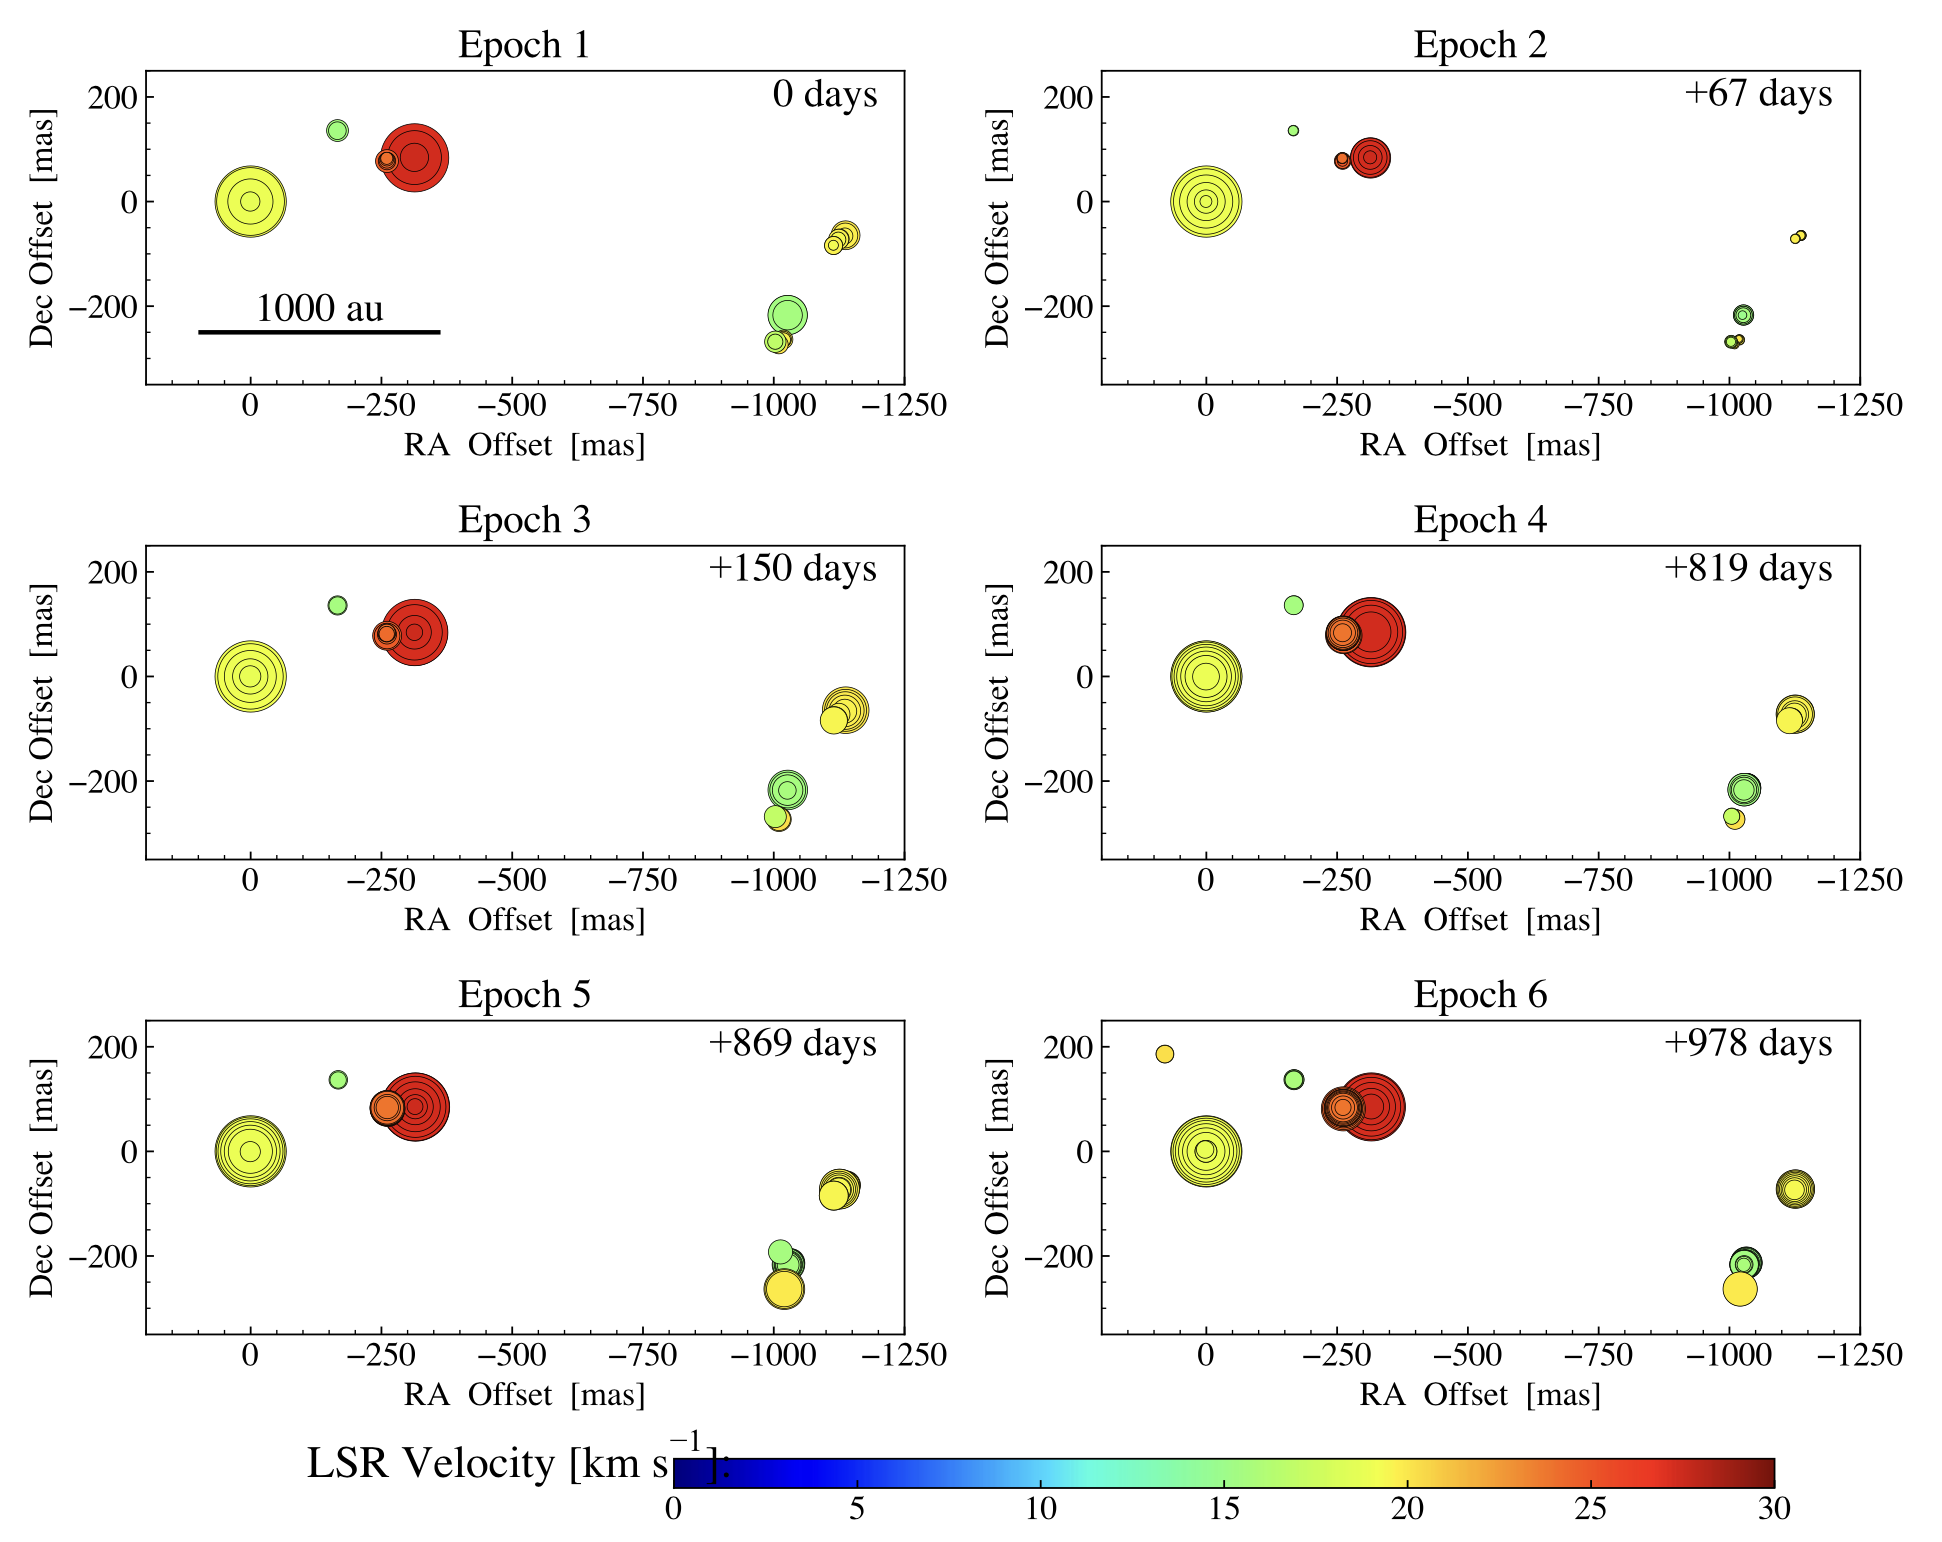
We have detected 72, 90, 62, 134, 149, and 157 CH3OH maser spots in the first to sixth epoch, respectively. Figure 4 presents the spatial distributions of the detected CH3OH maser spots in each epochs. The overall distribution remained stable throughout all the observing epochs, although some individual maser spots were short-lived. We found the E-W ‘pair’ distribution similar to the H2O masers. This pair distribution is consistent with the previous MERLIN and EVN data (Darwish et al., 2020; Bartkiewicz et al., 2014).
All the identified H2O and CH3OH maser features are listed in Table 3, with the measured parameters at the first epoch. The complete lists of parameters for all features are available in appendix C (see Table 12 and 13). We assumed that the single H2O maser feature in the fourth epoch was identical with w-4 feature, because of the similar LSR velocity. Three Eastern H2O features (w-1, 2, and 3) are closely located to a single CH3OH feature (m-4) within 20 mas, although they may be at different distances along the LoS since the physical conditions required for each maser species are different.
3.2 Internal proper motions
6 H2O and 14 CH3OH features were available for proper motion measurements. We estimated internal proper motions relative to the ‘barycentre’ (e.g., Sanna et al., 2010b; Sugiyama et al., 2016) since the absolute coordinate was obtained only in the first epoch of each maser species. We defined the barycentre of each maser species by using long-lived maser features which were detected in all the epochs, except for the fourth VERA epoch where only a single H2O maser feature was available. In each epoch, we first calculated two averaged positions, one for the Eastern maser cluster and another for the Western maser cluster, based on the detected maser features in each cluster. We then obtained the overall averaged position of the two clusters, avoiding any bias from the number of detected features in each cluster. This overall averaged position is referred to as the barycentre.
.
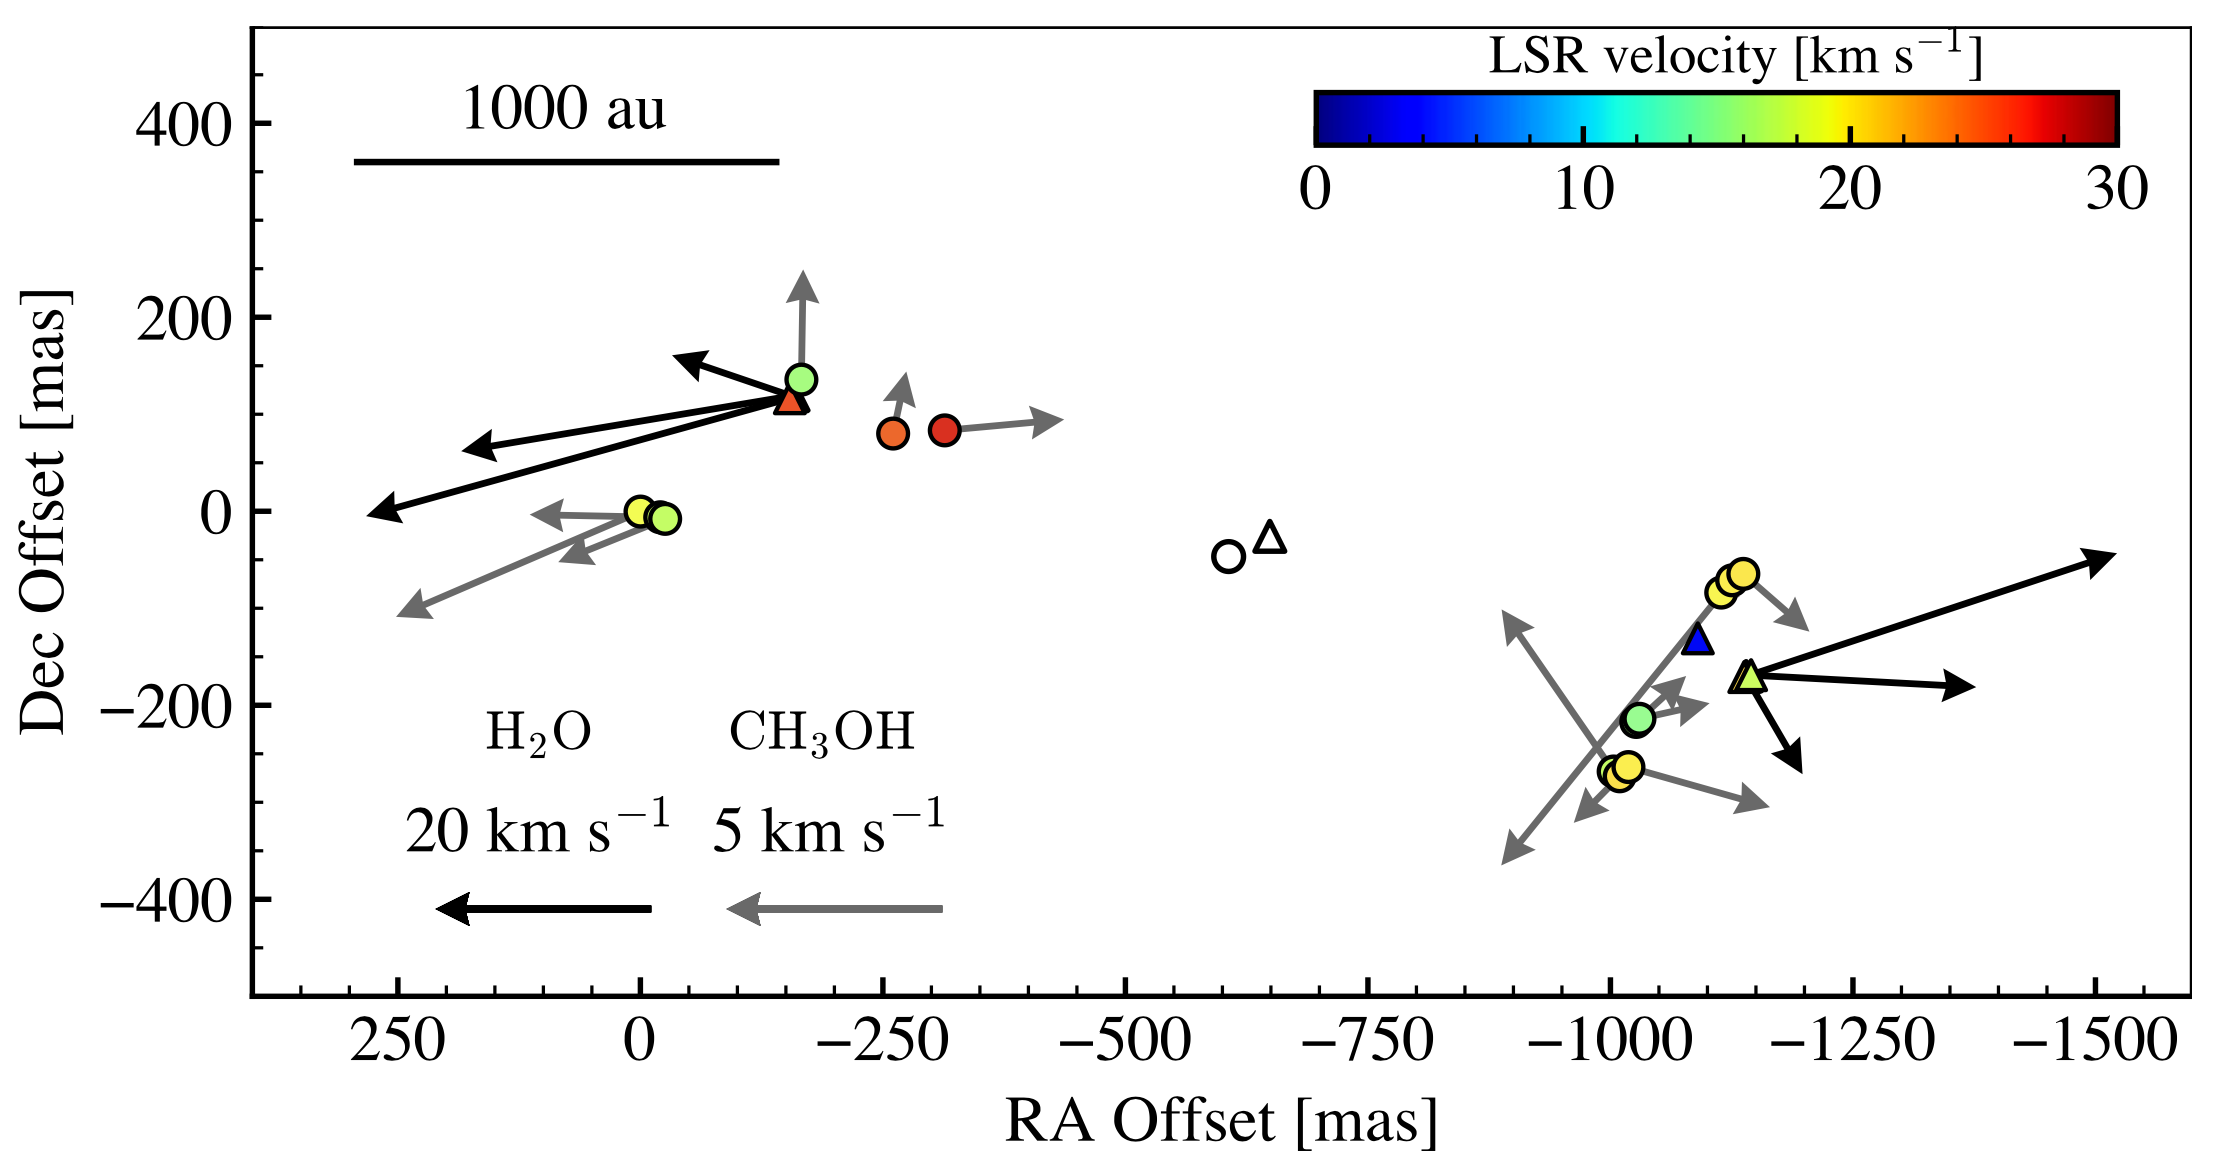
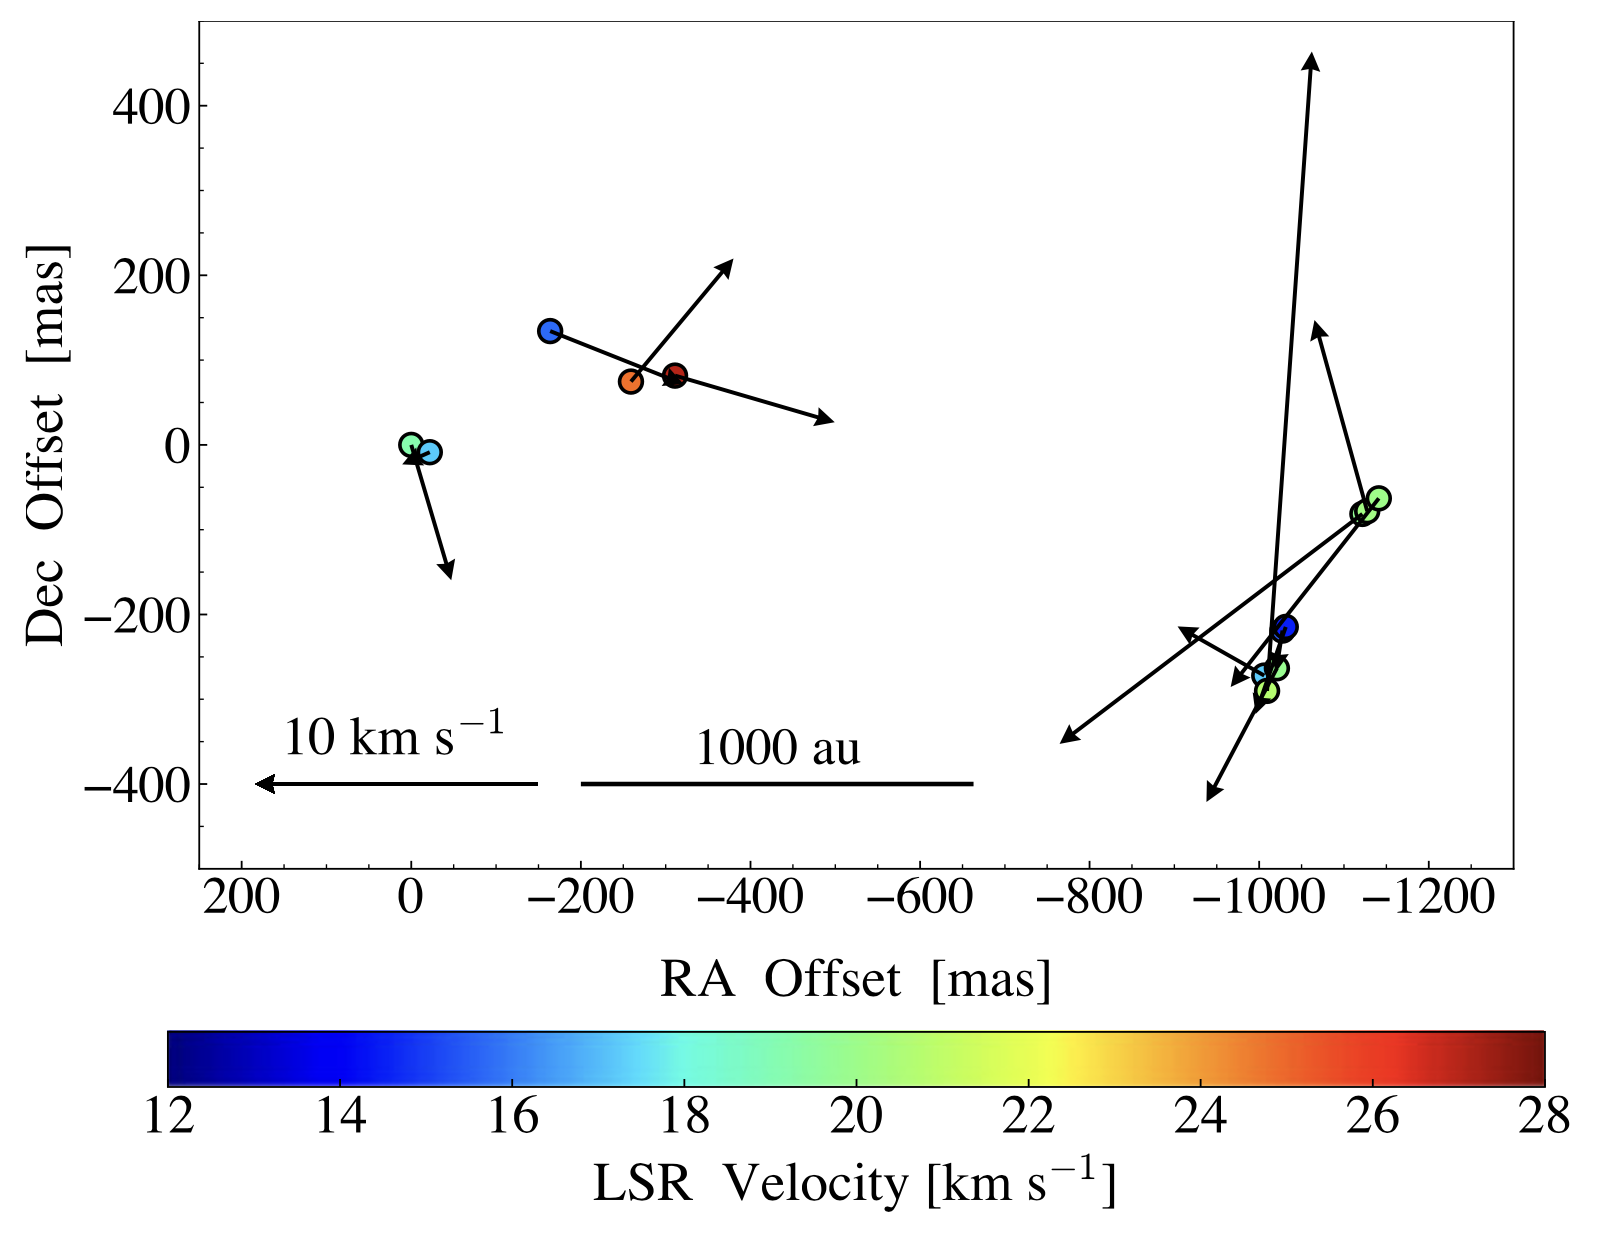
Table 4 and 5 list the barycentres in each epoch for the H2O and CH3OH masers, respectively. We note that the barycentres of H2O masers were estimated for the first three epochs, as only the Western cluster was detected in the fourth epoch. Linear proper motions of each maser feature in RA () and DEC () were estimated by the least-squares fitting, by aligning the barycentres measured at different epochs for each maser species separately. The estimated proper motions (, ), corresponding linear velocities (, ), total proper motion velocities (), and internal LoS velocities () are listed in Table 6. indicates the offsets of the LoS velocities from the systemic velocity (22.4 km s-1). A proper motion of 1 mas yr-1 corresponds to a linear velocity of 10.24 km s-1 at 2.16 kpc. We extrapolated the position of w-4 feature at the fourth epoch by using the proper motion in Table 6 as mentioned in section 3.1.
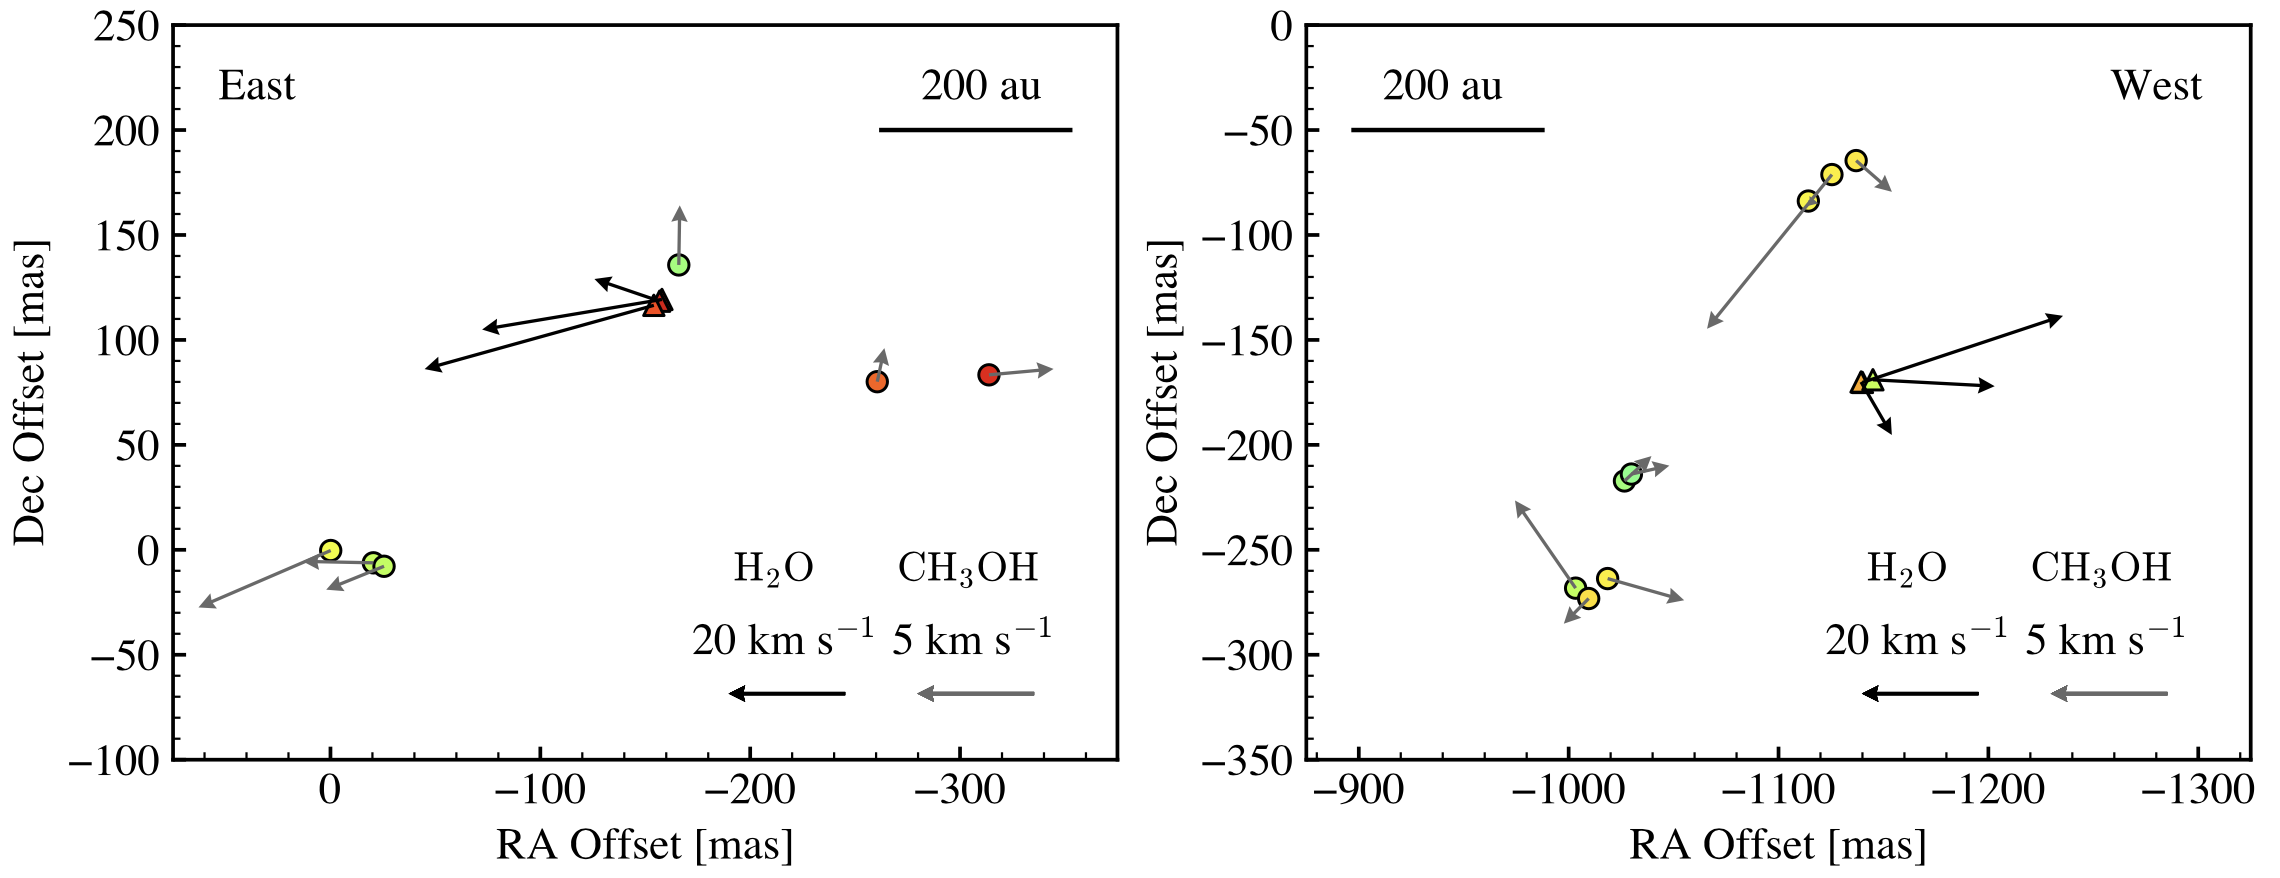
Figure 5 presents the estimated proper motions of each maser feature. We also showed a close-up view of the Eastern and Western clusters in Figure 6. The proper motions of H2O masers range from 10.5 to 40.8 km s-1 with an average of 25.3 km s-1. All six H2O features exhibit an expanding motion away from the barycentre in a NE-SW bipolar manner. This expanding motion indicates that the H2O masers in G59 trace the root of the bipolar outflow along the NE-SW direction, which was previously observed on a larger scale.
The proper motions of CH3OH masers range 0.4 to 8.5 km s-1, with an average of 3.0 km s-1. This velocity range is significantly slower than that of the H2O masers, despite both maser species exhibiting a similar bipolar distribution.
| Positional offsets | ||||||||||||||
| Name | JVN | EVN | MERLIN(MLN) | EVN - JVN | MLN- JVN | |||||||||
| RA | DEC | RA | DEC | RA | DEC | RA | DEC | RA | DEC | |||||
| (km s-1) | (mas) | (mas) | (km s-1) | (mas) | (mas) | (km s-1) | (mas) | (mas) | (mas) | (mas) | ||||
| m-1 | 19.25 | 1.06 | -0.121 | -0.331 | 19.13 | -19.003 | 27.284 | 18.97 | -30 | 40 | -19 | 28 | -30 | 40 |
| m-2 | 17.32 | 0.36 | -20.445 | -6.197 | 17.20 | -40.833 | 18.673 | 17.08 | -51 | 22 | -20 | 25 | -30 | 28 |
| m-3a | 17.06 | 0.53 | -25.529 | -7.844 | (-15) | (27) | (-25) | (30) | ||||||
| m-4 | 15.56 | 0.35 | -165.977 | 135.722 | 15.70 | -182.776 | 161.502 | - | - | - | -17 | 26 | - | - |
| m-5 | 24.70 | 1.23 | -260.561 | 80.099 | 24.75 | -278.049 | 101.954 | 24.46 | -288 | 110 | -17 | 22 | -28 | 30 |
| m-6 | 27.15 | 1.05 | -313.786 | 83.363 | 27.03 | -330.000 | 109.000 | 26.92 | -338 | 120 | -16 | 26 | -24 | 37 |
| m-7 | 17.06 | 0.53 | -1003.316 | -268.261 | 17.20 | -1025.021 | -244.759 | 16.95 | -1030 | -235 | -22 | 24 | -27 | 33 |
| m-8 | 20.22 | 0.53 | -1009.536 | -273.207 | 20.71 | -1028.311 | -262.858 | 20.60 | -1033 | -244 | -19 | 10 | -23 | 29 |
| m-9 | 19.78 | 0.35 | -1018.565 | -263.700 | 19.83 | -1039.908 | -236.120 | 19.67 | -1044 | -227 | -21 | 28 | -25 | 37 |
| m-10 | 15.48 | 0.87 | -1026.591 | -217.185 | 15.53 | -1046.508 | -191.663 | - | - | - | -20 | 26 | - | - |
| m-11 | 14.69 | 0.35 | -1029.893 | -213.909 | 14.56 | -1050.339 | -187.368 | - | - | - | -20 | 27 | - | - |
| m-12 | 19.52 | 0.53 | -1114.213 | -83.831 | 19.74 | -1140.734 | -54.106 | 19.72 | -1148 | -40 | -27 | 30 | -34 | 44 |
| m-13 | 19.78 | 0.70 | -1125.450 | -71.219 | 20.18 | -1146.398 | -50.881 | - | - | - | -21 | 20 | - | - |
| m-14 | 19.95 | 0.70 | -1136.994 | -64.560 | 20.01 | -1160.068 | -35.758 | - | - | - | -23 | 29 | - | - |
| a m-2 and m-3 could be identical with the same EVN/MERLIN features (see main text). | (i): Averaged offset | -20 | 24 | -28 | 35 | |||||||||
| (ii): Expected secular motion | 11 | 33 | 20 | 59 | ||||||||||
| (i) - (ii): Residuals | -31 | -11 | -48 | -24 | ||||||||||
4 Discussions
4.1 Comparison with the previous (e-)MERLIN and EVN data
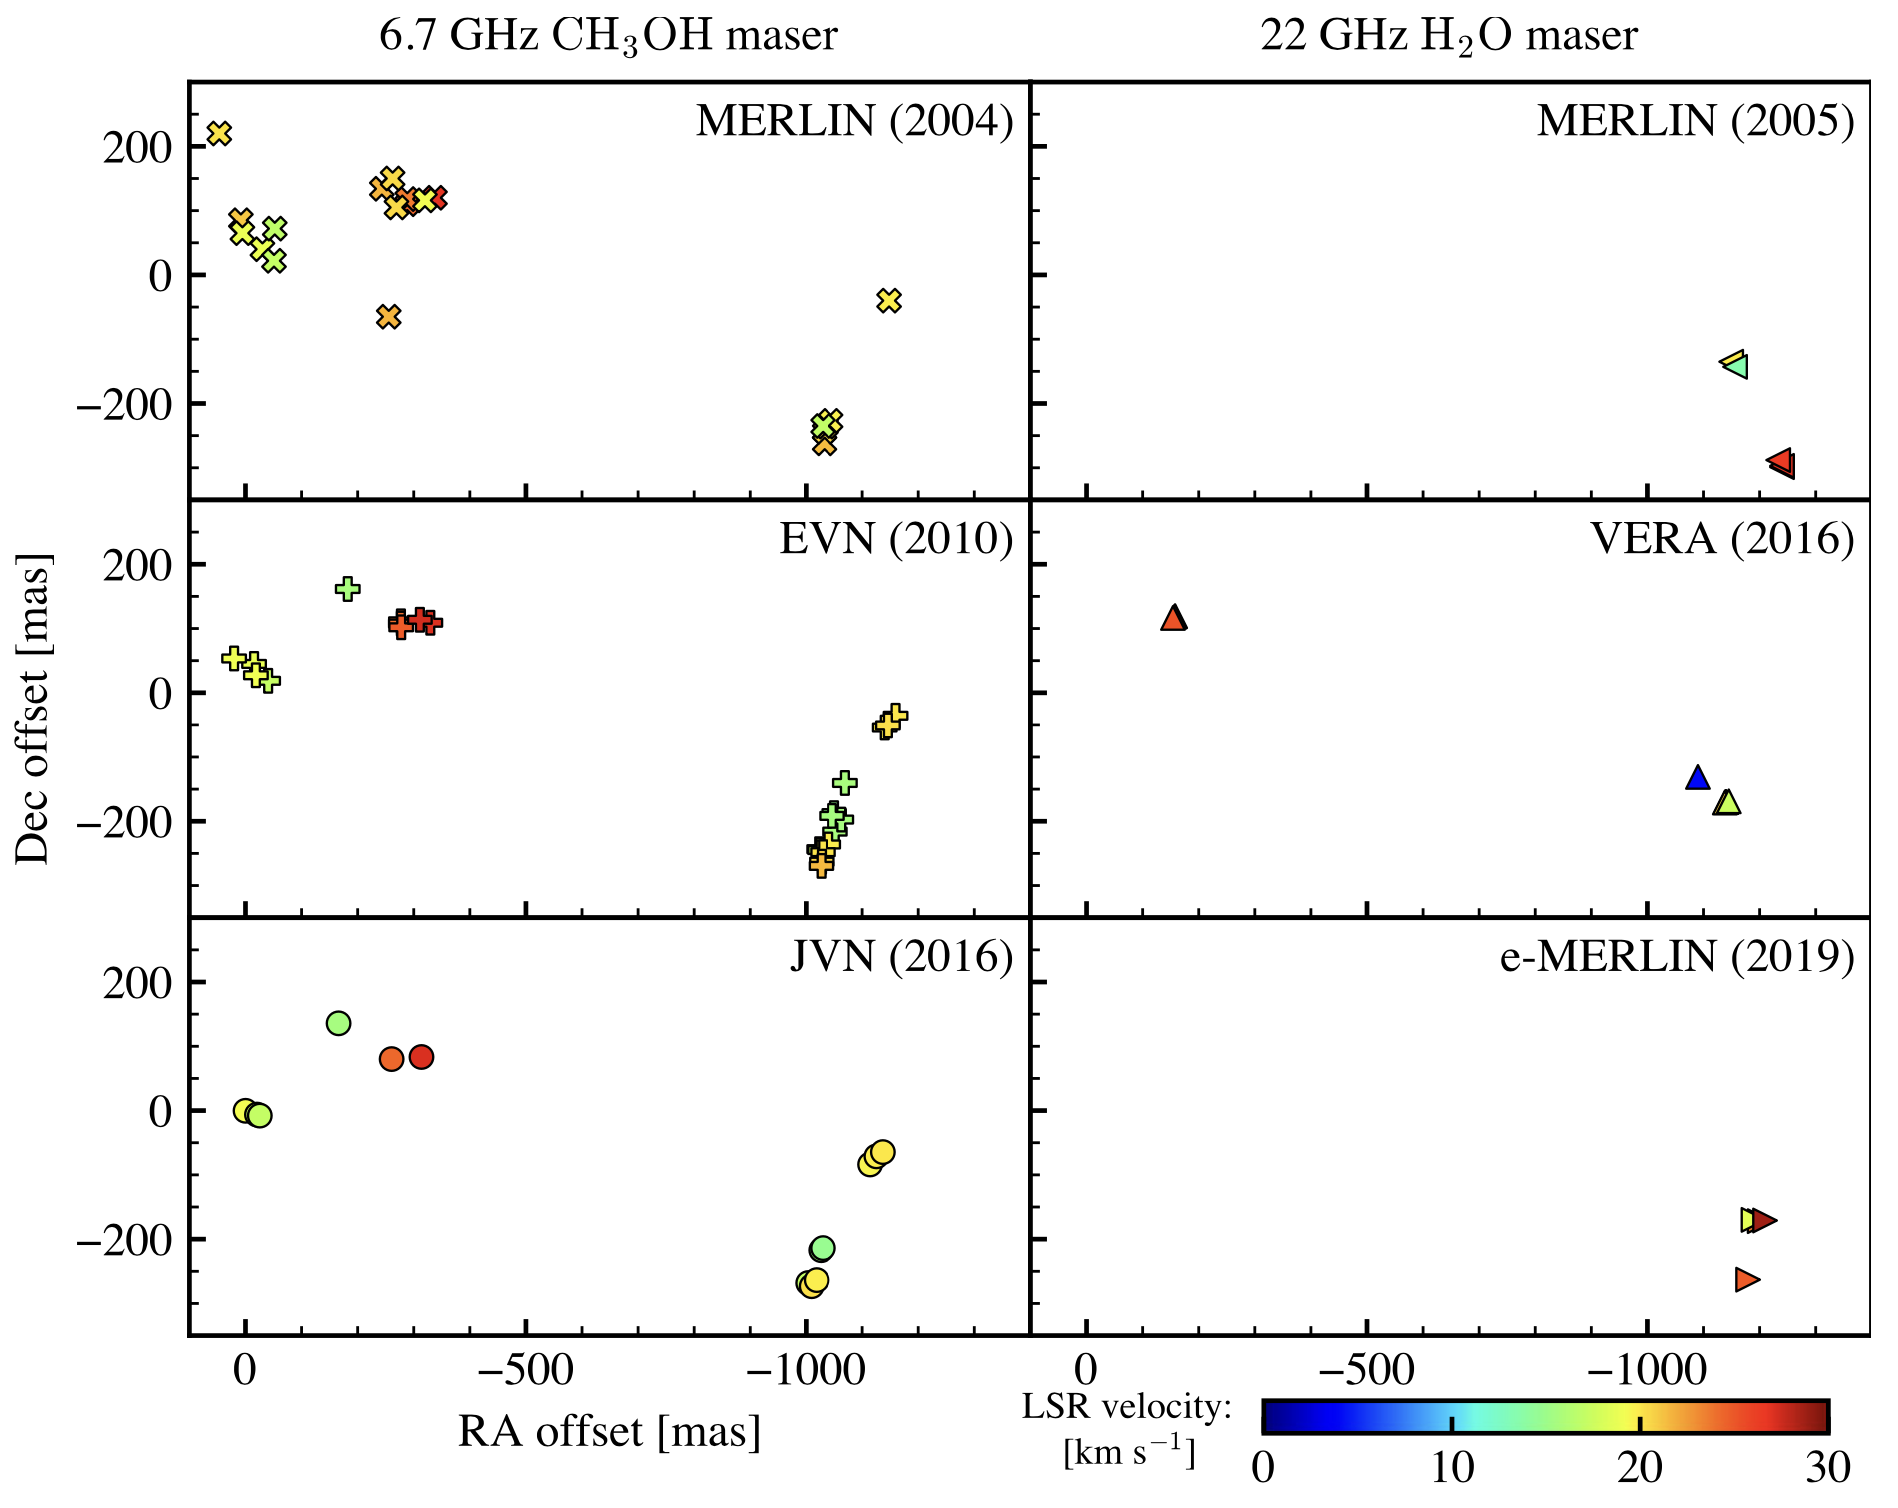
Table 7 summarises observing parameters from available interferometric mapping data over the last two decades. Table 8 lists the absolute coordinates of referenced maser spots with different interferometers at different times. The alignment of maser positions among different observations will be commented on further below. Figure 7 presents the spatial distributions of each mapping data with offsets relative to the position of the CH3OH reference (same as Figure 5).
We found a very similar spatial distribution of CH3OH masers. This fact allows us to identify 13 long-lived maser features within the velocity width of the JVN data. We first associated maser features with consistent LSR velocities within the velocity width of each feature. We then confirmed that the relative feature positions in each dataset were consistent. Table 9 shows the maser features also detected by EVN and/or MERLIN. We note that both the m-2 and m-3 features in the JVN data could be associated with the same EVN/MERLIN features. Although we chose the m-2 feature in this paper, they were closely located, and this choice did not significantly affect our estimation of averaged proper motion. We observed systematic offsets in absolute coordinates between the JVN, EVN and MERLIN data. The averaged offsets of the EVN and MERLIN data are also listed in Table 9. Xu et al. (2009) measured the secular motion of G59 by using the CH3OH masers at 12 GHz, i.e., -1.7 and -5.1 mas yr-1 in RA and DEC, respectively.
Their secular motion corresponds to expected positional shifts of (+11 mas, +33 mas) for EVN and (+20 mas, +59 mas) for MERLN, when comparing with the JVN positions in RADEC. The average offsets in Table 9 are inconsistent with these expected values. We, thus, consider that there is a significant astrometric error in the absolute coordinate measured among the different epochs (up to 50 mas). Hereafter, we compared these three data in a relative coordinate with respect to positions of the maser feature m-1 in Table 9.
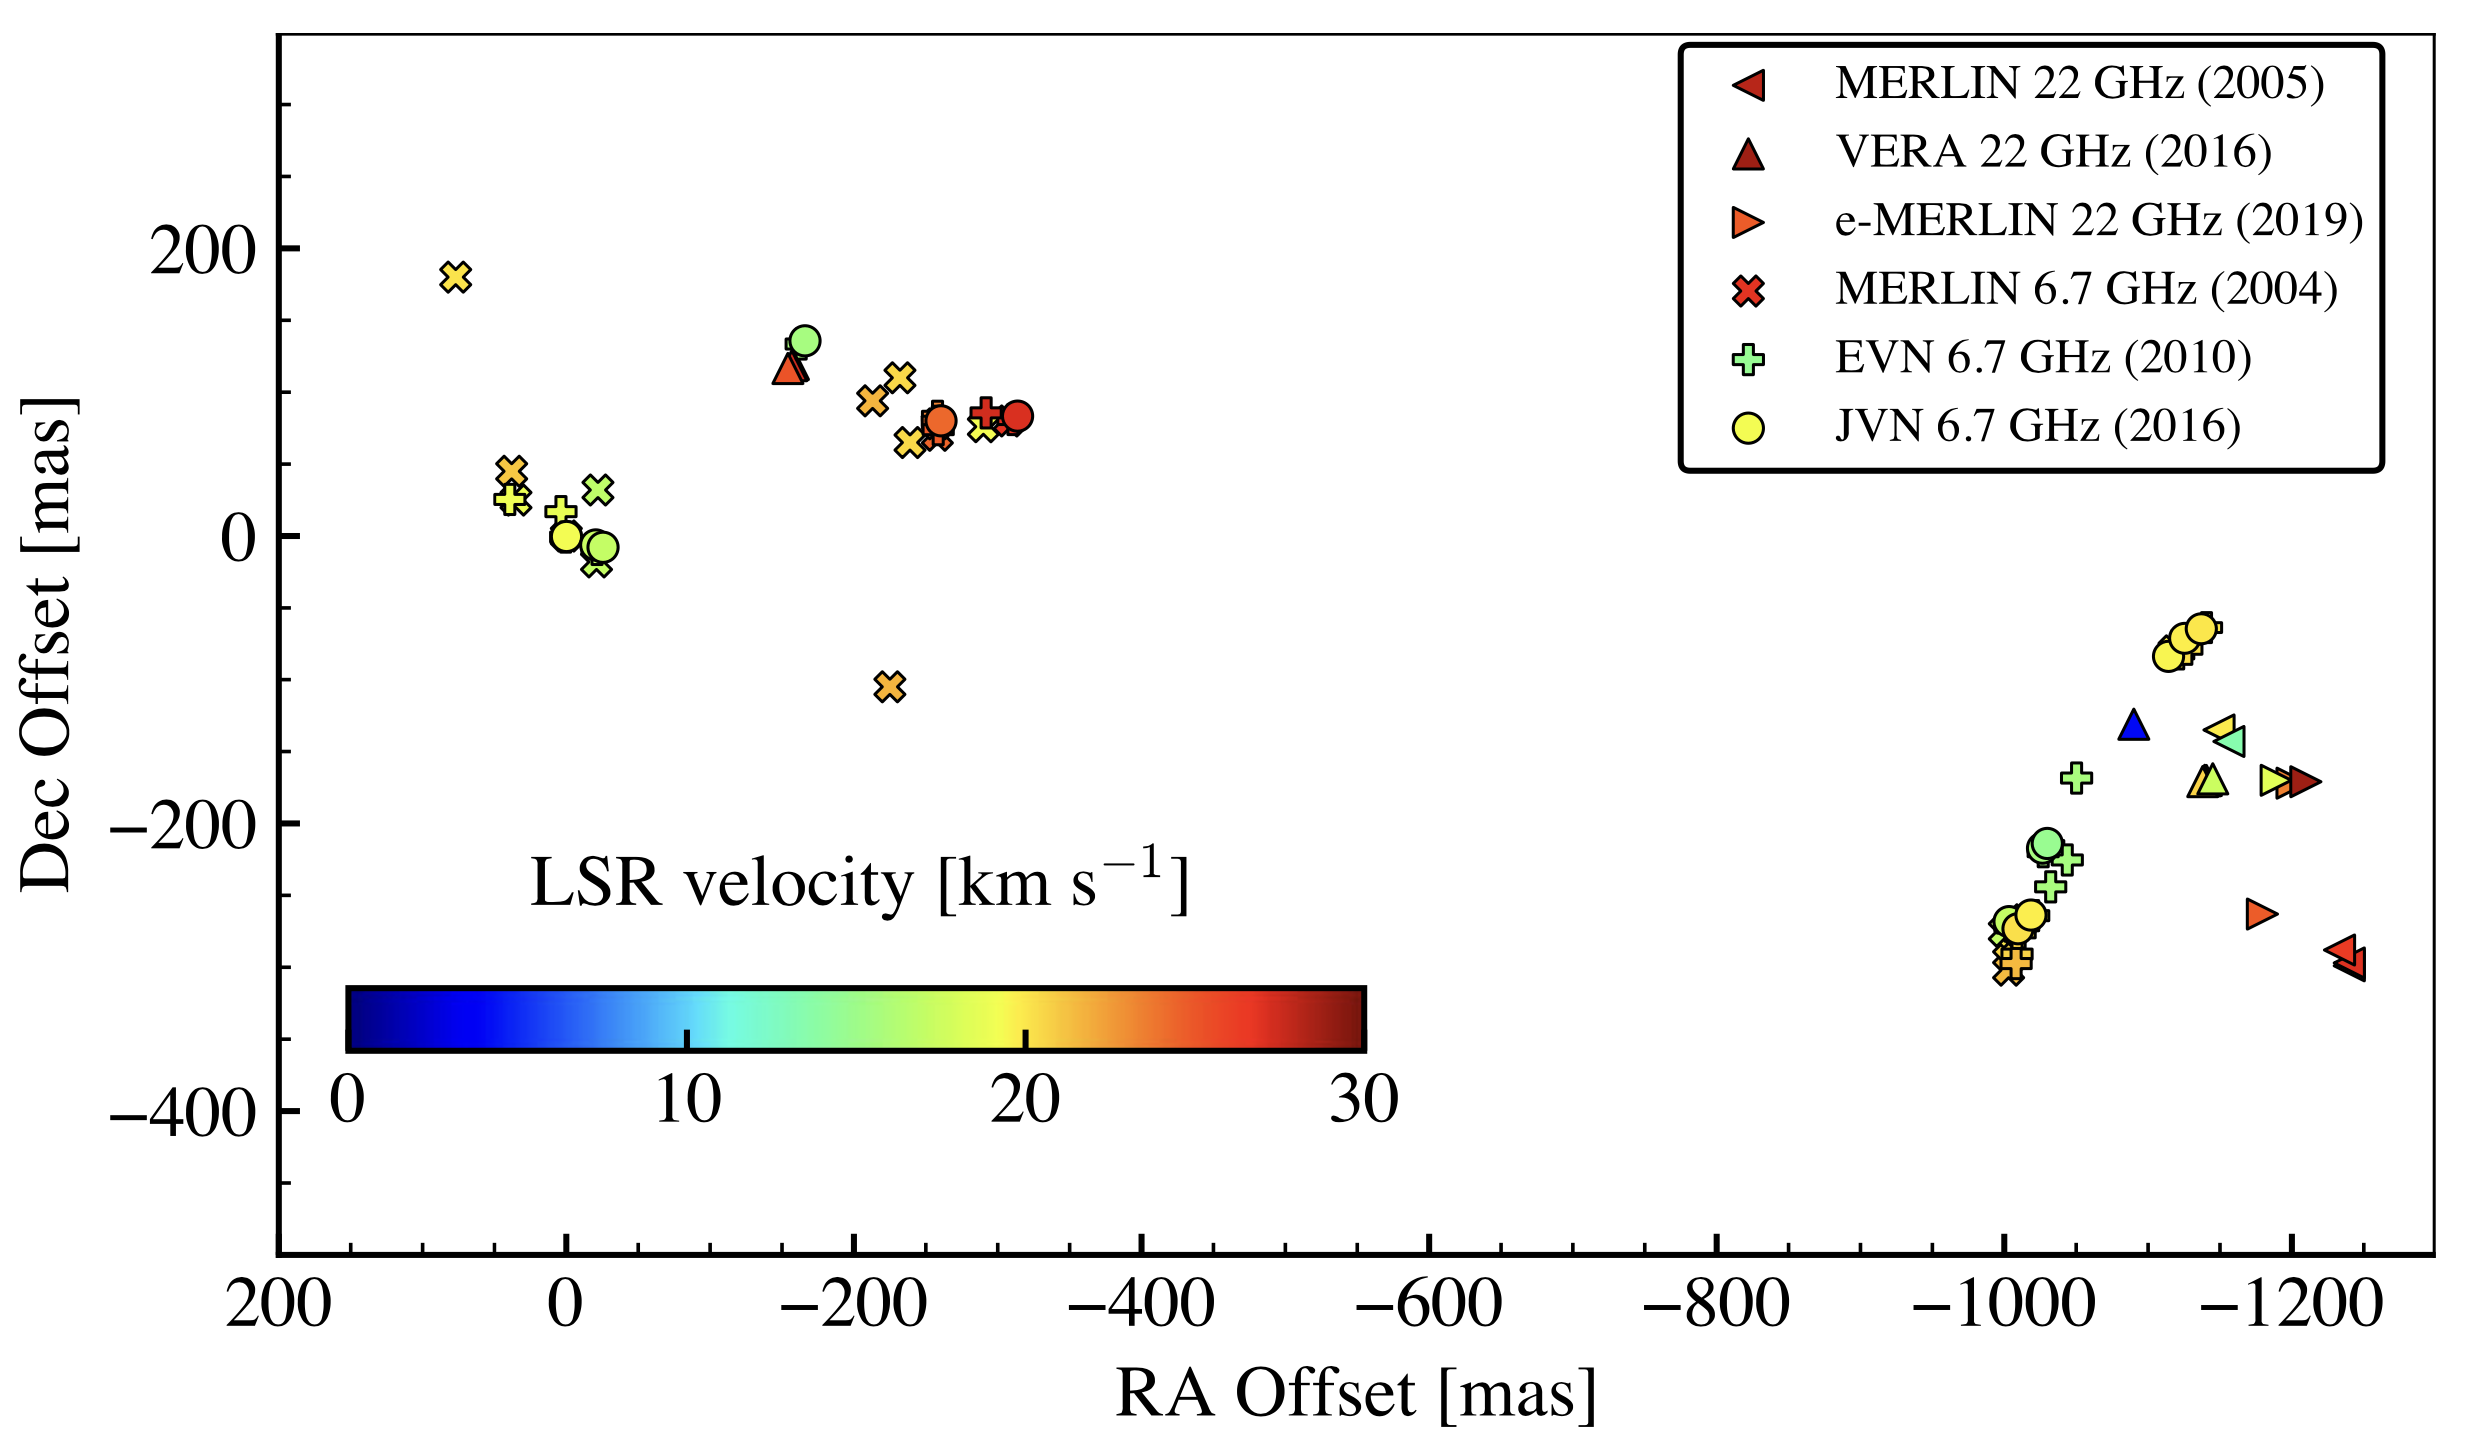
Figure 8 presents all the maser data in a single plot. Overall distributions of CH3OH have not changed over 15 years from 2004 to 2019. This fact implies that the physical environment for pumping and amplification of these CH3OH maser has remained stable in G59. The H2O masers were, on the other hand, basically concentrated in the Western cluster. The bipolar ‘pair’ distribution was only detected in the first to third epochs of our VERA data (see Figure 1 again). Such variability is a common feature of H2O masers excited in protostellar outflow and, more generally, in shocks, which trace highly episodic mass ejection in some cases (e.g., Motogi et al., 2011, 2016; Burns et al., 2016).
4.2 Position-Velocity diagram for the Western masers
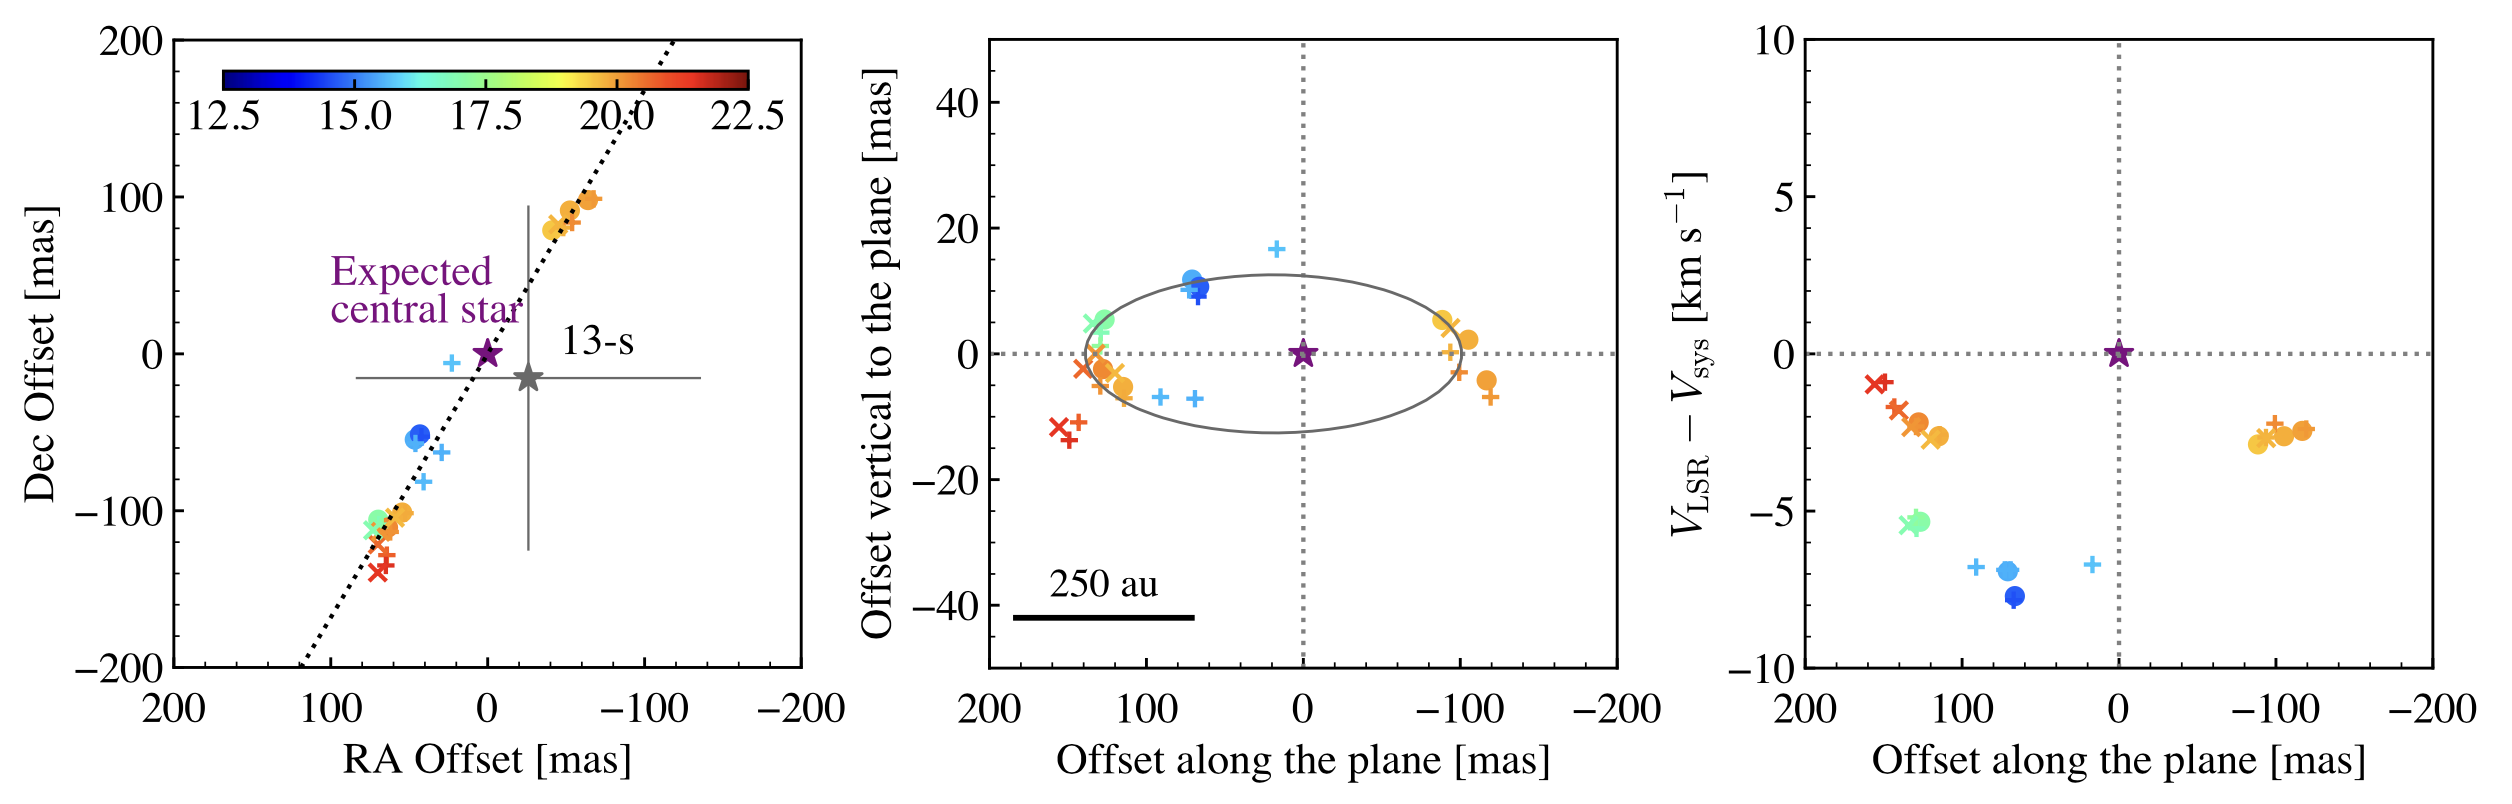
We have found that the Western CH3OH masers exhibit a ‘linear’-like distribution along the SE-NW direction (see the left panel in Figure 9). The millimetre continuum peak ‘13-s’ reported in Rodón et al. (2012) is nearly located at the centre of this distribution. We have inspected whether this linear distribution might possibly trace the edge-on disc-like structure or not, as follows.
We first made a linear fitting on this maser distribution. The PA of the best-fit line was determined to be 149 from North to East. We then assumed that the host protostar is located at the nearest position from 13-s on the best-fit line. This position was set to the origin in Figure 9. The middle panel of Figure 9 presents a further zoomed-up view of the Western CH3OH masers, which has been rotated so that the horizontal axis coincides with the best-fit line. The vertical axis is perpendicular to the line and is four times magnified compared to the horizontal axis. This scale allows us to highlight deviations from a linear distribution in Figure 9, and shows that the CH3OH masers could rather trace a highly-elongated ellipse. We also showed the best-fit ellipse in Figure 9 as a reference. This ellipse is estimated by using the inner masers around the origin. The aspect ratio of the ellipse is about 12 (120 and 10 mas on the major and minor axis, respectively). If the ellipse traces the outer radius of the inclined disc-like structure, this aspect ratio corresponds to inclination angle of 6 (0 for a completely edge-on case). It should be noted that this inclination is small and affects only 1 per cent of LoS velocities. We, therefore, ignored it in the following analysis.
The right panel in Figure 9 presents the position-velocity () diagram along the best-fit line. The horizontal axis shows the positional offset from the origin, increasing towards the SE side, while the vertical axis shows internal LoS velocities. The CH3OH masers exhibit a half ellipse only on the blue-shifted side in the diagram. This U-shaped diagram typically appears as a part of a rotating expanding or rotating infalling ring (e.g., Hirota et al., 2017). In a previous analysis of the diagram of the Western CH3OH masers in G59, Phillips (2000) focused only on the Southern side of our best-fit line. They ignored the Northern side since only a single maser feature was detected there. They investigated Keplerian rotation, considering a linear velocity gradient on the Southern side, which is indeed observed in the third quadrant of our diagram.
4.3 Rotating-infalling/expanding ring model
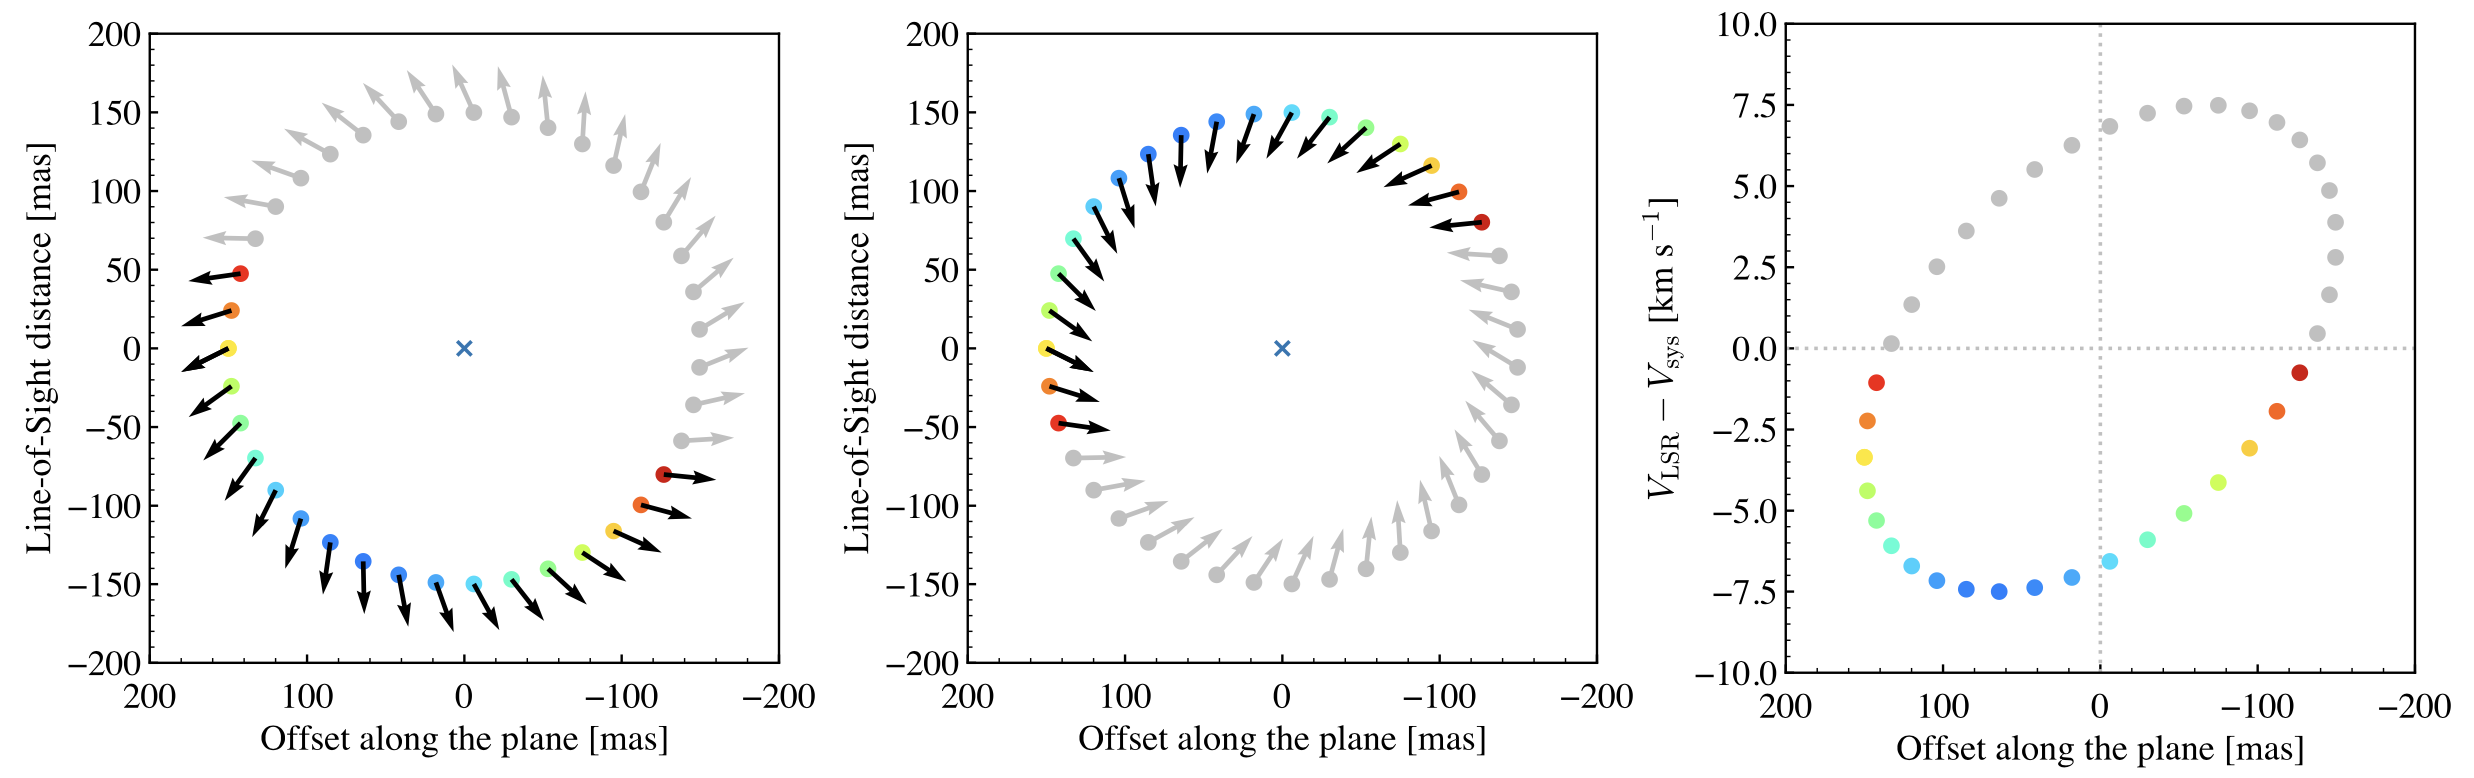
We conducted a kinematic fitting on the diagram, assuming a rotating-infalling/expanding ring model (see Appendix B). In this model, we assumed that the host protostar itself has no additional LoS motion with respect to the natal cloud (i.e., of 22.4 km s-1). We found that if we assumed an edge-on ring, either rotation with infall or rotation with expansion could reproduce the observed diagram (see Figure 10). Both models are rotating counterclockwise, but the location of CH3OH masers along the LoS differs from each other. In the infalling model, the masers are located on the far side of the ring, while in the expanding model, they are situated on the near side.
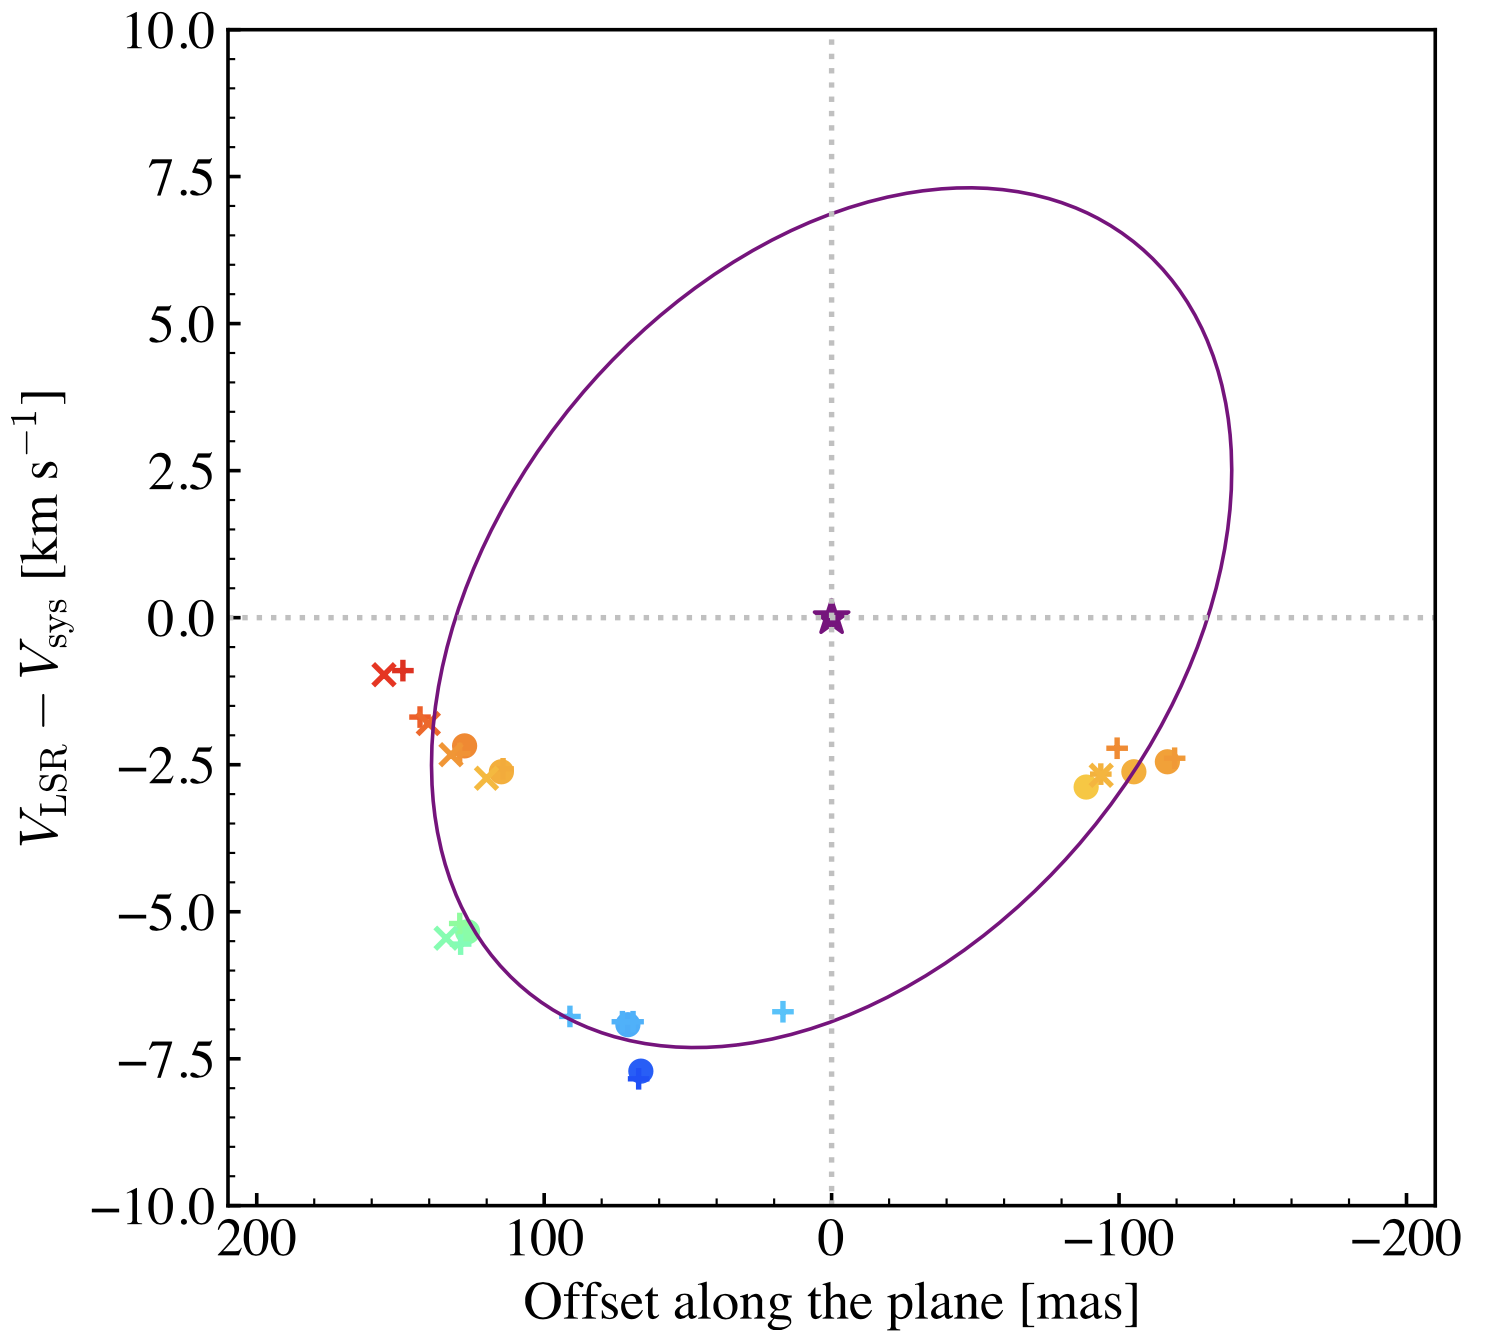
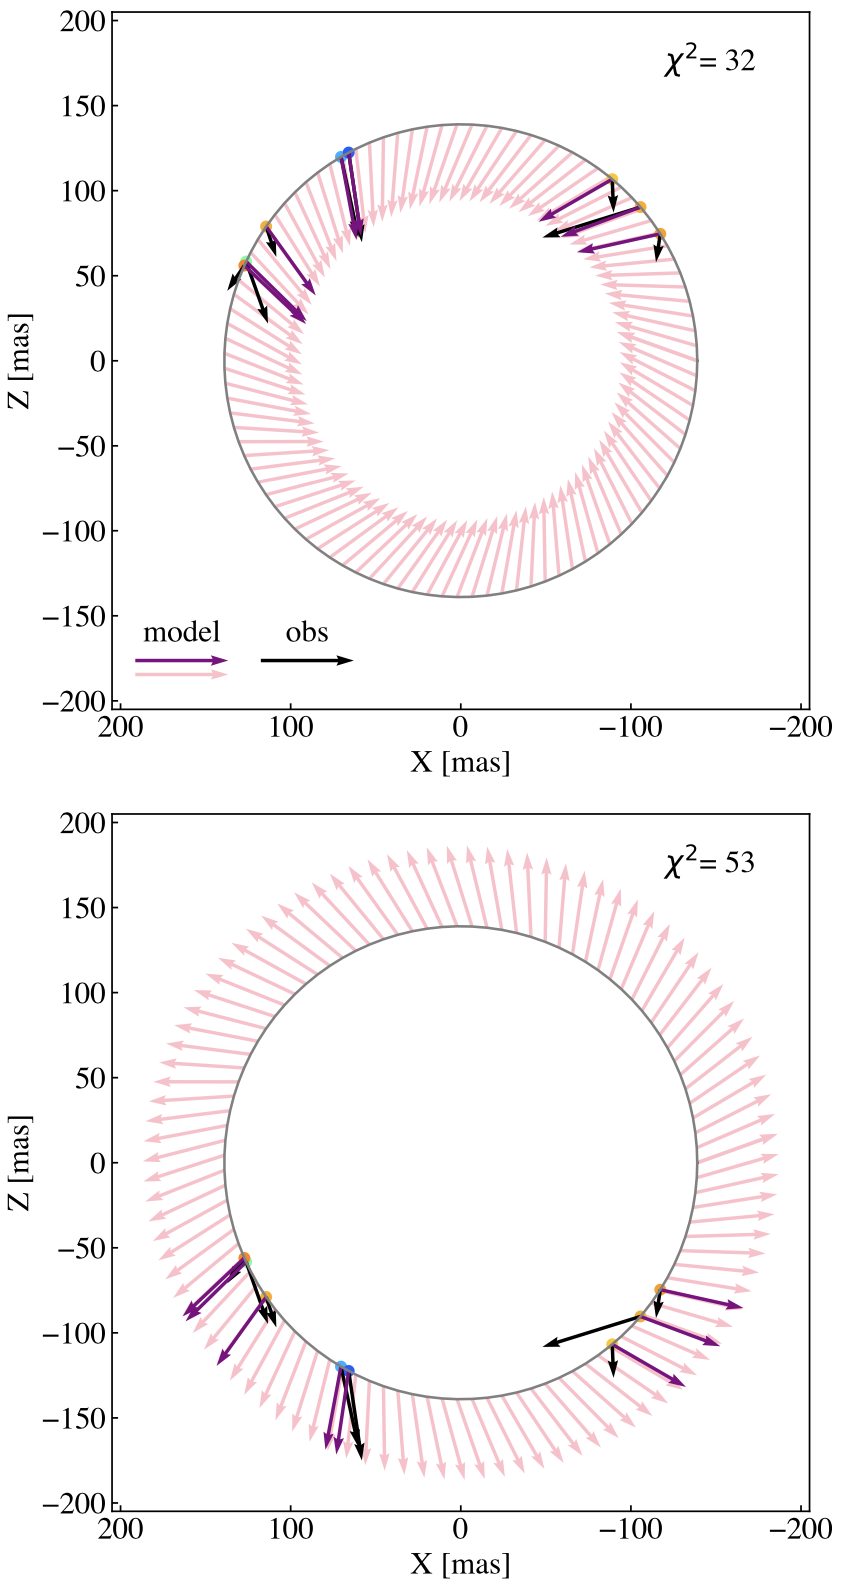
Figure 11 shows the best-fit ellipse model on the diagram. Table 10 lists the best-fit parameters. The maser ring has a radius of 139 5 mas (300 11 au at 2.16 kpc), a rotating velocity of 2.5 0.3 km s-1, and expanding or infalling velocity of 6.9 0.5 km s-1. This result, at least, indicates that the maser kinematics is not consistent with a scenario of a simple rotationally-supported disc. Since we could not favour one model over the other only by the diagram, we next inspected proper motion vectors. Figure 12 compares the observed and modelled (proper) motion vectors. For this comparison, we have recalculated observed proper motions relative to the centre of the Western maser clusters that is almost consistent with the expected position of the host protostar. We only compared the proper motion vectors along the plane of the ring since our model did not include any motions perpendicular to this plane.
We calculated values as follows:
| (1) |
where and are the observed and modelled proper motions along the plane of the ring for the i-th maser feature, respectively. indicates the error in the observed proper motion for the i-th maser feature. We found that the infalling model gives better fitting than the expanding model, giving a factor of 2 better .
These fitting results may not be conclusive but they are consistent with Darwish et al. (2020), who suggested that the Western CH3OH masers were excited in infalling gas. In this case, the CH3OH masers are located outside the centrifugal barrier or selectively tracing infalling components caused by angular momentum transfer in the inner circumstellar regions (e.g., Motogi et al., 2017, 2019). A complementary analysis of thermal emission lines with high excitation energies, that would trace the inner circumstellar regions more uniformly, is needed to confirm the presence of infall.
On the other hand, a rotating-expanding motion of the CH3OH maser has been reported in several cases (e.g., Sugiyama et al., 2016; Bartkiewicz et al., 2020). The origin of such a rotating-expanding motion is still an open question. In our case, some CH3OH maser features located on the outer edge show proper motions outward from the plane of the ring. This motion may suggest that these CH3OH masers trace the root of the rotating disc wind, as suggested by Sugiyama et al. (2016). However, a detailed outflow model and more precise proper motion measurements are required for a quantitative analysis, which is beyond the scope of this work.
There are several CH3OH masers outside the best-fit ellipse in the middle panel of Figure 9 (e.g., masers with LoS velocities of 15.70, 17.06, and 19.95 km s-1). These masers may reflect the width or thickness of the ring ( 10 mas). Another possibility is that these masers trace a part of infalling and/or rotating spirals, which have been recently reported in a few CH3OH maser sources (e.g., Motogi et al., 2017; Chen et al., 2020; Burns et al., 2023). Such spiral masers may trace the internal structures of an accretion disc or envelope. However, their distributions are far from disc-like ones, i.e., ring/ellipse, arc, and linear distribution. Motogi et al. (2017), for example, reported CH3OH masers tracing two spiral tails connecting to the inner compact ring around a face-on high mass protostar G353.273+0.641. Burns et al. (2023) also found that the CH3OH traces spiral arms inside a gravitationally unstable Keplerian disc around a high mass protostar G358.93-0.03-MM1 during an accretion burst event. They reported that the masers were excited in a limited part of the spiral arms in each epoch, and the maser emitting region moved gradually outward along the propagation of a heat wave caused by episodic accretion. This finding implies that simple morphological classification is insufficient to distinguish the realistic physical structure traced by CH3OH masers. It is especially essential to be cautious when deducing a physical structure based on VLBI data, as faint or extended maser spots tend to be undetectable.
High-sensitivity (connected) interferometer observations of thermal emission lines, with comparable angular resolutions than VLBI, are needed to provide a comprehensive map of the entire physical structure, that can fill up the gap between maser features.
| = | ||
|---|---|---|
| (mas) | (km s-1) | (km s-1) |
| 139 5 | 2.5 0.3 | -6.9 0.5 |
4.4 Discrepancy between the kinematic model and observed proper motions
There is some discrepancy between the modelled and observed proper motions, despite the well-fit analysis. In the following, we speculate on three possible sources of uncertainty that can generally affect maser proper motion measurements, although the first one (the Christmas tree effect) does not affect the JVN data directly but prevents us from a combination with the previous EVN and MERLIN observations.
4.4.1 "Christmas-tree" effect and maser structure
A well-known source of error in proper motion measurements is the Christmas-tree effect (Genzel et al., 1981), where closely-located maser spots switch by blinking like a Christmas tree. This effect causes an apparent jump in the position of the initial fading maser spot to that of another brightening maser spot between two observing epochs.
The overall distribution of the CH3OH masers in G59 has remained over fifteen years, implying that warm and dense gas suitable for maser excitation is consistently abundant at the same locations. However, only a limited volume of such gas can satisfy the coherent condition for maser amplification in general. Several maser spots should be recurrently excited and extinguished in a local gas clump.
We could suffer from the Christmas-tree effect since there is a long gap between the third and fourth epochs. Although we have carefully excluded non-linear jumps in maser positions, it is difficult to identify small linear-like jumps within a range of positional errors between the first three and the latter three epochs.
The Christmas-tree effect becomes more serious over longer durations. Figure 13 shows the long-term internal proper motion between the JVN and EVN data. We derived these motions for identical maser features listed in Table 9 using the same procedure adopted for the JVN data.
We recalculated the barycentres using only the identical masers. The new barycentres were (-624.897 mas, -37.128 mas) for EVN and (-605.124 mas, -61.726 mas) for JVN. The latter position differs slightly from that in Table 5 due to the limited number of maser features.
Prominent inward proper motions indicate that the distribution of CH3OH masers shrunk between 2010 and 2016. However, these inward motions are significantly larger than what is expected from the model. In particular, some masers showed a proper motion of 30 km s-1. Such a large motion is inconsistent with our short-term proper motions and also clearly larger than the typical proper motion found for CH3OH masers ( a few km s-1). These facts suggest that derived inward motions are apparent motions caused by the Christmas-tree effect. Hence, we avoid further discussions using the long-term proper motion combing the JVN, EVN, and MERLN data.
The proper motions measured only by the JVN data could be more severely affected by the structural variation of individual maser features. For example, the number of maser spots varied at weak line wings in some maser features. However, errors due to such variations should be reduced by error-weighted averaging (see Section 2.3), as positional errors are generally larger for weaker maser spots. Additionally, significant changes in channel spacing (see Table 2) can cause non-negligible positional errors for maser features with a narrow velocity range.
4.4.2 Turbulence in disc-like structure
Another possible error source is turbulence in the disc-like structure. Local turbulence could introduce randomness in proper motion vectors. Although turbulence inside a high-mass disc-like structure has not been well-studied, the turbulent velocity can reach transonic levels in the low-mass cases (e.g., Simon et al., 2015). If we assume such transonic turbulence, the typical gas temperature of the CH3OH maser ( 200 K, Sobolev et al., 1997; Cragg et al., 2005) corresponds to a sound velocity of 1 km s-1, using a mean molecular weight of 2.5. This velocity is 20–30 per cent of typical proper motions observed in G59 (3–5 km s-1). If the turbulence is supersonic by a factor of 2, it would be enough to account for the observed randomness in proper motion vectors. Such turbulence is consistent with our diagram, where observed LoS velocities have some offsets from the best-fit model, where we only assumed uniform rotating infalling/expanding motion.
4.5 Origin of the Eastern masers
The Eastern CH3OH and H2O masers exhibit a complex distribution. Although, there is a spatial coincidence that suggests both maser species could trace the outflow, the estimated proper motion vectors for both maser species are inconsistent. Some CH3OH masers do show similar outflowing motions, but the H2O masers generally have higher velocities compared to the CH3OH masers. Additionally, there are a few nearby H2O and CH3OH maser features that are moving in opposite directions to each other.
Such an opposite motion could be explained if CH3OH masers locate across the boundary of outflow and inflow, or if they were tracing the slow side edge of a shock where the H2O masers are at the tip. Machida & Hosokawa (2020) suggested that some part of the outflow can become gravitationally decelerated and eventually turn into inflow in such a region (i.e., ‘failed outflow’). The observed inconsistency is naturally solved if the H2O masers would be excited in high-velocity gas near the outflow axis, while the CH3OH masers would be excited around the outflow/inflow boundary. This interpretation is consistent with the previous outflow scenario proposed by Darwish et al. (2020).
4.6 Radio continuum emission tracing a radio jet
Carral et al. (1999) detected two radio continuum sources by VLA, i.e., source NE (0.7 mJy) and SW (0.3 mJy). Source NE is located near the Western maser cluster, while source SW is located (5″.1, 2″.8) from source NE. If these sources trace an HII region, we can deduce the spectral type of the host star by excitation parameter , as follows (e.g., Kurtz et al., 1994):
| (2) |
The value of for source NE corresponds a B2-type Zero Age Main Sequence (ZAMS) (Panagia, 1973). However, based on a bolometric luminosity of , a spectral type of B0.5 has been suggested for the host star (Martín-Hernández et al., 2008). We speculate that the radio continuum emission might trace a radio thermal jet with two knots, although this scenario needs to be confirmed by future observations.
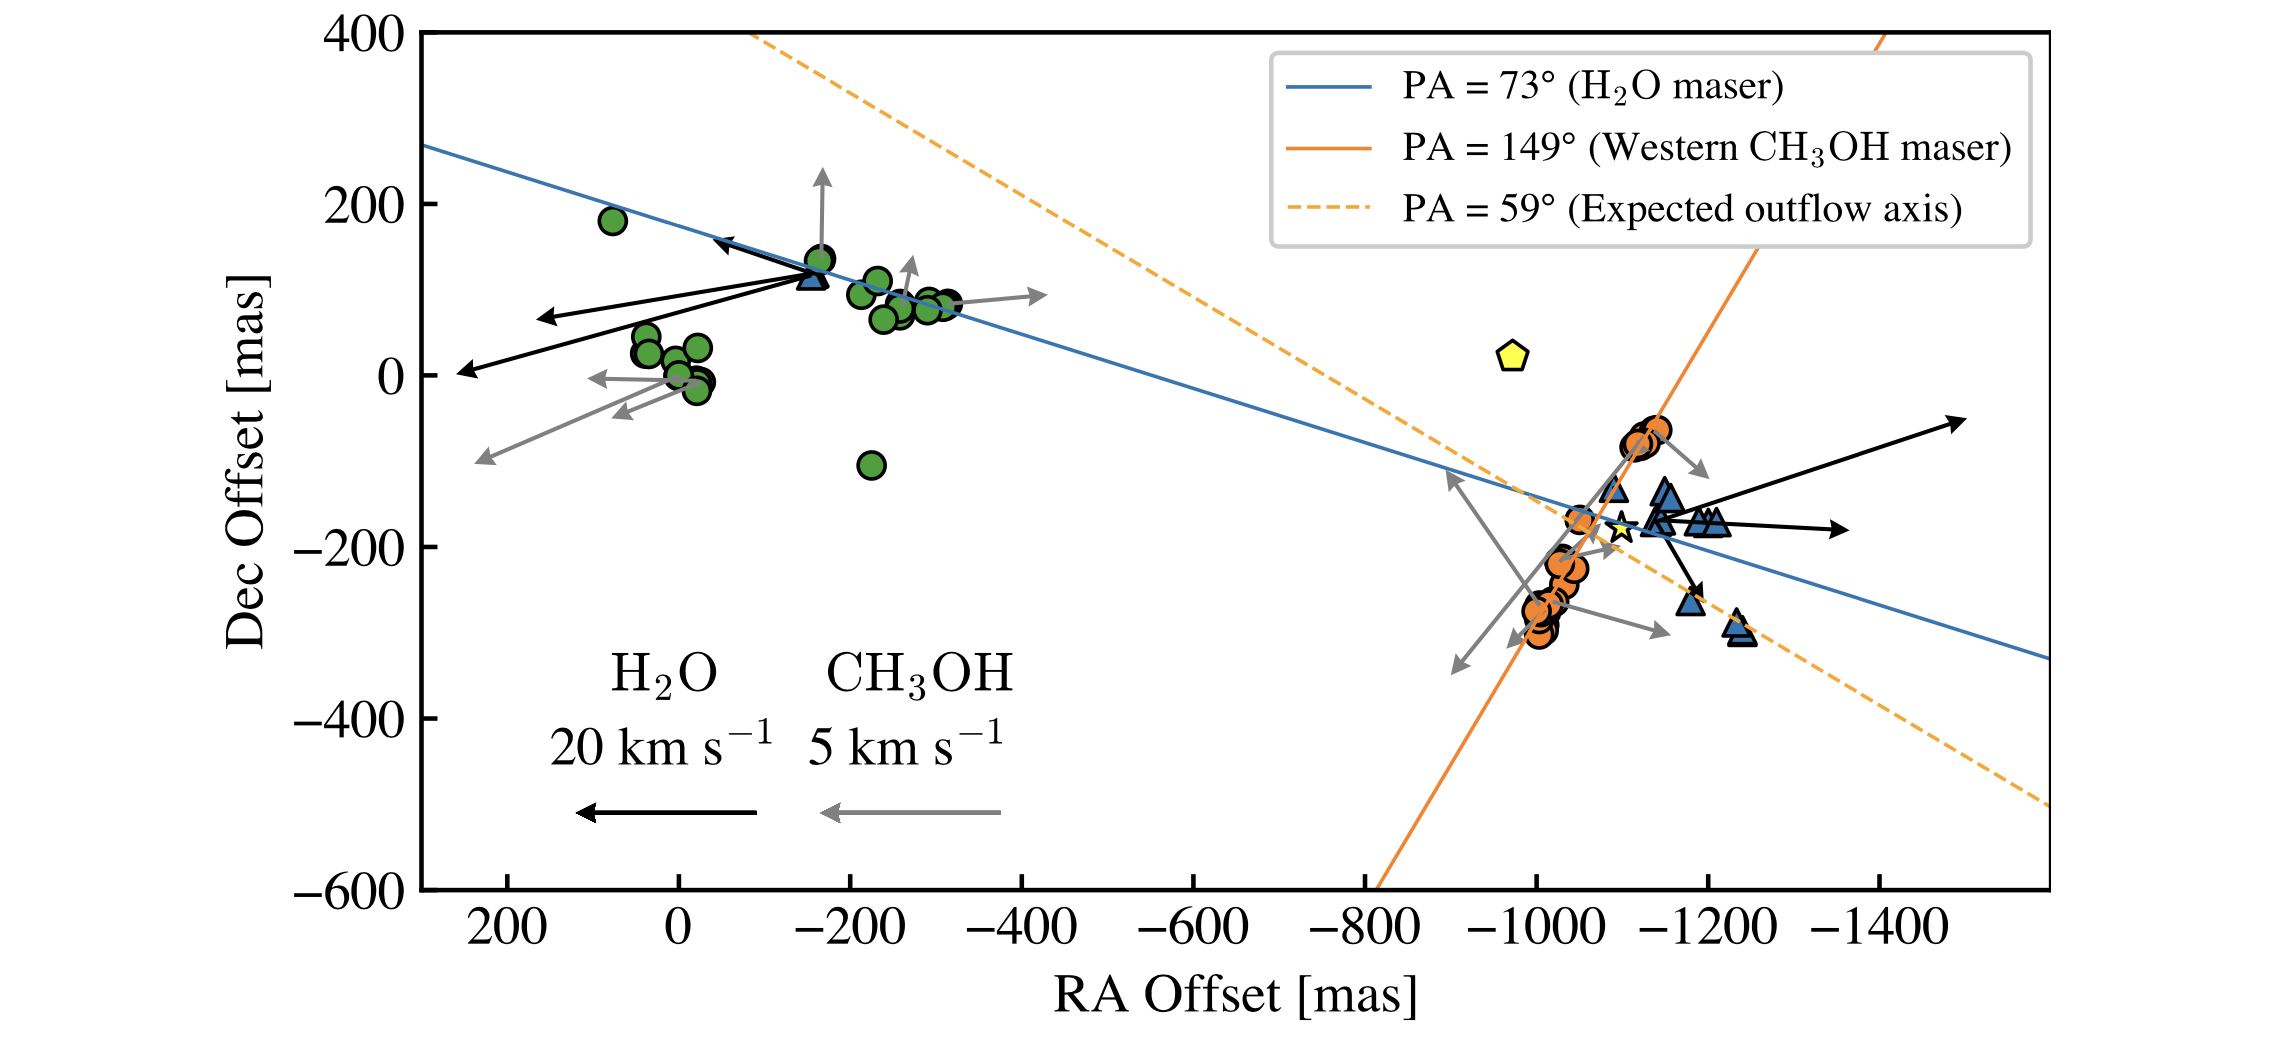
The position angle (PA) of the radio jet, calculated from the positions of the two radio sources, is 59 in this case. This PA is consistent with that of the outflow cavity traced by the NIR H2 line on a larger scale (Martín-Hernández et al., 2008). Furthermore, the PA of the disc-like structure we propose, based on the maser analysis, is 149, i.e., just normal to this jet direction (see Figure 14).
These findings are consistent with a scenario where the CH3OH masers and radio continuum might trace a compact disc/jet system in G59.
Figure 14 also includes another PA of 73, determined by a linear fitting on the distribution of H2O masers. This direction is slightly (14) different from the expected outflow axis. This discrepancy may imply that the radio jet is more directly located on the jet axis than the H2O maser, similar to the case of CepA HW2 (Torrelles et al., 2011).
The positional error of source NE is, at least, better than 0.2, which is given by the synthesised beam (3) over the peak signal-to-noise ratio (18) in Carral et al. (1999). The emission peak of the knot would be located closer to the proposed star position than the Eastern masers (see Figure 14), even considering its positional error. This fact may indicate that the H2O masers trace a shock front preceding the radio jet. A similar spatial relation is observed in the radio jet and H2O masers in IRAS 20126+4104 (Moscadelli et al., 2005; Hofner et al., 2007). We note that the CH3OH masers in IRAS 20126+4104 are excited in both the disc-like structure and low-velocity outflow, similar to the case of G59 (Moscadelli et al., 2011).
5 Conclusions
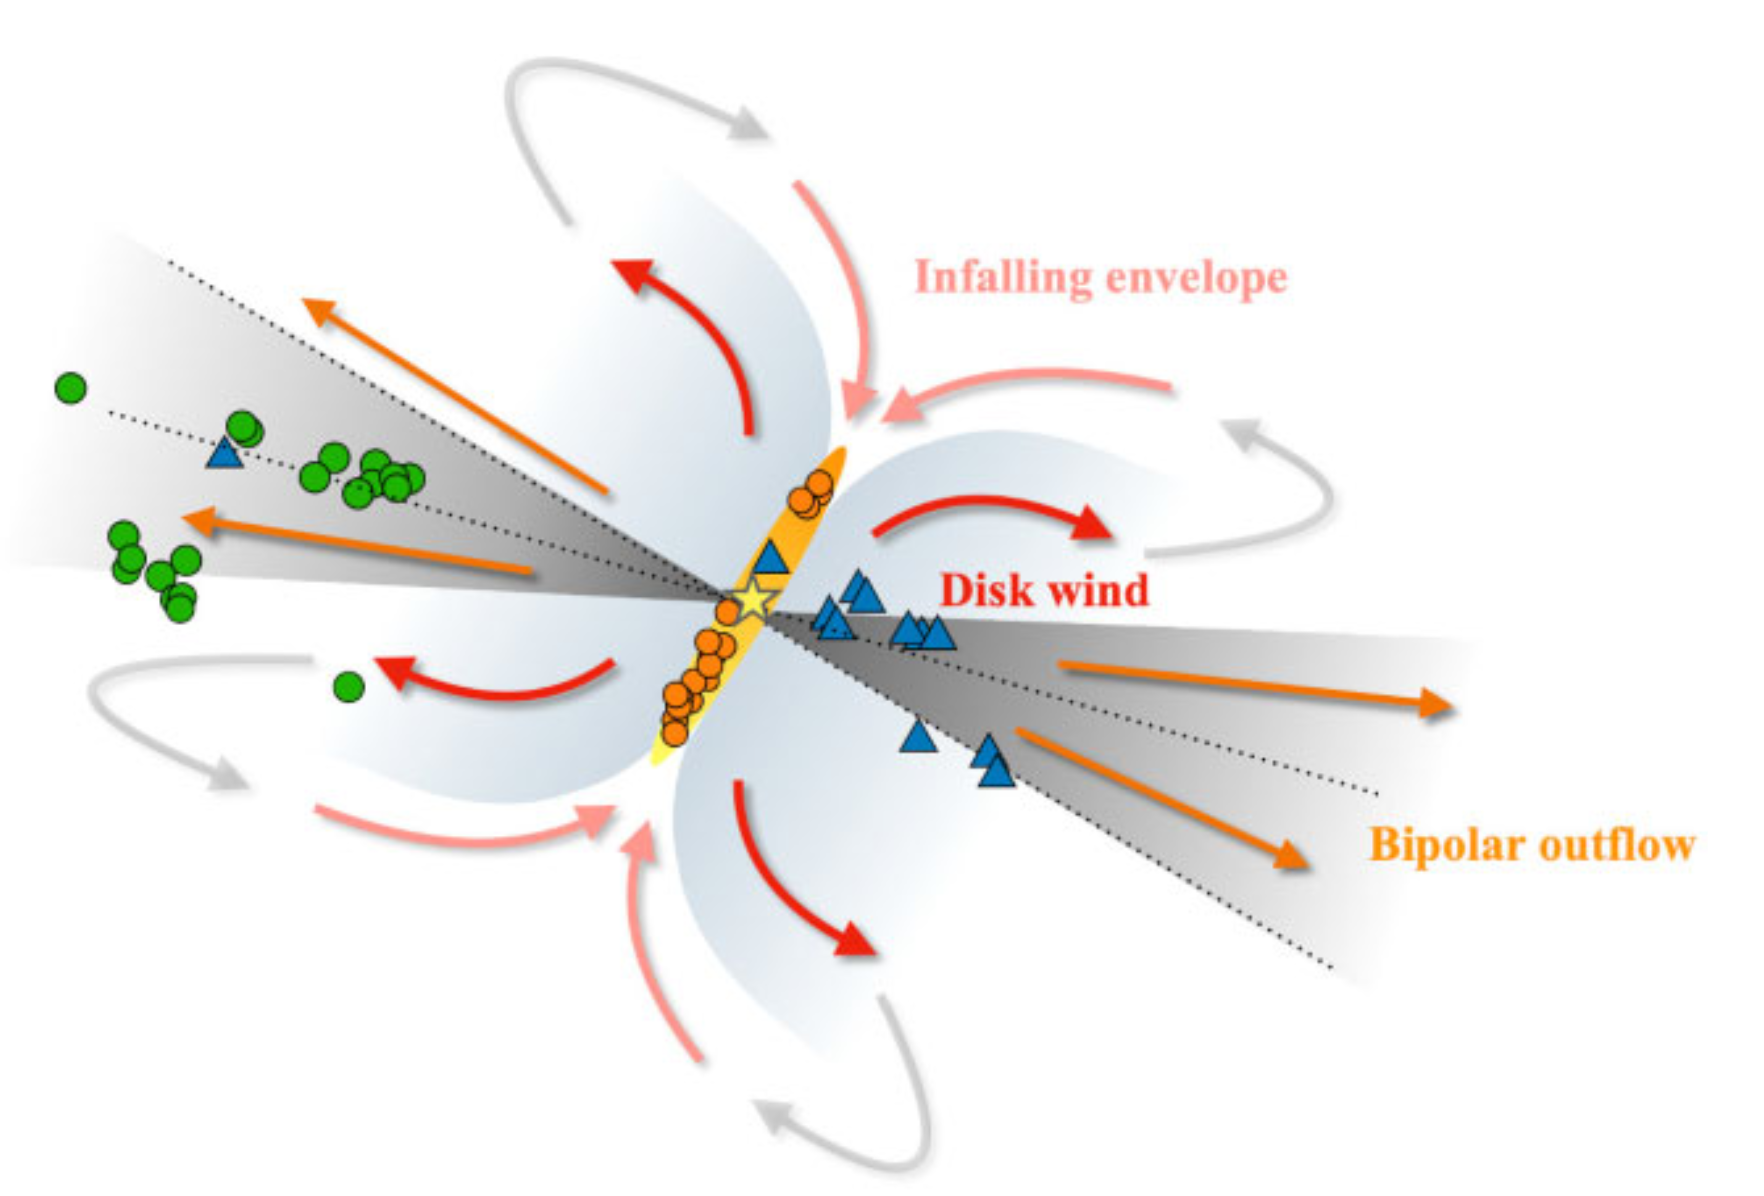
We have performed multi-epoch VLBI observation of 22 GHz H2O and 6.7 GHz CH3OH masers in the high-mass protostar G59.783+0.065, which shows a complex distribution of the class II CH3OH maser. Figure 15 summarises the schematic view of the circumstellar structure expected from our results. While H2O masers trace a bipolar outflow along the NE-SW direction, the CH3OH masers seem to have two different physical origins, as follows:
-
1.
The Eastern CH3OH masers show a complex distribution and are closely located with the H2O masers. Nevertheless, their proper motions are smaller than those of H2O masers, and some CH3OH masers have shown inward motions. This complex motion can be explained if these masers are excited at the boundary of the outflow and envelope.
-
2.
The Western CH3OH masers show a linear distribution around the millimetre continuum peak. Their distribution is approximately perpendicular to the axis of the large scale outflow and possibly of a radio jet. The diagram of the western CH3OH masers suggests they might trace a rotating disc-like structure with possible evidence for expansion or infall.
-
3.
However, the proper motions measured by JVN showed some discrepancy with respect to the proper motions expected for a disc-like structure which is either expanding or infalling. The Christmas-tree effect, changes of maser structures, and disc turbulence can be possible origins of observed randomness of the proper motion vectors.
-
4.
The complex distribution of the class II CH3OH masers in G59 originates from simultaneous excitation by multiple physical structures, such as in the inner circumstellar envelope and outflow. More generally, we speculate that class II CH3OH masers with complex distributions and different kinematics might trace gas belonging to both the inner circumstellar regions and the slow outflow regions at larger distances from the star. This hypothesis needs to be assessed by future statistical studies over a large sample of sources.
Acknowledgements
The author thanks all the members in VERA and the Japanese VLBI network. This work was financially supported by the MEXT/JSPS KAKENHI Grant Numbers 15K17613, 19H05082, and 19H01937 (K.M.). This work is partially supported by the inter-university collaborative project ‘Japanese VLBI Network (JVN)’ of NAOJ. This research has made use of data products from the Two Micron All Sky Survey, which is a joint project of the University of Massachusetts and the Infrared Processing and Analysis Center/California Institute of Technology, funded by the National Aeronautics and Space Administration and the National Science Foundation. This work is based, in part, on observations made with the Spitzer Space Telescope, which is operated by the Jet Propulsion Laboratory, California Institute of Technology under a contract with NASA.
Data Availability
The data underlying this article are archived by VERA and JVN. Please contact the corresponding author if one hope to access the data.
References
- Bartkiewicz et al. (2009) Bartkiewicz A., Szymczak M., van Langevelde H. J., Richards A. M. S., Pihlström Y. M., 2009, A&A, 502, 155
- Bartkiewicz et al. (2014) Bartkiewicz A., Szymczak M., van Langevelde H. J., 2014, A&A, 564, A110
- Bartkiewicz et al. (2016) Bartkiewicz A., Szymczak M., van Langevelde H. J., 2016, A&A, 587, A104
- Bartkiewicz et al. (2018) Bartkiewicz A., Sanna A., Szymczak M., Moscadelli L., van Langevelde H., 2018, in Tarchi A., Reid M. J., Castangia P., eds, Vol. 336, Astrophysical Masers: Unlocking the Mysteries of the Universe. pp 211–214, doi:10.1017/S1743921317010055
- Bartkiewicz et al. (2020) Bartkiewicz A., Sanna A., Szymczak M., Moscadelli L., van Langevelde H. J., Wolak P., 2020, A&A, 637, A15
- Beltrán & de Wit (2016) Beltrán M. T., de Wit W. J., 2016, A&ARv, 24, 6
- Benjamin et al. (2003) Benjamin R. A., et al., 2003, PASP, 115, 953
- Beuther et al. (2002) Beuther H., Schilke P., Sridharan T. K., Menten K. M., Walmsley C. M., Wyrowski F., 2002, A&A, 383, 892
- Beuther et al. (2003) Beuther H., Schilke P., Stanke T., 2003, A&A, 408, 601
- Burns et al. (2016) Burns R. A., Handa T., Nagayama T., Sunada K., Omodaka T., 2016, MNRAS, 460, 283
- Burns et al. (2023) Burns R. A., et al., 2023, Nature Astronomy,
- Carral et al. (1999) Carral P., Kurtz S., Rodríguez L. F., Martí J., Lizano S., Osorio M., 1999, Rev. Mex. Astron. Astrofis., 35, 97
- Caswell et al. (1995a) Caswell J. L., Vaile R. A., Ellingsen S. P., Whiteoak J. B., Norris R. P., 1995a, MNRAS, 272, 96
- Caswell et al. (1995b) Caswell J. L., Vaile R. A., Ellingsen S. P., Norris R. P., 1995b, MNRAS, 274, 1126
- Cesaroni et al. (2007) Cesaroni R., Galli D., Lodato G., Walmsley C. M., Zhang Q., 2007, in Reipurth B., Jewitt D., Keil K., eds, Protostars and Planets V. p. 197 (arXiv:astro-ph/0603093)
- Cesaroni et al. (2017) Cesaroni R., et al., 2017, A&A, 602, A59
- Chen et al. (2020) Chen X., et al., 2020, Nature Astronomy, 4, 1170
- Churchwell et al. (2009) Churchwell E., et al., 2009, PASP, 121, 213
- Cragg et al. (2005) Cragg D. M., Sobolev A. M., Godfrey P. D., 2005, MNRAS, 360, 533
- Darwish et al. (2020) Darwish M. S., Edris K. A., Richards A. M. S., Etoka S., Saad M. S., Beheary M. M., Fuller G. A., 2020, MNRAS, 493, 4442
- Fujisawa et al. (2014) Fujisawa K., et al., 2014, PASJ, 66, 31
- Genzel et al. (1981) Genzel R., Reid M. J., Moran J. M., Downes D., 1981, ApJ, 244, 884
- Goddi et al. (2011) Goddi C., Moscadelli L., Sanna A., 2011, A&A, 535, L8
- Goedhart et al. (2004) Goedhart S., Gaylard M. J., van der Walt D. J., 2004, MNRAS, 355, 553
- Green et al. (2017) Green J. A., et al., 2017, MNRAS, 469, 1383
- Greisen (2003) Greisen E. W., 2003, in Heck A., ed., Astrophysics and Space Science Library Vol. 285, Information Handling in Astronomy - Historical Vistas. p. 109, doi:10.1007/0-306-48080-8_7
- Hirota et al. (2017) Hirota T., Machida M. N., Matsushita Y., Motogi K., Matsumoto N., Kim M. K., Burns R. A., Honma M., 2017, Nature Astronomy, 1, 0146
- Hofner et al. (2007) Hofner P., Cesaroni R., Olmi L., Rodríguez L. F., Martí J., Araya E., 2007, A&A, 465, 197
- Honma et al. (2008) Honma M., et al., 2008, PASJ, 60, 935
- Hosokawa & Omukai (2009) Hosokawa T., Omukai K., 2009, ApJ, 691, 823
- Hosokawa et al. (2010) Hosokawa T., Yorke H. W., Omukai K., 2010, ApJ, 721, 478
- Ilee et al. (2018) Ilee J. D., Cyganowski C. J., Brogan C. L., Hunter T. R., Forgan D. H., Haworth T. J., Clarke C. J., Harries T. J., 2018, ApJ, 869, L24
- Johnston et al. (2020) Johnston K. G., et al., 2020, A&A, 634, L11
- Kurtz et al. (1994) Kurtz S., Churchwell E., Wood D. O. S., 1994, ApJS, 91, 659
- Lada et al. (1981) Lada C. J., Blitz L., Reid M. J., Moran J. M., 1981, ApJ, 243, 769
- Machida & Hosokawa (2020) Machida M. N., Hosokawa T., 2020, MNRAS, 499, 4490
- Martín-Hernández et al. (2008) Martín-Hernández N. L., Bik A., Puga E., Nürnberger D. E. A., Bronfman L., 2008, A&A, 489, 229
- Matsumoto et al. (2011) Matsumoto N., et al., 2011, PASJ, 63, 1345
- Minier et al. (2000) Minier V., Booth R. S., Conway J. E., 2000, A&A, 362, 1093
- Minier et al. (2001) Minier V., Booth R. S., Ellingsen S. P., Conway J. E., Pestalozzi M. R., 2001, in Proceedings of the 5th European VLBI Network Symposium. p. 178
- Moscadelli et al. (2005) Moscadelli L., Cesaroni R., Rioja M. J., 2005, A&A, 438, 889
- Moscadelli et al. (2011) Moscadelli L., Cesaroni R., Rioja M. J., Dodson R., Reid M. J., 2011, A&A, 526, A66
- Moscadelli et al. (2013) Moscadelli L., Li J. J., Cesaroni R., Sanna A., Xu Y., Zhang Q., 2013, A&A, 549, A122
- Motogi et al. (2011) Motogi K., et al., 2011, MNRAS, 417, 238
- Motogi et al. (2016) Motogi K., et al., 2016, PASJ, 68, 69
- Motogi et al. (2017) Motogi K., et al., 2017, ApJ, 849, 23
- Motogi et al. (2019) Motogi K., Hirota T., Machida M. N., Yonekura Y., Honma M., Takakuwa S., Matsushita S., 2019, ApJ, 877, L25
- Norris et al. (1993) Norris R. P., Whiteoak J. B., Caswell J. L., Wieringa M. H., Gough R. G., 1993, ApJ, 412, 222
- Norris et al. (1998) Norris R. P., et al., 1998, ApJ, 508, 275
- Panagia (1973) Panagia N., 1973, AJ, 78, 929
- Phillips (2000) Phillips C., 2000, in Conway J. E., Polatidis A. G., Booth R. S., Pihlström Y. M., eds, EVN Symposium 2000, Proceedings of the 5th european VLBI Network Symposium. p. 175
- Phillips et al. (1998) Phillips C. J., Norris R. P., Ellingsen S. P., McCulloch P. M., 1998, MNRAS, 300, 1131
- Qiu et al. (2008) Qiu K., et al., 2008, ApJ, 685, 1005
- Rodón et al. (2012) Rodón J. A., Beuther H., Schilke P., 2012, A&A, 545, A51
- Sanna et al. (2010a) Sanna A., Moscadelli L., Cesaroni R., Tarchi A., Furuya R. S., Goddi C., 2010a, A&A, 517, A71
- Sanna et al. (2010b) Sanna A., Moscadelli L., Cesaroni R., Tarchi A., Furuya R. S., Goddi C., 2010b, A&A, 517, A78
- Sanna et al. (2017) Sanna A., Moscadelli L., Surcis G., van Langevelde H. J., Torstensson K. J. E., Sobolev A. M., 2017, A&A, 603, A94
- Sanna et al. (2021) Sanna A., et al., 2021, A&A, 655, A72
- Sawada-Satoh et al. (2013) Sawada-Satoh S., Fujisawa K., Sugiyama K., Wajima K., Honma M., 2013, PASJ, 65, 79
- Simon et al. (2015) Simon J. B., Hughes A. M., Flaherty K. M., Bai X.-N., Armitage P. J., 2015, ApJ, 808, 180
- Skrutskie et al. (2006) Skrutskie M. F., et al., 2006, AJ, 131, 1163
- Sobolev et al. (1997) Sobolev A. M., Cragg D. M., Godfrey P. D., 1997, A&A, 324, 211
- Sugiyama et al. (2014) Sugiyama K., et al., 2014, A&A, 562, A82
- Sugiyama et al. (2015) Sugiyama K., et al., 2015, Publication of Korean Astronomical Society, 30, 645
- Sugiyama et al. (2016) Sugiyama K., et al., 2016, PASJ, 68, 72
- Szymczak et al. (2018) Szymczak M., Olech M., Sarniak R., Wolak P., Bartkiewicz A., 2018, MNRAS, 474, 219
- Tanaka et al. (2020) Tanaka K. E. I., et al., 2020, ApJ, 900, L2
- Tanti et al. (2011) Tanti K. K., Jayashree R., Duorah K., 2011, in International Journal of Scientific and Engineering Research, Volume 2, Issue 10.
- Torrelles et al. (2011) Torrelles J. M., et al., 2011, MNRAS, 410, 627
- Xu (2001) Xu Y., 2001, Chinese J. Astron. Astrophys., 1, 389
- Xu et al. (2009) Xu Y., Reid M. J., Menten K. M., Brunthaler A., Zheng X. W., Moscadelli L., 2009, ApJ, 693, 413
- Zhang et al. (2019) Zhang Y., et al., 2019, ApJ, 873, 73
- Zhao et al. (2020) Zhao B., et al., 2020, Space Sci. Rev., 216, 43
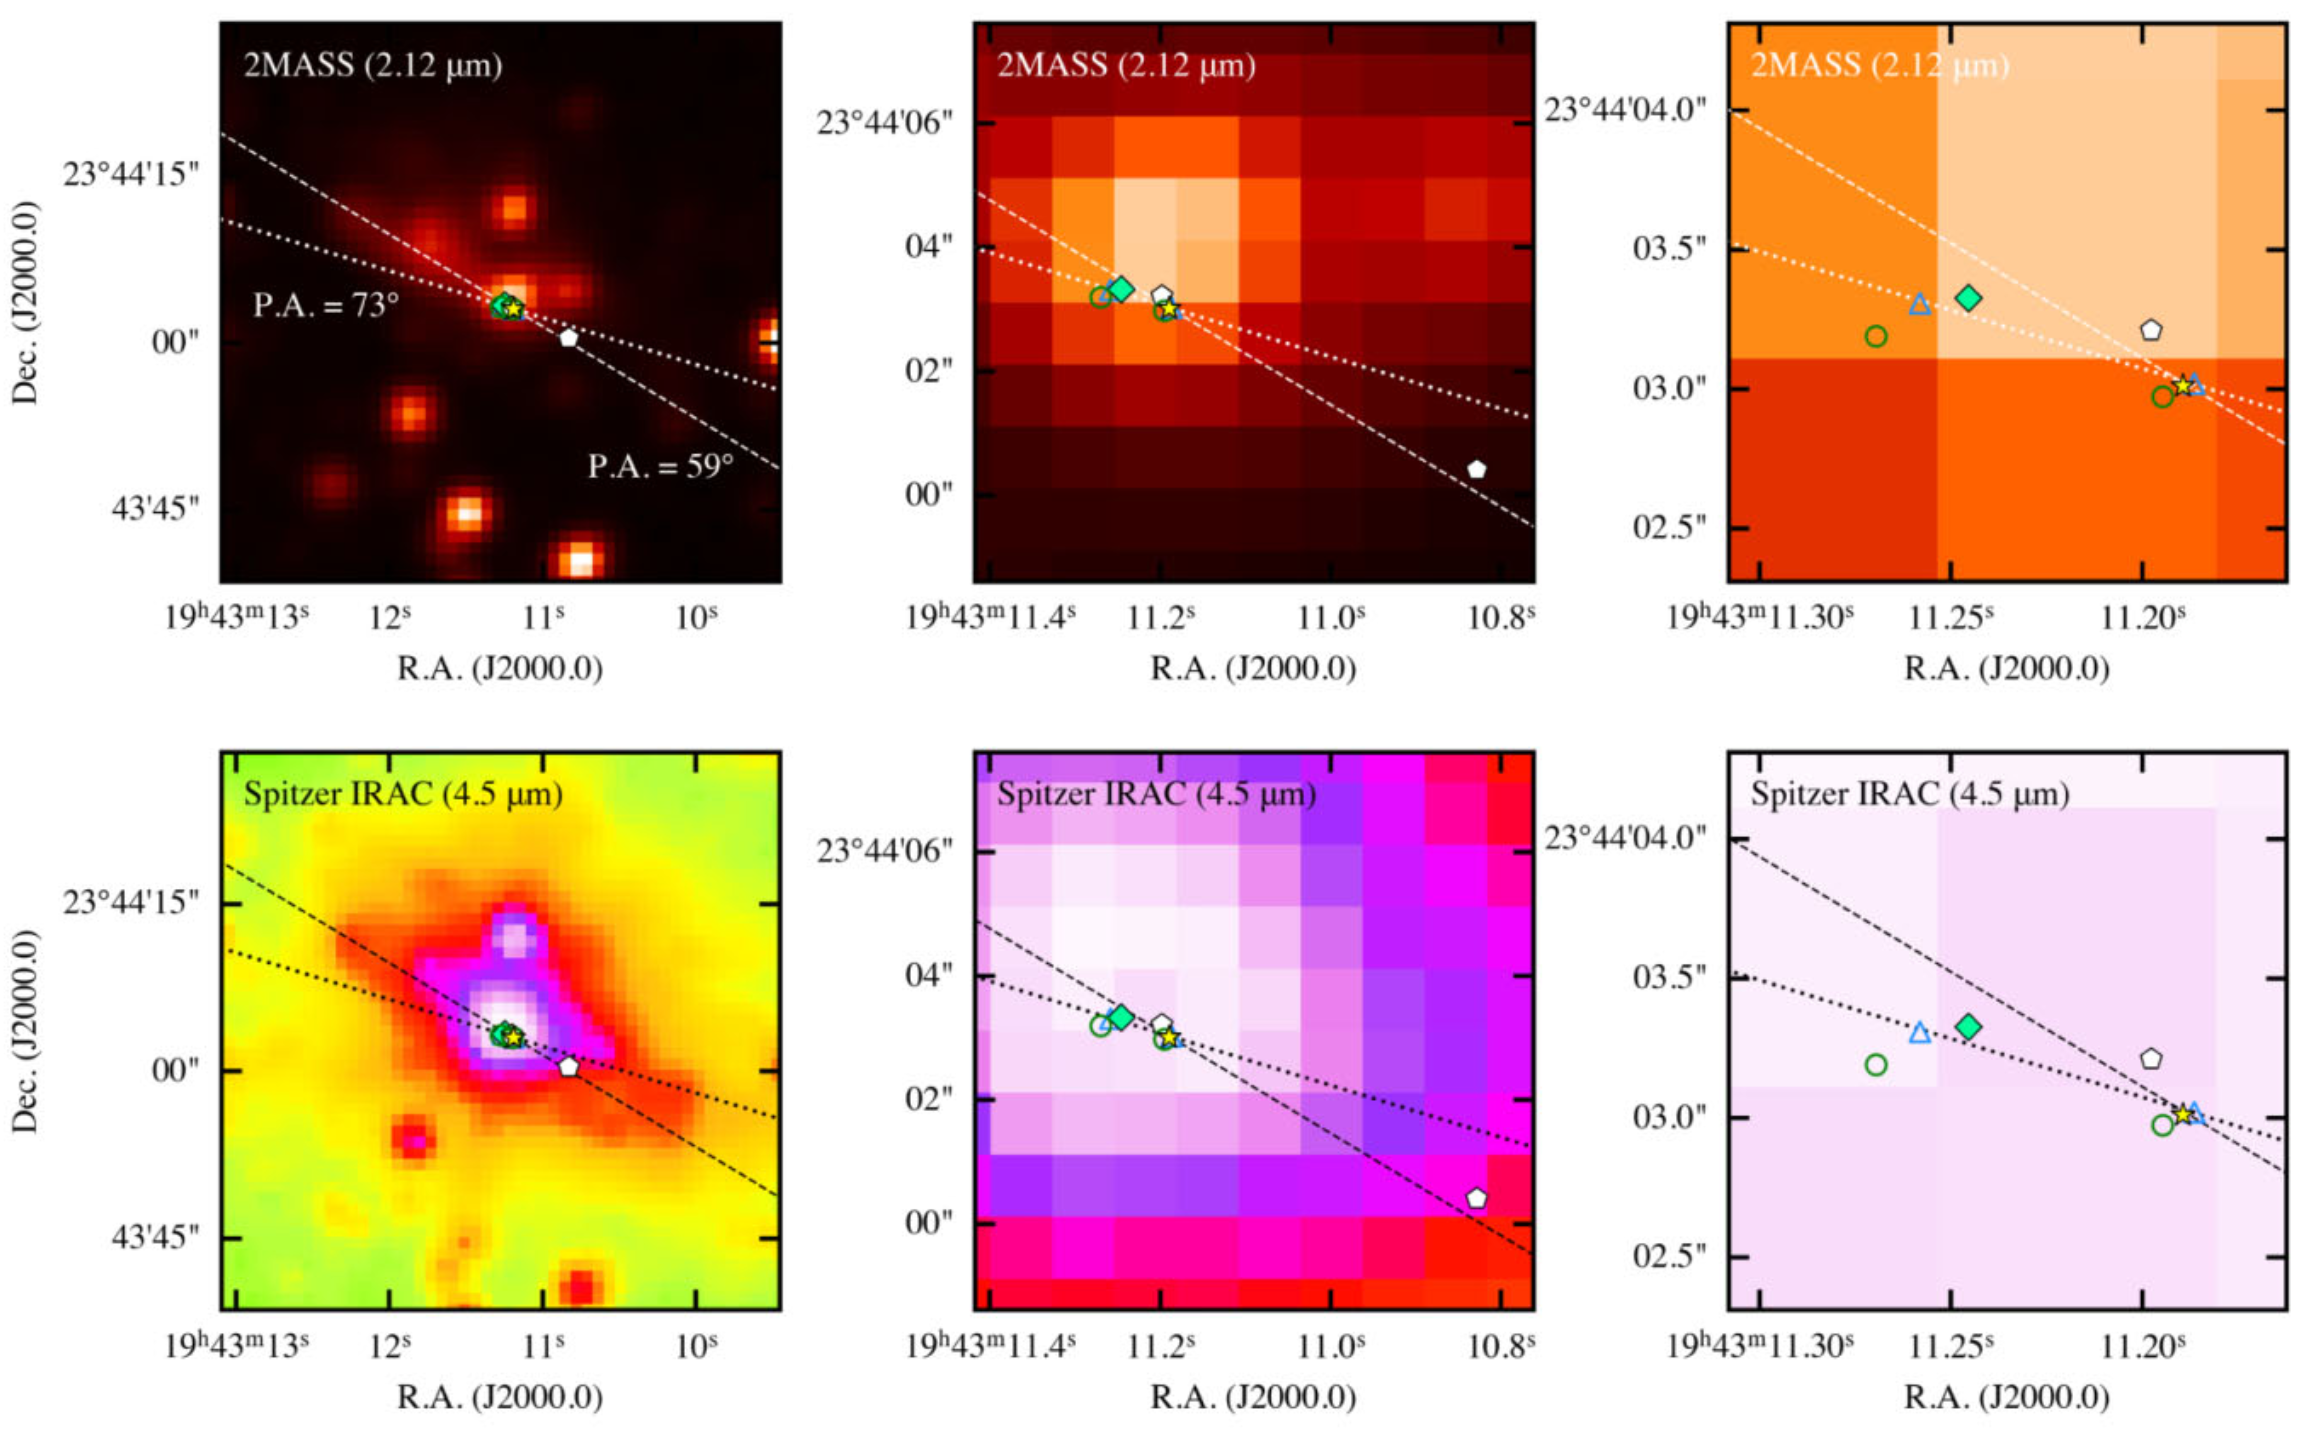
Appendix A Infrared view of G59
Figure 16 exhibits infrared view of G59 region from the Two Micron All Sky Survey (2MASS: Skrutskie et al., 2006) and the Spitzer Galactic Legacy Infrared Mid-Plane Survey Extraordinaire (GLIMPSE: Benjamin et al., 2003; Churchwell et al., 2009). We also showed several observational tracers in previous studies and this work.
Appendix B elliptical fitting
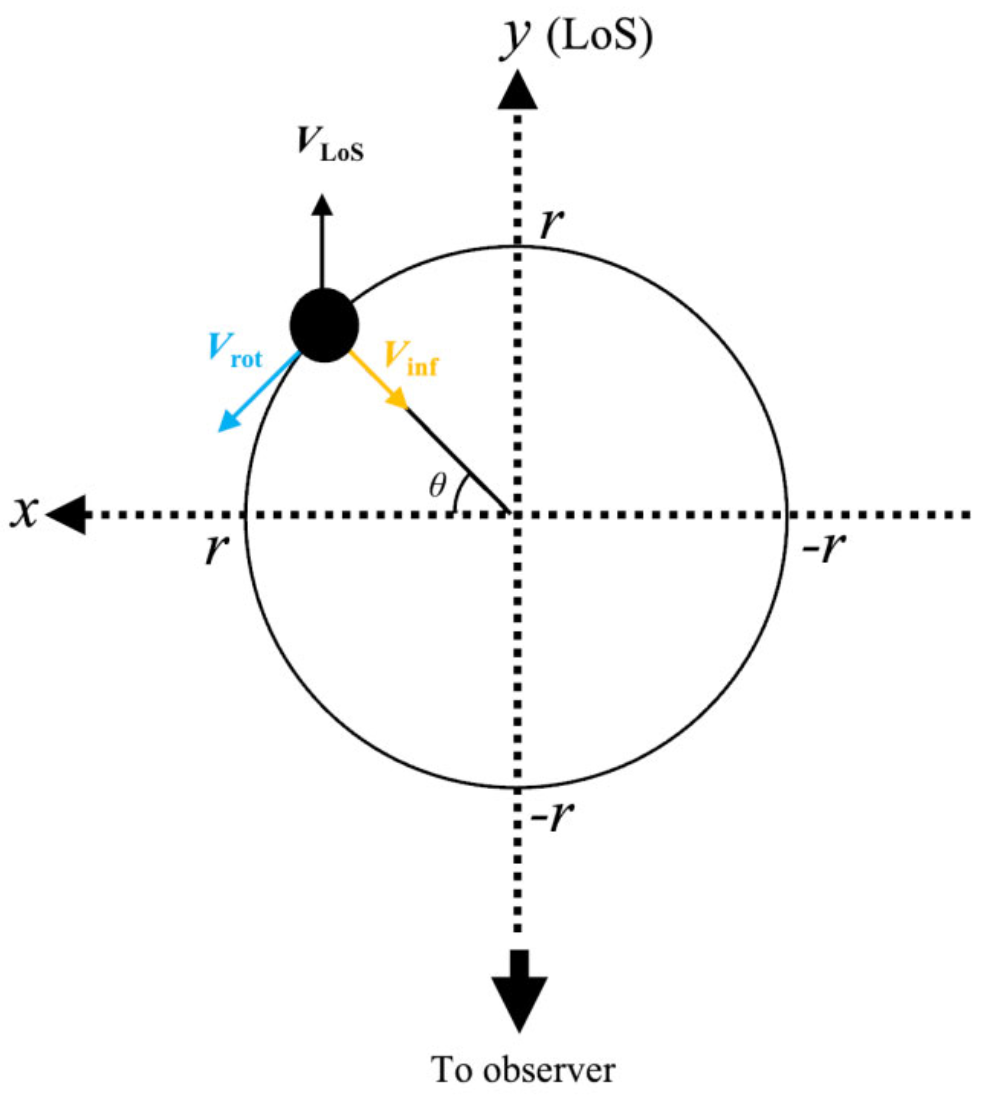
Figure 17 shows the setup of our maser ring model. An arbitrary point on the ring with a radius is expressed as = (). Here, we set the axis perpendicular to the LoS as in the diagram. The angle is measured clockwise from the axis to the LoS. We also define the rotating and infalling velocity of the ring as and , respectively. The rotating velocity is measured counterclockwise. The expanding velocity () is given by . When we observe this disc edge-on, the LoS velocity is as follows,
| (3) |
The value of is observationally determined by at a given for each maser features. These and can be expressed by , , , and as follows,
| (4) |
| (5) |
We obtain an equation of the ellipse on the diagram, substituting equation 4 and 5 into .
| (6) |
The equation 6 can be simplified using parameters , and as follows:
| (7) |
The parameters , , and were determined by the least square fitting on the observed diagram. Table 11 presents the best-fit parameters with 1- errors. We finally obtain , , and (see Table 10), solving the following relations:
| (8) | |||||
| (9) | |||||
| (10) |
| Parameters | |||
|---|---|---|---|
| [mas-2] | [mas-1 km-1 s] | [km-2 s2] | |
| Best-fit | |||
| Error () |
Appendix C All maser features detected
| Clustera | Name | b | c | b | RAd | RA | DECd | DEC | e |
| (km s-1) | (km s-1) | (Jy) | (mas) | (mas) | (mas) | (mas) | |||
| Epoch 1 | |||||||||
| E | w-1 | 25.15 | 0.84 | 2.05 | -154.090 | 0.017 | 116.476 | 0.017 | 5 |
| E | w-2 | 27.47 | 2.11 | 7.46 | -156.833 | 0.302 | 118.451 | 0.487 | 11 |
| E | w-3 | 28.73 | 1.90 | 4.64 | -157.942 | 0.197 | 119.277 | 0.146 | 10 |
| W | w-4 | 21.99 | 1.69 | 11.01 | -1139.334 | 0.037 | -170.030 | 0.054 | 9 |
| W | w-5 | 23.89 | 1.26 | 2.31 | -1139.992 | 0.071 | -170.255 | 0.019 | 7 |
| W | w-6 | 17.36 | 4.21 | 27.03 | -1144.981 | 0.177 | -168.978 | 0.084 | 21 |
| W | w-a | 4.09 | 2.53 | 3.26 | -1090.073 | 0.094 | -131.007 | 0.076 | 13 |
| W | w-b | 20.73 | 0.63 | 1.07 | -1138.007 | 0.063 | -170.908 | 0.056 | 4 |
| W | w-c | 21.57 | 4.42 | 9.51 | -1140.543 | 0.212 | -170.140 | 0.190 | 22 |
| Epoch 2 | |||||||||
| E | w-1 | 25.35 | 0.84 | 3.13 | -153.634 | 0.026 | 116.418 | 0.043 | 5 |
| E | w-2 | 27.03 | 1.26 | 4.72 | -156.936 | 0.075 | 119.015 | 0.129 | 7 |
| E | w-3 | 28.72 | 1.47 | 5.09 | -157.520 | 0.047 | 119.156 | 0.060 | 8 |
| W | w-4 | 21.77 | 2.11 | 62.74 | -1139.329 | 0.351 | -170.088 | 0.045 | 11 |
| W | w-5 | 24.08 | 1.05 | 1.83 | -1140.817 | 0.025 | -169.963 | 0.021 | 6 |
| W | w-6 | 17.34 | 3.58 | 13.58 | -1144.983 | 0.178 | -168.945 | 0.101 | 18 |
| W | w-b | 19.66 | 0.84 | 5.52 | -1137.141 | 0.029 | -170.779 | 0.007 | 5 |
| Epoch 3 | |||||||||
| E | w-1 | 25.39 | 0.84 | 3.01 | -153.076 | 0.012 | 116.317 | 0.037 | 5 |
| E | w-2 | 27.28 | 0.63 | 0.65 | -156.506 | 0.039 | 118.903 | 0.044 | 4 |
| E | w-3 | 28.55 | 1.69 | 5.24 | -156.979 | 0.061 | 119.082 | 0.032 | 9 |
| W | w-4 | 21.59 | 1.69 | 11.38 | -1139.142 | 0.201 | -170.198 | 0.022 | 9 |
| W | w-5 | 24.12 | 1.26 | 2.77 | -1140.647 | 0.025 | -170.042 | 0.024 | 7 |
| W | w-6 | 17.38 | 1.47 | 3.85 | -1145.020 | 0.087 | -168.986 | 0.050 | 8 |
| W | w-d | 11.90 | 0.63 | 1.27 | -1092.522 | 0.033 | -133.430 | 0.011 | 4 |
| W | w-e | 19.28 | 1.47 | 1.65 | -1140.316 | 0.022 | -170.651 | 0.096 | 8 |
| W | w-f | 19.28 | 1.69 | 1.17 | -1144.630 | 0.169 | -168.793 | 0.079 | 9 |
| Epoch 4f | |||||||||
| W | w-4 | 21.55 | 0.63 | 4.62 | -1139.385 | 0.048 | -170.118 | 0.018 | 4 |
| a E: Eastern cluster, W: Western cluster. | |||||||||
| b and flux density of the peak maser spot in each maser feature. | |||||||||
| c Total velocity ranges of spectral channels where maser spots were detected. | |||||||||
| d Relative coordinate of maser features (see main text). | |||||||||
| e Number of maser spots consists of a maser feature. | |||||||||
| f Relative position was extrapolated by a measured proper motion (See main text). | |||||||||
| Clustera | Name | b | c | b | RAd | RA | DECd | DEC | e |
| (km s-1) | (km s-1) | (Jy) | (mas) | (mas) | (mas) | (mas) | |||
| Epoch 1 | |||||||||
| E | m-1 | 19.25 | 1.06 | 19.01 | -0.121 | 0.640 | -0.331 | 0.600 | 7 |
| E | m-2 | 17.32 | 0.36 | 1.55 | -20.445 | 0.140 | -6.197 | 0.189 | 3 |
| E | m-3 | 17.14 | 0.53 | 2.13 | -25.529 | 0.659 | -7.844 | 0.236 | 4 |
| E | m-4 | 15.56 | 0.35 | 1.79 | -165.977 | 0.168 | 135.722 | 0.157 | 3 |
| E | m-5 | 24.70 | 1.23 | 1.97 | -260.561 | 0.290 | 80.099 | 2.385 | 8 |
| E | m-6 | 27.15 | 1.05 | 17.41 | -313.786 | 0.594 | 83.363 | 1.220 | 7 |
| W | m-7 | 16.97 | 0.53 | 1.72 | -1003.316 | 0.513 | -268.261 | 0.368 | 4 |
| W | m-8 | 20.13 | 0.53 | 1.31 | -1009.536 | 0.162 | -273.207 | 0.053 | 4 |
| W | m-9 | 19.78 | 0.35 | 1.32 | -1018.565 | 0.023 | -263.700 | 0.471 | 3 |
| W | m-10 | 15.39 | 0.87 | 5.80 | -1026.592 | 0.161 | -217.186 | 0.288 | 6 |
| W | m-11 | 14.69 | 0.35 | 0.87 | -1029.893 | 0.553 | -213.909 | 0.542 | 3 |
| W | m-12 | 19.43 | 0.53 | 1.23 | -1114.213 | 0.214 | -83.831 | 0.184 | 4 |
| W | m-13 | 19.60 | 0.70 | 1.52 | -1125.450 | 1.538 | -71.219 | 1.108 | 5 |
| W | m-14 | 19.95 | 0.70 | 3.12 | -1136.994 | 0.595 | -64.560 | 0.754 | 5 |
| W | m-a | 15.39 | 0.53 | 0.69 | -1043.648 | 1.006 | -222.300 | 0.481 | 4 |
| Epoch 2 | |||||||||
| E | m-1 | 19.19 | 0.97 | 25.04 | -0.072 | 0.496 | -0.511 | 0.731 | 12 |
| E | m-2 | 17.35 | 0.17 | 0.79 | -21.124 | 0.310 | -7.721 | 0.111 | 3 |
| E | m-3 | 17.08 | 0.18 | 1.08 | -26.317 | 0.272 | -7.435 | 0.065 | 3 |
| E | m-4 | 15.50 | 0.18 | 0.57 | -166.481 | 0.274 | 135.527 | 0.173 | 3 |
| E | m-5 | 24.72 | 1.06 | 1.36 | -260.433 | 0.414 | 79.824 | 2.496 | 13 |
| E | m-6 | 27.09 | 0.79 | 8.02 | -314.063 | 0.722 | 82.968 | 1.253 | 10 |
| W | m-7 | 16.99 | 0.61 | 0.83 | -1004.203 | 1.353 | -268.477 | 0.472 | 8 |
| W | m-8 | 20.07 | 0.35 | 0.40 | -1009.762 | 0.256 | -272.921 | 0.377 | 5 |
| W | m-9 | 19.63 | 0.44 | 0.55 | -1018.672 | 0.455 | -263.771 | 0.762 | 6 |
| W | m-10 | 15.33 | 0.61 | 2.06 | -1026.708 | 0.730 | -216.963 | 0.474 | 12 |
| W | m-11 | 14.71 | 0.35 | 0.57 | -1030.730 | 0.350 | -213.594 | 0.292 | 5 |
| W | m-13 | 19.72 | 0.35 | 0.47 | -1126.333 | 0.584 | -70.865 | 0.392 | 5 |
| W | m-14 | 19.98 | 0.36 | 0.50 | -1136.803 | 0.410 | -64.817 | 0.095 | 5 |
| Epoch 3 | |||||||||
| E | m-1 | 19.20 | 0.70 | 22.89 | 0.006 | 0.667 | -0.275 | 0.479 | 9 |
| E | m-2 | 17.27 | 0.18 | 2.32 | -20.438 | 0.112 | -6.955 | 0.236 | 3 |
| E | m-3 | 17.09 | 0.17 | 3.91 | -25.968 | 0.254 | -7.897 | 0.104 | 3 |
| E | m-4 | 15.60 | 0.09 | 1.66 | -166.073 | 0.026 | 135.808 | 0.007 | 2 |
| E | m-5 | 24.73 | 0.88 | 3.78 | -260.645 | 0.354 | 79.804 | 2.332 | 11 |
| E | m-6 | 27.19 | 0.70 | 19.87 | -314.117 | 0.835 | 83.187 | 1.262 | 9 |
| W | m-7 | 16.92 | 0.09 | 2.19 | -1003.151 | 0.210 | -268.016 | 0.032 | 2 |
| W | m-8 | 20.17 | 0.17 | 2.70 | -1010.044 | 0.034 | -272.743 | 0.286 | 3 |
| W | m-10 | 15.34 | 0.62 | 7.05 | -1026.692 | 0.319 | -217.202 | 0.322 | 8 |
| W | m-12 | 19.55 | 0.17 | 3.33 | -1115.891 | 1.054 | -83.102 | 0.910 | 3 |
| W | m-13 | 19.64 | - | 2.24 | -1124.373 | 0.349 | -72.566 | 0.398 | (1)f |
| W | m-14 | 19.99 | 0.62 | 19.99 | -1136.953 | 0.739 | -64.997 | 0.743 | 8 |
| a E: Eastern cluster, W: Western cluster. | |||||||||
| b and flux density of the peak maser spot in each maser feature. | |||||||||
| c Total velocity ranges of spectral channels where maser spots were detected. | |||||||||
| d Relative coordinate of maser features (see main text). | |||||||||
| e Number of maser spots consists of a maser feature. | |||||||||
| f Since only a single spot was detected, the m-13 feature at third epoch was not used for any analysis. | |||||||||
All CH3OH maser features detected Clustera Name b c b RAd RA DECd DEC e (km s-1) (km s-1) (Jy) (mas) (mas) (mas) (mas) Epoch 4 E m-1 19.18 0.74 42.43 -0.176 0.718 -0.394 0.556 19 E m-2 17.25 0.31 4.10 -21.730 0.989 -6.778 0.468 8 E m-3 17.12 0.18 10.14 -26.957 0.111 -7.429 0.158 5 E m-4 15.57 0.08 2.98 -167.336 0.249 136.348 0.344 3 E m-5 24.58 1.10 11.14 -261.710 0.562 80.809 2.152 26 E m-6 27.17 0.74 40.29 -315.750 0.845 83.525 1.575 18 W m-7 17.11 0.13 2.15 -1004.387 0.183 -267.125 0.298 2 W m-8 20.18 0.13 3.31 -1010.827 0.207 -272.848 0.295 4 W m-10 15.32 0.53 8.86 -1028.277 0.552 -216.423 0.430 13 W m-11 14.92 0.53 7.15 -1032.010 0.654 -213.249 0.655 13 W m-12 19.49 0.18 5.66 -1116.469 1.321 -83.073 1.210 5 W m-13 19.71 0.49 12.23 -1125.886 1.013 -72.143 0.790 12 W m-14 19.97 0.22 3.98 -1138.504 0.465 -64.601 0.318 6 Epoch 5 E m-1 19.19 0.75 88.39 -0.144 0.619 -0.399 0.636 19 E m-2 17.31 0.22 9.87 -21.531 0.301 -6.565 0.351 6 E m-3 17.09 0.31 22.27 -26.522 0.823 -7.455 0.295 8 E m-4 15.55 0.13 6.00 -167.614 0.360 136.710 0.160 4 E m-5 24.16 1.05 21.19 -261.895 0.578 80.702 2.174 27 E m-6 27.18 0.75 81.20 -315.782 0.920 83.695 1.444 18 W m-9 19.81 0.53 28.95 -1020.642 0.503 -263.638 0.449 13 W m-10 15.38 0.57 18.44 -1028.179 0.660 -216.453 0.359 14 W m-11 14.89 0.48 14.11 -1031.831 0.735 -213.335 0.718 12 W m-12 19.50 0.22 14.83 -1116.180 1.321 -83.266 1.204 6 W m-13 19.63 0.26 27.58 -1125.871 1.089 -72.131 0.785 12 W m-14 19.94 0.26 14.19 -1138.406 0.269 -64.681 0.192 7 W m-b 15.55 0.09 10.15 -1013.129 0.168 -192.151 0.058 3 Epoch 6 E m-1 19.22 0.83 45.71 -0.319 0.704 -0.499 0.620 21 E m-2 17.29 0.26 5.42 -21.115 0.421 -6.058 0.190 7 E m-3 17.11 0.35 12.11 -26.864 0.888 -7.486 0.264 9 E m-4 15.66 -0.18 15.66 -167.779 0.251 137.019 0.189 5 E m-5 24.44 1.14 17.51 -262.356 2.204 80.705 2.204 32 E m-6 27.21 0.75 41.78 -316.367 0.825 83.880 1.463 18 W m-9 19.83 0.48 10.54 -1021.039 0.437 -263.347 0.578 13 W m-10 15.31 0.57 15.31 -1028.506 0.483 -216.324 0.326 14 W m-11 14.87 0.66 9.03 -1032.338 0.596 -213.122 0.572 16 W m-13 19.70 0.57 13.24 -1126.276 1.092 -72.138 0.780 14 W m-14 20.01 0.04 2.61 -1139.023 0.311 -64.488 0.404 2 E m-c 20.18 0.13 2.89 78.740 0.312 185.986 0.186 4 a E: Eastern cluster, W: Western cluster. b and flux density of the peak maser spot in each maser feature. c Total velocity ranges of spectral channels where maser spots were detected. d Relative coordinate of maser features (see main text). e Number of maser spots consists of a maser feature.