Stable accretion in young stars: The cases of EX Lupi and TW Hya
Abstract
We examine the long-term spectroscopic and photometric variability of EX Lupi and TW Hya, studying the presence of stable accretion and the role it plays in the observed variability. Analysing the velocity modulations of the emission lines with STAR-MELT, we obtain information on the structure of the accretion columns and the disk-star connection. The emission line radial velocities reveal that TW Hya, like EX Lupi, has a remarkably stable or slow-varying accretion column footprint, locked to the star for several years. The line-emitting regions are non-polar for both EX Lupi and TW Hya, and species with different energies differ in position. In contrast, the continuum emission as observed in the photometry is very variable and can be modelled by hot spot(s) that change over time in phase, shape, temperature, size, and location with respect to the emission line region. The continuum emission region may not be limited to the stellar surface, especially during episodes of high accretion. The broad line emission observed in EX Lupi during episodes of increased accretion reveals a further structure, which can be fitted by non-axisymmetric disk in Keplerian rotation inwards of the corotation radius. Since the radial velocity modulation due to accretion footprints is so stable, we used it to search for further velocity modulations. While no residual modulation (other than caused by stellar rotation) is found in these objects, a similar analysis could help to identify young planets/companions. Therefore, determining whether stable accretion footprints are common among young stars is a key to detect young planets.
keywords:
stars: pre-main-sequence – stars: circumstellar matter – stars: variables: T Tauri, Herbig Ae/Be – stars: individual: EX Lupi, TW Hya1 Introduction
Young, pre-main sequence stars have spectra rich in emission lines. These lines have been, since the beginning, one of the defining characteristics of T Tauri stars (TTS; Joy, 1945). They are highly variable, especially in accreting stars (classical T Tauri stars, CTTS). CTTS lines include forbidden and permitted transitions and typically display broad and narrow components (BC and NC) that originate in different structures around the object, including accretion columns and their hot spots footprints, and winds (Hamann & Persson, 1992; Hamann, 1994; Beristain et al., 1998; Dodin & Lamzin, 2012). The variability in the line profiles reveals the structure and distribution of the accretion columns around the star (Alencar et al., 2001), their stability over time (Kurosawa & Romanova, 2013), and the spatial scales of the disk wind (Fang et al., 2014).
The last two decades have seen substantial work concentrated on modelling the Hydrogen and Helium emission lines to constrain accretion rates (e.g. Muzerolle et al., 1998; Lima et al., 2010; Alencar et al., 2012; Alcalá et al., 2014, 2017), although the metallic lines also provide information about the processes taking place on the surface of the star (Beristain, 2000; Sicilia-Aguilar et al., 2015), including chromospheric activity (Ingleby et al., 2011). In particular, the typically narrow, metallic emission lines are very useful to track the location of the footprints of accretion columns and their time variability in CTTS (Sicilia-Aguilar et al., 2015; Campbell-White et al., 2021). These metallic lines tend to be less saturated and not so much affected by self-absorption and/or extended emission from the accretion columns themselves or from winds. Different metallic lines often originate in regions with different temperatures and densities, thus being very useful to study the post-shock accretion region and to track the accreting material. The study of the NC has revealed that, at least in some objects, the line-emitting region is surprisingly stable over several years (Sicilia-Aguilar et al., 2015; Campbell-White et al., 2021). This stability of accretion structures can explain the difficulties detecting periodic signals from companions or exoplanets, since radial velocity modulations due to accretion can pervade the data over decades (Kóspál et al., 2014).
The main limitation to use the NC metallic lines velocities is that the post-shock region is very close to the stellar surface (Dodin & Lamzin, 2012) and, if located at high latitudes, the modulation caused by the rotation of the star spans only a fraction of the projected rotational velocity, v (Gahm et al., 2013; Sicilia-Aguilar et al., 2015; McGinnis et al., 2020). We thus need to study many high-resolution spectra over time and extract with high accuracy as many lines as possible. This is now feasible thanks to the STAR-MELT code (Campbell-White et al., 2021), which enables a quick extraction and analysis of the emission lines.
Here, we present the STAR-MELT analysis of EX Lupi and TW Hya, two well-known young stars for which there are large numbers of high-resolution spectra available. Both objects have unmistakable signatures of different types of variability, ranging from year-long accretion bursts (EX Lupi; Herbig, 2007) to hours-timescale events (TW Hya; Dupree et al., 2012). They thus represent two very different cases among young stars, despite their similar spectral type and mass. We take a first step expanding the study of the stability of accretion columns, combining the emission line analysis with ground-based and TESS photometry to improve our understanding of accretion around very different systems. We also examine the causes behind the photometric variability, and use the spectroscopic data to explore further periodic or quasi-periodic signals over longer timescales. The NC of EX Lupi have been already thoroughly examined (Sicilia-Aguilar et al., 2015; Campbell-White et al., 2021), so we concentrate on the BC and the photometry. TW Hya is one of the most observed young stars, and thus offers a great opportunity to test the capabilities of STAR-MELT and the feasibility of using line velocities to find the rotational period in objects with irregular photometry. Section 2 discusses the available observations. Section 3 presents the analysis of both the spectroscopy and photometry data. The results are discussed in Section 4 and summarised in Section 5.
2 Presenting the data and observations
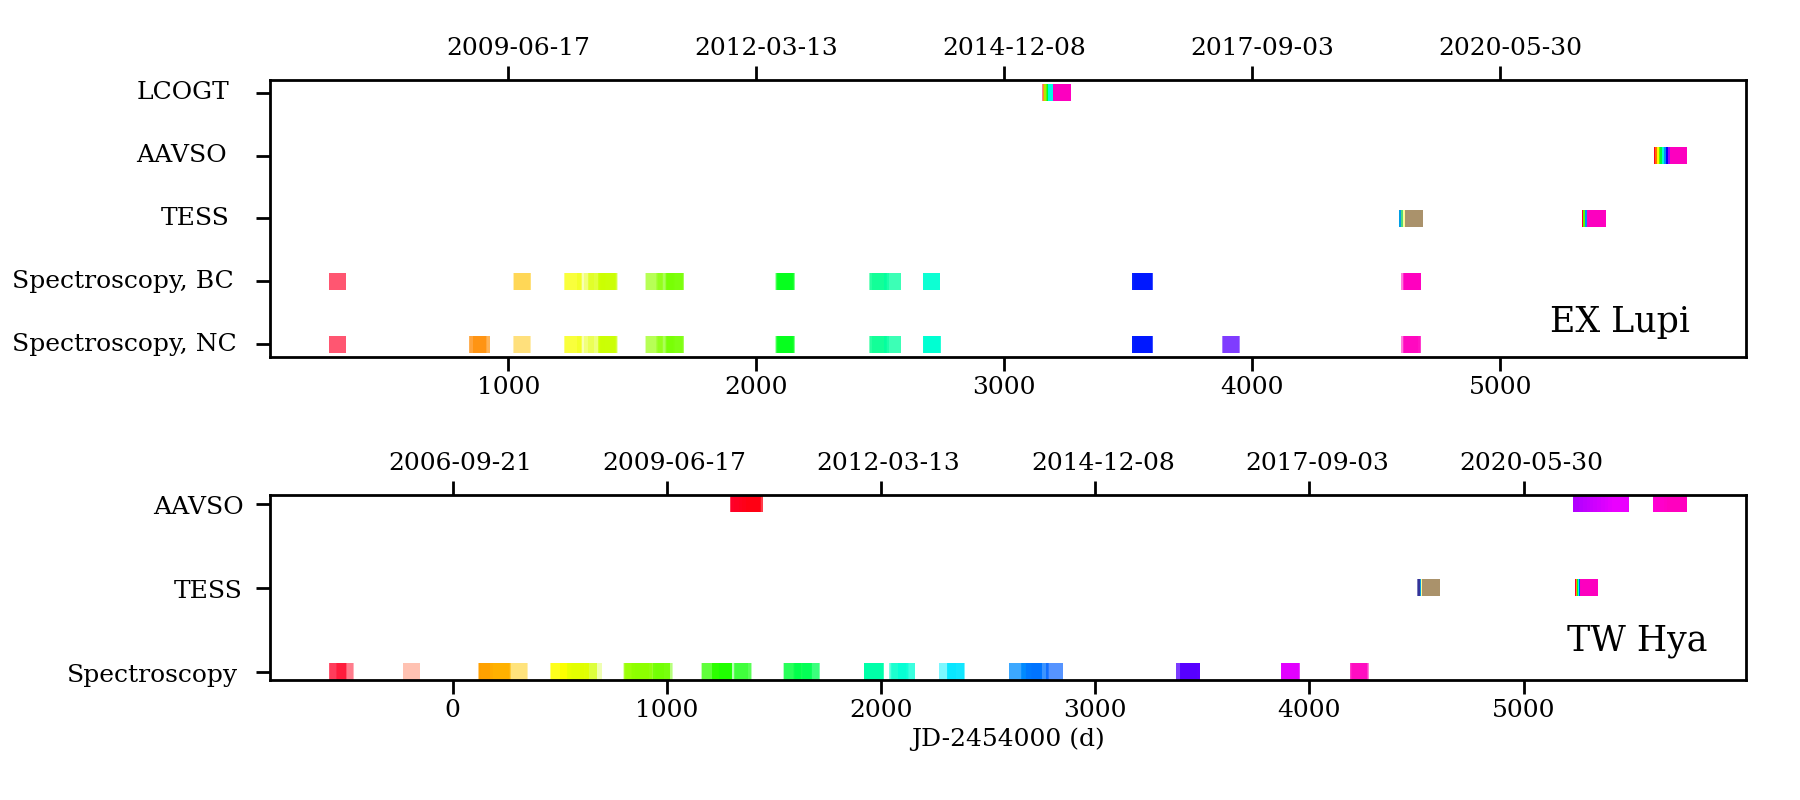
In this section, we briefly describe the sources and available data. Figure 1 presents the data available and temporal coverage.
2.1 A brief summary of source properties
Since some source properties are important for the analysis, and some of them are further revised in our work, we summarise them here.
EX Lupi is the prototype of the EXor class, low-mass stars with recurrent accretion outburst with timescales between months to years (Herbig, 1977; Herbig et al., 2001; Herbig, 2008; Audard et al., 2014; Fischer et al., 2022). As such, it has been typically studied during outburst. Although EX Lupi can increase in brightness by several magnitudes during strong outbursts (Herbig, 1977; Jones, 2008), it also shows milder accretion variations on a continuous basis (Lehmann et al., 1995) and bursts (Cruz-Sáenz de Miera et al., 2023), which alter the number, strength, and width of the many emission lines in its spectrum (Sicilia-Aguilar et al., 2015). The Gaia DR3 parallax for EX Lupi is 6.4630.015 mas (RUWE=1.115; Gaia Collaboration et al., 2016, 2021), giving distance of 154.70.4 pc. EX Lupi has a 7.417d rotation period, first determined via the radial velocities of its emission lines (Sicilia-Aguilar et al., 2015) and later confirmed using TESS data from sector 12 (Campbell-White et al., 2021). This rotation period, together with the wealth of emission lines and line-dependent veiling, is responsible for the radial velocity modulation of its photospheric spectrum (Kóspál et al., 2014; Sicilia-Aguilar et al., 2015). According to our previous NC work (Sicilia-Aguilar et al., 2015) and to inner disk modeling (Sipos et al., 2009), the system has a low-to-intermediate inclination ( 20-40∘), also confirmed for the outer disk with ALMA (32∘; White et al., 2020). The matter content in the inner disk is known to change as result of the outbursts, and the inner disk structures are non-axisymmetric (Kóspál et al., 2011; Goto et al., 2011; Sicilia-Aguilar et al., 2012; Banzatti et al., 2015).
TW Hya is one of the best studied CTTS thanks to its privileged distance, 60.140.05pc (Gaia DR3, RUWE=1.175, parallax 16.6290.015 mas; Gaia Collaboration et al., 2016, 2021). The system is viewed at low inclination (Qi et al., 2004; Huang et al., 2018). If the inclination of the star is similar to the inclination of the inner disk, which is not too different from the outer disk inclination, the value would be 4.31.0∘ (Pontoppidan et al., 2008), although the stellar inclination may be somewhat higher (15∘ Donati et al., 2011) and there is evidence of misaligned structures (Debes et al., 2023). Since the radial velocities of spectral lines at the stellar surface are very small, TW Hya also tests the capabilities of STAR-MELT.
TW Hya has a rotational period of 3.56 d (Huélamo et al., 2008), albeit not as clear as the one of EX Lupi. Huélamo et al. (2008) report photometric variations with periods of the order of 6.1 and 6.5 d, while Siwak et al. (2014, 2018a) detected oscillations with 4.18 d and 3.7-3.8d periods using MOST on two different epochs, Rucinski et al. (2008) found considerable noise and a 3.7 d peak, and Dupree et al. (2012) retrieved a photometric period of 4.774 d. The difficulty in determining the rotational period via photometry arises from the very irregular, bursting lightcurve. At very low inclinations, significant changes in the visibility of photometric spots are rare, but we also note that the day-to-day variability in TW Hya is nearly as large as that of EX Lupi in quiescence, albeit not periodic. TW Hya is a relatively fast rotator and has a non-negligible projected rotational velocity (=6.21.3 km/s or 73 km/s, Weise et al., 2010; Venuti et al., 2019, respectively). The accretion rate is low, 3 M⊙/yr (Weise et al., 2010; Venuti et al., 2019), as expected for a relatively evolved disk in a 8 Myr old association (Donaldson et al., 2016).
2.2 Spectroscopy
The spectroscopy data were obtained from public programs via the European Southern Observatory (ESO) Science Portal111http://archive.eso.org/scienceportal/home and the Canada-France-Hawaii Telescope archive222https://www.cadc-ccda.hia-iha.nrc-cnrc.gc.ca/en/search/, see Table 5 for a summary of observations. The data comprise observations from the high-resolutions spectroscopes HARPS (High Accuracy Radial-Velocity Planet Searcher; R115,000, wavelength coverage 3780-6710 Å; Mayor et al., 2003), FEROS (Fiber-fed Extended Range Optical Spectrograph, R48,000, wavelength coverage 3500-9200 Å with some gaps; Kaufer et al., 1999), and ESPaDOnS (Echelle Spectro Polarimetric Device for the Observation of Stars; intensity spectra with R65,000, wavelength coverage 3700-10500 Å with some gaps; Donati et al., 1997; Moutou et al., 2015). They were reduced by the corresponding instrument pipelines, which are well suited for our purposes (Campbell-White et al., 2021). For FEROS, the barycentric correction was further revised following Müller et al. (2013).
TW Hya was observed using FEROS (183 spectra), HARPS (34 spectra), and ESPaDOnS (213 spectra), taken between 2005 and 2018. EX Lupi was observed between 2007 and 2019. Here, we concentrated on the BC, which are seen in the strongest lines during periods of increased accretion (see Sicilia-Aguilar et al., 2015). The spectra displaying significant BC were selected after visualization with STAR-MELT. This resulted in 62 observations for EX Lupi, taken between 2007 and 2014 (excluding the 2008 outburst data, which was analysed by Sicilia-Aguilar et al., 2012) where the BC were strong enough to be fitted and extracted. Not all the lines are visible in all the spectra, and the BC of lines such as Ca II and Fe II are mostly visible during periods of increased accretion.
2.3 LCOGT photometry
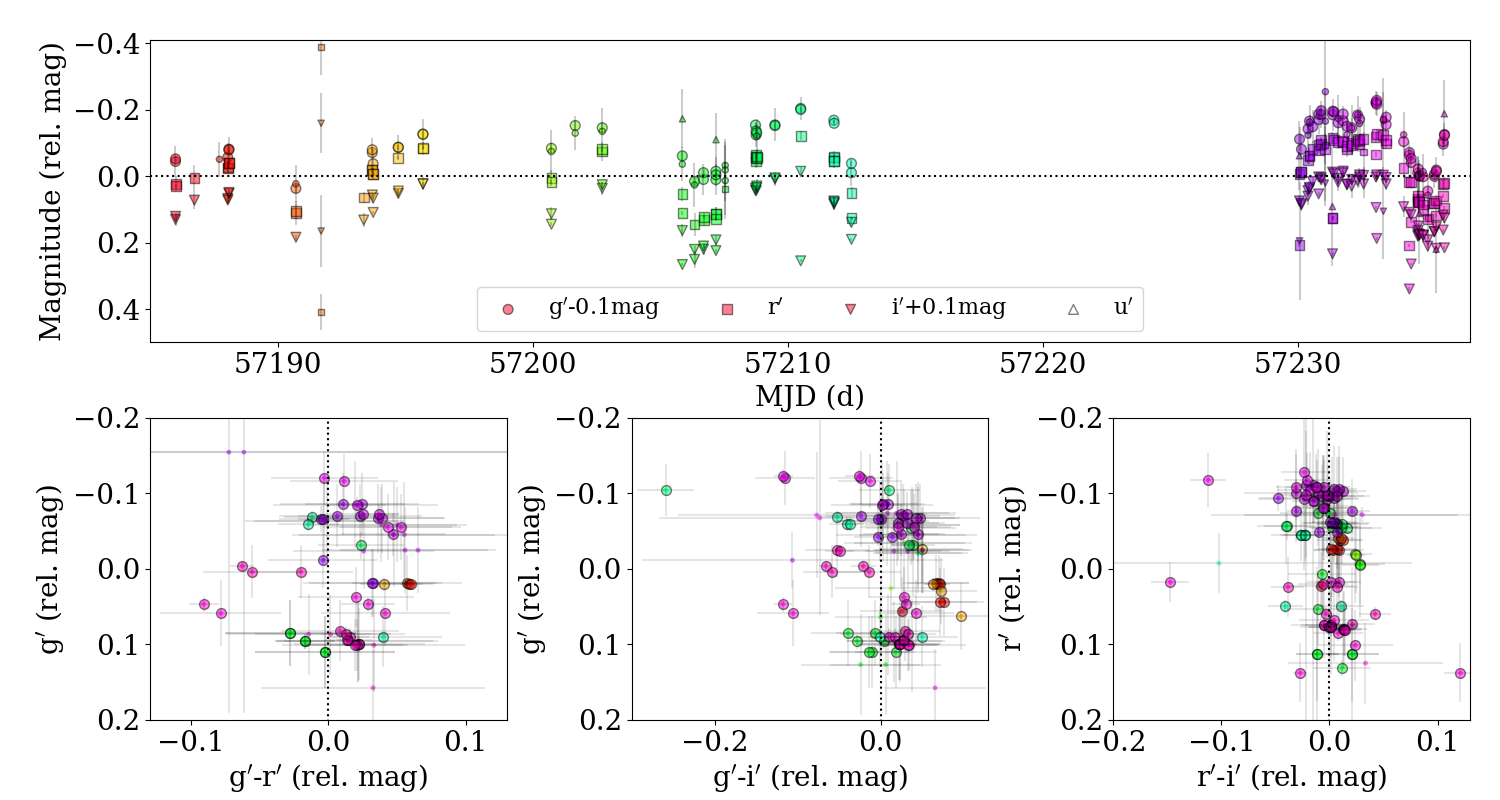
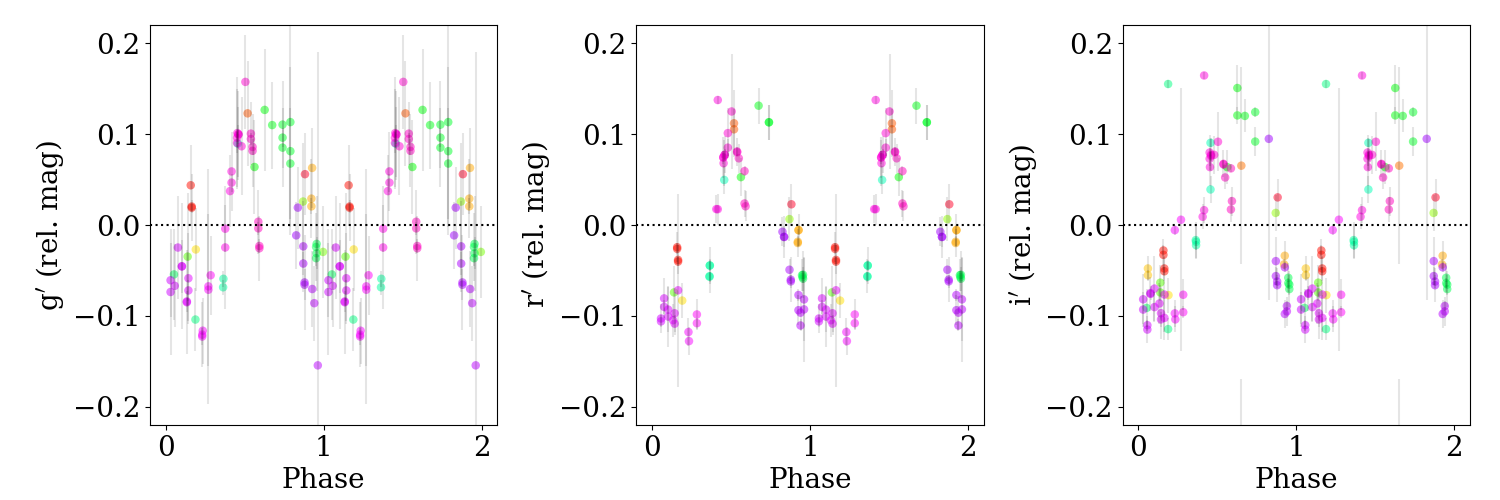
We obtained photometric data for EX Lupi with the automated 1m telescopes from Las Cumbres Observatory Global Telescope Network (LCOGT; Brown et al., 2013), between June and August 2015, a phase or relative quiescence. Observations were taken at variable cadences between hours to days, with a higher cadence during the last 5 days. Each set of observations consisted of 10s and 100s exposures (for g’,r’,i’) and a 300s exposure for the u’ band. LCOGT provides the basic data calibration, including bias, flat field and an astrometry solution. We performed aperture photometry using Python . The automated astrometry solution had numerous failures throughout the dataset, so we used (Astropy Collaboration et al., 2013, 2018) and task to refine the coordinate solution (Lang et al., 2010). A relative calibration was obtained using stars with similar magnitudes within the field of view (following Sicilia-Aguilar et al., 2013; Sicilia-Aguilar et al., 2017). The calibration failed when it had less than 5 comparison stars or when the relation was non-linear. A large number of u’ band images failed due to their few sources. Excluding the failed data, this resulted in 8 photometry points for u’, 107 data points each for g’ and r’, and 106 for i’. The lightcurve is shown in Fig. 2 and the relative photometry is listed in Table 6.
To study the colour variations, measurements from different bands were considered simultaneous if taken within 30 min. Given the 7.417d rotational period (Sicilia-Aguilar et al., 2015) and what we see in TESS data, the uncertainties arising from this time lapse are minimal. When more than one measurement was available within 30 min, all were used to derive the colour, so the spread gives information on the uncertainty. We also removed points that deviate by more than 1.5 sigma from those taken within the same 2h (a range in which the lightcurve does not show significant variations).
2.4 AAVSO photometry
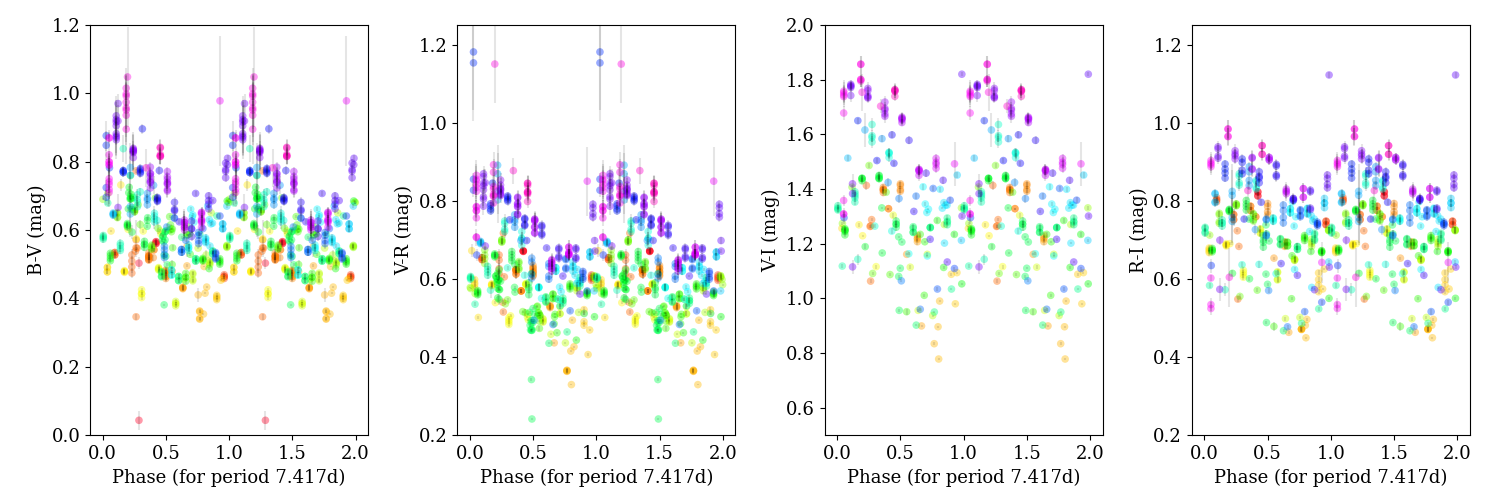
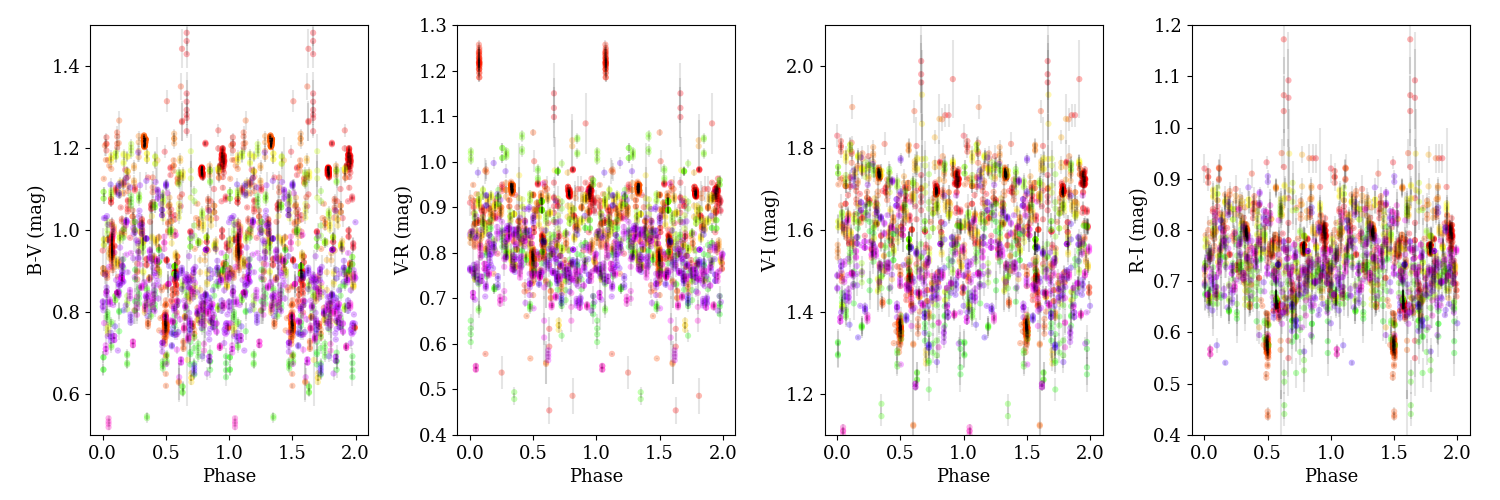
To offer a similar multi-band photometry view for TW Hya, we used data from the American Association of Variable Stars Observers (AAVSO; Kafka, 2021; Kloppenborg, 2022), available via the AAVSO database333See https://www.aavso.org. The data we use comprised verified observations in Johnsons filters B,V,R and I, contributed by different observers, and obtained between JD 2459269 and JD 2459724, comprising 847 (B), 949 (V), 777 (R) and 686 (I) datapoints. Many observations are nearly-simultaneous (taken within less than 6 min), and were used to explore colour variations. Older data and other filters had worse sampling and higher uncertainties, so they are not considered. The data are displayed in Fig. 3.
| TW Hya |
 |
| EX Lupi |
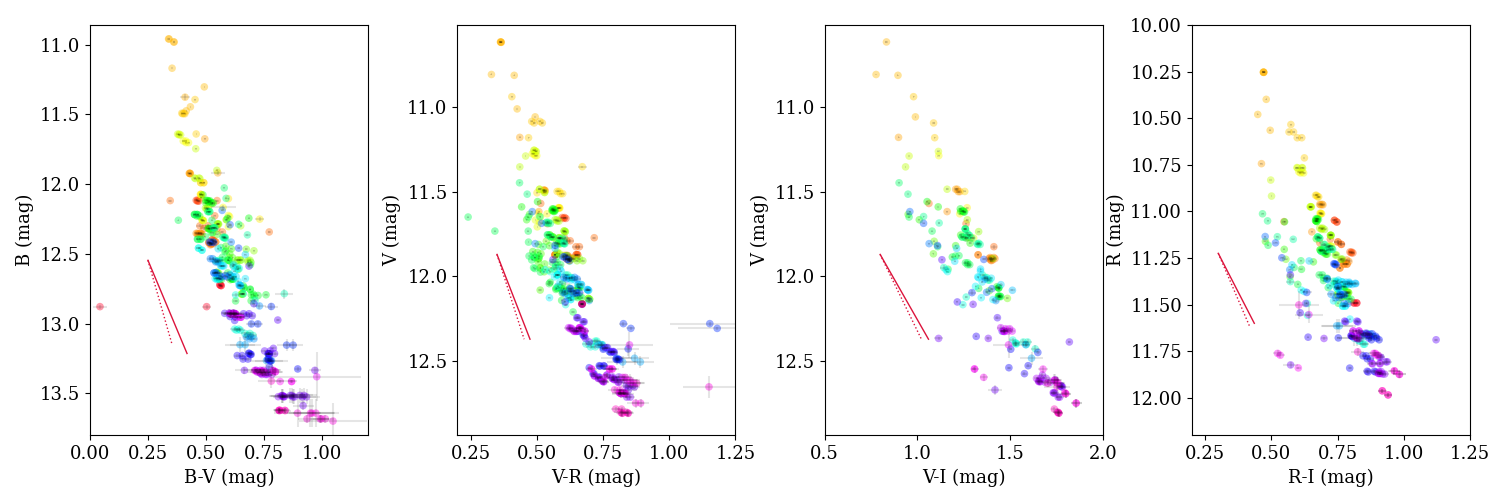 |
The AAVSO also contains data for EX Lupi (see Fig. 3, bottom), acquired during and after the 2008 outburst (visual filter only) and during a recent significant outburst (Johnsons filters B,V,R, and I), so they are not directly comparable with our quiescence LCOGT data. On the other hand, the multiwavelength dataset offers a very good view of the photometric changes during episodes of increased accretion, displaying the contrast between quiescence and outburst, unlike the LCOGT and TESS data. We thus chose to include the 2022 burst data for our analysis, non-uniformly sampled between JD 2459651 and JD 2459720, and containing 248, 316, 242, and 190 datapoints in B, V, R and I, respectively.
2.5 TESS photometry
Both EX Lupi and TW Hya have been observed by the the Transiting Exoplanet Survey Satellite (TESS; Ricker et al., 2015). We use the TESS data to verify the rotational period and to identify other types of variability that may affect the spectral lines, such as extinction events or buster behaviour.
EX Lupi was observed by TESS in sectors 12 (2019-05-21 to 2019-06-19, 30 min cadence) and 39 (2021-05-26 to 2021-06-24, 10 min cadence). The lightcurve data were obtained from the Barbara A. Mikulski Archive for Space Telescopes (MAST444https://mast.stsci.edu/portal/Mashup/Clients/Mast/Portal.html; Powell et al., 2022). For TW Hya, the TESS observations correspond to Sector 9 (2019-Feb-28 to 2019-Mar-26, 30 min cadence) and Sector 36 (2021-Mar-07 to 2021-Apr-02, 10 min cadence). Since the lightcurves were not available, we used 555https://pypi.org/project/eleanor/ (Feinstein et al., 2019; Brasseur et al., 2019) to extract them. Following our previous experience (Campbell-White et al., 2021), we used the principal component analysis (PCA) to detrend the data. There were no significant differences when using various types of apertures, and the MAST lightcurves for EX Lupi were essentially identical if extracted with , demonstrating their robustness.
Both objects show flares and burster behaviour (especially, TW Hya and, to a lesser extent, EX Lupi during 2021), but there is no evidence of dips or occultations by circumstellar material. Those are not seen in the ground-based photometry either, suggesting that the observed variability is dominated by rotation in objects with hot and/or cold spots and accretion variability.
3 Analysis
In this section, we first analyse the NC emission lines, which provide the best information about stellar rotation in both objects as first step to derive a coherent picture, adding later the multi-wavelength, multi-cadence photometry data. We start with the processes on the stellar surface or close to it (e.g. spots), later moving onto the BC emission lines, which are related to extended and more complex structures. Our aim is to compare all the data, so we begin by displaying the phase-folded data for both objects in Fig. 4 and 5. They are the reference for the analysis and discussion that follow.
| He II 4686Å | TESS | ||
|---|---|---|---|
 |
 |
| LCOGT |
|---|
 |
 |
| AAVSO |
 |
 |
| HeI 5016Å | FeII 5018 | TESS |
|---|---|---|
 |
 |
 |
| AAVSO |
 |
 |
| AAVSO for JD=2459640-2459680 |
 |
3.1 STAR-MELT line extraction and basic analysis
The line identification and fitting was done with STAR-MELT (Campbell-White et al., 2021). The STAR-MELT extraction and analysis of the NC for EX Lupi was presented in Campbell-White et al. (2021), revealing a very stable (or very slowly-changing, with timescales of years), single accretion hot spot, its location not affected by variations in the accretion rate, dominating the NC emission. This work thus concentrates on the BC, discussed in Section 3.5.
| Fe II 5018Å | He I 5016 Å | Ca II 8498Å |
|---|---|---|
 |
 |
 |
 |
 |
 |
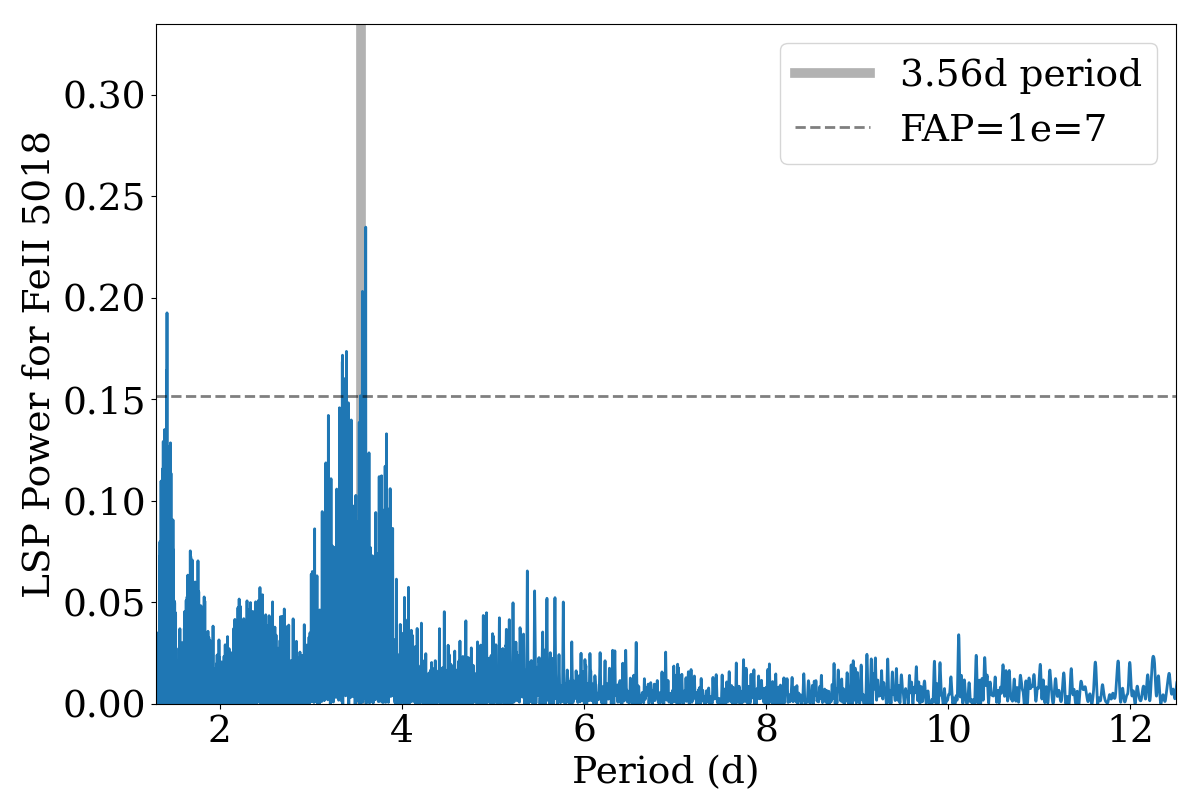
For TW Hya, we performed the same process as in Campbell-White et al. (2021), finding the emission lines in the average spectrum, creating a list of lines, and then fitting the NC with one positive Gaussian to determine the line velocity. Not all the lines were detected in all spectra due to differences in spectral coverage between instruments, variations in line strength (e.g. related to accretion variability), and signal-to-noise ratio (S/N). Only lines detected well over 3 were analysed. The analysis relies on the line velocity, not its intensity. The fit line velocity was corrected by the stellar radial velocity, estimated by STAR-MELT via cross-correlating regions of the spectra without emission lines with a template with a similar spectral type. For TW Hya, we measured radial velocity =12.260.11 km/s and projected rotational velocity v=4.60.7 km/s. Both were derived for each high-resolution instrument (FEROS, ESPaDOnS, HARPS) independently, and the final result is the weighted average. All the results are consistent, with HARPS giving a slightly lower value (v=3.30.5 km/s), while the rest of measurements range from 4.3 to 5.3 km/s with a typical uncertainty 0.3–0.5 km/s.
The NC lines were fitted using a 20–70 km/s window, chosen to cover the line width and to minimize the goodness-of-fit parameter (GOF, similar to a ) over the largest number of lines. The Ca II IR lines are broad and best fit with a 70km/s window, while for He I and H I lines 30–50 km/s is more appropriate, and narrow Fe II lines are best done with a 20 km/s window. The results of using different windows are essentially identical. We rejected any line for which the Gaussian fit failed or GOF0.3–1 (depending on the line width, since the GOF is worse for broader lines), those with uncertain velocities (compared with the typical line velocity and velocity width) and/or deviating more than 3 with respect to the rest of the measurements. As a brief comment on line width, the typical FWHM of the lines is 10–20 km/s for the metallic NC, too large to be of thermal origin. This suggests a highly turbulent region as expected in the accretion post-shock region (Hartmann et al., 2016). The lines observed in TW Hya are listed in Table 1.
| Species | Wavelength | Aki | Ei-Ek | Notes |
|---|---|---|---|---|
| (Å) | (s-1) | (eV) | ||
| Ca II | 3933.66 | 1.47e8 | 0.000 - 3.151 | ZCMa/EXLup |
| Ca II | 3968.47 | 1.40e8 | 0.000 - 3.123 | ZCMa/EXLup |
| H I | 3970.04 | 4.39e5 | 10.199 - 13.321 | EXLup |
| He I | 4026.19 | 1.16e7 | 20.964 - 24.043 | EXLup |
| H I | 4101.71 | 2.86e6 | 10.199 - 13.221 | ZCMa/EXLup |
| H I | 4340.47 | 2.53e6 | 10.199 - 13.055 | ZCMa/EXLup |
| He I | 4471.48 | 2.46e7 | 20.964 - 23.736 | EXLup |
| He II | 4685.8 | 2.21e8 | 48.372 - 51.017 | EXLup |
The line velocity data were examined using a generalised Lomb-Scargle Periodogram (LSP; Scargle, 1982; Horne & Baliunas, 1986; Zechmeister & Kürster, 2009; VanderPlas, 2018) as available via Python , to identify the most likely periodic signals in the data. Lines that have a LSP peak around the rotational period are considered rotationally modulated. The strength of a periodic signal is evaluated via the false-alarm probability (FAP), which we calculated using the Baluev approximation that assumes that the noise is white and uncorrelated. This provides a lower limit to the FAP, since time-resolved observations are affected to some extent by red noise and cadence-related issues. Our aim is not to independently derive a rotational period for every line, but to check which lines are consistent with rotational modulation, so this approach is suitable. Further verification of the periodicity is done via phase-folded lightcurves.
If an emission line is produced on the stellar surface and rotationally modulated, the radial velocity of the line (RVline) as the star rotates describes a sinusoidal curve as given by
| (1) |
where is the offset velocity after correcting for the stellar radial velocity, v is the projected rotational velocity, is the latitude of the spot, and the phase angle (Sicilia-Aguilar et al., 2015; McGinnis et al., 2020; Campbell-White et al., 2021). The offset velocity can be due to additional motions of the line-producing material, such as infall, and changes from line to line depending on its optical depth (Sicilia-Aguilar et al., 2015). It may also reflect systematic errors in the laboratory wavelength of the line. The maximum velocity amplitude due to rotational modulation is v, for an equatorial spot. Nevertheless, lines produced at some height over the stellar surface may have a higher amplitude, assuming that solid-body rotation dominates on that spatial scale.
3.2 Spectroscopy analysis
3.2.1 Line velocity periodicity for TW Hya
| Species | Period | FAP | # | Comments |
|---|---|---|---|---|
| (d) | Points | |||
| CaII 3934 | 3.44408 | 4e-4 | 303 | Quasiperiod |
| HeI 4026 | 3.34022 | 8e-3 | 271 | |
| HI 4102 | 3.65501 | 3e-3 | 312 | Also shows a 6.2 d period |
| HeI 4471 | 3.56944 | 2e-6 | 352 | |
| HeII 4686 | 3.55568 | 0.05 | 145 | Very weak line |
| HeI 4713 | 3.34873 | 4e-5 | 356 | |
| HeI 4922 | 3.61393 | 6e-7 | 397 | |
| FeII 4924 | 3.56778 | 4e-11 | 289 | |
| HeI 5016 | 3.55583 | 8e-12 | 417 | |
| FeII 5018 | 3.60264 | 3e-14 | 296 | Strongest line |
| HeI 5875 | 3.56879 | 4e-6 | 459 | |
| HeI 6678 | 3.57531 | 1e-6 | 408 | |
| HeI 7065 | 3.08375 | 1e-3 | 84 | Modulated despite tellurics |
| CaII 8498 | 3.56927 | 3e-11 | 458 | |
| CaII 8542 | 3.13435 | 9e-11 | 284 | Quasiperiod 3.1-3.8d |
| CaII 8662 | 3.56837 | 1e-4 | 457 | Also shows a 1.4 d period |


TW Hya has significantly less NC emission lines than EX Lupi, but they provide a strikingly clear 3.56 d period, fully consistent with the expected rotational period (Huélamo et al., 2008). The rotational period is detected in essentially every line that has enough S/N and a sufficient number of observations, with typical differences in period of less than 1 h (see Fig. 6 and Table 2). Although the photometry data reveal an erratic burster behaviour (Fig. 5), the rotational modulation of the emission lines is clean, stable and robust during the 13 years covered by the spectra. The velocity amplitudes observed are always below v and thus consistent with an origin on the stellar surface. As in EX Lupi (Kóspál et al., 2014), stable accretion spots may cause the spurious radial velocity variations initially interpreted as a companion (Setiawan et al., 2008) and latter explained as a cold spot (Huélamo et al., 2008). The amplitudes are smaller than in EX Lupi, likely due to the nearly-pole-on position.
As for EX Lupi, higher-energy lines such as He I 5016 Å and the Fe II multiplet at 4924 and 5018 Å show very clean modulations through the entire dataset. They are also the strongest lines without blueshifted absorption from winds, which may contribute to their cleanliness. Stronger He I and Ca II lines are also rotationally modulated, albeit with higher FAP. The rotational modulation is evident even in lines such as the He I 7065Å, strongly affected by tellurics.
The only lines with dominant LSP peak substantially different from 3.6 d are H and Ca II 8662Å. H is the only one of the Balmer lines without self-absorption or blends. It has a low-significance period of 6.2 d, close to twice the rotational period and only slightly stronger than the second peak, at 3.66 d. Considering that, even if the line seems symmetric and narrow, it may still be affected by absorption, the result cannot be considered as discrepant. The short period of the Ca II 8662Å line666ESPaDOnS and FEROS have gaps near the 8498 and 8542Å lines, respectively, so Ca II 8662Å has more observations. is harder to interpret, although the line also shows a 3.57 d period. Ca II 8542Å has a second peak at 1.46 d, which could mean that the Ca II IR lines have a different signature from the rest. The 1.4 d peak is particularly evident when the line is fitted with a broader window, which suggests it is caused by uncertainties and a residual BC in very variable lines. TW Hya has very weak BC’s, but the complex shape of EX Lupi’s BC also displays a shorter period (see Section 3.5), and TW Hya may be similar. Phase-folding confirms that the Ca II IR lines are rotationally modulated, especially considering data over short time intervals.
Significant differences in the accretion rate (as inferred from the strength of the H line) do not affect the presence or absence of rotational modulation. For the metallic lines, the modulation is cleaner when the accretion rate is higher, but this seems a consequence of S/N, since the NC lines are stronger when accretion is stronger. For stronger lines such as the Ca II IR triplet or the Ca II H and K lines, and He I lines, the modulation is messier when accretion rate is higher, which could be due to wind- or accretion-related absorption or BC distorting the profile. The ubiquitous modulation, independent of the accretion rate, is an additional similarity between TW Hya and EX Lupi, where the NC velocity modulations are not even affected by outbursts (Sicilia-Aguilar et al., 2015). Due to its fewer lines, and since the strongest lines are too narrow and affected by collisional de-excitation, we cannot further estimate the structure of the line region using e.g. the Sobolev approximation.
3.2.2 Determining the location of the accretion column footprints
 |
 |
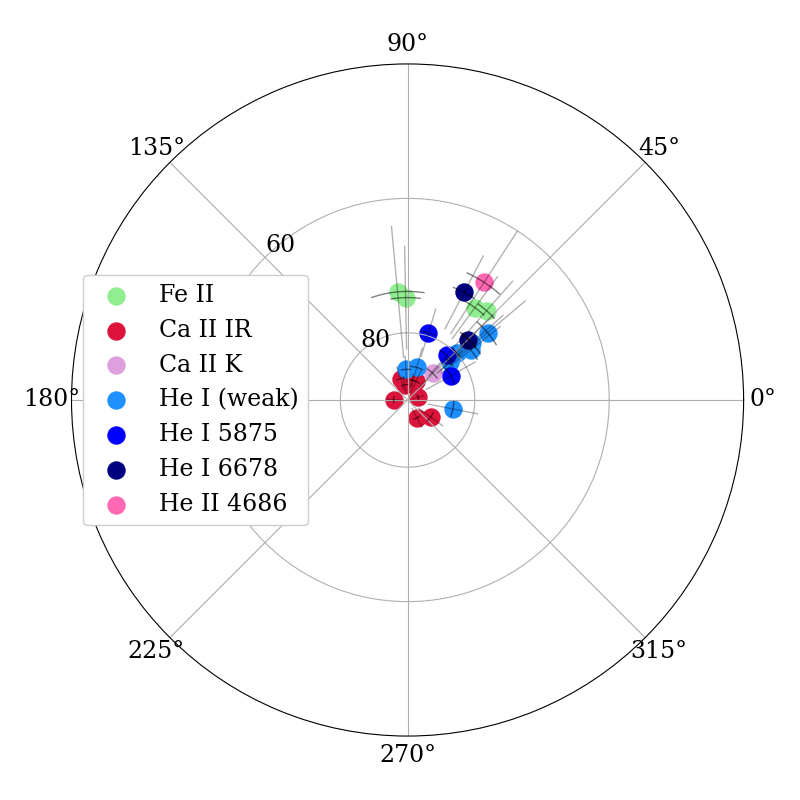 |
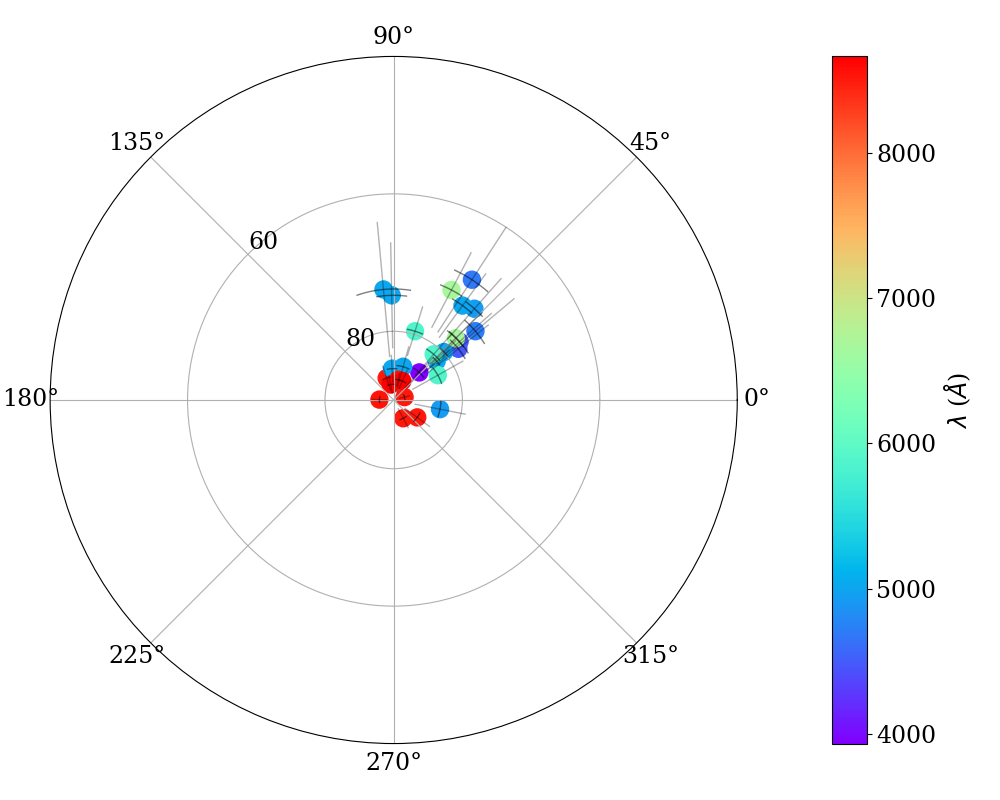
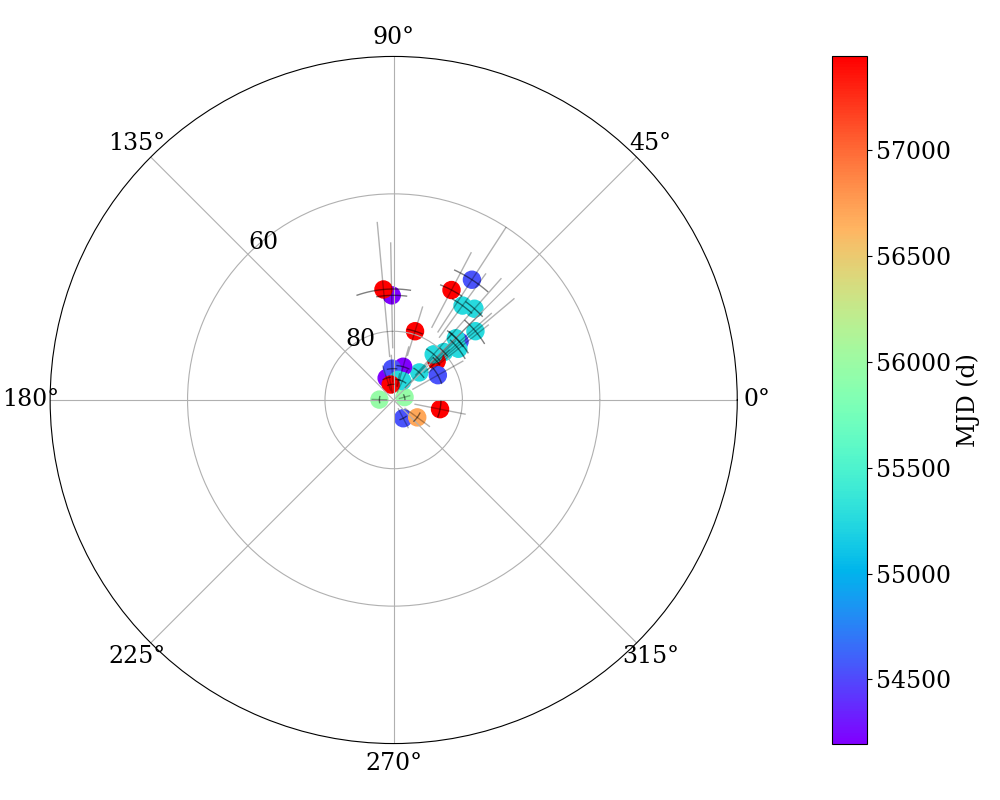
Following Eq. 1, we can determine the location of the NC-emitting region for each species. Since we observe changes in the amplitude over time that do not simply respond to noise, we followed the same procedure for TW Hya as we did for EX Lupi in Campbell-White et al. (2021), and divided the data in various epochs, taking intervals that are as short as possible while still containing a large-enough number of points for the fit to be meaningful. The number of time intervals that produce significant results varies from line to line due to differences in line S/N. We explored the location as a function of wavelength, date, and species, which can reveal information on the temperature and density structure in the accretion column (Sicilia-Aguilar et al., 2015; Campbell-White et al., 2021).
Figure 7 shows examples of the fits (listed in Table 7), which can be transformed into locations on the stellar surface. and Fig.8 shows the transformation of the fitted values per line, species and epoch into a polar plot with longitude and latitude location for different lines and epochs: from Eq. 1, a change in the amplitude of the modulation corresponds to a change in latitude for the NC-emitting region. The sinusoidal modulation is cleaner over shorter time spans, and on certain dates, and we also observe significant changes in amplitude that evidence changes in location. Observational noise is responsible for the lack of modulation in some epochs, which are not used in the polar plot. Due to the nearly pole-on inclination, detecting the modulation would be impossible if the lines were arising from a mildly extended region, confirming their origin in a very compact region.
Vertical changes or stratification in the location of the post-shock region, resulting for instance from a variation of the accretion column density, could also induce differences, and not all NC need to originate at the same height. In EX Lupi, the phase offsets between the lines suggested that the structure, albeit small, is extended and contains trailing parts with slightly different phases, which is consistent with a vertical scale over the accretion footprint (Sicilia-Aguilar et al., 2015; Campbell-White et al., 2021). Changes to this scale, rotating at the same pace as the star, could allow for larger velocities if the NC-emitting region is further away from the stellar surface.
To test this hypothesis, we examined the NC velocity amplitudes for both objects. For EX Lupi, the Ca II 8662Å line has an amplitude of 0.370.06 km/s, while He II 4686Å has 2.50.3 km/s (Campbell-White et al., 2021). If we assume that the Ca II line forms at the stellar surface, and that He II forms at the same latitude but higher up, it would require a very large and unphysical difference in radius, nearly a factor of 7. For TW Hya, we took the data centred around MJD=55200 d, which have the largest and cleanest number of measurements (see Table 7 and Fig. 7). There is a clear difference between the amplitude (and phase) of the Ca II lines and the rest, and comparing it with the high amplitude He I 5016 and Fe II 5018 Å lines, the difference in radius would be a factor of 5-6, which is again too large. Even the differences between strong lines (with amplitudes 1 km/s) and others (with amplitudes 0.6 km/s) produce a very large factor, 1-2. In contrast, the latitude changes are moderate, as seen in Fig. 8. Therefore, although some vertical structure is unavoidable considering the energies and transition probabilities of different lines, vertical stratification alone cannot explain the variations in the radial velocity amplitude.
Despite the variations in amplitude and phase, the location of the hot and dense region that emits the NC in TW Hya (in particular, for the energetic lines) is very well-defined, very compact and close to the stellar pole (see Fig. 8). A close-to-polar dominant accretion spot is in agreement with the single spot revealed by magnetic field mapping at a different epoch (Donati et al., 2011), so the NC behaviour suggests this configuration may be usual in TW Hya. EX Lupi shows no significant change in the phase of the line modulation over the 13 years of observations despite some phase (and amplitude) differences between species (Campbell-White et al., 2021). TW Hya lines show stronger changes in the phase (or longitude) of the lines: Although the modulation is always evident and the NC-emitting regions are concentrated at latitudes over 60∘, the longitude does change in time as if the line-emitting region shifted around the star, so the spot location is not as stable as in EX Lupi, varying by about 120∘ and showing a larger spread within a single epoch, while in EX Lupi they are always concentrated within the same quadrant.
There is also a difference between the location of the Ca II IR lines and the rest, with the Ca II IR lines having lower amplitudes and thus being closer to the pole. They also have the lowest FAP among strong lines, the largest deviations from the 3.56d period, and are broader than the rest of metallic lines. The Ca II IR modulation in EX Lupi also has lower amplitude than for the rest of lines (Sicilia-Aguilar et al., 2015; Campbell-White et al., 2021), but the sinusoidal modulation is still clear in both stars. This points towards a physical reason for the difference between the spatial origin of different lines, such as observed in the structured spot found by Espaillat et al. (2021), and is a signature of stratification (in temperature/density) rather than simply dilution due to an origin in extended regions.
As a final note, we explored whether the slight LSP period variations from line to line could be due to differential rotation, but we did not find any correlation with the excitation energy or transition probability of the line, nor the modulation amplitude, and the period, for any of the two objects. Since all lines are consistent with the same rotational period in both objects, we conclude that, although differences in phase and amplitude are significant, the differences in period are not. Section 4 discusses all the possibilities in more detail.
3.2.3 Unveiling underlying radial velocity variations
In addition to the variations in amplitude (or latitude), we also observe some changes in the zero-point offset of the NC from epoch to epoch for both TW Hya and EX Lupi. This suggests that there could be additional residual radial velocity variations. Note that, although the global offset for a given line is affected by the uncertainty in the wavelengths (our sub-km/s uncertainties are often better than the precision in the NIST database wavelengths), the differences between epochs are robust and agree across observations done with different instruments (see also Campbell-White et al., 2023, who confirmed the agreement between instruments), ruling out relative calibration issues. The differences in offset velocity are clear when shorter time intervals are taken into account (Figs. 6 and 7). A change in the offset velocity produced by a massive companion would affect all lines in the same way. Nevertheless, if the line-emitting region is not so simple or not locked to the stellar surface, things such as small changes in the infall velocity within a stratified post-shock region, or line-dependent variations in optical depth (so that the observed emission changes its location along the stratified region) could cause similar but line-dependent radial velocity variations.
We used the offset calculated over different periods of time to extract any further potential signature of radial velocity variation. For both EX Lupi and TW Hya, any remnant periodic signature has low-significance and is similar to the rotational period of the star, thus suggesting that it is a relic of the rotational modulation itself. This, plus the fact that not all the lines have the same offsets at any given time (see Fig. 7), makes it unlikely that the variations are caused by a global change in stellar velocity (e.g. as induced by a companion), at least, down to the typical 0.1 km/s uncertainties (see Table 7). Therefore, the leading causes remain changes in optical depth and/or in the infall velocity within the stratified post-shock region, or changes in the stellar photosphere or spot structure(s), all of which can be rotationally-modulated. Changes due to optical depth effects that cause lines to arise from slightly different places have been documented in EX Lupi (Sicilia-Aguilar et al., 2015). Although one reasonable cause for these variations in the post-shock region could be a change in the accretion rate, we do not observe a clear correlation between the strength of accretion (or line intensity, Fang et al., 2009) and the changes in amplitude, phase, or offset velocity. Further variations on the global size of the line-emitting region, or near-but-distinct secondary spots with a variety of temperatures and densities, may be also behind this.
3.3 TESS photometry analysis
| TW Hya | EX Lupi |
|---|---|
 |
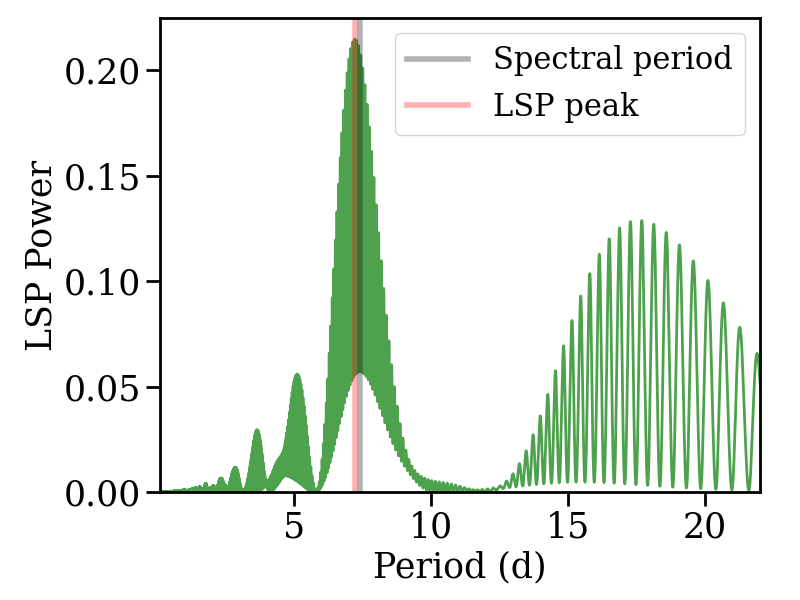 |
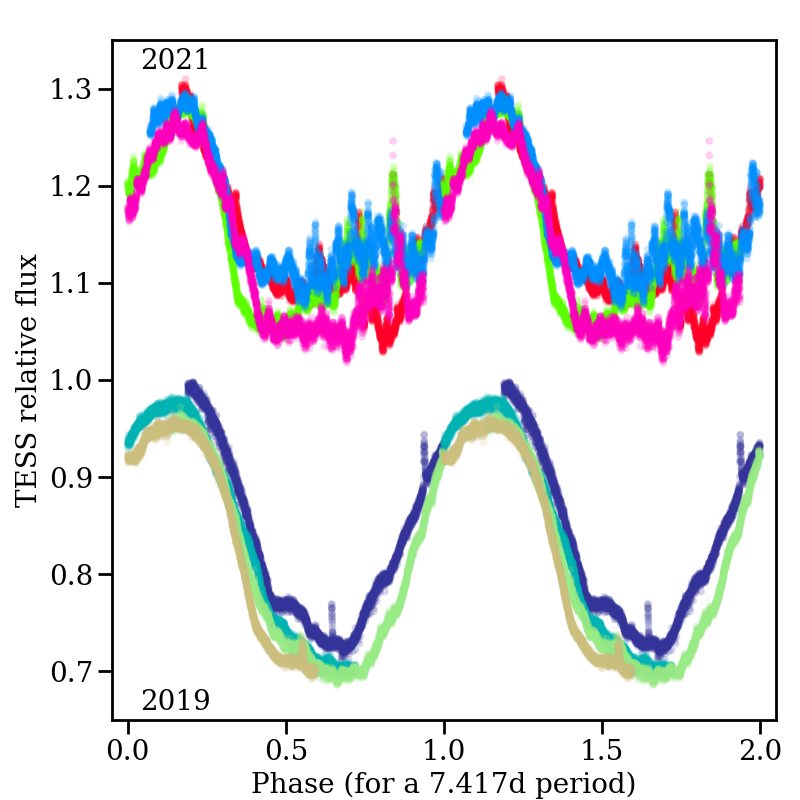
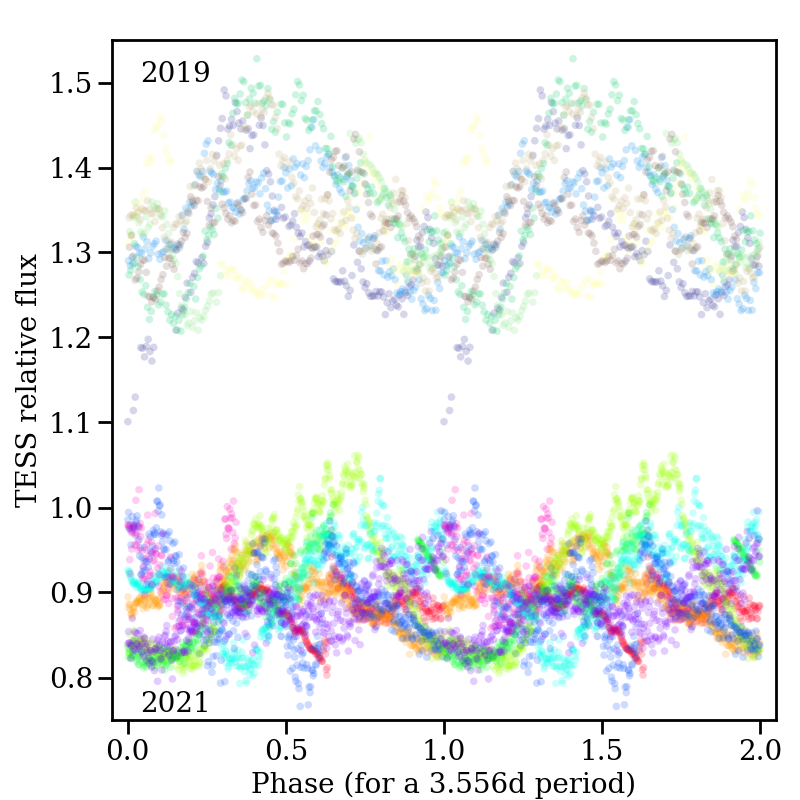
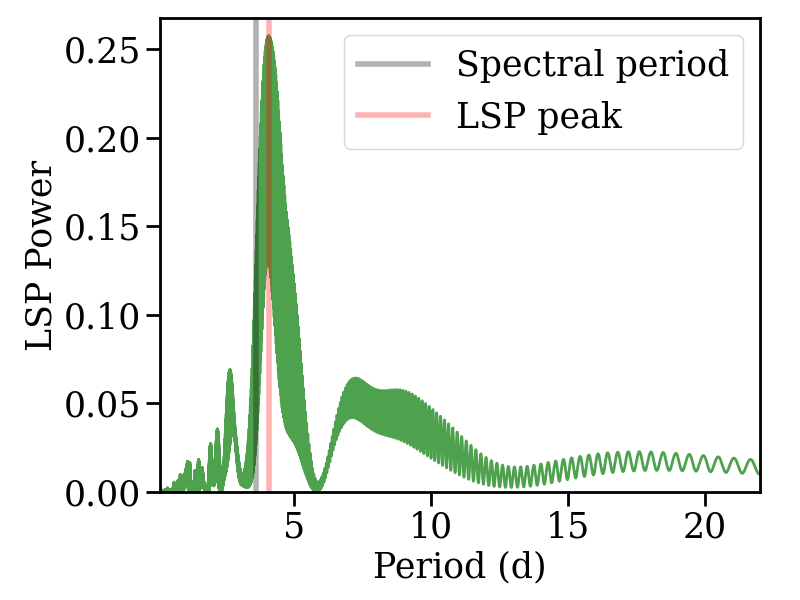
Phase-folding of the TESS data confirms the rotational periods detected by the NC. The lightcurve for TW Hya is very irregular. The best LSP period is 4.066 d (Fig. 9), but phase-folding favours a 3.6 d period. If the two datasets are fitted separately, we find that sector 36 data has roughly the same 4.060 d period, while sector 9 has a 4.595 d period. The rotational period is more evident in the 2019 data, when the star was brighter by about 0.4 mag. The periodicity in Sector 36 is less clear and the maxima of sector 9 and sector 36 are off by nearly 180 degrees (for a 3.56 d period), as if the hot spot causing the excess luminosity moved to the other side of the star (see also Section 4). These 4 d periods are reminiscent of those reported by Siwak et al. (2014) and Dupree et al. (2012) and likely linked to the same phenomena.
The TESS data for EX Lupi show the sinusoidal modulation expected for a source dominated by a single, stable spot, with a period essentially identical to the spectroscopic period (Sicilia-Aguilar et al., 2015; Campbell-White et al., 2021). Sector 12 was discussed in Campbell-White et al. (2021); sector 39 data reinforces these results, although it also shows that, unlike the NC-related spot, the continuum-emitting region gets fully out of sight on certain epochs, producing a flattened sinusoidal. The LSP has a broad peak at 7.206d, and phase-folding the data is consistent with the spectroscopic period, 7.417d (Fig. 9). As observed by TESS, EX Lupi was on average a factor of 1.38 brighter (0.35 mag) in 2021 than in 2019, likely related to an increase in the accretion rate that also seems to trigger more frequent, rapid small-scale bursting variations such as from accretion variability. Unlike in TW Hya, EX Lupi displays a cleaner modulation during the faint stage. EX Lupi gets brighter when the accretion rate increases (e.g. Herbig, 2008; Juhász et al., 2012), so its lightcurve is more irregular during higher accretion phases, maybe due to additional accretion-related spots or extended parts of the accretion structures becoming brighter.
Subtraction of the sinusoidal modulation and further LSP analysis of the 2021 data produces a peak at 3.77d, which is essentially half of the rotational period and suggest that most of these changes are indeed related to a weaker secondary spot. Spots with variable intensity on opposite sides of a star are common, and their relative intensity may be linked to increases in the accretion rate (e.g. Sicilia-Aguilar et al., 2020a). A second spot on the same visible hemisphere could also explain the changes observed in TW Hya, where the phase change between the two TESS epochs may result from the dominant spot in the first epoch switching to be the secondary one later on.
Finally, we detect several flares in the TESS data for EX Lupi, three of them in 2019, and at least one (and potentially a second) in 2021. Identifying flares in TW Hya is harder due to its irregular lightcurve, although we also see peaks consistent with flares. Analysis of the bursting behaviour reveals no significant periodicity for the bursts, but the timescales of the small brightness variations in EX Lupi are of the order of 3h, while the same small-scale spikes in TW Hya appear to last rather 5-6h. The bursts may be related to other spots from minor accretion events, which suggests that the lifetime of these events in TW Hya (the fastest rotator and the oldest star) is longer.
3.4 Analysis of the broad-band photometry
3.4.1 EX Lupi: stable hot spots that grow and shrink
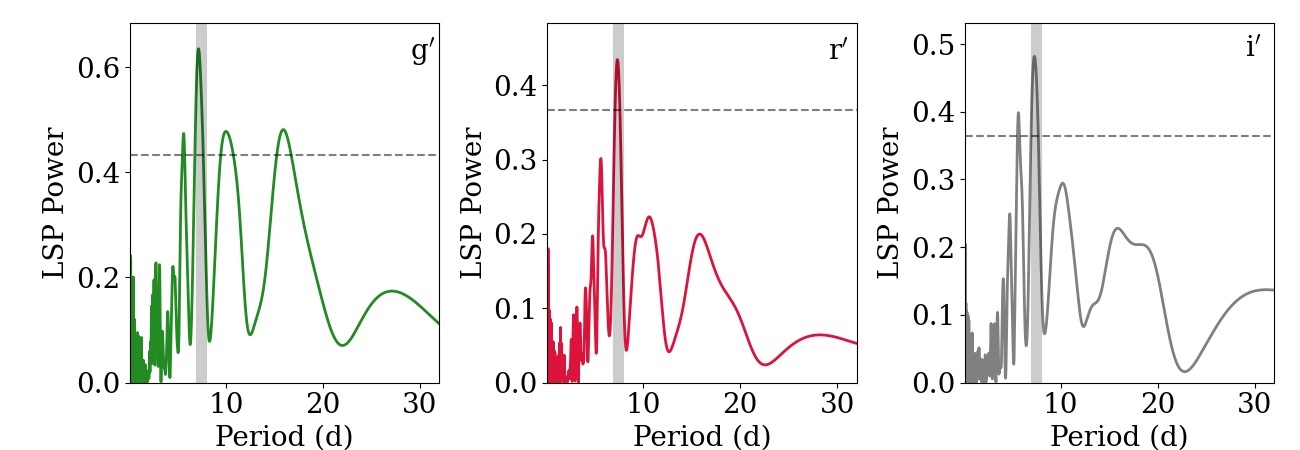
EX Lupi photometry is rotationally modulated on virtually every epoch observed, including all AAVSO bands, obtained during the rise and fade-off phase of an intermediate-magnitude outburst. The LCOGT data are consistent with the spectroscopy period of 7.417d. The LSP for the filters for which there is a reasonable number of datapoints have peaks at 7.167 d (g’), 7.324 d (r’) and 7.281 d (i’) with a virtually nil FAP. Phase-folding confirms the results, which are also similar to Cruz-Sáenz de Miera et al. (2023).
The photometry data were used to explore the colour variations associated with the modulation. The change in colour during quiescence (LCOGT data) is very small (Fig. 2), but there is some evidence of rotational modulation of the colour for the 7.417d period, especially in g’-r’. The rotational modulation is much weaker in the r’-i’ data, so that the structure causing it rather affects the bluer colours (see Fig. 4). The AAVSO data also shows that the star is at its bluest (and brightest) during the peak of the outburst, suggesting it is related to hot spots.
To quantify the modulation, we used a model with a single spot. As in Sicilia-Aguilar et al. (2017), the simple model assumes the spot irradiates like a black body and compares the variations expected when the spot at maximum and minimum visibility in each band (BVRI for the AAVSO data, g’r’i’ for the LCOGT data), deriving the best-fit in terms of spot temperature and coverage. This is also similar to Froebrich et al. (2022). We use a 3800K effective temperature from Sipos et al. (2009) to represent the photosphere. For the quiescence data (LCOGT and the last part of the AAVSO data) we checked for both hot and cold spots, while for the high luminosity state only hot spots are feasible. Spot temperatures between 2700 K and 10000 K were considered, as well as spot coverage from 1% to 90%. Since the model only focuses on the colour change, what we measure is just the part of the spot that comes in and out of sight and, if part of the spot is visible all the time, this would not be taken into account. For EX Lupi moderate inclination, and if we consider the NC-emitting region, it is likely that part of the continuum-emitting region is visible most of the time and thus the spot coverage obtained by our model is a lower limit. A spot coverage over 50% means that most of the visible surface of the star is covered by spot rather than by photosphere, but we wanted to explore this possibility.
For the model, the data were binned in 15 equal intervals within a full turn (large enough to be representative of the typical magnitude and noise, and small enough to minimize the sinusoidal variation as the star rotates) to estimate the average magnitudes in each filter. This allows to reduce noise and rapid photometric changes not related to the spot. The standard deviation within each bin is taken as the uncertainty. The maximum and minimum magnitudes were taken to be the maximum and minimum of the averages over the 15 bins, and considered as caused by the changes in spot visibility. The lowest provides the best-fit model, and the models within 3 are used to derive the uncertainty. The results of the simple spot model fit are shown in Table 3. The minimum is well-defined, with the best models concentrating around the same part of the parameter space (see Fig. 17). The minimum is also lower than expected even for a very good fit, which indicates that the standard deviation overestimates what is noise, likely due to other causes of variability beyond the spot.
| <MJD> | Tspot [3] | fspot [3] | Notes | |
| (d) | (K) | |||
| EX Lupi | ||||
| 2457219 | 1.21 | 2700 [2700-2910] | 0.20 [0.19-0.25] | 15 Q (cold) |
| 2457219 | 0.25 | 4000 [4000-4225] | 0.58 [0.44-0.63] | 15 Q (hot) |
| 2459661 | 1.45 | 4700 [4700-4776] | 0.88 [0.80-0.88] | 22 O |
| 2459675 | 0.31 | 4400 [4400-4477] | 0.81 [0.70-0.83] | 22 O |
| 2459688 | 0.05 | 4500 [4420-4600] | 0.35 [0.30-0.42] | 22 O |
| 2459704 | 0.17 | 5200 [5120-5630] | 0.20 [0.18-0.23] | 22 O |
| 2459716 | 0.91 | 5200 [5070-5200] | 0.11 [0.11-0.15] | 22 O |
| TW Hya | ||||
| 2459668 | 0.02 | 6350 [6240-6550] | 0.04 [0.03-0.05] | Full dataset |
| 2459657 | 0.10 | 6400 [6190-6630] | 0.06 [0.05-0.07] | First half |
| 2459674 | 0.15 | 5800 [5620-5990] | 0.07 [0.06-0.08] | Second half |
We find that all the data are consistent with a hot spot with a moderate temperature. The spot temperature is only slightly higher than the photosphere (4000-5600 K), but we find that an extraordinary large coverage is needed to reproduce the luminosity, especially during outburst, suggesting that the spots that produce the photometric variability extend beyond the stellar surface. This situation is similar to the 2008 large outburst (Juhász et al., 2012), where the luminosity variation was attributed to a single-temperature spot at 6500 K dominating 80-100% of the emission (Juhász et al., 2012). The 2022 EX Lupi outburst temperature is significantly lower, which is reasonable for a weaker burst. It also agrees with the ASASSN-13db 2014 outburst, dominated by a 5800 K large spot not constrained to the stellar surface (Sicilia-Aguilar et al., 2017).
The AAVSO data is particularly interesting to explore the evolution of a burst. The object was decreasing in luminosity very rapidly, so we divided the available data in three epochs, each one corresponding roughly to two rotational periods. Surprisingly, although the temperature varies slowly, the spot coverage goes from 88% to 11%, meaning that a very large spot rapidly decreases in size within a few rotations, as the outburst fades. The size decreases throughout the burst, but the temperature increases towards the end. This suggests that, during outbursts, we see a much larger (but still rotationally-modulated) luminous part around the star, which is later replaced by a small, compact spot. Although it could seem contradictory, the increase in temperature when the accretion rate is lower suggests that a region hotter than what dominates the continuum excess during burst, but smaller, becomes relatively more prominent as the burst component rapidly shrinks in size. This fast evolution is consistent with the observed fading of spectroscopic signatures of accretion outbursts, which can disappear within days (e.g. Holoien et al., 2014).
Repeating the analysis for the LCOGT data, which cover several periods in quiescence, the results are less evident. The magnitude variations also favour a hot spot, but the difference in significance is lower. The fits are also worse, probably because they are derived from worse sampled data covering a longer time span. The results are also listed in Table 3, with the parameter space shown in Fig. 17, for comparison.
The single temperature of the model is a limitation, but the relative variation in different bands is very sensitive to temperature and the fit is reasonable. Although there are much hotter parts in the post-shock region, such as those producing the He II and Fe II NC emission, these are not photometrically observed due to their size or lack of continuum emission. Note that even the hottest spot temperatures that we measure are too low compared with the temperatures required for line emission, indicating that the region that emits the NC is significantly smaller and/or lacks continuum emission. The filling factors derived, especially in outburst, are quite large, and the temperature differences between the spot and the photosphere are not very high, which is consistent with what has been observed in other variable objects (e.g., Bozhinova et al., 2016; Froebrich et al., 2022; Herbert et al., 2023).
3.4.2 TW Hya: The shape-shifter

For TW Hya, we used the LSP to derive photometric periods from the AAVSO data. This was done for each band separately, and the results are shown in Fig. 11. Due to red noise, the periods have low significance, but we detect a peak around 3.7d in B and V. Both the phase-folded photometry and colour are also consistent with the spectral line period of 3.56d. As mentioned in Section 2.1, the rotational signatures of TW Hya are particularly hard to infer from photometry due to the bursting nature of the curve. Interestingly, the photometric periods derived with the TESS and AAVSO photometry and those in the literature (Dupree et al., 2012; Siwak et al., 2014) are all slightly longer (3.7-4.1d) than the period derived from the lines, which is the opposite to what we observe in EX Lupi. This suggests that the structure producing the photometric variations in TW Hya tends to lag behind the location of the emission-line spot and is more irregular, to the point that the rotational modulation is often absent.
The colour variations (Figs. 3 and 5) could be consistent with extinction, but are more likely related to spots since the ligthcurve and phase-folded colours do not show dipper-like events and simple spot models can reproduce the variations. When the sinusoidal modulation is visible, the amplitude of the variation is stronger in the bluer bands, albeit not as extreme as in EX Lupi. As observed with TESS, the modulation is cleaner when the star is brighter, from which we can infer that a single hot spot dominates, causing stronger modulations, during enhanced accretion phases.
Modelling the photometry of TW Hya with a simple spot model is in general not possible, except for the epoch around JD=2459640-2459680 d, when the object shows the expected sinusoidal curve. We fitted a spot model for the 2459641-2459666 d epoch, another for 245967-245980 d, as well as another for the entire dataset, to test for uncertainties caused by the structure variability in a few-periods timescale. The data were split simply to have a similar number of observations in each set. The results are given in Table 3. Although the additional, non-spot variability is quite large (which also causes the estimated to be very small), one important difference with EX Lupi is that the temperature is significantly higher than the stellar photosphere, and the spot coverage is always very small. As for the case of EX Lupi, the results for a cold spot model are significantly worse, with minimum over an order of magnitude larger than for the hot spot models, thus ruling them out. Given the low inclination angle, the spot sizes estimated are also lower limits since they do not include parts of the spot that remain always visible.
3.5 EX Lupi: BC spectroscopy analysis
The strongest lines display BC during epochs of increased accretion, to the extent that essentially all lines have BC during large accretion outbursts (Lehmann et al., 1995; Herbig, 2007; Kospal et al., 2008; Aspin et al., 2010; Sicilia-Aguilar et al., 2012). Accretion rates a factor of few to one order of magnitude over the quiescence rate (ṀM⊙/yr; Sicilia-Aguilar et al., 2015; Alcalá et al., 2017) are enough for the BC to appear around strong lines. Day-to-day velocity variations in the BC are observed both during outburst and quiescence (Sicilia-Aguilar et al., 2012; Sicilia-Aguilar et al., 2015).
The variation of the BC line profile in quiescence is reminiscent of what was observed for the neutral metallic lines during outburst (Sicilia-Aguilar et al., 2012, see also Fig. 12). The change from a blueshifted component to a centred one (with red and blue sides) and then to a redshifted component and back hints towards something non-axisymmetric rotating around the star. The BC varies in shape and strength more than the NC, getting stronger when the accretion rate increases and sinking into the photosphere at lower rates, so that connecting data distant in time can be difficult. We concentrated the analysis on the Ca II IR triplet lines, which have the most prominent BC and are detected in a larger number of observations. Other strong lines with BC display a similar behaviour (e.g. Fe II 5018/4923Å), but their BC are weaker and often lack enough S/N.
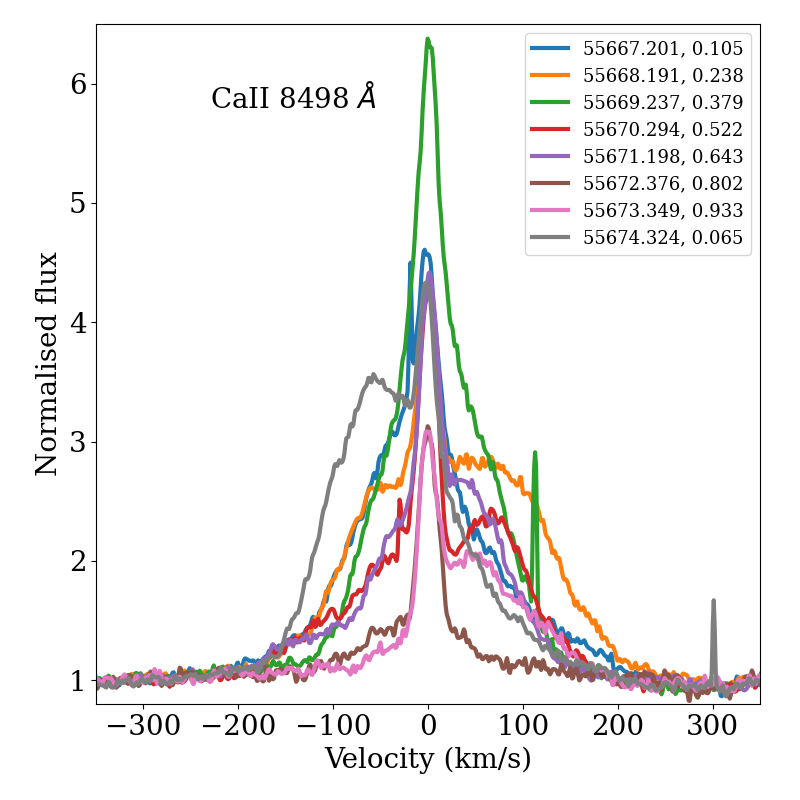
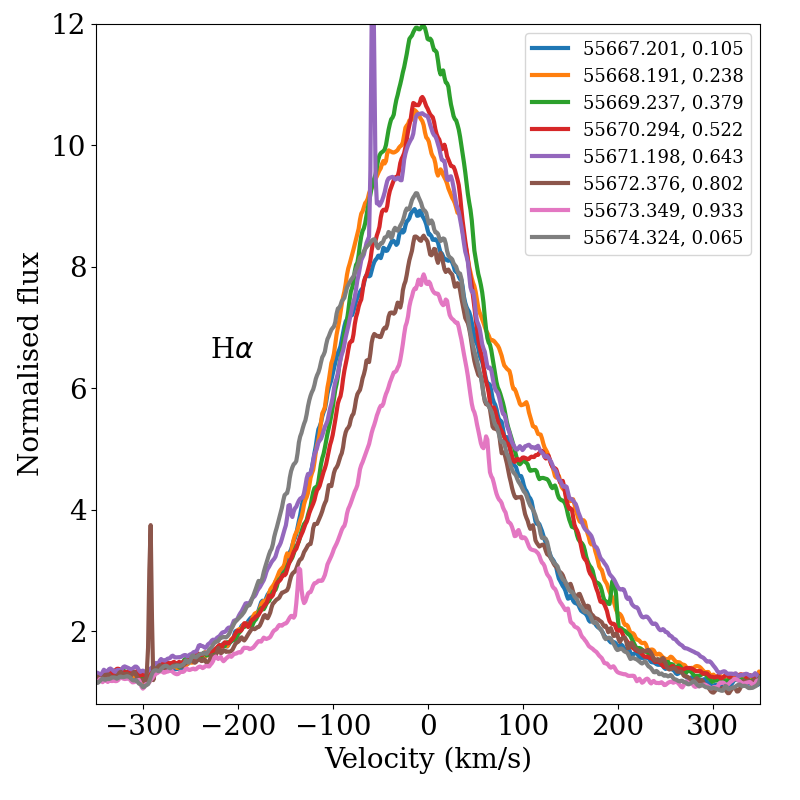
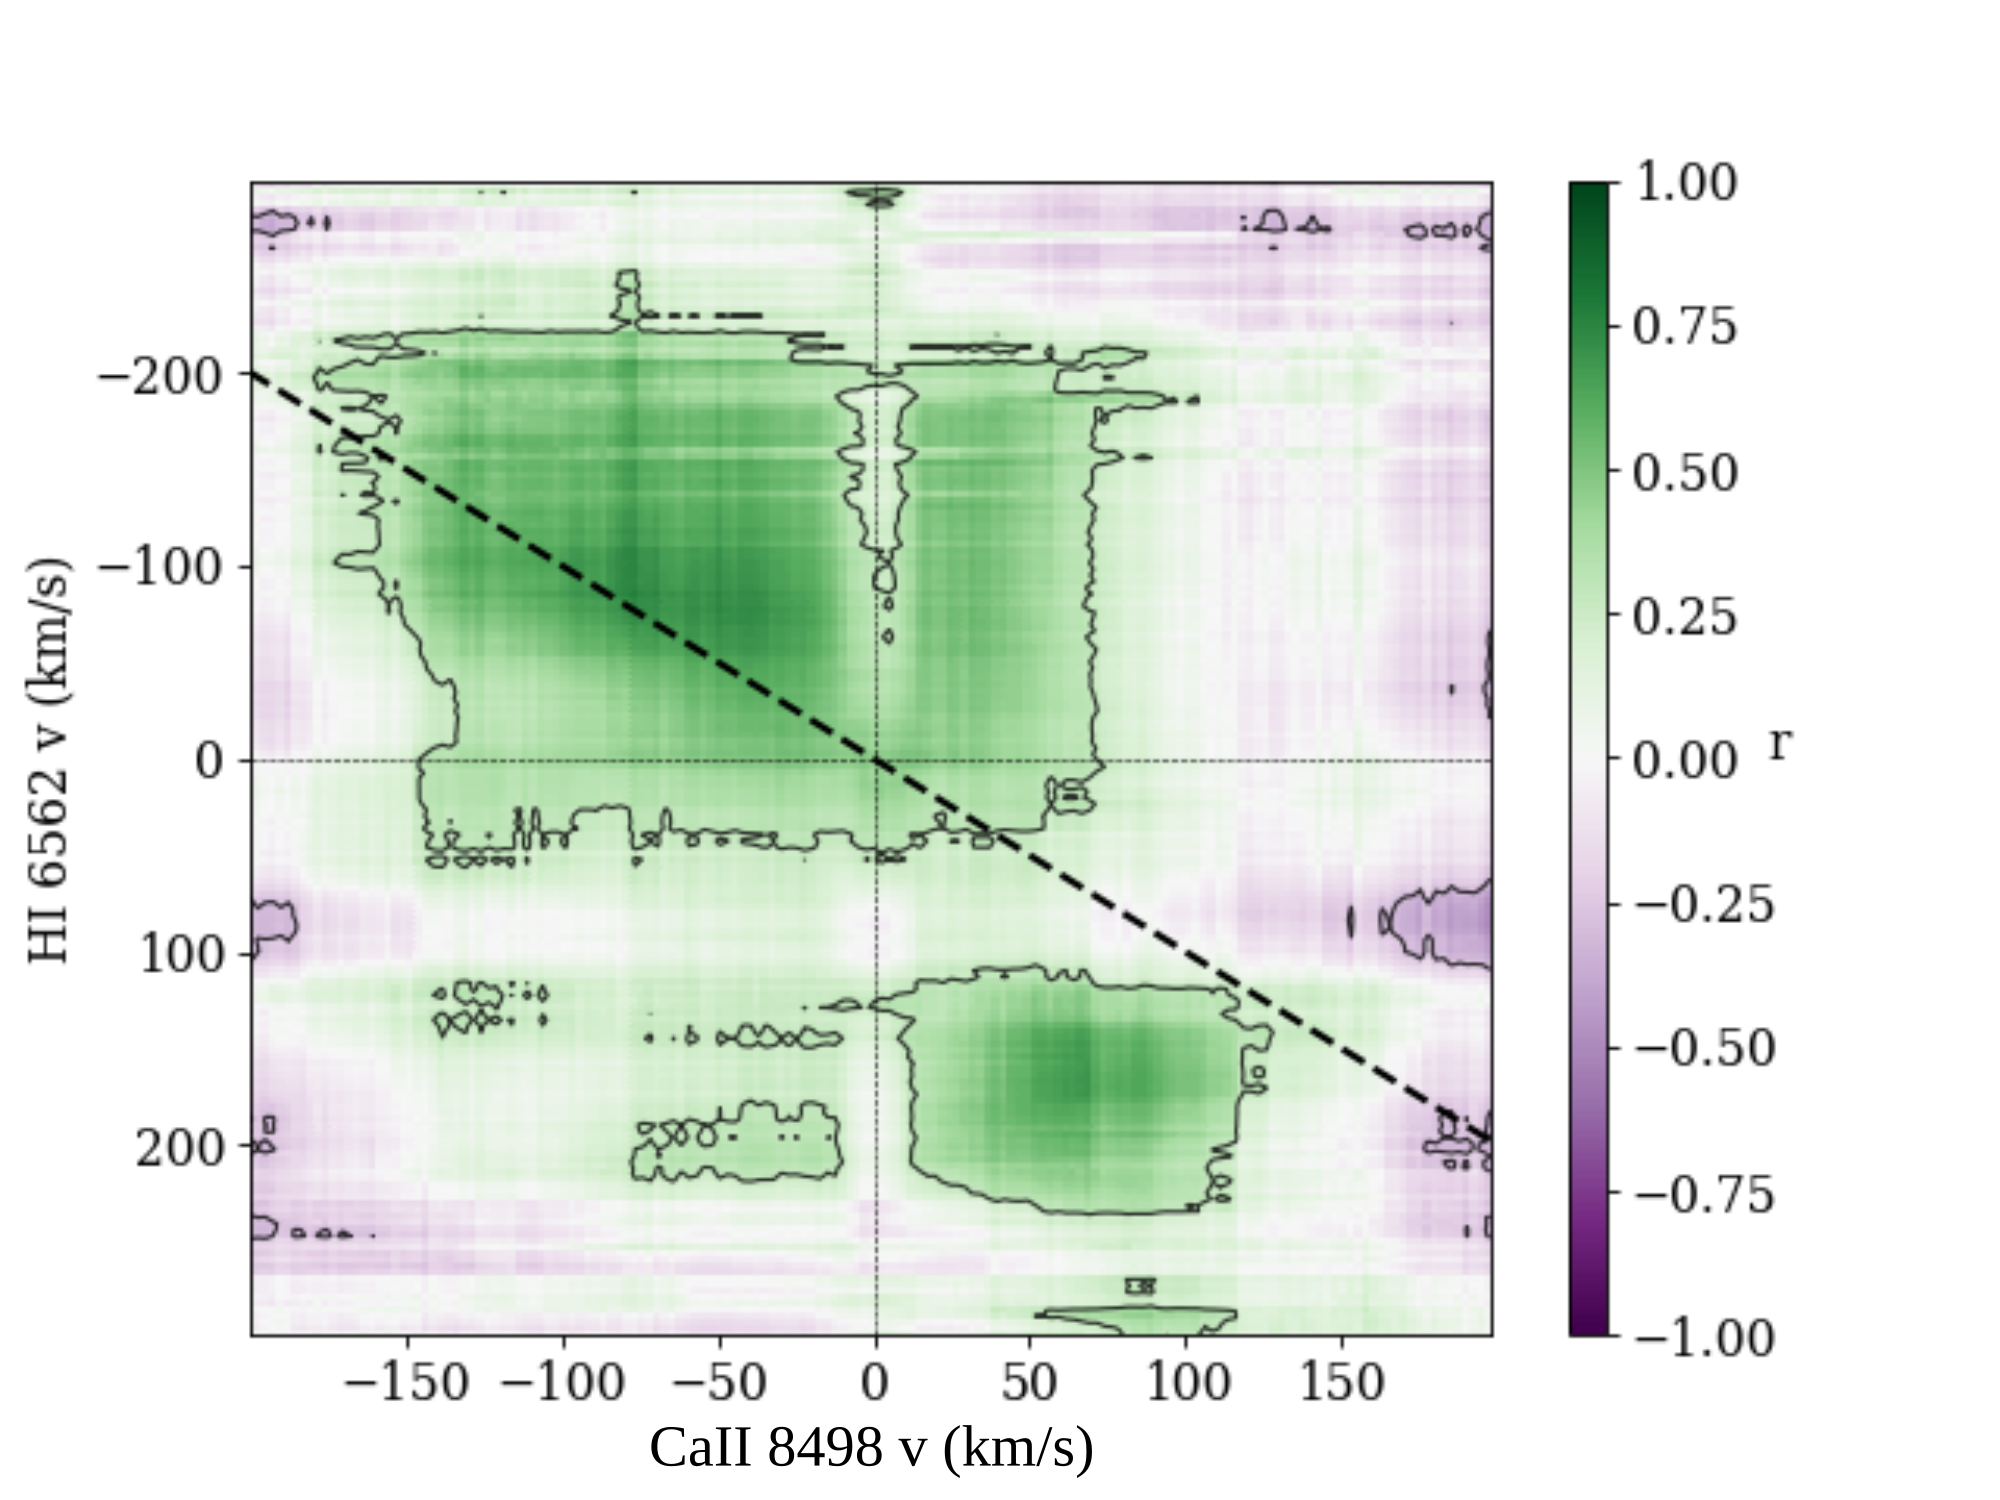
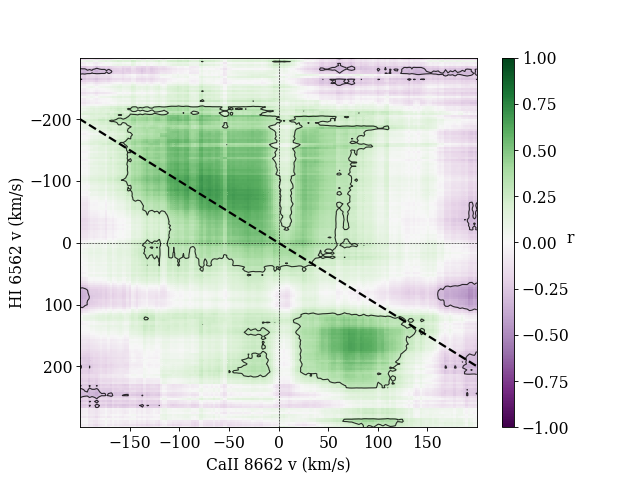
We started by checking if the BC velocity variation was due to moving emission components, or to moving absorption components changing over a relatively stable emission. For instance, accretion columns seen along the line-of-sight can show inverse P Cygni profiles (e.g. Batalha et al., 2001), and blueshifted absorptions from variable, non-axisymmetric winds have been observed in young stars (e.g. Sicilia-Aguilar et al., 2017; Sicilia-Aguilar et al., 2020b). Comparing with the metallic lines, we noted that the H I lines show the inverse behaviour: when the BC of the metallic lines is redshifted, we observe a redshifted absorption in the lower Balmer lines at the same velocity. This is as expected from a gas parcel moving away (redshifted) along the line-of-sight, that is dense (seen in absorption) in H I but appears in emission in less abundant species. Although this effect is not as evident when the BC is blueshifted (probably due to geometry and being on the far side), we can identify simultaneous blueshifted absorption in the H I lines, so that the variations are similar to those observed in non-axisymmetric rotating accretion columns (e.g. Alencar et al., 2012; Kurosawa & Romanova, 2013). There is also a positive correlation between the width and strength of the Ca II and H I lines (see Fig. 13), although this is dominated by the lines getting broader with stronger accretion. Therefore, we conclude that what we see as redshifted or blueshifted BC in the metallic lines is in emission and not the result of a variable absorption, so we will explore scenarios characterised by emission from moving, dense matter parcels.
3.5.1 STAR-MELT analysis of EX Lupi BC
Line Velocity Analysis:
Ca II 8498Å Full Period
Ca II 8498Å Half Period

 Ca II 8662Å Full Period
Ca II 8662Å Half Period


Line Asymmetry Analysis:
| Ca II 8498Å | Ca II 8662Å |
|---|---|
 |
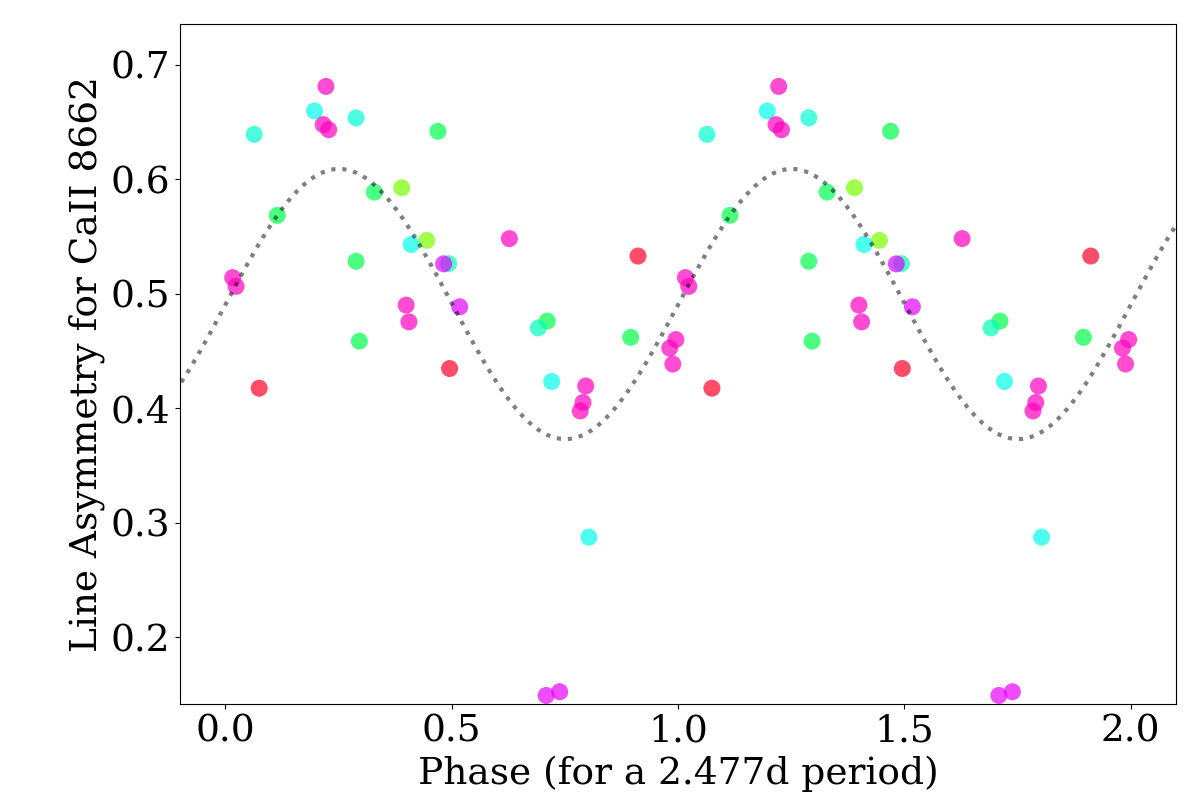 |
We first used STAR-MELT to examine the long-term behaviour of the BC in EX Lupi. The data were fitted with STAR-MELT, including the BC and NC, using a multi-Gausian fit. Multi-Gaussian fits tend to be degenerated, so we added conditions on the NC (restricting it to radial velocities of 10 km/s and FWHM20 km/s, as done in Sicilia-Aguilar et al., 2017). For the BC, velocities were allowed to be within 120 km/s, and the line width was constrained so that FWHM50 km/s. Further requirements included a minimum GOF of 1 and amplitude over the continuum of at least 3. All fits were also examined by eye. The typical velocity for the Ca II IR BC is higher than what was observed for metallic lines in outburst (Sicilia-Aguilar et al., 2012), reaching up to 100 km/s, but the fit is hard to use at face value, since the BC shape differs from a combination of Gaussians. Following Sicilia-Aguilar et al. (2017), we also used STAR-MELT to measure the asymmetry of the line (ratio of the blue flux vs total line flux, measured from the centre of the line according to the radial velocity), a much more robust and non-degenerated way to characterise the lines. Figure 14 shows the phase-folded plots.
A LSP reveals that both the velocity and line asymmetry have, if any, periods shorter than the stellar rotation. While using the velocities of each single redshifted or blueshifted Gaussian is weakly consistent with a half-period modulation, the line asymmetry has a stronger periodic modulation around 2.3-2.5 days (see Fig. 14). Visual inspection also reveals this faster periodicity in observations taken during the same rotational period (to minimise the effect of variable accretion), although there are only two relatively complete sequences. The lines get weaker (and mostly redshifted) at two phase ranges, 0.8-1.0 and 0.3-0.6 (Fig. 12). This suggests either the presence of more than one emitting structure, a structure not locked to the star (different period), or additional effects, such distinct matter infall episodes. Viewing more than one structure, such as two accretion columns, is unlikely because the blue- and red-shifted components are very rarely seen at the same time. If the shorter period is caused by a gas parcel in Keplerian rotation, it would be located at around 4-5 R∗ (inside the corotation radius of 8.43R∗). If caused by distinct infall episodes, there would need to be some underlying periodicity for the events. We explore these possibilities in the next section.
3.5.2 Models and origin of the BC and its modulation
We used different models to find the simplest structure that can account for the BC modulation. The BC must be produced in a non-axisymmetric region that is moving or rotating relatively fast, to produce the high velocities. A non-axisymmetric structure is also the natural match of the stable accretion footprint traced by the NC. We thus explored two main scenarios: a non-axisymmetric magnetospheric accretion column rotating as a solid body together with the star (modifying the model of Hartmann et al., 1994, to limit the azimuthal extension of the column), or a hot, non-axisymmetric part of the disk (somewhat similar to the keplerian disk observed by Sicilia-Aguilar et al., 2020b, around ZCMa NW in outburst, but with a limited azimuthal angle). A similar disk sector has also been proposed for FU Orionis (Siwak et al., 2018b). For the first model, we assume that the column starts at the corotation radius, while for the second we assume a disk sector extending slightly inwards or outwards of the corotation radius. We also experimented with a combination accretion column and disk segment. In all cases, we probed azimuthal extensions between 60 and 120 degrees, since larger ones dilute the observed ’wobbling’. Note that our models aim to reproduce the velocity modulation, not the flux, which would require a much more complex treatment beyond the scope of this work.
For all models, we consider the stellar radius (R∗=1.6 R⊙), mass (M∗=0.6 M⊙), and start with a stellar inclination angle (from inner disk modelling) from Sipos et al. (2009), as well as the corotation radius inferred from the 7.417d period (8.43 R∗). Our NC analysis also agrees with a low angle. Nevertheless, an inclination of 20-35∘ is not enough to explain the line wing velocities, even if we include infall and rotation. In fact, the best match for the models was obtained for an angle around 45∘, suggesting that the innermost structures (or the star) are slightly inclined with respect to the outer disk. Since the lines are too broad to be accounted for by thermal broadening alone, we also add an extra turbulent broadening factor of 5 times the thermal velocity.


For the accretion column model, we followed the magnetospheric structures and accretion velocities from Hartmann et al. (1994), assuming that the accretion column starts at the corotation radius, Rcor, and limiting the azimuthal extension. In the magnetospheric accretion column, the material flows along the magnetic field lines, which are defined by
| (2) |
where r is the radial distance to the centre of the star, is the location in the disk where the material comes from (Rcor) and is the angle with the z-axis. The accretion velocities come from a simple magnetospheric model where the material leaving the disk follows the field lines essentially in free-fall, landing in a position that depends on the radius where the magnetic line originated (Ghosh et al., 1977; Hartmann et al., 1994).
We consider a single magnetically-channelled column locked at the corotation radius, which lands at 20∘ from the pole, in agreement with the typical ranges observed for any NC line, between 10-50∘ (Sicilia-Aguilar et al., 2015; Campbell-White et al., 2021). We consider a single temperature of 10,000 K for the magnetospheric column, a typical value for accretion models, noting that this has only limited effect on the observed velocity variation. The accretion column rotates with the star as a solid, while the disk part would be in Keplerian rotation.
For the non-axisymmetric disk part of the model, we started with the simple irradiated disk model from Sicilia-Aguilar et al. (2020b), limiting the azimuthal extension of the disk. Since the Keplerian period decreases towards the star (only the part at the corotation radius moves together with the star), a disk sector winds up and evolves in shape with each rotation, which makes the line profile very variable. The temperature in the rotating Keplerian disk is achieved by irradiation, decreasing from this maximum value down as (D’Alessio et al., 1999) but, if the emitting structure is not very extended, the temperature variation is minimal and the choice of temperature structure is quite irrelevant.
The first result from these models is that the BC emission cannot originate in a magnetospheric accretion column. The main problem is that, given the inclination of the system, it produces a systematically blueshifted component due to infall, which would be visible at any time during a rotational period but is not detected. On the other hand, a Keplerian disk winding up towards the inside of the corotation radius can reproduce the basic features of the BC, as well as the messy and faster-than-rotational-period modulation. Figure 15 shows the results for the disk models. A non-axisymmetric, winding, slightly extended (5-8.4 R∗) disk is thus the simplest model that can explain the observations. This does not exclude by any means magnetospheric accretion onto the source, but suggests that the BC emission observed is produced in a hot, non-axisymmetric sector of a disk.
It is worth noting that a similar non-axisymmetric or azimuthally limited disk component was also identified in IR CO lines during the 2008 outburst (Goto et al., 2011). The CO observations revealed a rapidly-changing component at around 0.04-0.06 au, which is consistent with a structure inwards of the corotation radius (5.4-8 R∗). The non-axisymmetric disk model can also explain what is observed in the optical emission lines during the outburst, as long as the inner disk is non-axisymmetric far beyond the corotation radius. The outburst spectra revealed a variable BC in most of the lines, shifting between the blue and the red, but with lower velocities than observed here for the quiescence Ca II BC (Sicilia-Aguilar et al., 2012). Assuming that the maximum shift was due to Keplerian rotation, the estimated distance of this spiraling-in structure was 0.1-0.2au (13-26 R; Sicilia-Aguilar et al., 2012), extending well beyond Rcor. Disk emission, albeit from a complete disk, has been seen in around ZCMa NW, when the disk is heated by an accretion burst (Sicilia-Aguilar et al., 2020b). A disk scenario also naturally explains why the velocity offsets are smaller in outburst than in quiescence: In outburst, more distant parts of the disk, with lower Keplerian velocities, can be heated and produce BC emission. As the accretion rate drops, the disk cools down and the BC-emitting region of the disk moves inwards. The available data are also consistent with more energetic lines (e.g. Fe II) having larger BC velocities, again in agreement with a disk heated by irradiation, although due to the SN and the changes from period to period this is not easy to quantify.
To conclude, although there are not so evident BC in the spectra of TW Hya, inner disk rotating material is also thought to affect the photometry (Siwak et al., 2011) and thus the global structure may not be so different in both objects.
4 Discussion: Unveiling the structure of accretion columns
| Object | TESS | TESS | LCOGT | LCOGT colour | AAVSO | AAVSO colour | Lines |
|---|---|---|---|---|---|---|---|
| (2019) | (2021) | (g’/r’/i’) | (g’-r’/g’-i’/r’-i’) | (B/V/R/I) | (B-V/V-R/V-I/R-I) | ||
| EX Lupi | 0.14 | 0.17 | 0.64/0.61/0.6: | 0.7/0.65:/0.2: | 0.83-0.74/0.82-0.74/0.88-0.77/0.85-0.89 | 0.67-0.75/0.73-0.75/0.69-0.71/0.77-0.7: | 0.60 |
| TW Hya | 0.5: | – | – | – | 0.79/0.74/0.78/0.74 | 0.8/0.8/0.7:/– | 0.96a/0.94b |
We now use the information obtained from the phases and periods from the NC line velocity, the photometric magnitudes, and colour variations, to reconstruct a picture of the environment around both stars. Several structures are needed to account for the range of temperatures and variability patterns. Lines such as He II and Fe II require very hot parts of the post-shock region, while the photometric modulations can be explained by regions typically 500-2000 K hotter than the photosphere. Therefore, we have a continuum spot (or rather, feature) that affects the photometry, and a line spot where NC lines originate, which may or may not overlap. The NC-emitting regions need to be much smaller in size and/or do not produce a significant continuum, or they would rapidly increase the temperature estimated by photometry.
The photometry could also be affected by other structures, such as circumstellar extinction events, which may be also correlated with the passage of an accretion column (e.g. as in Sicilia-Aguilar et al., 2020a). Examining the colour-magnitude diagrams and lightcurves for both objects (Fig. 3), the behaviour of EX Lupi is different from extinction and in agreement with an evolving hot spot that changes in area and temperature, producing a smooth, sinusoidal lightcurve, unlike typical extinction/dipper variability. TW Hya data lay closer to the slope expected from extinction, but is not fully consistent, especially when all colours are taken into account. We also observe some parallel trends, which are redder (and brighter) in TW Hya, and bluer and fainter in EX Lupi, compared to the most populated trends. They are more evident in the redder colours (V-I and R-I) and (for EX Lupi) towards the middle of the outburst. A bluer and fainter parallel trend, observed mostly in R vs R-I, could also be produced by scattering and extinction (as in UXor variables), but since both objects switch very rapidly between these two parallel trends, so it is more likely an spot visibility effect rather than a physical change in temperature/area. Since the NC emission is visible at all times, drastic changes in spot visibility further points toward photometric modulations and NC lines arising from different locations.
In the general case of a simple, single spot, the NC lines achieve their maximum blueshifted velocity when the NC-emitting region moves into the hemisphere facing the observer, and the maximum redshifted velocity is attained as it turns into the other hemisphere. In contrast, a star is photometrically brighter when a continuum hot spot is facing us, and a cold spot would have the opposite effect. In either case, the star is bluer when it is brighter. Therefore, if the line spot and continuum feature belong to the same simple, symmetric structure (e.g. a spot formed by a hotter core surrounded by extended warm regions), we would expect the star becoming brighter approximately at a phase 0.25 after the maximum blueshift of the line velocity is observed. Occultations of the NC-emitting region by an extended column could produce a shift as well, but the lines are always observed. For systems at low inclination, it is unlikely that the spot(s) in the visible hemisphere go totally out of sight.
If, instead, the accretion structure has a hotter footprint (where the NC emission occurs) but the continuum feature is trailing this footprint or is produced a different part of the system, phase offsets are expected. If we have a combination of spots with different temperatures, or a single spot with a complex shape and/or temperature distribution, offsets between the phase at which the star is brightest vs the time when it is bluest can also occur. Finally, note that line emission can significantly affect some photometric bands if the accretion rate is large (e.g. R, see Juhász et al., 2012). Table 4 summarises the observed phase offsets that are used to track the location of the different structures. Our intention in this section is to discuss all these possible scenarios, keeping in mind their complexity.
4.1 EX Lupi: stable structures, but very variable accretion
We start with EX Lupi since it has a cleaner modulation. We observe small phase offsets between lines from different species, which were used to pinpoint the location of the line-emitting region for each species (Sicilia-Aguilar et al., 2015; Campbell-White et al., 2021), but individual species do not vary in phase significantly. Nevertheless, the photometry phase is not as stable, and the colour is phase-dependent, although the rotational period is always evident.
Figure 4 contains the phase-folded variations in magnitude and colour, as well as in He II 4686Å velocity, taking as reference MJD=54309.1147d. Phase-folding over long timescales risks introducing spurious phase offsets if the period has a small uncertainty, but the phase of the NC velocity changes by very little over the nearly 12 years of data (Campbell-White et al., 2021). The maximum NC blueshift occurs at 0.6. In contrast, there is a clear change in phase over time for the magnitudes and colours, sometimes even for data spanning only a few rotational periods. The magnitude brightness peak varies greatly, being at 0.14-0.17 for both TESS epochs, at 0.6 for the LCOGT data (which is bluest at about 0.2-0.7, mildly consistent with a simple hot spot), and 0.8 for the AAVSO data for both brightest and bluest magnitude. This means that, although the photometry alone behaves as expected from a simple, hot spot, compared to the stable velocity of the NC, the TESS data peaks about 0.55 later, the LCOGT is essentially simultaneous, and the AAVSO data have a phase offset 0.2-0.25. Therefore, only the NC and the AAVSO outburst data (which corresponds to a very large spot) are consistent with the simple, symmetric, single spot model (0.25). Therefore, we conclude that the photometric maximum is not related to the hot region that produces the NC, probably because there are less hot but more extended structures that contribute a bigger change to the photometry.
The photometry phase shift is irregular, so the relative location of the hot continuum feature and the NC region is not symmetric - nor stable over time. Since the NC-emitting region changes very little, the continuum feature is sometimes advanced, and sometimes trailing it. There is nevertheless a tendency for photometric periods to be shorter, particularly in the TESS and LCOGT photometry, which suggests that the continuum, photometry feature is typically catching up with and passing the line-emitting part and could be located slightly inwards of the corotation radius (e.g. at 8.27 R∗ or 0.98 Rcor, for a period of 7.2d instead of 7.417d, for instance). The phase changes on consecutive rotations in the AAVSO data. This can be explained if a trailing structure rapidly shrinks as the burst fades: its phase would shift towards more advanced values, as observed. In contrast, the phase is stable during the quiescence LCOGT observations, which roughly cover the same number of periods.
We thus conclude that the variations in the shape and location of the hot continuum feature that produces the photometric variability depend on the accretion rate, while the NC radial velocity signatures do not. The photometry feature may follow the accretion column at different radii, as we observe for the non-axisymmetric disk traced by the BC. The drastic phase changes, plus the visibility changes, together with its rapid changes and its large size in outburst compared to the stellar surface, also mean that the feature is not just sitting on top of the star and may extend over a hot and dense accretion column or part of the corotating inner disk, especially during outburst. Together with the location of the BC emitting material, this suggests that the region inwards of the corotation radius is more complex than anticipated. The small difference between maximum brightness and bluest colour also hints that the feature is not uniform in temperature although, as seen in Fig. 4, the colour variations are not very large due to the small temperature difference with the photosphere.
The non-axisymmetric disk inside the corotation radius, as inferred from the BC analysis, is a location where periods can be shorter than the rotational one, and a slightly advanced photometry feature may extend in this direction, even if not as far as the BC emitting region, since the photometry period is still very close to the rotational one. For clarity and reference, we have sketched the different structures resulting from this analysis in Figure 16.
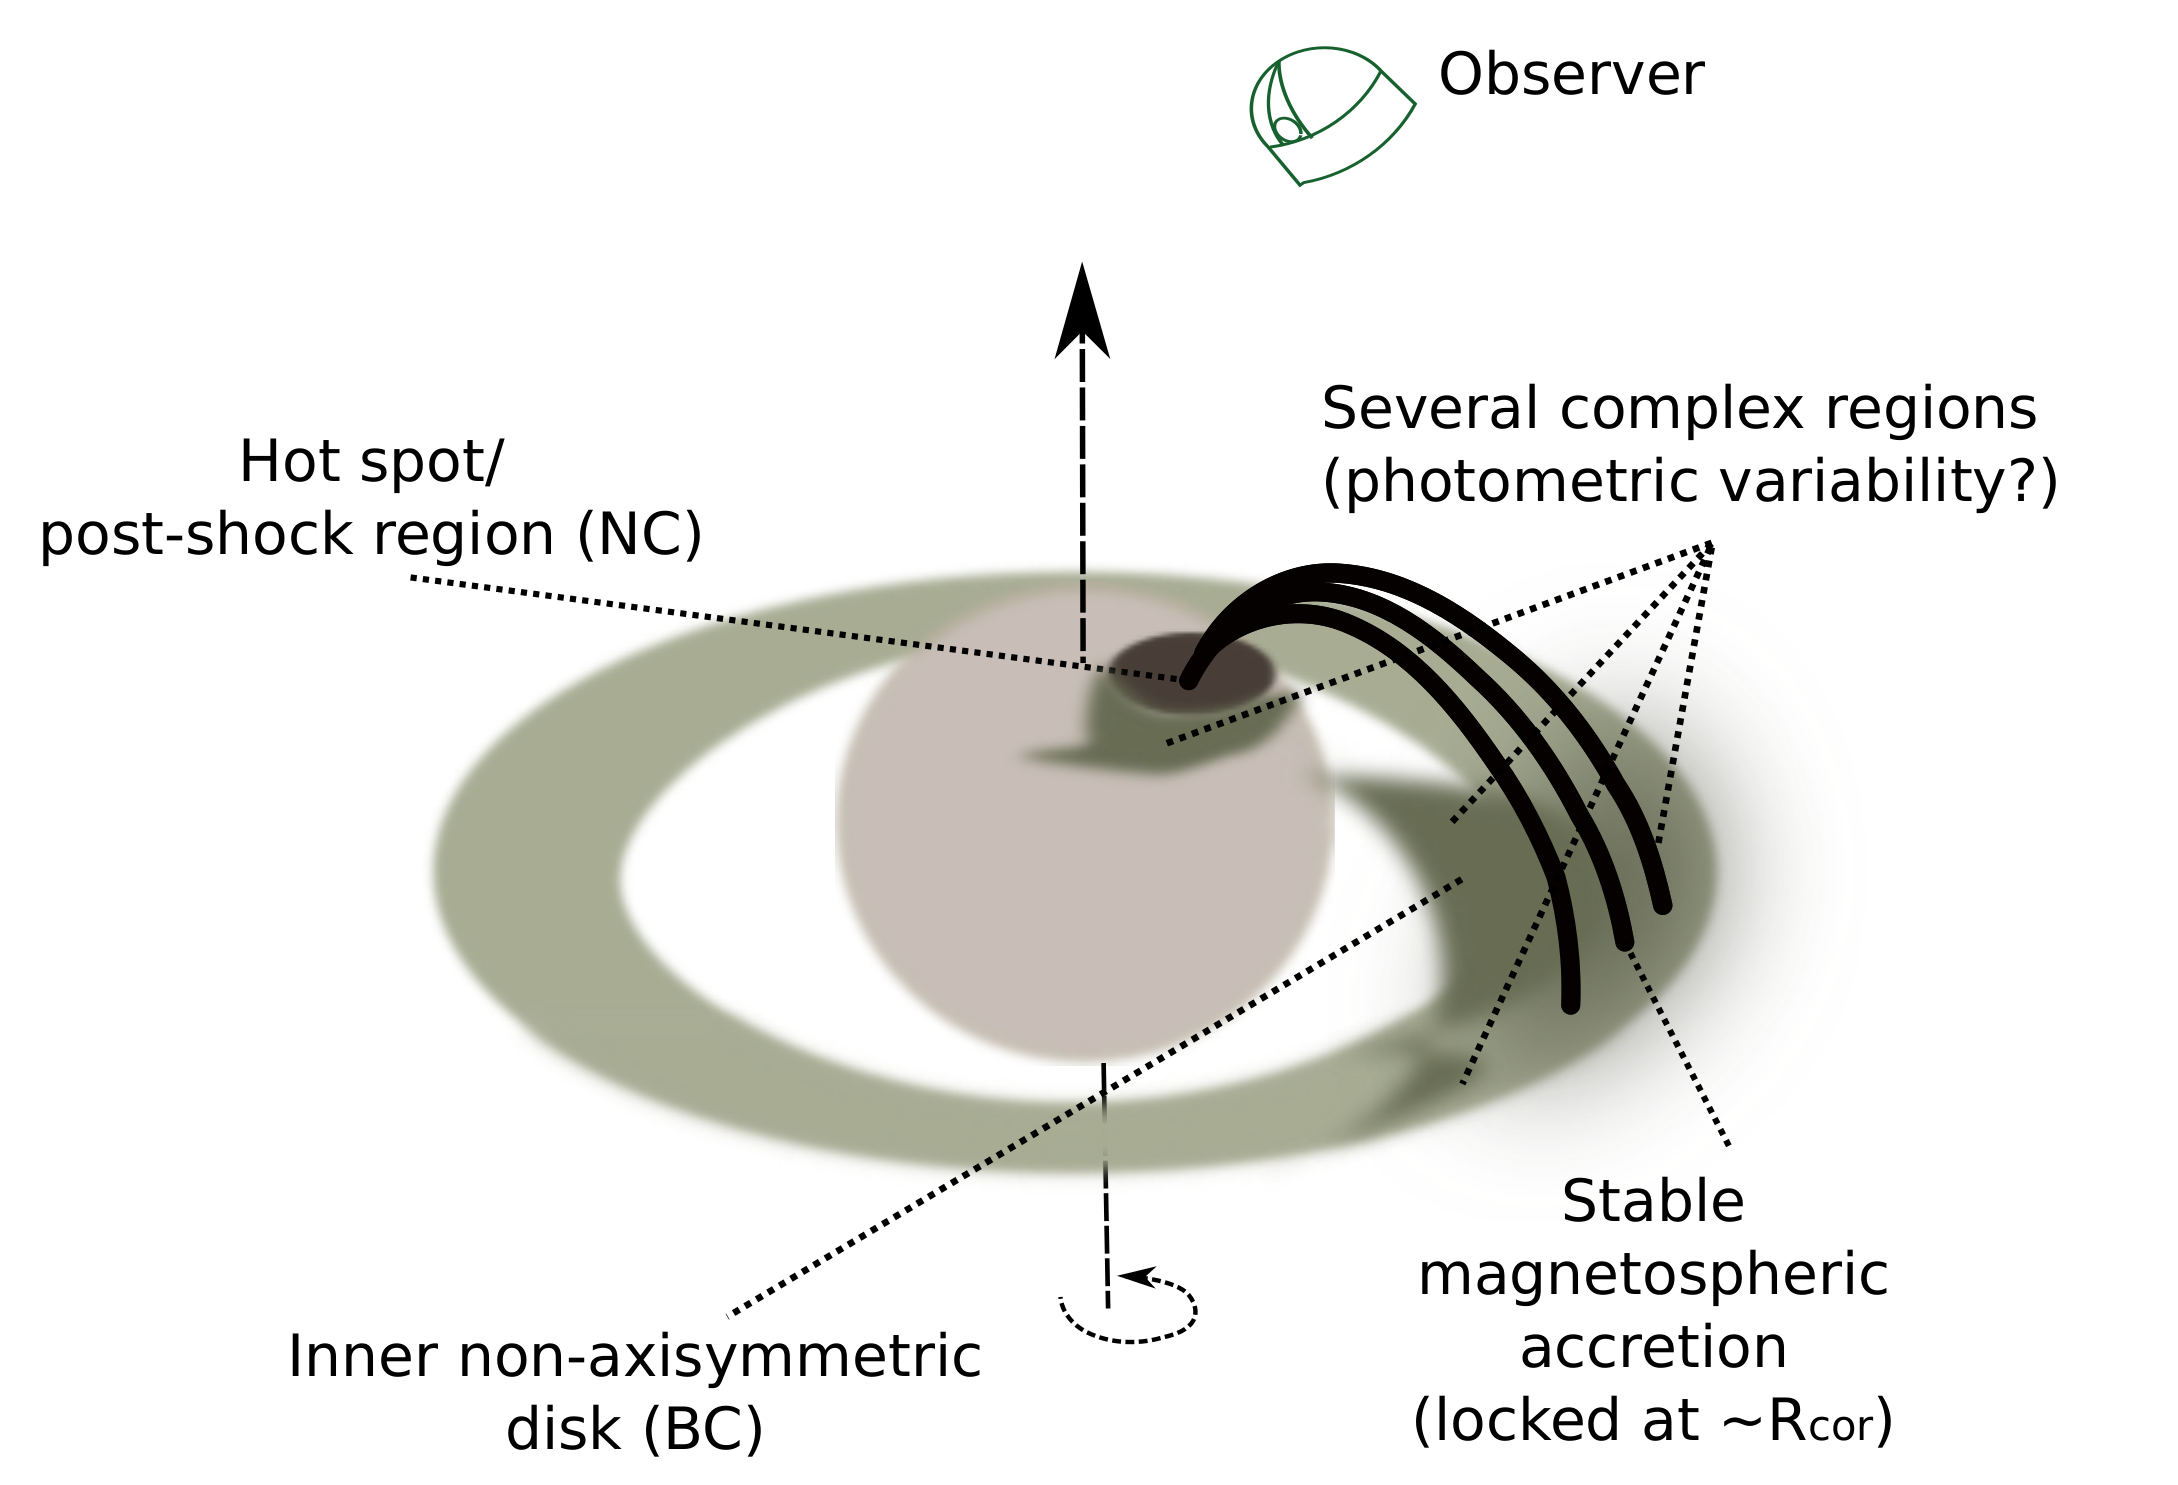
4.2 TW Hya: unstable columns for a quite stable accretion rate
For TW Hya, the simple spot analysis can be done only during the epochs when the photometric modulation is sinusoidal. In other epochs, the data reveals a much more complex structure that is not suitable for the model. Figure 5 shows the phase-folded line radial velocities, magnitudes, and colours from the various datasets. Although we can rule out that the NC-emitting region is extended or has multiple components with similar strength, this is not true for the photometry. The photometric variability for TW Hya is not only messy period-wise, but it also varies in phase: assuming a 3.556 d period, the TESS photometry maxima for 2019 and 2021 display large period-to-period variabity and some 180∘ offsets. The average NC phase for the maximum blueshift for TW Hya in strong lines, using JD=2458543.827644 d as the reference point, is around 0.95. The AAVSO photometry in the most stable epoch shows peak brightness at 0.75, which is strongly offset compared with the NC velocity for a simple spot model. The bluest color is achieved at 0.8, so, despite the mismatch with the NC velocities, the photometry feature is consistent with a simple structure dominated by a single temperature. There is also evidence of variable extinction in TW Hya on certain epochs (Siwak et al., 2014), which could make the colour interpretation harder, although the effect does not seem very large in the data we analyse here. Finally, it is worth mentioning the cold spot structure inferred from radial velocity variations and magnetic mapping (Huélamo et al., 2008; Donati et al., 2011), which adds to the complexity of the accretion structures around TW Hya.
In any case, the analysis of TW Hya reveals that its accretion structures are shape-shifting and more variable than in the case of EX Lupi and on sub-period timescales, especially regarding those responsible for photometric changes. The structure for TW Hya at any given time may not be too different from what is shown in Fig. 16, but the entire inner disk and accretion columns will be in this case by far more unstable. Since the photometric periods tend to be larger than those of the NC, the continuum features may have a tendency to extend beyond the corotation radius, rather than inwards.
4.3 Understanding the inner regions around young stars
Combining the results for TW Hya and EX Lupi, we conclude that both have remarkably stable accretion columns footprints, tracked via the NC emission lines, which remain locked to a particular location on the star for years. Although the temperature and density of the NC spot and, probably, its area, may change slightly (as suggested by the line strength), the location is essentially constant, with some variations in latitude, rather than longitude, evidenced by changes in the amplitude of the modulation.
While the region where the NC lines are produced is very stable, the continuum-producing region, albeit consistent with a hot feature, is not stable and has a complex and variable temperature, size, and shape. In EX Lupi, the rotational modulation is evident from the photometry, revealing a stable structure overall from more extended regions down to the footprint. In TW Hya, the lightcurve is very complex, while the NC line velocities are surprisingly clean for an object that is nearly pole-on. The hot continuum-emitting region is highly variable, but less sensitive to rotation, explaining why efforts to determine any rotational periodic behaviour are often problematic. This may be in part caused by the low inclination, although the variability range in TW Hya is not so different from that of EX Lupi in quiescence.
The geometry and stability of accretion structures is linked to the properties of the magnetic field (Gregory et al., 2006; Jardine et al., 2011; Ireland et al., 2022). Comparing our results with existing models, the observations are, for both objects, highly consistent with the situation expected for young stars with an inclined dipole magnetic field. The magnetic field of both objects is similar in strength: 3.5 kG for TW Hya (Lavail et al., 2019) vs 3 kG for EX Lupi (White et al., 2020), but there is a lack of contemporary information on the structure and the ratio of dipolar vs octupolar components, which, combined with the known variability of magnetic fields in young stars (Morin et al., 2010; Donati et al., 2017) precludes detailed modeling. What causes the difference in two stars so similar in mass remains thus unknown, but it may be related to the inner disk structure, and/or the magnetic field topology, which evolves with stellar age.
In general, the dipole field controls the location at which the disk is truncated, its tilt sets up the phase, and the structure of the accretion columns is regulated by the ratio between the octupolar and dipolar magnetic field components (Gregory et al., 2006, 2008). The octupolar component can break the axisymmetry of the accretion column, so that a strong octupolar component results in a small, well-localised spot (Gregory & Donati, 2011), which is similar to what is observed here. The tilt of the magnetic field with respect to the rotation axis is well-known in the case of TW Hya (Donati et al., 2011), so we expect EX Lupi to be also tilted.
The photometric rotational period tends towards shorter values for EX Lupi and longer values for TW Hya, compared to the NC period. This suggests that at least part of the continuum feature(s) are located inwards vs outwards of the corotation radius, respectively. The BC in EX Lupi originates inwards of Rcor, a further confirmation of hot material present in that region. The accretion mode and whether the accreted disk material feeds from inside or outside of the corotation radius may affect accretion stability (D’Angelo & Spruit, 2012; Ireland et al., 2022), with accretion from inwards (outwards) of the corotation radius resulting in stable (unstable) accretion. For the case of EX Lupi, accreting from inwards of the corotation radius can explain the stability of the accretion column and footprint independently of the accretion rate, while the strong accretion bursts in timescales of years may result from accumulation of material in the inner disk that is not directly accreted due to this over-regulated accretion and, eventually, triggers an instability. Accumulation of material in the inner disk that is emptied after outburst has indeed been observed (Banzatti et al., 2015), and it is worth exploring in the future. Unstable accretion columns can explain the rapid, messy, photometric variations observed in TW Hya (see also Kurosawa & Romanova, 2013, for rapid changes in unstable accretion columns). If the changes concern only the extended accretion structures, the column footprint on the stellar surface does not need to be affected, as we expect from the NC observations.
Further examining the photometric burster behaviour present in both objects, we find that the typical timescales for the irregular, minor bursts are shorter in EX Lupi than in TW Hya, despite TW Hya being a faster rotator. The timescales of these irregular bursts are a few hours, which may suggest a connection to flares or to rapid changes in the magnetic field structure. In case of TW Hya, the variations may betray the weakness of the large-scale magnetic field and changes in the octupolar component, which has been observed to produce flare-like bursts (Donati et al., 2011). Measuring the magnetic fields at the same time as the NC and photometry signatures could thus help to disentangle the many substructures in accretion columns going beyond the scales of spatially-resolved data.
5 Summary and conclusions
In this work, we examine how time-resolved spectroscopy and multi-band photometry unveil the structure of the accretion process in young stars, using EX Lupi and TW Hya as test benches.
We find that the velocity of NC lines is a better tracer of rotation in young stars than the photometry. This happens because the NC-emitting region is very stable and small, even when the photometric variability is very complex. Individual line velocities are stable and rotationally modulated even when the accretion rate changes up to outburst levels, while photometric changes are much more complex and accretion rate variations change the size, location, and temperature of continuum spot(s). The NC and photometry spot are physically different, pointing out the diversity and complexity of accretion structures around young stars.
As it had been found for EX Lupi (Sicilia-Aguilar et al., 2015; Campbell-White et al., 2021), the 3.56d rotational period of TW Hya comes out clearly in many NC line velocities, and phase-folding reveals modulation in any NC line with enough S/N, over more than a decade. The NC line analysis for TW Hya confirms that the footprints of its accretion structures are non-axisymmetric, non-polar, and very stable. Since TW Hya is viewed close to pole-on, the detection of the rotational modulation also demonstrates the capabilities of STAR-MELT to accurately measure very small radial velocities.
For both objects, the differences in the peak-to-peak velocity of the NC modulations are consistent with latitudinal distribution. The footprints of lines with different energies are different, indicating that the NC line spot, while covering a very small part of the stellar photosphere, has a complex structure with a range of temperatures and densities. Some lines such as Ca II IR have low velocity amplitude (high latitude location). Comparing lines with different energies (e.g. Ca II IR lines vs He I or Fe II lines), we find the same location trends in EX Lupi and TW Hya, suggesting a common physical cause (such as stratified structures) behind this.
The hot spots that produce the photometric changes are in contrast highly variable and spatially independent of the NC-emitting regions. The photometry is in agreement with simple hot spots, but the multi-band data reveals changes in their temperature, shape and size over time, which explain the lack of periodicity during certain epochs. In EX Lupi, we even witness how the size and temperature of the photometry/continuum spot change as the accretion rate decreases, while the NC velocity signatures remain stable. Photospheric spot sizes grow when the accretion rate increases, and the large filling factors that they achieve at high accretion rates suggest that they are not constrained to the stellar surface. This had been observed in EXor outbursts (e.g. Juhász et al., 2012; Sicilia-Aguilar et al., 2017), but we now infer it at lower rates as well.
The hot spot(s) needed to explain the photometry are not much hotter than the stellar photosphere, but much colder than the temperatures needed to raise emission in energetic lines (e.g. He I, He II, Fe II). For the continuum spot, hotter temperatures may dominate at lower accretion. Since the structure producing the photometric modulation decreases in size when the accretion rate goes down, this may also reflect the relative contribution of other regions (e.g. NC line-emitting ones) that are very small but significantly hotter, or the continuum-emitting region moving closer to the stellar surface.
The analysis of the BC of the emission lines in EX Lupi reveals that its velocity modulations can be explained as emission from a non-axisymmetric disk in Keplerian rotation, winding up around the star inwards of the corotation radius. Outer parts of this asymmetric disk (with lower orbital velocities) become visible when the accretion rate increases, as it has been also observed in the intermediate-mass star ZCMa NW (Sicilia-Aguilar et al., 2020b). The shift towards lower velocities (larger Keplerian radii) during outburst is also in agreement with this picture.
The differences in the accretion column stability between TW Hya (where accretion is more dynamic, but the accretion rate is less variable) and EX Lupi (where the accretion rate is very variable, but the accretion structures are remarkably stable) bring up the question of whether their variability is related to properties of the star or to the inner disk. The magnetic field strengths for both objects are similar (Lavail et al., 2019; White et al., 2020, but note that the topologies at the time of our investigation are unknown). The stability of accretion structures does not seem correlated with the accretion rate variability, although the differences between NC velocity and photometry periods suggest that EX Lupi’s magnetospheric accretion may feed from inwards of the corotation radius, leading to very stable accretion (Ireland et al., 2022) even if the accretion rate changes, while TW Hya would accrete from outward of the corotation radius, resulting in very dynamic extended accretion structures but with relatively stable footprints. EX Lupi has thus more stable accretion structures than TW Hya, raising questions about the type of instability that triggers the accretion outbursts. It is worth to investigate in the future whether the over-stable accretion structures in EX Lupi are indirectly responsible for the outbursts, for instance, by leading to matter accumulation in the inner disk and, eventually, outbursts. This scenario would suggest the outbursts are rather triggered by the star, and not by the disk.
Since accretion footprints are so stable and can be well-tracked by the NC line velocity allows us to investigate underlying radial velocity variations, removing the accretion and spot signatures. For the two objects examined here, there is no evidence of residual radial velocity variations caused by companions, at least at the 0.1 km/s typical uncertainty level. Nevertheless, targeted high signal-to-noise time-resolved spectra could be used to explore the presence of companions in these and other objects with similarly stable accretion. We thus conclude that determining whether stable accretion is common among young stars is a key to identify young planets in the future.
Acknowledgements
We thank the anonymous referee for their careful revision and suggestions, which contributed to clarify this paper. ASA and JCW were supported by the STFC grant number ST/S000399/1 ("The Planet-Disk Connection: Accretion, Disk Structure, and Planet Formation"). JCW is funded by the European Union under the European Union’s Horizon Europe Research & Innovation Programme 101039452 (WANDA). VR acknowledges the support of the Italian National Institute of Astrophysics (INAF) through the INAF GTO Grant ERIS & SHARK GTO data exploitation". AK and FCSM received funding from the European Research Council (ERC) under the European Union’s Horizon 2020 research and innovation programme under grant agreement No 716155 (SACCRED). This paper includes data collected by the TESS mission. Funding for the TESS mission is provided by the NASA’s Science Mission Directorate. This paper includes data collected with the TESS mission, obtained from the MAST data archive at the Space Telescope Science Institute (STScI). Funding for the TESS mission is provided by the NASA Explorer Program. STScI is operated by the Association of Universities for Research in Astronomy, Inc., under NASA contract NAS 5-26555. This work makes use of observations from the Las Cumbres Observatory global telescope network. We acknowledge with thanks the variable star observations from the AAVSO International Database contributed by observers worldwide and used in this research and, in particular, observers F.-J. Hambsch, A. Pearce, J. Pierce, L. Monard, M. Millward, and K. Menzies. We are also indebted to J. Setiawan, who took many of the available archival spectra. JD was supported by a Summer Undergraduate Bursary Fellowship by the Royal Astronomical Society in summer 2020. Based on data obtained from the ESO Science Archive Facility under requests by and . Based on observations obtained at the Canada-France-Hawaii Telescope (CFHT) which is operated by the National Research Council of Canada, the Institut National des Sciences de l´Univers of the Centre National de la Recherche Scientique of France, and the University of Hawaii. This work made use of Astropy:777http://www.astropy.org a community-developed core Python package and an ecosystem of tools and resources for astronomy (Astropy Collaboration et al., 2013, 2018).
Data Availability
All the spectral data used in this work is publicly available in the ESO Science Archive (for FEROS and HARPS data888http://archive.eso.org/scienceportal/home) and the CFHT Archive (for ESPaDOnS data999https://www.cadc-ccda.hia-iha.nrc-cnrc.gc.ca/en/cfht/). The LCOGT photometry data is already public and available from the archive 101010https://lco.global/documentation/data/archive/, and the AAVSO photometry is available via their website111111https://www.aavso.org. The Python program STAR-MELT (Campbell-White et al., 2021) is also publicly available via GitHub121212https://github.com/justyncw/STAR_MELT.
References
- Alcalá et al. (2014) Alcalá J. M., et al., 2014, A&A, 561, A2
- Alcalá et al. (2017) Alcalá J. M., et al., 2017, A&A, 600, A20
- Alencar et al. (2001) Alencar S. H. P., Johns-Krull C. M., Basri G., 2001, AJ, 122, 3335
- Alencar et al. (2012) Alencar S. H. P., et al., 2012, A&A, 541, A116
- Aspin et al. (2010) Aspin C., Reipurth B., Herczeg G. J., Capak P., 2010, ApJ, 719, L50
- Astropy Collaboration et al. (2013) Astropy Collaboration et al., 2013, A&A, 558, A33
- Astropy Collaboration et al. (2018) Astropy Collaboration et al., 2018, aj, 156, 123
- Audard et al. (2014) Audard M., et al., 2014, in Beuther H., Klessen R. S., Dullemond C. P., Henning T., eds, Protostars and Planets VI. p. 387 (arXiv:1401.3368), doi:10.2458/azu_uapress_9780816531240-ch017
- Banzatti et al. (2015) Banzatti A., Pontoppidan K. M., Bruderer S., Muzerolle J., Meyer M. R., 2015, ApJ, 798, L16
- Batalha et al. (2001) Batalha C., Lopes D. F., Batalha N. M., 2001, ApJ, 548, 377
- Beristain (2000) Beristain G., 2000, PhD Thesis, UNIVERSITY OF MASSACHUSETTS
- Beristain et al. (1998) Beristain G., Edwards S., Kwan J., 1998, ApJ, 499, 828
- Bozhinova et al. (2016) Bozhinova I., et al., 2016, MNRAS, 463, 4459
- Brasseur et al. (2019) Brasseur C. E., Phillip C., Fleming S. W., Mullally S. E., White R. L., 2019, Astrocut: Tools for creating cutouts of TESS images (ascl:1905.007)
- Brown et al. (2013) Brown T. M., et al., 2013, PASP, 125, 1031
- Campbell-White et al. (2021) Campbell-White J., Sicilia-Aguilar A., Manara C. F., Matsumura S., Fang M., Frasca A., Roccatagliata V., 2021, MNRAS, 507, 3331
- Campbell-White et al. (2023) Campbell-White J., et al., 2023, arXiv e-prints, p. arXiv:2303.03843
- Cardelli et al. (1989) Cardelli J. A., Clayton G. C., Mathis J. S., 1989, ApJ, 345, 245
- Cruz-Sáenz de Miera et al. (2023) Cruz-Sáenz de Miera F., et al., 2023, arXiv e-prints, p. arXiv:2308.02849
- D’Alessio et al. (1999) D’Alessio P., Cantó J., Hartmann L., Calvet N., Lizano S., 1999, ApJ, 511, 896
- D’Angelo & Spruit (2012) D’Angelo C. R., Spruit H. C., 2012, MNRAS, 420, 416
- Debes et al. (2023) Debes J., et al., 2023, ApJ, 948, 36
- Dodin & Lamzin (2012) Dodin A. V., Lamzin S. A., 2012, Astronomy Letters, 38, 649
- Donaldson et al. (2016) Donaldson J. K., Weinberger A. J., Gagné J., Faherty J. K., Boss A. P., Keiser S. A., 2016, ApJ, 833, 95
- Donati et al. (1997) Donati J. F., Semel M., Carter B. D., Rees D. E., Collier Cameron A., 1997, MNRAS, 291, 658
- Donati et al. (2011) Donati J. F., et al., 2011, MNRAS, 417, 472
- Donati et al. (2017) Donati J. F., et al., 2017, MNRAS, 465, 3343
- Dupree et al. (2012) Dupree A. K., et al., 2012, ApJ, 750, 73
- Espaillat et al. (2021) Espaillat C. C., Robinson C. E., Romanova M. M., Thanathibodee T., Wendeborn J., Calvet N., Reynolds M., Muzerolle J., 2021, Nature, 597, 41
- Fang et al. (2009) Fang M., van Boekel R., Wang W., Carmona A., Sicilia-Aguilar A., Henning T., 2009, Astronomy and Astrophysics, 504, 461
- Fang et al. (2014) Fang M., Sicilia-Aguilar A., Roccatagliata V., Fedele D., Henning T., Eiroa C., Müller A., 2014, A&A, 570, A118
- Feinstein et al. (2019) Feinstein A. D., et al., 2019, PASP, 131, 094502
- Fischer et al. (2022) Fischer W. J., Hillenbrand L. A., Herczeg G. J., Johnstone D., Kóspál Á., Dunham M. M., 2022, arXiv e-prints, p. arXiv:2203.11257
- Froebrich et al. (2022) Froebrich D., Eislöffel J., Stecklum B., Herbert C., Hambsch F.-J., 2022, MNRAS, 510, 2883
- Gahm et al. (2013) Gahm G. F., Stempels H. C., Walter F. M., Petrov P. P., Herczeg G. J., 2013, A&A, 560, A57
- Gaia Collaboration et al. (2016) Gaia Collaboration et al., 2016, A&A, 595, A1
- Gaia Collaboration et al. (2021) Gaia Collaboration et al., 2021, A&A, 649, A1
- Ghosh et al. (1977) Ghosh P., Lamb F. K., Pethick C. J., 1977, ApJ, 217, 578
- Goto et al. (2011) Goto M., et al., 2011, ApJ, 728, 5
- Gregory & Donati (2011) Gregory S. G., Donati J. F., 2011, Astronomische Nachrichten, 332, 1027
- Gregory et al. (2006) Gregory S. G., Jardine M., Simpson I., Donati J. F., 2006, MNRAS, 371, 999
- Gregory et al. (2008) Gregory S. G., Matt S. P., Donati J. F., Jardine M., 2008, MNRAS, 389, 1839
- Hamann (1994) Hamann F., 1994, ApJS, 93, 485
- Hamann & Persson (1992) Hamann F., Persson S. E., 1992, ApJS, 82, 247
- Hartmann et al. (1994) Hartmann L., Hewett R., Calvet N., 1994, ApJ, 426, 669
- Hartmann et al. (2016) Hartmann L., Herczeg G., Calvet N., 2016, Annual Review of Astronomy and Astrophysics, 54, 135
- Herbert et al. (2023) Herbert C., Froebrich D., Scholz A., 2023, MNRAS, 520, 5433
- Herbig (1977) Herbig G. H., 1977, ApJ, 214, 747
- Herbig (2007) Herbig G. H., 2007, AJ, 133, 2679
- Herbig (2008) Herbig G. H., 2008, AJ, 135, 637
- Herbig et al. (2001) Herbig G. H., Aspin C., Gilmore A. C., Imhoff C. L., Jones A. F., 2001, PASP, 113, 1547
- Holoien et al. (2014) Holoien T. W. S., et al., 2014, ApJ, 785, L35
- Horne & Baliunas (1986) Horne J. H., Baliunas S. L., 1986, ApJ, 302, 757
- Huang et al. (2018) Huang J., et al., 2018, ApJ, 852, 122
- Huélamo et al. (2008) Huélamo N., et al., 2008, A&A, 489, L9
- Ingleby et al. (2011) Ingleby L., et al., 2011, ApJ, 743, 105
- Ireland et al. (2022) Ireland L. G., Matt S. P., Zanni C., 2022, arXiv e-prints, p. arXiv:2203.00326
- Jardine et al. (2011) Jardine M., Donati J.-F., Arzoumanian D., Vidotto A., 2011, in Prasad Choudhary D., Strassmeier K. G., eds, Vol. 273, Physics of Sun and Star Spots. pp 242–248 (arXiv:1008.4885), doi:10.1017/S1743921311015316
- Jones (2008) Jones A. F. A. L., 2008, Central Bureau Electronic Telegrams, 1217, 1
- Joy (1945) Joy A. H., 1945, ApJ, 102, 168
- Juhász et al. (2012) Juhász A., et al., 2012, ApJ, 744, 118
- Kafka (2021) Kafka S., 2021, AAVSO, www.aavso.org,
- Kaufer et al. (1999) Kaufer A., Stahl O., Tubbesing S., Nørregaard P., Avila G., Francois P., Pasquini L., Pizzella A., 1999, The Messenger, 95, 8
- Kloppenborg (2022) Kloppenborg B. K., 2022, AAVSO, www.aavso.org,
- Kospal et al. (2008) Kospal A., Nemeth P., Abraham P., Kun M., Henden A., Jones A. F., 2008, Information Bulletin on Variable Stars, 5819, 1
- Kóspál et al. (2011) Kóspál Á., et al., 2011, ApJ, 736, 72
- Kóspál et al. (2014) Kóspál Á., et al., 2014, Astronomy and Astrophysics, 561, A61
- Kramida (2010) Kramida A., 2010, in APS Division of Atomic, Molecular and Optical Physics Meeting Abstracts. p. OPE.10
- Kurosawa & Romanova (2013) Kurosawa R., Romanova M. M., 2013, MNRAS, 431, 2673
- Lang et al. (2010) Lang D., Hogg D. W., Mierle K., Blanton M., Roweis S., 2010, AJ, 139, 1782
- Lavail et al. (2019) Lavail A., Kochukhov O., Hussain G. A. J., 2019, A&A, 630, A99
- Lehmann et al. (1995) Lehmann T., Reipurth B., Brandner W., 1995, A&A, 300, L9
- Lima et al. (2010) Lima G. H. R. A., Alencar S. H. P., Calvet N., Hartmann L., Muzerolle J., 2010, A&A, 522, A104
- Mayor et al. (2003) Mayor M., et al., 2003, The Messenger, 114, 20
- McGinnis et al. (2020) McGinnis P., Bouvier J., Gallet F., 2020, Monthly Notices of the Royal Astronomical Society, 497, 2142
- Morin et al. (2010) Morin J., Donati J. F., Petit P., Delfosse X., Forveille T., Jardine M. M., 2010, MNRAS, 407, 2269
- Moutou et al. (2015) Moutou C., Malo L., Manset N., Selliez-Vandernotte L., Desrochers M. E., 2015, in SF2A-2015: Proceedings of the Annual meeting of the French Society of Astronomy and Astrophysics. pp 201–204 (arXiv:1510.01365)
- Müller et al. (2013) Müller A., et al., 2013, A&A, 556, A3
- Muzerolle et al. (1998) Muzerolle J., Hartmann L., Calvet N., 1998, AJ, 116, 455
- Pontoppidan et al. (2008) Pontoppidan K. M., Blake G. A., van Dishoeck E. F., Smette A., Ireland M. J., Brown J., 2008, ApJ, 684, 1323
- Powell et al. (2022) Powell B. P., et al., 2022, Research Notes of the American Astronomical Society, 6, 111
- Qi et al. (2004) Qi C., et al., 2004, ApJ, 616, L11
- Ricker et al. (2015) Ricker G. R., et al., 2015, Journal of Astronomical Telescopes, Instruments, and Systems, 1, 014003
- Rucinski et al. (2008) Rucinski S. M., et al., 2008, MNRAS, 391, 1913
- Scargle (1982) Scargle J. D., 1982, ApJ, 263, 835
- Setiawan et al. (2008) Setiawan J., Henning T., Launhardt R., Müller A., Weise P., Kürster M., 2008, Nature, 451, 38
- Sicilia-Aguilar et al. (2012) Sicilia-Aguilar A., et al., 2012, A&A, 544, A93
- Sicilia-Aguilar et al. (2013) Sicilia-Aguilar A., Kim J. S., Sobolev A., Getman K., Henning T., Fang M., 2013, A&A, 559, A3
- Sicilia-Aguilar et al. (2015) Sicilia-Aguilar A., Fang M., Roccatagliata V., Collier Cameron A., Kóspál Á., Henning T., Ábrahám P., Sipos N., 2015, A&A, 580, A82
- Sicilia-Aguilar et al. (2017) Sicilia-Aguilar A., et al., 2017, Astronomy and Astrophysics, 607, A127
- Sicilia-Aguilar et al. (2020a) Sicilia-Aguilar A., Manara C. F., de Boer J., Benisty M., Pinilla P., Bouvier J., 2020a, A&A, 633, A37
- Sicilia-Aguilar et al. (2020b) Sicilia-Aguilar A., Bouvier J., Dougados C., Grankin K., Donati J. F., 2020b, A&A, 643, A29
- Sipos et al. (2009) Sipos N., Ábrahám P., Acosta-Pulido J., Juhász A., Kóspál Á., Kun M., Moór A., Setiawan J., 2009, A&A, 507, 881
- Siwak et al. (2011) Siwak M., et al., 2011, MNRAS, 410, 2725
- Siwak et al. (2014) Siwak M., et al., 2014, MNRAS, 444, 327
- Siwak et al. (2018a) Siwak M., et al., 2018a, MNRAS, 478, 758
- Siwak et al. (2018b) Siwak M., et al., 2018b, A&A, 618, A79
- VanderPlas (2018) VanderPlas J. T., 2018, ApJS, 236, 16
- Venuti et al. (2019) Venuti L., et al., 2019, A&A, 632, A46
- Weise et al. (2010) Weise P., Launhardt R., Setiawan J., Henning T., 2010, A&A, 517, A88
- White et al. (2020) White J. A., et al., 2020, ApJ, 904, 37
- Zechmeister & Kürster (2009) Zechmeister M., Kürster M., 2009, A&A, 496, 577
Appendix A Complete data tables
This appendix contains the tables listing the data and the corresponding fits used in our work. Table 5 contains a summary of the public observations used in the spectroscopy analysis. Table 6 list the dates and magnitudes for the LCOGT observations. Finally, Table 7 includes the result of fitting the different lines observed in TW Hya over different time intervals, which were used to trace the location of the accretion column footprint over time (see Section 3.2.2).
| Object | MJD | Instrument | Wavelength range |
|---|---|---|---|
| (d) | (nm) | ||
| EX Lupi | 54309.11469827 | FEROS | 353 - 922 |
| EX Lupi | 54310.15650255 | FEROS | 353 - 922 |
| EX Lupi | 54311.18745653 | FEROS | 353 - 922 |
| EX Lupi | 55053.17519784 | FEROS | 353 - 922 |
| EX Lupi | 55057.99258892 | FEROS | 353 - 922 |
| EX Lupi | 55309.39403788 | FEROS | 353 - 922 |
| TW Hya | 53460.22581782 | FEROS | 353 - 922 |
| TW Hya | 53460.25440568 | FEROS | 353 - 922 |
| TW Hya | 53461.26353177 | HARPS | 378 - 691 |
| TW Hya | 53466.07513617 | HARPS | 378 - 691 |
| TW Hya | 53495.09996845 | HARPS | 378 - 691 |
| TW Hya | 53500.06376298 | HARPS | 378 - 691 |
| Filter | MJD | Magnitude |
| (d) | (mag) | |
| g’ | 57185.987284 | 0.0560.045 |
| g’ | 57185.987896 | 0.0480.009 |
| g’ | 57187.710939 | 0.0490.052 |
| g’ | 57188.037580 | 0.0440.045 |
| r’ | 57230.825144 | -0.0940.017 |
| r’ | 57230.825602 | -0.0770.006 |
| r’ | 57230.920987 | -0.0960.019 |
| r’ | 57230.921538 | -0.1110.007 |
| i’ | 57230.827079 | -0.0980.015 |
| i’ | 57230.827569 | -0.0470.005 |
| i’ | 57230.923069 | -0.0950.016 |
| i’ | 57230.923617 | -0.0890.006 |
| u’ | 57205.872875 | -0.1730.088 |
| u’ | 57207.189643 | -0.1100.080 |
| u’ | 57230.068783 | -0.0610.103 |
| u’ | 57231.365465 | 0.0920.178 |
| Species | MJD | MJDMJDini | Offset | Amplitude | Phase | # |
|---|---|---|---|---|---|---|
| (d) | (d) | (km/s) | (km/s) | (deg) | Points | |
| FeII4924 | 55259 | 55200 - 55356 | 1.350.07 | 1.010.10 | 495 | 50 |
| FeII4924 | 57440 | 57416 - 57449 | 1.400.14 | 0.730.19 | 8515 | 41 |
| FeII5018 | 54198 | 54158 - 54310 | 2.510.09 | 0.870.13 | 918 | 59 |
| FeII5018 | 55259 | 55200 - 55356 | 1.710.07 | 0.970.10 | 546 | 60 |
| FeII5018 | 55965 | 55957 - 55972 | 1.890.07 | 0.440.10 | -11312 | 54 |
| FeII5018 | 57443 | 57435 - 57448 | 1.660.13 | 0.920.17 | 9514 | 10 |
| HeI4026 | 54195 | 54158 - 54233 | -7.650.11 | 0.470.15 | 3819 | 49 |
| HeI4026 | 55260 | 55200 - 55356 | -7.700.11 | 0.580.15 | 6915 | 46 |
| HeI4471 | 54550 | 54494 - 54657 | -1.140.08 | 0.730.11 | 429 | 62 |
| HeI4471 | 55259 | 55200 - 55356 | -1.000.07 | 0.690.10 | 388 | 60 |
| HeI4471 | 55965 | 55957 - 55972 | -0.770.11 | 0.460.17 | -7716 | 54 |
| HeI4471 | 57441 | 57417 - 57448 | -1.190.08 | 0.390.13 | 6516 | 39 |
| HeI4471 | 57909 | 57904 - 57915 | -0.230.10 | 0.430.14 | -5418 | 20 |
| HeI4713 | 54197 | 54158 - 54310 | 5.060.10 | 0.550.14 | 6514 | 61 |
| HeI4713 | 55259 | 55200 - 55356 | 3.800.09 | 0.880.12 | 408 | 60 |
| HeI4713 | 55965 | 55957 - 55972 | 4.580.12 | 0.410.19 | -6722 | 52 |
| HeI4713 | 57440 | 57416 - 57449 | 3.730.12 | 0.550.17 | 1917 | 45 |
| HeI4922 | 54197 | 54158 - 54310 | 5.080.04 | 0.160.06 | 11521 | 65 |
| HeI4922 | 54551 | 54494 - 54657 | 4.950.04 | 0.240.05 | -6413 | 67 |
| HeI4922 | 55259 | 55200 - 55356 | 4.720.04 | 0.230.06 | 7414 | 59 |
| HeI4922 | 57441 | 57416 - 57449 | 4.720.05 | 0.400.07 | -1110 | 59 |
| HeI5016 | 54197 | 54158 - 54310 | 1.890.04 | 0.290.05 | 7410 | 64 |
| HeI5016 | 54551 | 54494 - 54657 | 1.790.03 | 0.260.04 | 938 | 67 |
| HeI5016 | 55259 | 55200 - 55356 | 2.000.03 | 0.580.04 | 444 | 60 |
| HeI5016 | 57441 | 57416 - 57449 | 1.510.03 | 0.480.04 | 425 | 60 |
| HeI5875 | 54551 | 54494 - 54657 | 7.060.05 | 0.420.07 | 2910 | 67 |
| HeI5875 | 55259 | 55200 - 55356 | 7.420.05 | 0.510.07 | 498 | 60 |
| HeI5875 | 55965 | 55957 - 55972 | 7.350.04 | 0.250.06 | -81211 | 56 |
| HeI5875 | 57441 | 57416 - 57449 | 6.650.05 | 0.600.06 | 736 | 60 |
| HeI6678 | 55259 | 55200 - 55356 | 6.700.06 | 0.730.09 | 457 | 60 |
| HeI6678 | 57441 | 57416 - 57449 | 7.140.07 | 1.020.10 | 625 | 60 |
| HeII4686 | 54548 | 54494 - 54657 | 5.970.12 | 1.180.15 | 578 | 50 |
| HeII4686 | 55253 | 55200 - 55354 | 7.740.18 | 0.640.24 | 2821 | 22 |
| HeII4686 | 57910 | 57904 - 57915 | 5.080.18 | 0.700.22 | -1725 | 18 |
| CaII3934 | 55257 | 55250 - 55263 | 1.150.04 | 0.310.05 | 4710 | 51 |
| CaII3934 | 55965 | 55957 - 55972 | 1.030.03 | 0.150.04 | -16320 | 56 |
| CaII3934 | 57441 | 57416 - 57449 | 0.860.05 | 0.310.07 | 8313 | 54 |
| CaII8498 | 54197 | 54158 - 54310 | 0.380.02 | 0.190.03 | 1089 | 64 |
| CaII8498 | 54551 | 54494 - 54657 | 0.270.02 | 0.170.03 | -629 | 67 |
| CaII8498 | 55259 | 55200 - 55356 | 0.200.03 | 0.170.04 | 10914 | 60 |
| CaII8498 | 55965 | 55957 - 55972 | 0.130.01 | 0.090.02 | 1512 | 56 |
| CaII8498 | 56705 | 56636 - 56808 | 0.120.03 | 0.250.04 | -3610 | 70 |
| CaII8498 | 57441 | 57416 - 57449 | 0.170.02 | 0.130.03 | -1211 | 60 |
| CaII8542 | 54548 | 54540 - 54553 | 1.210.02 | 0.080.03 | 20520 | 52 |
| CaII8542 | 55257 | 55250 - 55263 | 1.130.01 | 0.170.02 | 776 | 52 |
| CaII8542 | 55965 | 55957 - 55972 | 1.300.02 | 0.120.02 | 17812 | 56 |
| CaII8542 | 56702 | 56693 - 56710 | 1.200.02 | 0.100.03 | 22214 | 64 |
| CaII8662 | 54196 | 54158 - 54310 | 1.690.03 | 0.180.04 | 6212 | 63 |
| CaII8662 | 54551 | 54494 - 54657 | 1.630.02 | 0.120.03 | -7213 | 66 |
| CaII8662 | 55259 | 55200 - 55356 | 1.570.02 | 0.170.03 | 6511 | 60 |
| CaII8662 | 57441 | 57416 - 57449 | 1.560.02 | 0.130.02 | 10111 | 60 |
Appendix B Supplementary figures for the spot models
In this appendix, we display the parameter space covered in the simple spot models, to highlight the best-fitting models and the area subtended by low values of the . Figure 17 shows the results. As discussed in the text, although there is some degree of degeneracy, the best models for all hot spot cases are very well-defined. For EX Lupi, results such as the decrease in size of the hot spot as the outburst fades are extremely robust. The change of temperature, albeit somewhat less constrained, also agrees with the increase in temperature towards the end of the outburst.
EX Lupi
Quiescence (hot)
Quiescence (cold)
Outburst, JD 2459661
Outburst, JD 2459675
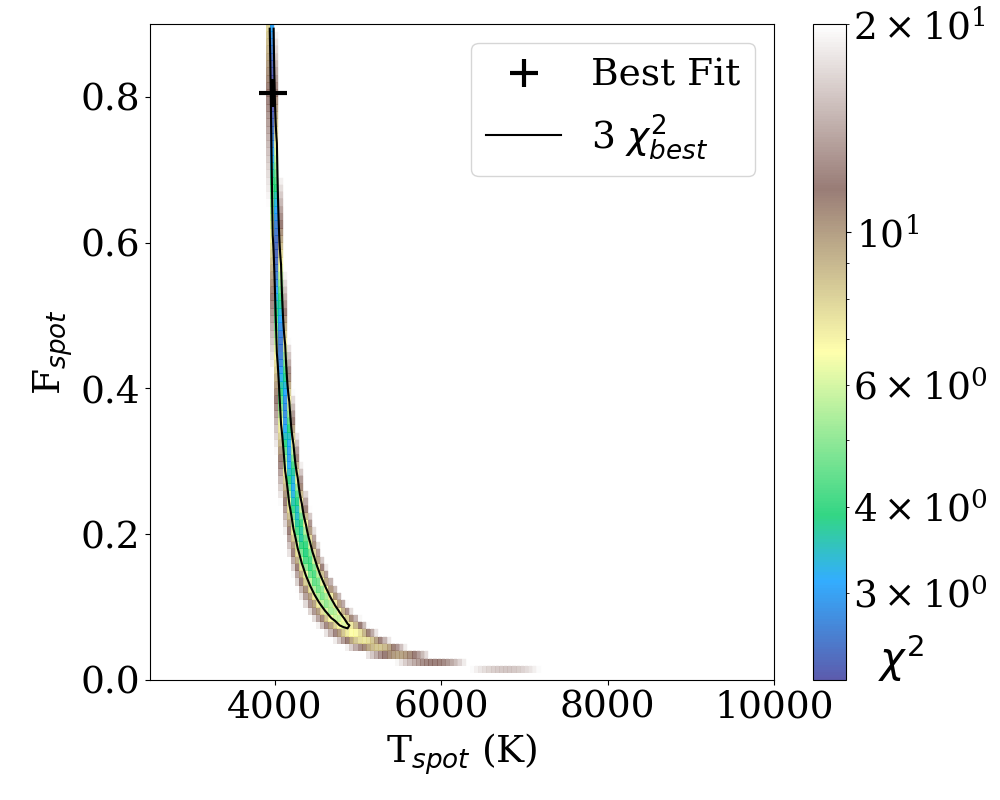


 Outburst, JD 2459688
Outburst, JD 24597041
Outburst, JD 2459716
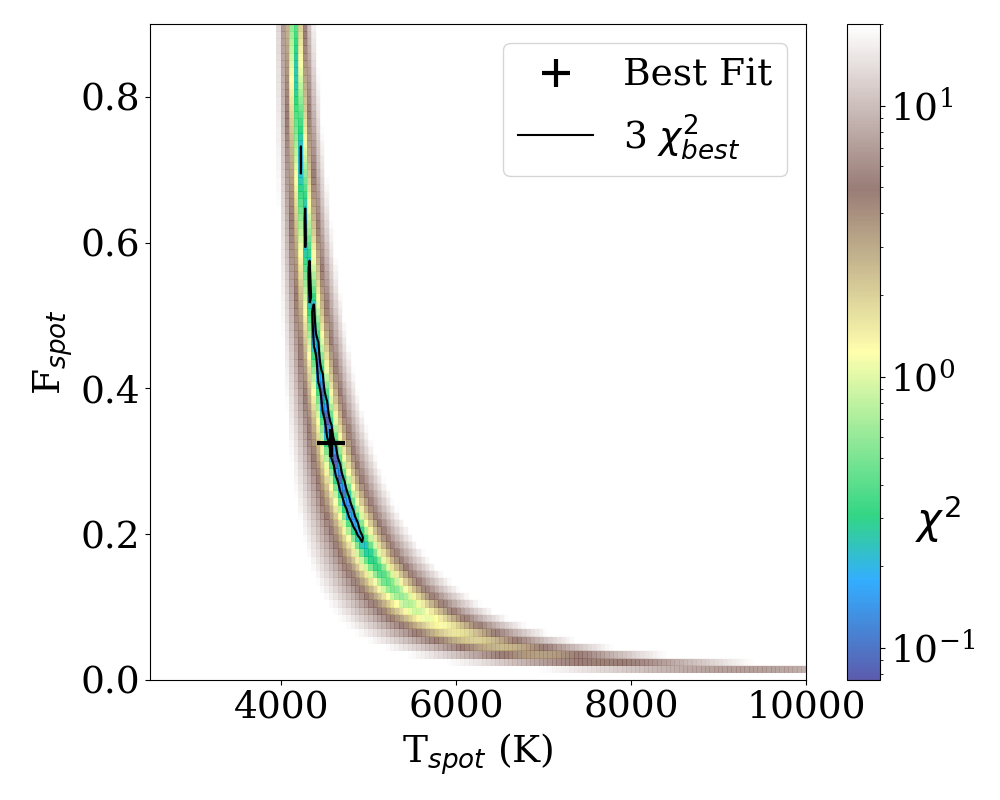
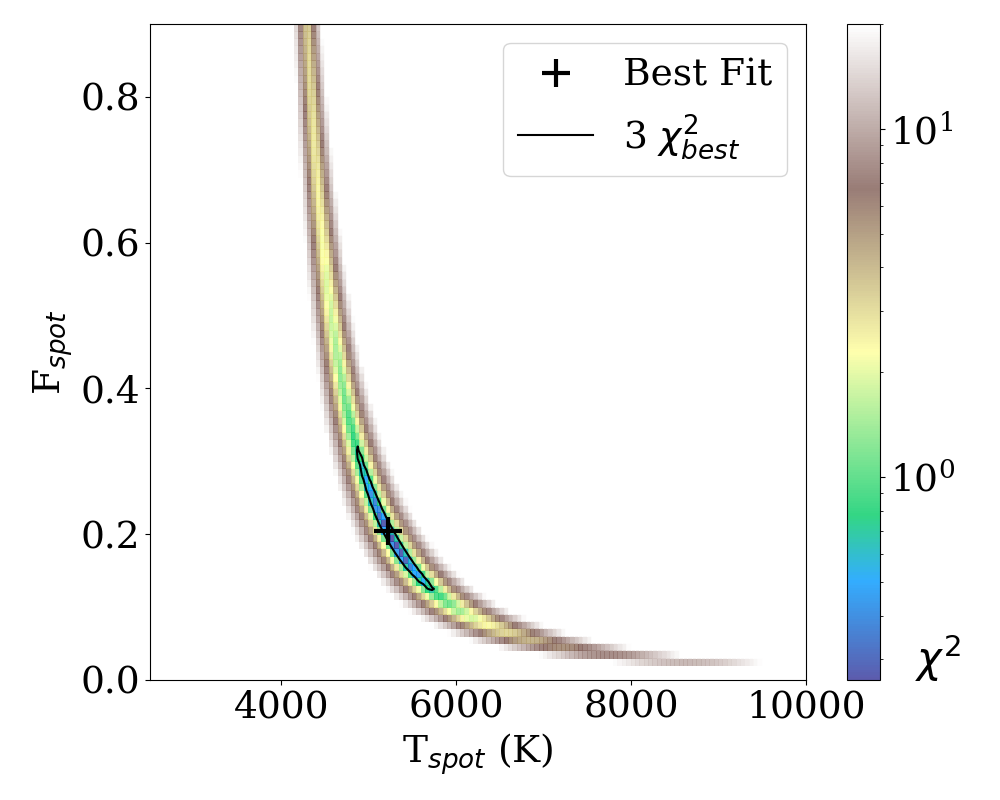
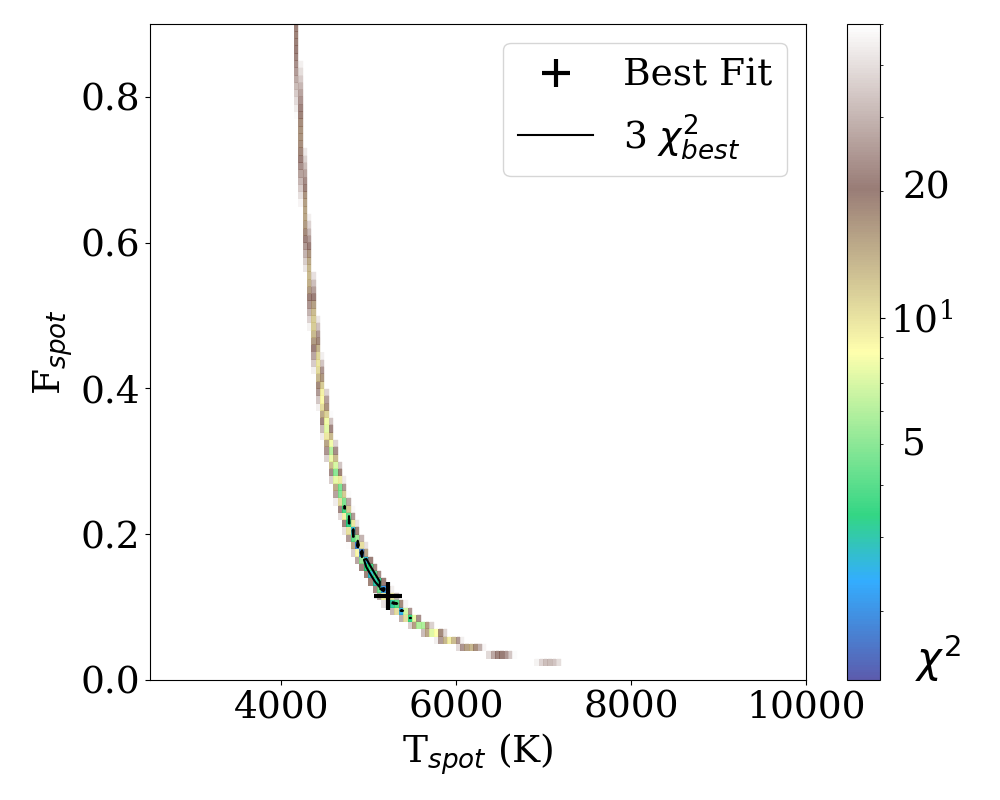
TW Hya
| Full Dataset | JD 2459657 | JD 2459674 |
|---|---|---|
 |
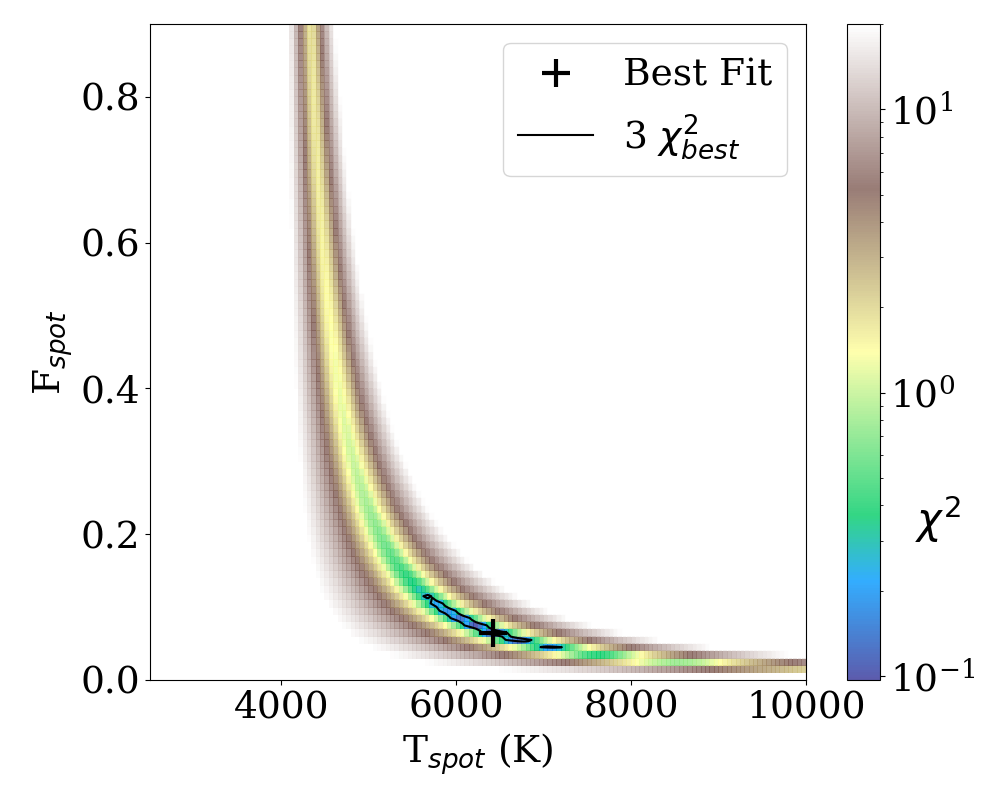 |
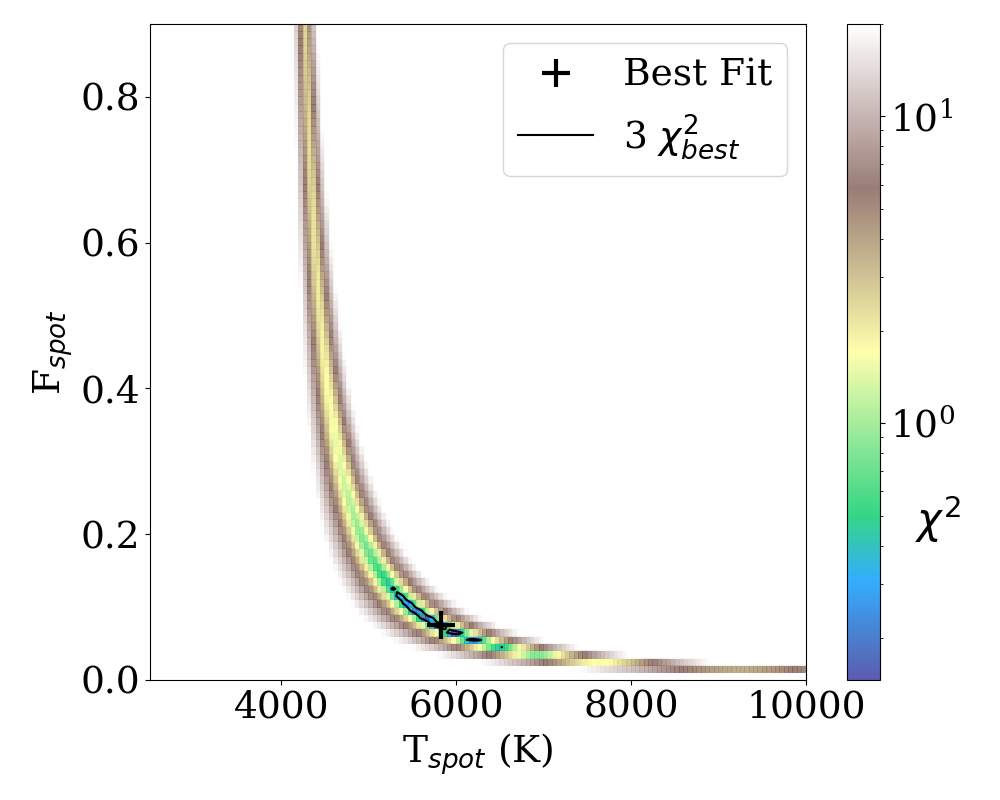 |